Embed Size (px)
Citation preview
Roads in the Fork:Railroads 2019 & Beyond
abh consultingRAC
Ottawa!September, 2019

Canadian Railroads Capital Spending and ROI
10
14%
15%
16%
$0.0
$0.5
$1.0
$1.5
$2.0
'16 '17 '18
CN
CPWt. Avg. ROI (Right Scale)
Source: Company Reports
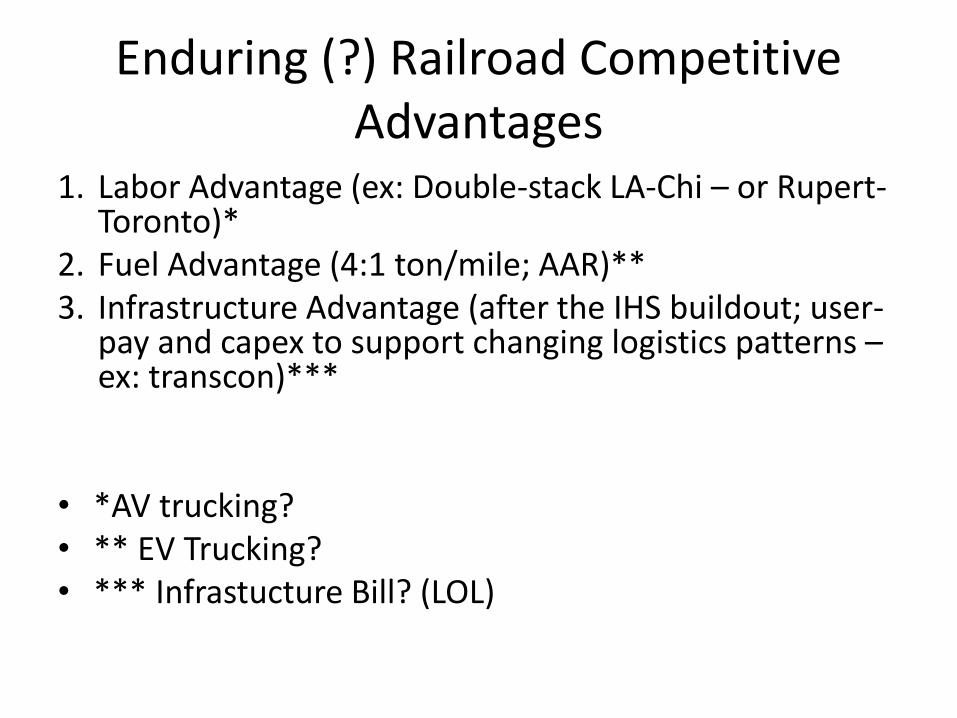
Enduring (?) Railroad Competitive Advantages
1. Labor Advantage (ex: Double-stack LA-Chi – or Rupert-Toronto)*
2. Fuel Advantage (4:1 ton/mile; AAR)**3. Infrastructure Advantage (after the IHS buildout; user-
pay and capex to support changing logistics patterns –ex: transcon)***
• *AV trucking?• ** EV Trucking?• *** Infrastucture Bill? (LOL)
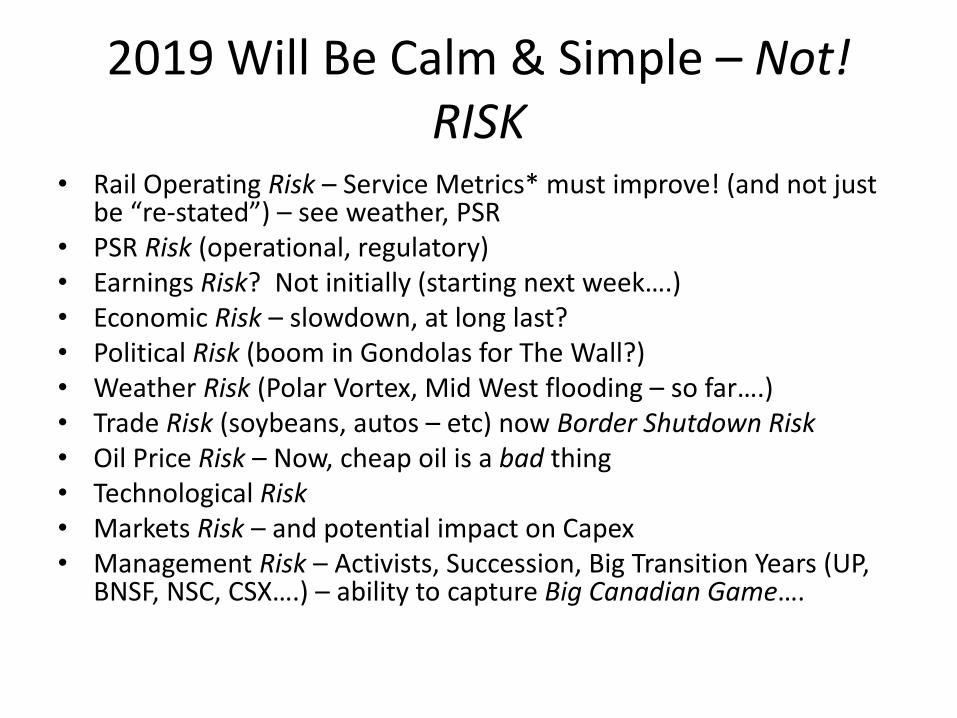
2019 Will Be Calm & Simple – Not!RISK
• Rail Operating Risk – Service Metrics* must improve! (and not just be “re-stated”) – see weather, PSR
• PSR Risk (operational, regulatory)• Earnings Risk? Not initially (starting next week….)• Economic Risk – slowdown, at long last?• Political Risk (boom in Gondolas for The Wall?)• Weather Risk (Polar Vortex, Mid West flooding – so far….)• Trade Risk (soybeans, autos – etc) now Border Shutdown Risk• Oil Price Risk – Now, cheap oil is a bad thing• Technological Risk• Markets Risk – and potential impact on Capex• Management Risk – Activists, Succession, Big Transition Years (UP,
BNSF, NSC, CSX….) – ability to capture Big Canadian Game….
Earnings Risk?Reiteration (Q1) vs. Capitulation (Q2)
• CSX spooked the markets (reported “near-miss” & simply stating the obvious about YTD volumes – which are reported weekly!)
• UNP (and KSU) restored sanity (but what happened to “Service begets Growth”?!?)
• CP’s excellent quarter was forgotten; CNI showed that Canada is the future (“We the North!”)
• NSC reported a “miss” but Top21 is “flawless” so far….• Scorecard so far: 4-3; Q2/19 rail earnings of high single
digit range will compare nicely, once again, to the loss by S&P500
• Remember Rails’ historic “outperformance” in a recession
But Volumes are ScaryWhat’s the cause (beyond “tough comparisons”)? How
to allocate into the 5 buckets?1. Economic Slowdown – in USA/Mexico (only?)2. Continued Trade Distortions and Market losses
(from soybeans to electronics)3. Lingering weather impacts on operations (and
on crops!)4. PSR – inadvertent or planned share loss (ex. CSX
IM)5. Trucking overcapcity (what a difference a year
makes!) – Investors are questioning the very nature of the IM Value Propisition!
Renaissance 2?• New Operating Plans!! PSR vs Other? PSR vs PHH?• Intermodal? Opportunity or Missed Opportunity?• Merchandise: Plastics? Housing? Perishables? ?
Infrastructure? (??) • Paper! Cardboard! Boxcars!• CBR back from the dead? For how long??• Sand back to the dead?• Trade?? 42% US RR units (in 2014….)• IT spend? Versus….• IT Threat? (AV/Tesla/Amazon/etc)?• Capex vs. FCF in the era of the Activist?• New “Golden Age” of/for Short Lines!
Boom in Short Line Valuations
• Infrastucture Funds - low cost of capital and long term (moderate) return expectationbs
• One major SLHC is going private– deal at ~14X – up from 7-9X!- they had perhaps outgrown ability to remain publicly-traded (difficulties of the small deal)
• CSX Lines….?• Demand creating supply – sellers’ market!
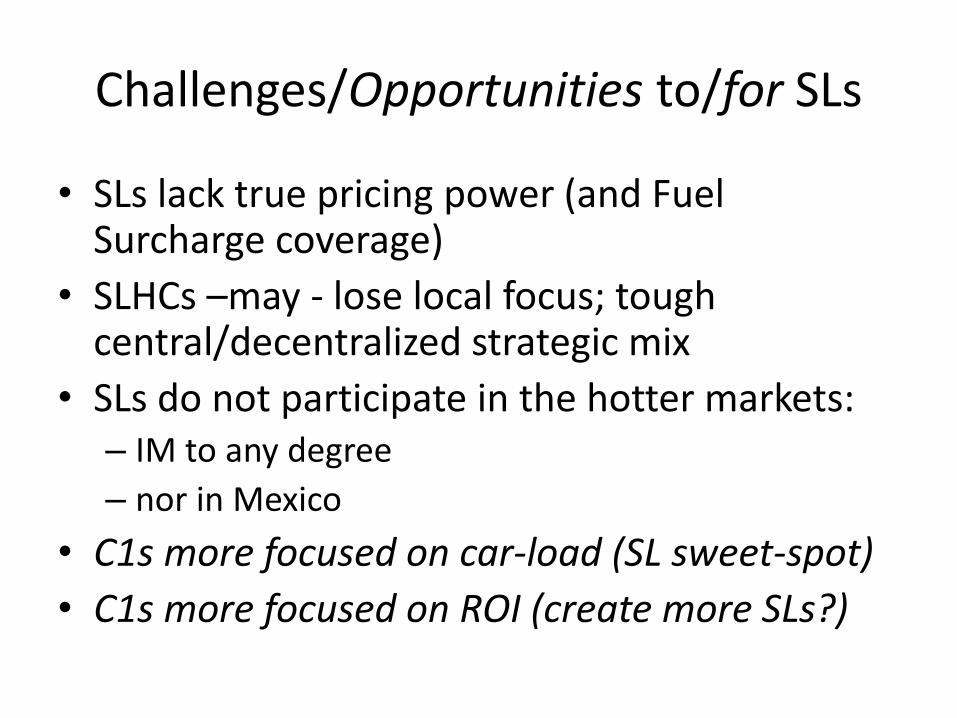
Challenges/Opportunities to/for SLs
• SLs lack true pricing power (and Fuel Surcharge coverage)
• SLHCs –may - lose local focus; tough central/decentralized strategic mix
• SLs do not participate in the hotter markets: – IM to any degree – nor in Mexico
• C1s more focused on car-load (SL sweet-spot)• C1s more focused on ROI (create more SLs?)
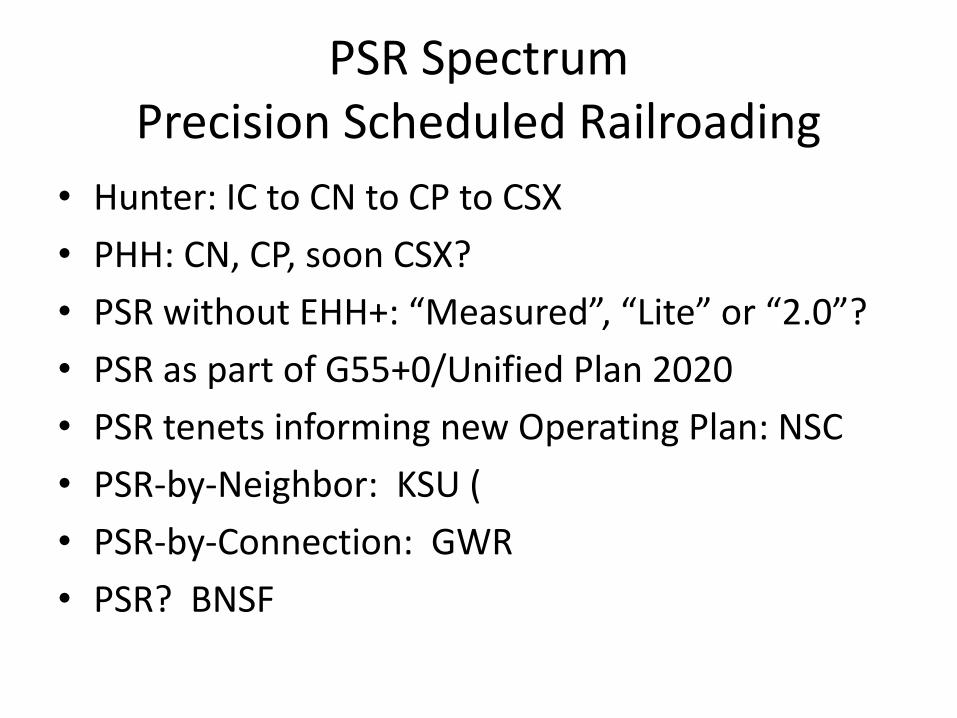
PSR SpectrumPrecision Scheduled Railroading
• Hunter: IC to CN to CP to CSX• PHH: CN, CP, soon CSX?• PSR without EHH+: “Measured”, “Lite” or “2.0”?• PSR as part of G55+0/Unified Plan 2020• PSR tenets informing new Operating Plan: NSC• PSR-by-Neighbor: KSU (• PSR-by-Connection: GWR• PSR? BNSF
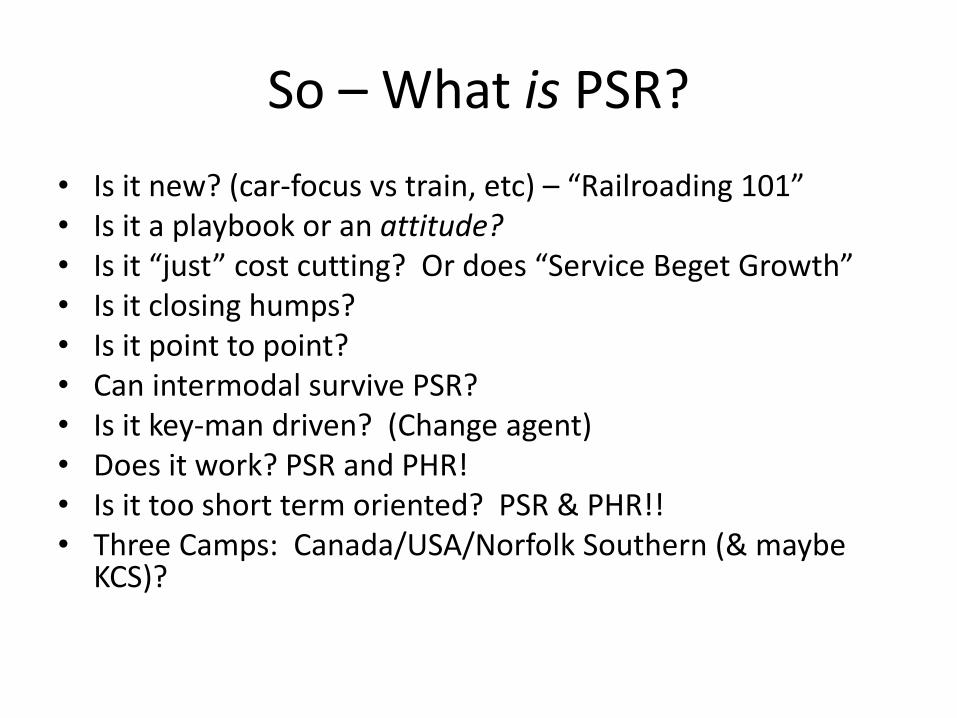
So – What is PSR?• Is it new? (car-focus vs train, etc) – “Railroading 101”• Is it a playbook or an attitude? • Is it “just” cost cutting? Or does “Service Beget Growth”• Is it closing humps?• Is it point to point?• Can intermodal survive PSR?• Is it key-man driven? (Change agent)• Does it work? PSR and PHR!• Is it too short term oriented? PSR & PHR!!• Three Camps: Canada/USA/Norfolk Southern (& maybe
KCS)?
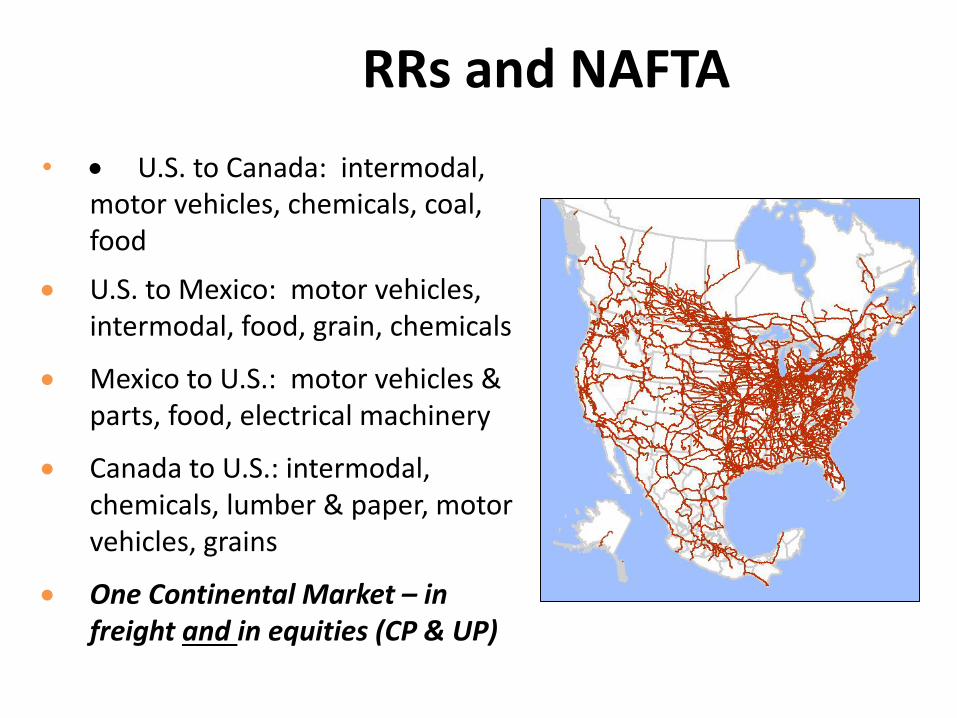
RRs and NAFTA• • U.S. to Canada: intermodal,
motor vehicles, chemicals, coal, food
• U.S. to Mexico: motor vehicles, intermodal, food, grain, chemicals
• Mexico to U.S.: motor vehicles & parts, food, electrical machinery
• Canada to U.S.: intermodal, chemicals, lumber & paper, motor vehicles, grains
• One Continental Market – in freight and in equities (CP & UP)
ASSOCIATION OF AMERICAN RAILROADSSLIDE 12
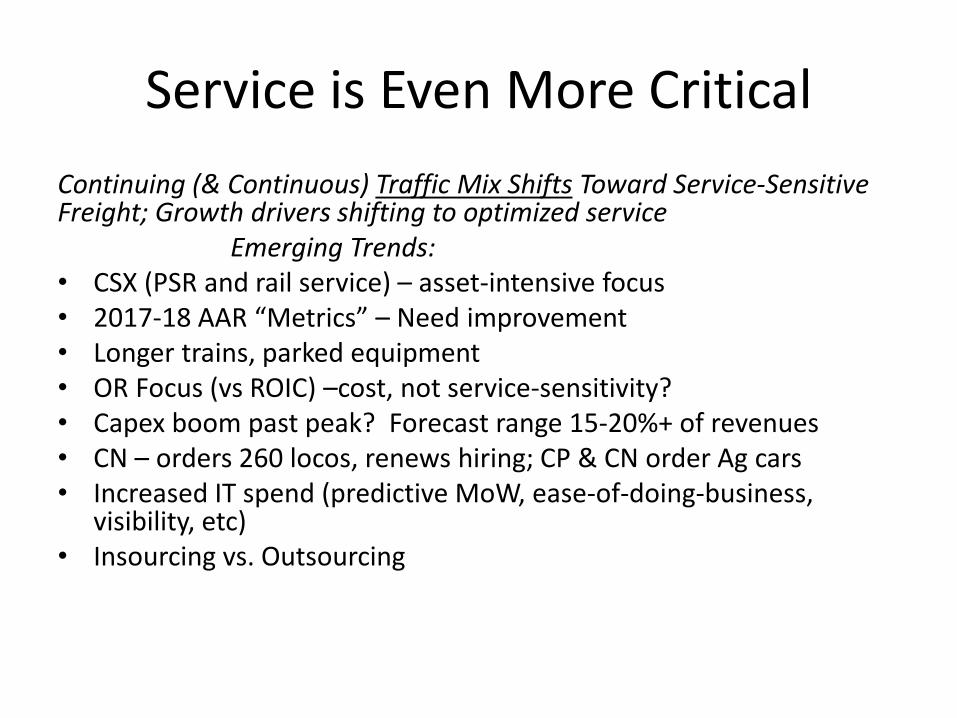
Service is Even More CriticalContinuing (& Continuous) Traffic Mix Shifts Toward Service-Sensitive Freight; Growth drivers shifting to optimized service
Emerging Trends:• CSX (PSR and rail service) – asset-intensive focus• 2017-18 AAR “Metrics” – Need improvement • Longer trains, parked equipment• OR Focus (vs ROIC) –cost, not service-sensitivity?• Capex boom past peak? Forecast range 15-20%+ of revenues• CN – orders 260 locos, renews hiring; CP & CN order Ag cars• Increased IT spend (predictive MoW, ease-of-doing-business,
visibility, etc)• Insourcing vs. Outsourcing
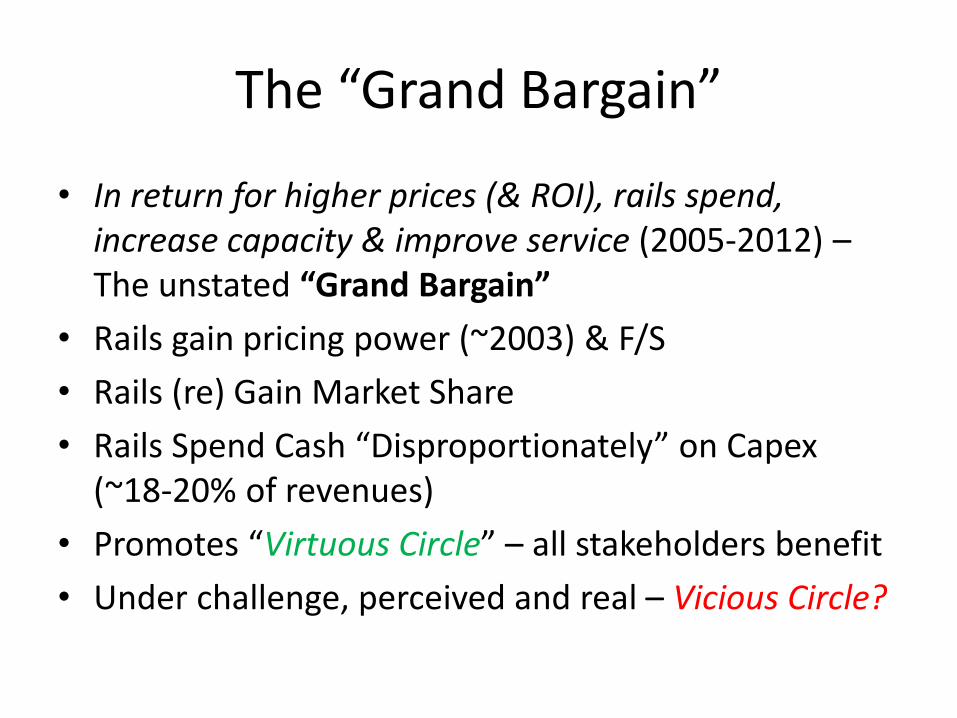
The “Grand Bargain”
• In return for higher prices (& ROI), rails spend, increase capacity & improve service (2005-2012) –The unstated “Grand Bargain”
• Rails gain pricing power (~2003) & F/S• Rails (re) Gain Market Share• Rails Spend Cash “Disproportionately” on Capex
(~18-20% of revenues)• Promotes “Virtuous Circle” – all stakeholders benefit• Under challenge, perceived and real – Vicious Circle?
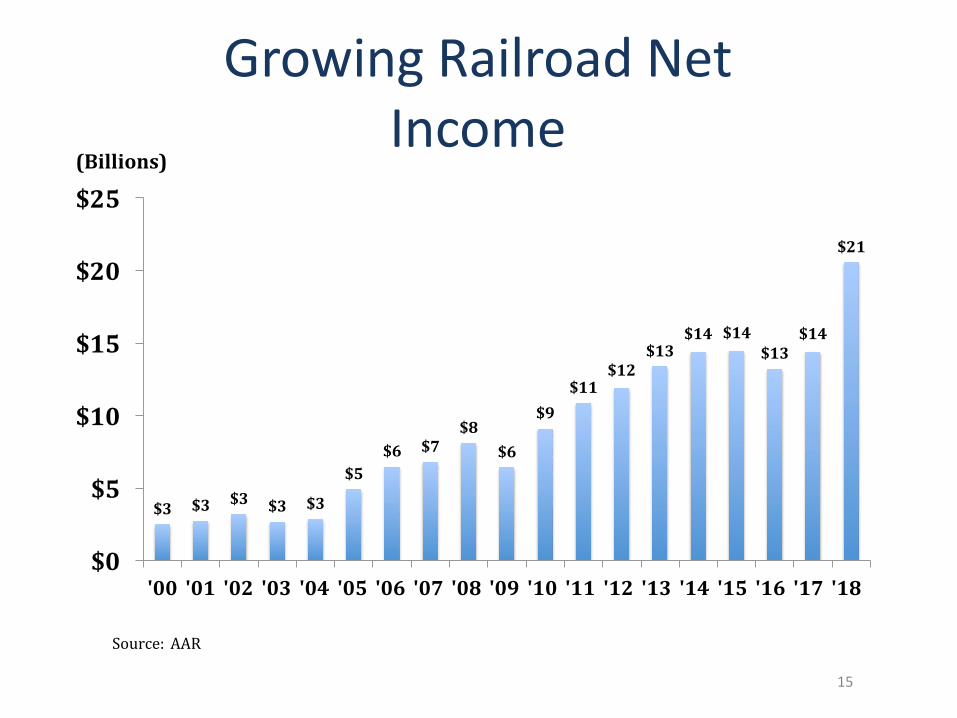
Growing Railroad NetIncome
$3
Source: AAR
15
$3 $3 $3 $3
$5$6 $7
$8$6
$9
$12$11
$14 $14 $14$13 $13
$21
$5
$10
$15
$20
$0'00 '01 '02 '03 '04 '05 '06 '07 '08 '09 '10 '11 '12 '13 '14 '15 '16 '17 '18
(Billions)
$25
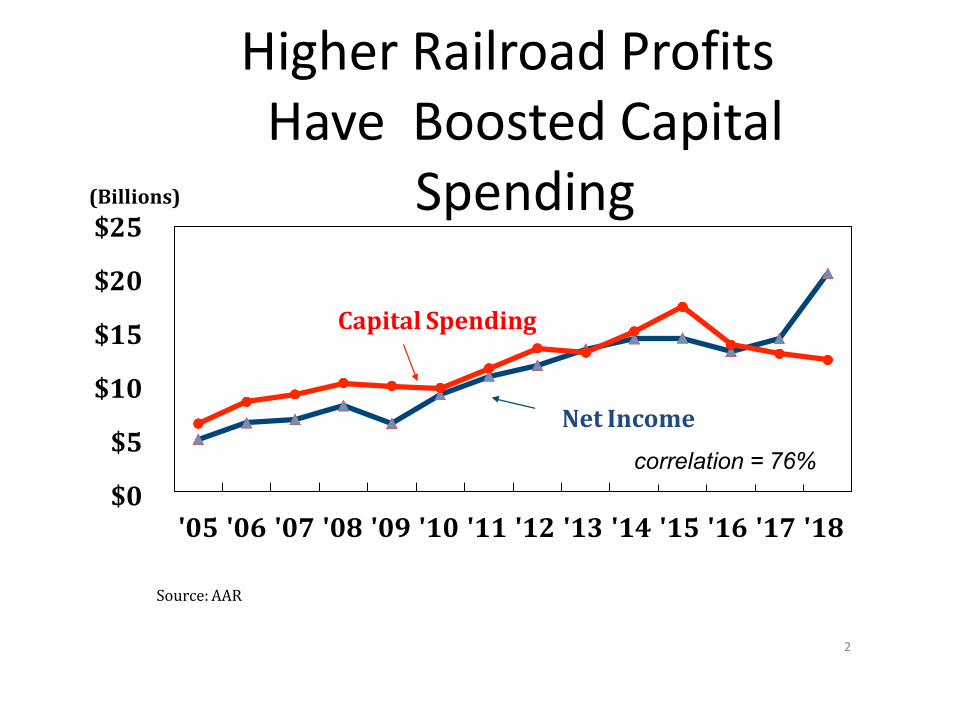
Higher Railroad Profits Have Boosted Capital
Spending
'05 '06 '07 '08 '09 '10 '11 '12 '13 '14 '15 '16 '17 '18
$25
$20
$15
$10
$5
$0
Capital Spending
Source: AAR
Net Incomecorrelation = 76%
(Billions)
2
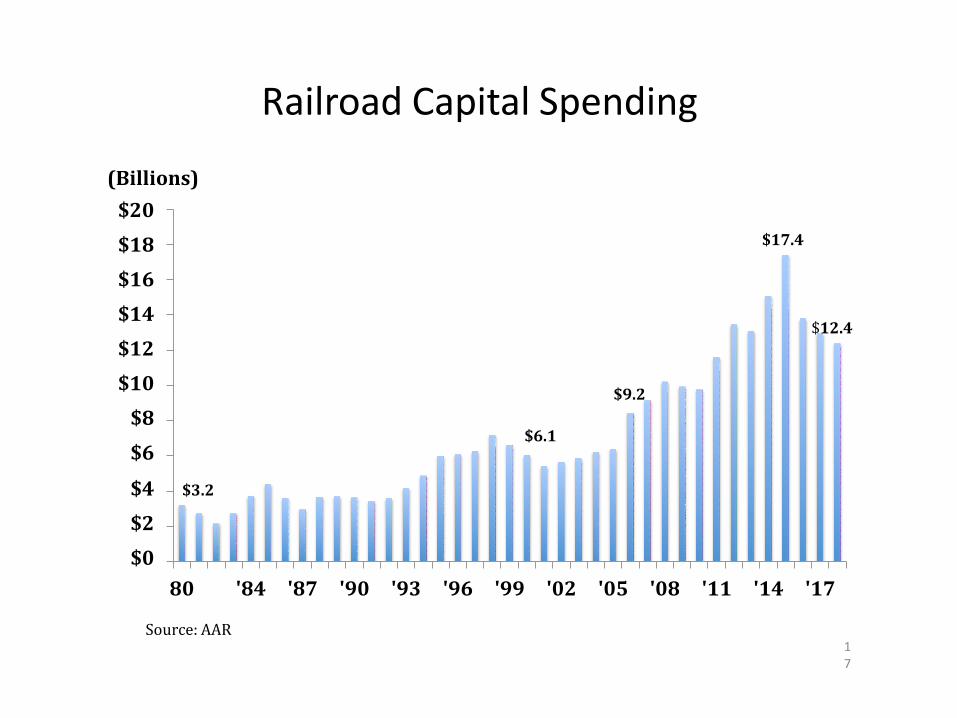
Railroad Capital Spending
$9.2
17
$17.4
$12.4
(Billions)$20$18$16$14$12$10
$8$6
$4 $3.2
$2$0
$6.1
80 '84 '87 '90 '93 '96 '99 '02 '05 '08 '11 '14 '17
Source: AAR
17
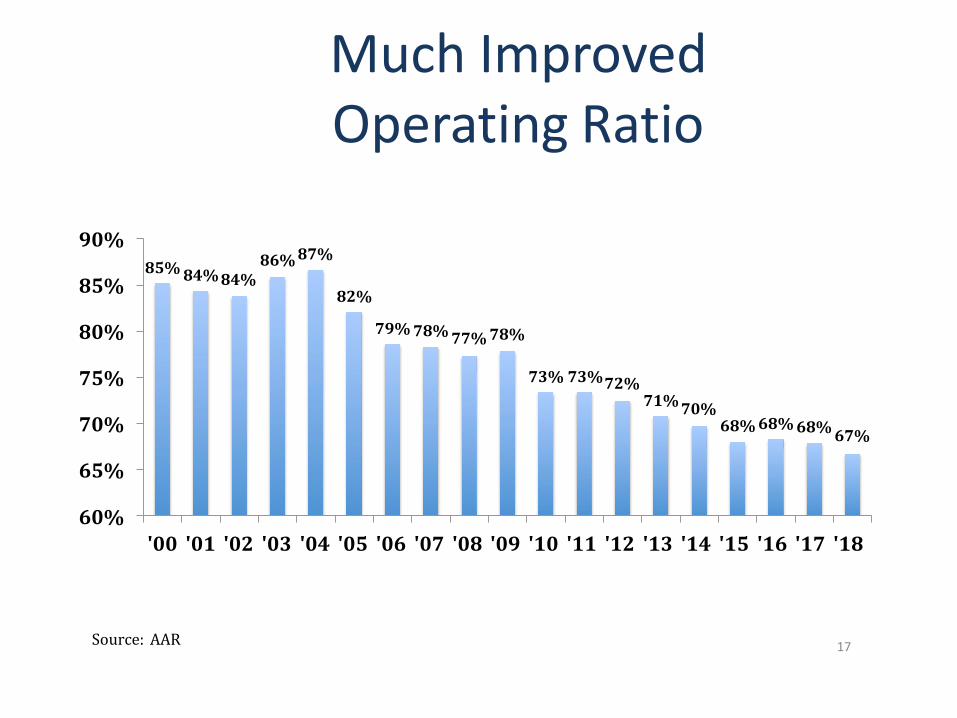
Much Improved Operating Ratio
85% 84% 84%86% 87%
82%
79% 78% 77% 78%
73% 73%72%71% 70%
68% 68% 68% 67%70%
75%
80%
85%
90%
65%
60%'00 '01 '02 '03 '04 '05 '06 '07 '08 '09 '10 '11 '12 '13 '14 '15 '16 '17 '18
Source: AAR
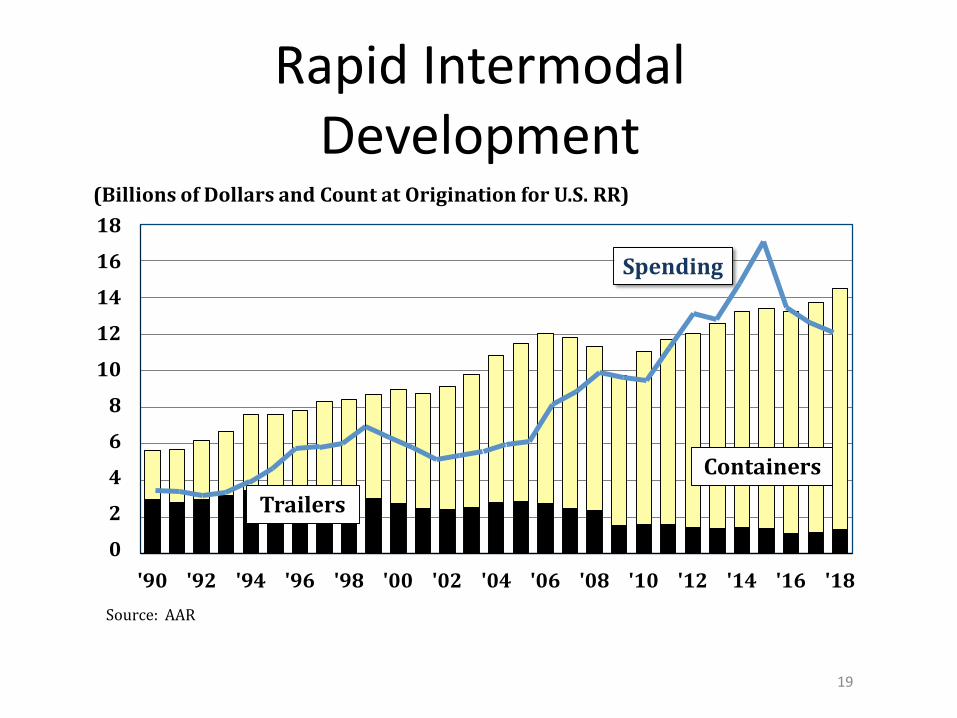
Rapid IntermodalDevelopment
18
16
14
12
10
8
6
4
2
0'90 '92
Source: AAR
'94 '96 '98 '00 '02 '04 '06 '08 '10 '12 '14 '16 '18
ContainersTrailers
Spending
(Billions of Dollars and Count at Origination for U.S. RR)
19
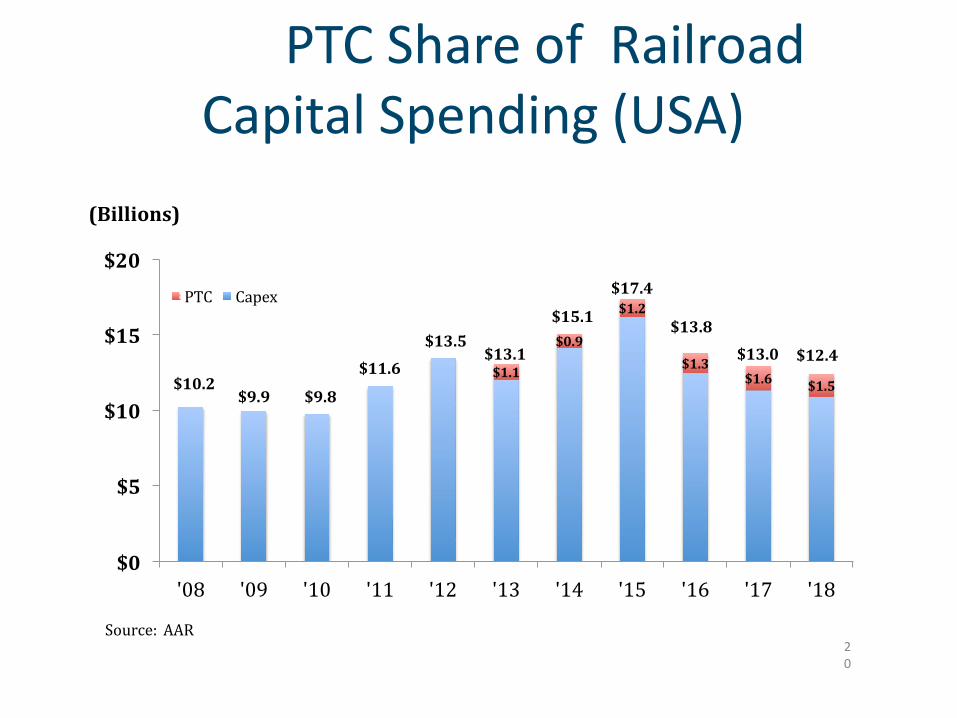
PTC Share of Railroad Capital Spending (USA)
$11.6$13.5
$13.1
$15.1
$17.4
$13.8$13.0 $12.4
$1.1
$0.9
$1.2
$1.3$1.6 $1.5
$10
$15
(Billions)
$20
$5
$0'08 '09 '10 '11 '12 '13 '14 '15 '16 '17 '18
PTC Capex
Source: AAR20
$9.9$10.2
$9.8

21
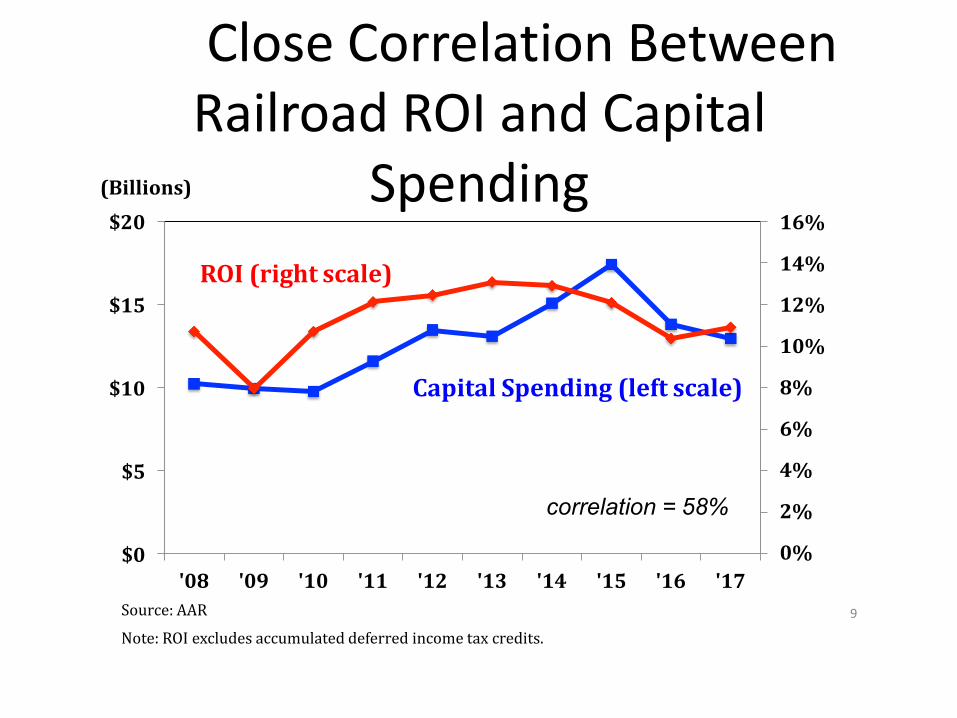
Close Correlation Between Railroad ROI and Capital
Spending
Note: ROI excludes accumulated deferred income tax credits.9
16%
14%
12%
10%
8%
6%
4%
2%
0%$0
$5
$10
$15
$20
'08 '09 '10 '11 '12 '13 '14Source: AAR
'15 '16 '17
ROI (right scale)
correlation = 58%
(Billions)
Capital Spending (left scale)

Canadian Railroads Capital Spending and ROI
10
14%
15%
16%
$0.0
$0.5
$1.0
$1.5
$2.0
'16 '17 '18
CN
CPWt. Avg. ROI (Right Scale)
Source: Company Reports
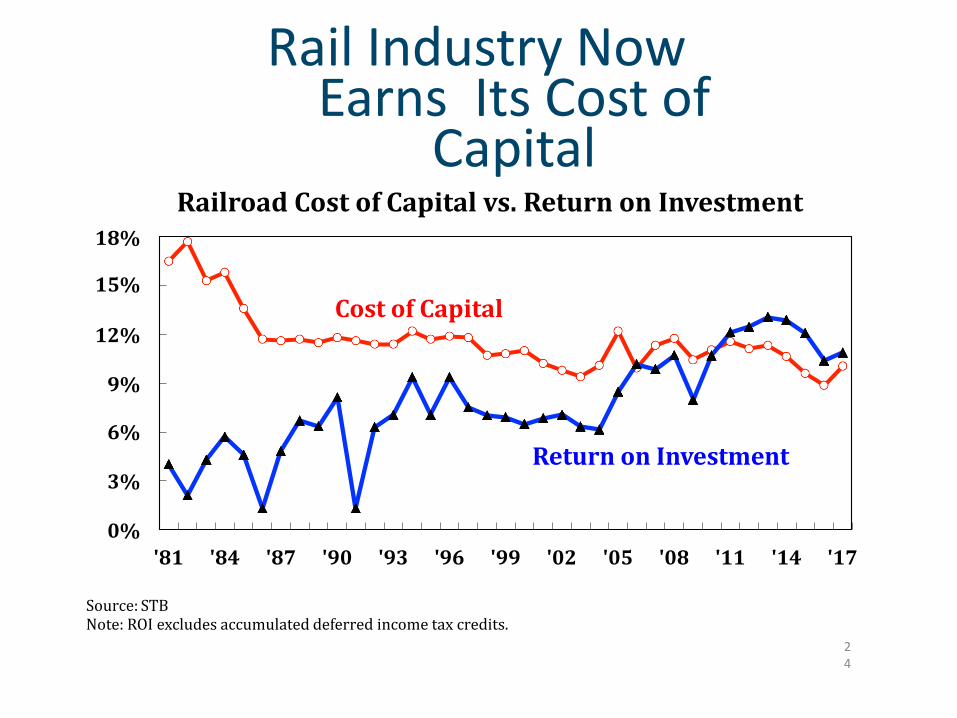
Rail Industry Now Earns Its Cost of
CapitalRailroad Cost of Capital vs. Return on Investment
18%
15%Cost of Capital
12%
9%
6%Return on Investment
3%
0%'81 '84 '87 '90 '93 '96 '99 '02 '05 '08 '11 '14 '17
Note: ROI excludes accumulated deferred income tax credits.24
Source: STB
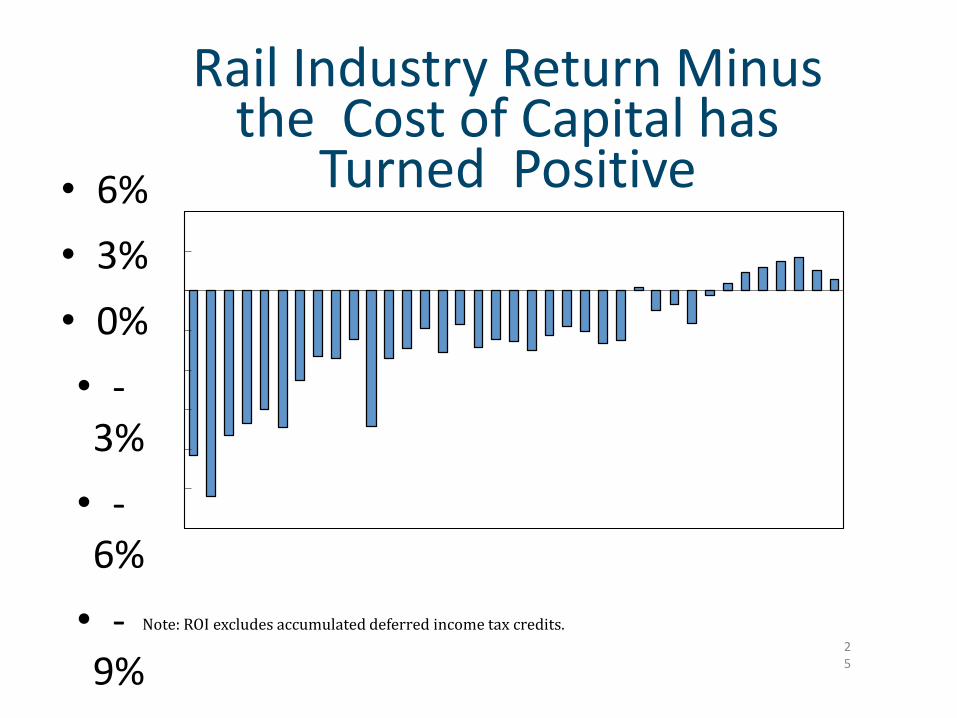
Rail Industry Return Minus the Cost of Capital has
Turned Positive• 6%• 3%• 0%• -3%
• -6%
• -9%
Note: ROI excludes accumulated deferred income tax credits.25
ASSOCIATION OF AMERICAN RAILROADS SLIDE 26
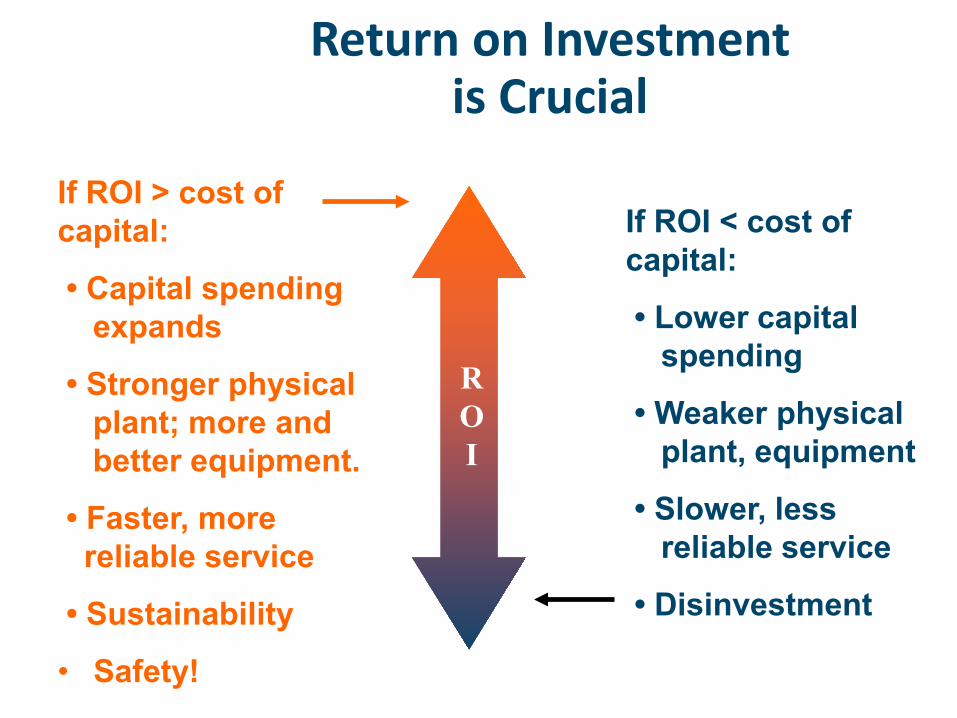
Return on Investment is Crucial
ROI
If ROI > cost of capital:
• Capital spendingexpands
• Stronger physicalplant; more andbetter equipment.
• Faster, morereliable service
• Sustainability
• Safety!
If ROI < cost of capital:
• Lower capital spending
• Weaker physicalplant, equipment
• Slower, less reliable service
• Disinvestment
27
Freight Rails Earn HighMarks
• America’s rail network was awarded the highest grade in 2017, a “B.” from The American Society of Civil Engineers (ASCE).
• The high marks for America’s privately funded freight rail system stand in stark contrast to taxpayer-funded transportation infrastructure. Bridges, ports and roads, for example, continue to age and suffer from overuse.
• Reflecting their poor condition, ASCE respectively gave these public systems grades of “C+” “C+” and “D.”
Enduring (?) Railroad Competitive Advantages
1. Labor Advantage (ex: Double-stack LA-Chi)*2. Fuel Advantage (4:1 ton/mile; AAR)**3. Infrastructure Advantage (after the HIS buildout;
user-pay and capex to support changing logistics patterns – ex: transcon)***
• AV trucking?• ** EV Trucking?• *** Infrastucture Bill? (LOL)
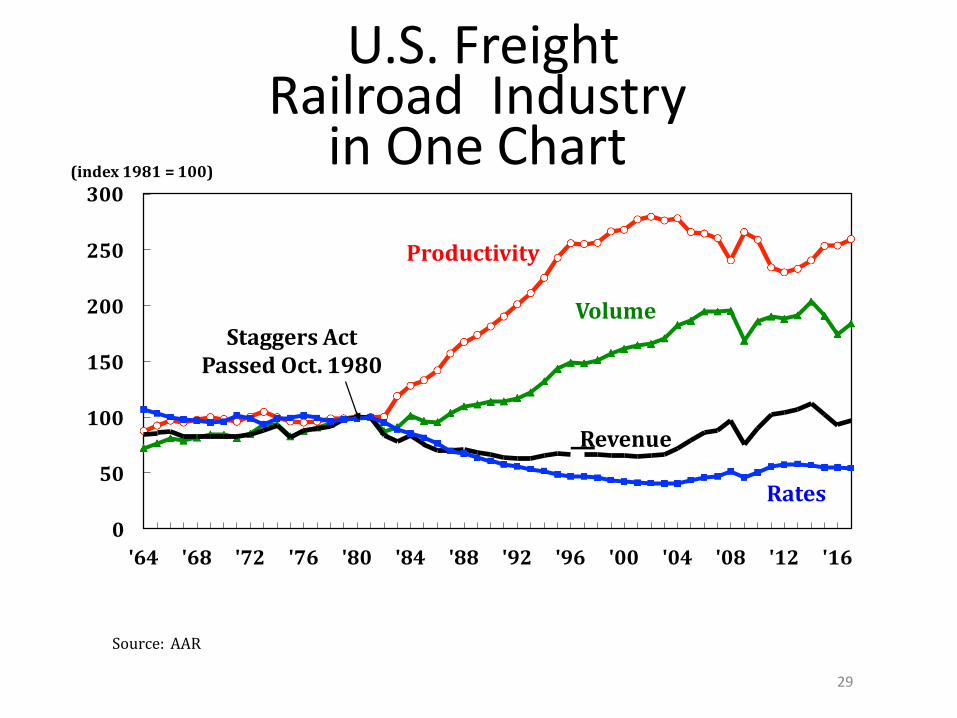
0
50
100
150
200
250
Revenue
Volume
Productivity
Rates
'64 '68 '72 '76 '80 '84 '88 '92 '96 '00 '04 '08 '12 '16
Staggers Act Passed Oct. 1980
(index 1981 = 100)300
Source: AAR
29
U.S. Freight Railroad Industry
in One Chart
ABH Consulting/www.abhatchconsulting.comAnthony B. Hatch1230 Park AvenueNew York, NY 10128(917) [email protected]
www.railtrends.com