Embed Size (px)
Citation preview
WILLIAM M. POLWKA IBM Federal System Company Owego, NY
REFERENCES
632
Vorperian, V. (1990) Simplified analysis of PWM converters using the model of the PWM switch: Parts I and 11. IEEE Transactwns on Aerospace and Electronic Systems, 26, 3 (May 1990), 490-505.
Maksimovic’, D., and C’uk, S. (1991) A unified analysis of PWM converters in discontinuous modes. IEEE Transaction on Power Electronics, 6, 3 (July 1991).
A general unified approach to modelling switching dc-to-dc converters in discontinuous conduction mode. IEEE Power Electronics Specialists Conference Record, 1977, pp. 36-57; IEEE Publication 77 CH 12-13-8AES.
Current injected equivalent circuit approach to modeling of switching dc-dc converters in discontinuous inductor conduction mode. IEEE Transactwns on Industrial Electronics, IE-29, 3 (Aug.
C‘uk, S., and Middlebrook, R. D. (1977)
Chetty, P R. K. (1982)
1982), 230-234. Smedley, K. S., and C’uk, S. (1990)
One cycle control of switching converters. IEEE Paver Electronics Specialists Conference Record, 1990, pp. 88%8% IEEE Publication 91CH3008-0.
Modelling, analysis, and design of switching converters. Ph.D. dissertation, California Institute of Technology, Pasadena, Nov. 1976.
A general unified approach to modelling switching converter power stages. IEEE Power Electronics Specialists Conference Record, 1976, pp.lS34; IEEE Publication 76 CHO 1084-3AES.
Krien, P. T., Bentsman, J., Bass, R. M., and Lesieutre, B. C.
On the use of averaging for the analysis of power electronic systems. IEEE Transactwns on Power Electronics, 5, 2 (Apr. 1990), 182-190.
Sanders, S. R., Noworolski, J. M., Liu, X. Z., and Verghese, G. C. (1991)
Generalized averaging method for power conversion circuits. IEEE Transactwns on Power Electronics, 6 , 2 (Apr. 1991).
C’uk, S. (1976)
Middlebrook, R. D., and C‘uk, S. (1976)
(1990)
Power Lines: Radar Measurements and Detection Algorithm for Polarimetric SAR Images
Polarimetric radar backscattering measurements of a variety of powerline cables are presented. The objective of the first part of the investigation was to study the effect of braiding of the cables on the backscattering at skew incidence. The measurements were performed for four different actual size powerline samples at C-, X-, and Ka-band over a wide range of incidence angles. The data were collected over a 500 MHz bandwidth at C- and X- band with a 1.25 MHz increment and a 1 GHz bandwidth at Ka-band with a 2 5 MHz increment. Also the effect of nonuniform illumination and measurement in the near field of the cables were studied. Experimental data shows a significant radar backscatter for W-polarization (U””) at angles away from normal incidence. This backscatter is proportional to the number and diameter of the strands on the surface of the cables. There is also noticeable backscatter for the HH and MI components of the scattering matrices. Their magnitudes, relative to that of the W component, are proportional to the pitch angle of the helix.
Since detection of these cables is an important safety issue for low-flying airplanes a detection algorithm using polarimetric synthetic aperture radar (SAR) images was developed using the knowledge gleaned from the measurements.
The detection algorithm was tested on a simulated image and worked well, detecting a power line whose backscatter power was 6 dB below the average background power.
I . INTRODUCTION
Detection and collision avoidance of obstacles of small physical cross section has always been an important problem for low-flying aircrafts. High voltage powerlines and powerline towers are particularly hazardous in this respect.
Many collision warning techniques have been suggested in the past. Among the most promising techniques are laser radar [Savan and Barr, 19881 and millimeter wave radar [Rembold et al., 19821, particularly the latter when used in the synthetic aperture imaging mode. Available methods, however, suffer from a number of shortcomings. A major limitation of laser systems is atmospheric attenuation under fog and cloudy conditions, which would hamper
Manuscript received February 19, 1993; revised May 28 and August 23 ,1m.
IEEE Log NO. T-AES/30/2/15832.
This research was performed under subcontract to Ressler Assokiites, Inc., under DARPNSBIR contract number DAAH01-91-C-RO66.
0018-9251/94/$4.00 @ 1994 IEEE
IEEE TRANSACTIONS ON AEROSPACE AND ELECTRONIC SYSTEMS VOL. 30, NO. 2 APRIL 1994

target detection considerably. The problem with microwave and millimeter wave radars lies in the fact that current models used for characterizing the scatter by powerlines are inadequate. The radar uses a linearly polarized wave and transmission lines are modeled as long perfectly conducting circular cylinders [Rembold, 19841. The description imposes a significant restriction on the ability of radar to detect powerlines. The choice of frequency and polarization have not been examined in previous measurements and models in order to optimize the detection of powerlines by radars. The fact that a high voltage powerline is made up of strands of wires in a helical arrangement can be exploited with regard to backscattering detection of the powerlines. At high frequencies the helical geometry of powerlines becomes an important factor influencing the scattering behavior of electromagnetic waves which can be taken advantage of in detecting powerlines at off-specular directions. The surface of the cables is periodic along the axis of the cables and usually the period is only a fraction of the helical pitch. The effect of the helicity and the periodicity of the surface in backscatter at incidence angles away from normal incidence is investigated in this report.
Here we present the polarimetric backscatter response of four different types of powerline cables at C-, X-, and Ka-band. Experimental data are collected over a wide range of incidence angles and for two different cable lengths. In one case the cable length is chosen such that the illumination is uniform, and in the other case the cable is long and the illumination is nonuniform. In the case of nonuniform illumination on a cable, the scattering matrix of a smooth cylinder of identical length and diameter is also measured for comparison. First the measurement setup and the radar configurations are discussed briefly and then a polarimetric calibration procedure used in support of these measurements is mentioned. Next, the radar cross section measurements and significant results are given. Finally, an algorithm is presented to detect power lines in polarimetric synthetic aperture radar (SAR) images and it is tested on a simulated image.
I I . MEASUREMENT
A. System Configuration and Setup
cables were performed by C-, X-, and Ka-band scatterometers. The scatterometers are HP 8753-based (8753A for C- and X-band and 8753C for Ka-band) systems with both phase and amplitude measurement capability and 100 dB dynamic range. The ability of the network analyzer to generate the time domain response of the frequency measurements allows the removal of the unwanted short-range signals from the desired target response (known as software gating). It also allows the separation of the contributions from
The polarimetric measurements of the powerline
CORRESPONDENCE
different scattering points within the target under investigation. The C- and X-band scatterometers are slightly different from the Ka-band system. The C- and X-band system are single antenna radars while the Ka-band is a dual antenna system. The sequence of polarization selection, data collection, and target orientation is performed via an HP 9000 series computer. A relay actuator energizes frequency and polarization switches. An amplifier and pulsing network eliminate the short-range returns from the antenna and circulators helps to increase the dynamic range for the radar cross section (RCS) measurements [Liepa et al., 19891. The pulsing network is not used for the Ka-band system since there is enough isolation between the transmitter and the receiver. In this scheme, the receiver is switched off during transmission and then reconnected when the target return is expected to arrive at the receiver. Since the switching is done at a much higher rate than the bandwidth of the receiver, the network analyzer does not sense that the incoming signal is pulsed and it is measured as if it were a continuous wave signal.
The synthesized source of the network analyzer spans the frequency range 300 KHz to 3 GHz and therefore up- and downconvertors are used to transmit and receive the desired frequencies. The up-convertors for the C- and X-band units are very stable microwave sources operating at 6.5 and 8 GHz, respectively. The frequency range of the network analyzer is set to 1.5-2 GHz and 1.25-1.75 GHz, respectively, in order to operate the C- and X-band scatterometer at 4.5-5 and 9.25-9.75 GHz. The antenna for each system is comprised of an orthomode transducer (OMT) and a dual-polarized square horn with an overall cross-polarization isolation of 20 dB.
The Ka-band scatterometer can operate in both the coherent and coherent-on-receive modes [Kuga et al., 19911. In the coherent mode the scattering matrix of the target can be measured and in the coherent-on-receive mode the scatterometer measures the Mueller matrix of the target directly. In this study the coherent mode of the scatterometer is used. The dual channel capability of the HP 8753C allows simultaneous measurements of V and H channels in coupled/chop mode. Point by point external triggering is used for transmitting V and H sequentially and for synchronizing a polarization control circuit to create different polarizations. This scatterometer is a two-antenna system with at least 70 dB isolation between the transmitter and the receiver. The polarization selection in the transmitter is accomplished by a Faraday rotator and in the receiver by an OMT The antennas in both the transmit and receive channels are lens-corrected corrugated circular horns. The local oscillator is a 32 GHz Gunn diode which is stabilized by an injection locking technique. Table I gives the important specifications of the scatterometer systems.
633
I
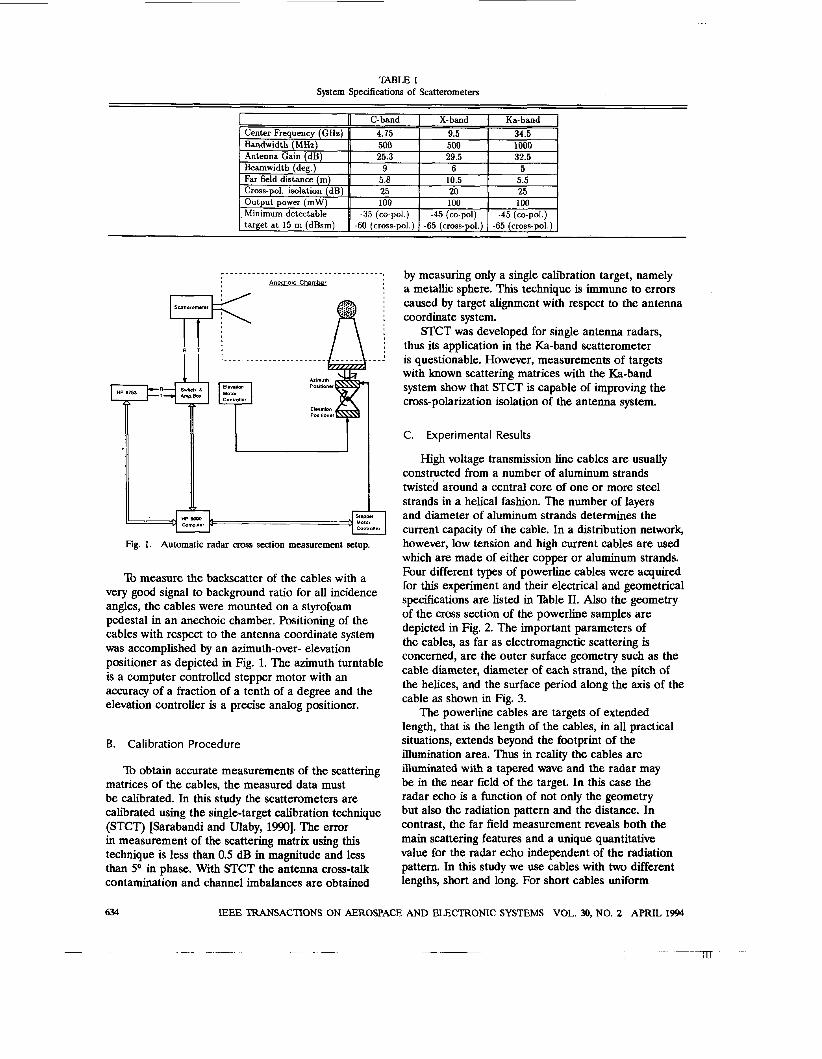
W L E I System Specifications of Scattemmeters
Fig. 1. Automatic radar (TOSS section measurement setup.
To measure the backscatter of the cables with a very good signal to background ratio for all incidence angles, the cables were mounted on a Styrofoam pedestal in an anechoic chamber. Positioning of the cables with respect to the antenna coordinate system was accomplished by an azimuth-over- elevation positioner as depicted in Fig. 1. The azimuth turntable is a computer controlled stepper motor with an accuracy of a fraction of a tenth of a degree and the elevation controller is a precise analog positioner.
B. Calibration Procedure
To obtain accurate measurements of the scattering matrices of the cables, the measured data must be calibrated. In th is study the scatterometers are calibrated using the single-target calibration technique (STCT) [Sarabandi and Ulaby, 19901. The error in measurement of the scattering matrix using th is technique is less than 0.5 dB in magnitude and less than 5 O in phase. With STCT the antenna cross-talk contamination and channel imbalances are obtained
by measuring only a single calibration target, namely a metallic sphere. This technique is immune to errors caused by target alignment with respect to the antenna coordinate system.
STCT was developed for single antenna radars, thus its application in the Ka-band scatterometer is questionable. However, measurements of targets with known scattering matrices with the Ka-band system show that STCT is capable of improving the cross-polarization isolation of the antenna system.
C. Experimental Results
constructed from a number of aluminum strands twisted around a central core of one or more steel strands in a helical fashion. The number of layers and diameter of aluminum strands determines the current capacity of the cable. In a distribution network, however, low tension and high current cables are used which are made of either copper or aluminum strands. Four different types of powerline cables were acquired for this experiment and their electrical and geometrical specifications are listed in n b l e 11. Also the geometry of the cross section of the powerline samples are depicted in Fig. 2. The important parameters of the cables, as far as electromagnetic scattering is concerned, are the outer surface geometry such as the cable diameter, diameter of each strand, the pitch of the helices, and the surface period along the axis of the cable as shown in Fig. 3.
The powerline cables are targets of extended length, that is the length of the cables, in all practical situations, extends beyond the footprint of the illumination area. Thus in reality the cables are illuminated with a tapered wave and the radar may be in the near field of the target. In this case the radar echo is a function of not only the geometry but also the radiation pattern and the distance. In contrast, the far field measurement reveals both the main scattering features and a unique quantitative value for the radar echo independent of the radiation pattern. In this study we use cables with two different lengths, short and long. For short cables uniform
High voltage transmission line cables are usually
IEEE TRANSACTIONS ON AEROSPACE AND ELECTRONIC SYSTEMS VOL. 30, NO. 2 APRIL 1994
~ 1 - - n l T - ~~

TABLE I1 Electrical and Geometrical Specifications of Cables Under Test
No.
1
Circular Copper Current Mils # d D Capacity P L
(MCM) St. (cm) (cm) (Amps) (cm) (cm) 167.8 7 0.400 1.20 420 14.60 1.95
No. St. 19 54 45
- - - -
Circular Aluminum I Steel Current Mils # I d [ # I d D Capacity P L
(4 -
0.337 0.301
1 2 0 cm -
(cm1 (Amps) ( 4 ( 4 2.22 730 23.5 1.52 3.01 1010 35.56 2.00 3.52 1300 40.65 2.40
167.8 MCM (Copper)
____) 3.52 cm -
3.04 cm
954 MCM (Aluminum 8 Steel)
Note: See Fig. 3 for definitions of some of the symbols.
Fig. 2. Cross section of powerline samples.
2.22 cm -
1431 MCM (Aluminum & Steel) 556.5 MCM (Aluminum)
4 le d: SIranded conductor diameter
D: Overall outside dlameter
L: sp.clng between rurlams
P: Spaclng between turns
Fig. 3. Geometry of powerline cable.
illumination and far field criteria are satisfied and for long cables the illumination is nonuniform and the radar is in the near field of the cables. The measured radiation pattern and radar cross section of the long cable are compared with those measured for smooth
CORRESPONDENCE
i n
- Y
Fig. 4. Geometry of radar system above powerline cable.
cylinders of similar lengths and diameters to study the effect of braiding on the cables. A series of scattering matrix measurements of powerline cables and smooth cylinders is performed at C-, X-, and Ka-band over the frequency ranges 4.5-5 GHz, 9.25-9.75 GHz, and 34-35 GHz, respectively. All the data presented in this report are measurements at the center frequencies, namely 4.75 GHz for C-band, 9.5 GHz for the X-band, and 34.5 GHz for Ka-band.
The scattering matrix measurements were performed in an 18 m long anechoic chamber at a distance of 13 m. The targets are mounted on a Styrofoam pedestal to get a minimal background contribution. The Styrofoam pedestal is practically invisible at C- and X-band but at Ka-band its radar cross section is considerable (about -30 dBsm). To remove the contribution of the background and the effects of multiple reflection within the radar system, the chamber and pedestal are measured in the absence of targets and then subtracted from the target response. A 30.5 cm and a 4.45 cm metallic spheres are used for C-, X-band and the Ka-band system as calibration targets, respectively. The signal to noise ratio w a s better than 30 dB in all cases.
(H-plane) of the antenna system and the radiation The cables are positioned in the horizontal plane
635

IO. . . . . . . . . . . . . . . . . . ~ 0"
%a 0. .........
-10. 0. IO. U). M. 40. M. 60. 70. 80.
Incidence Angle (Degrees)
(4
10. . . . . . . . . . . . . . . . . . - 0"
0- 0. .........
-50. '+,,/\ ,, ?<',#' -60. " ' " ' I " " " ! I ' ,
-10. 0. IO. 20. M. 40. 50. 60. 70. 80.
Incidence Angle (Degrees)
(4
-.+ _ _ _ _ _ _
-10. 0. 10. 20. M. 40. 50. 60. 70. 80
Incidence Angle (Degrees)
-60.' " ' ' ' ' ' ' ' ' ' A ' ' ' -10. 0. LO. 20. M. 40. 50. 60. 70. 80.
Incidence Angle (Degrees)
10. . . . . . . . . . . . . . . . .
%
- a.. 0. . .... ._ ._
- _ _ _ _ _ _ -10. - ,.
-10. 0. IO. 20. 30. 40. 50. 60. 70. 80.
Incidence Angle (Degrees)
(4 Fig. 5. Radar backscatter cross section for 30 cm long cable. (a) Cable 1. (b) Cable 2. (c) Cable 3. (d) Cable 4. (e) Smooth cylinder of
diameter 1.27 cm. at 4.75 GHz.
patterns are measured in the principal plane, that is the axis of rotation is perpendicular to the horizontal plane. Accurate orientation of the cables with respect to the antenna system is achieved by a stepper motor positioner with an accuracy of a fraction of a tenth of a degree. This cable orientation is similar to that of radar systems mounted on low-flying aircraft where the powerlines are in the horizontal plane. In the detection of powerlines using SA%, however, the results of this experiment must be transformed to account for the different viewing geometry. When a powerline cable is not in the principal plane of the radar antenna, the circular symmetry of the powerline cables can be used to obtain its scattering matrix from the scattering matrix of the cable in the principal plane. Fig. 4 shows the relative positions of a radar system and a powerline. The plane of incidence, which includes the cable axis and the direction of incidence, intersects the antenna polarization plane, which includes the vertical and horizontal directions of the antenna, along a unit
vector h'. If the antennancoordinate frame is rotated by an angle $ such that h and h' coincide, then the horizontal principal plane and the plane of incidence would also coincide for the case in which the scattering matrix is known. For known values of polar direction of the cable axis (9) and incidence angle (e), the coordinate frame rotation angle ($) can be obtained from
The scattering matrix of the cable in this situation S, in terms of the scattering matrix of the cable in the principal plane S,, can be obtained from
Q = tan-'[cosetan$]. (1)
s u u Suh
= [ s h u s h h l
] * (2) cos$ -sin$lSp [ cos$ sin$
= [sin$ cos$ -sin$ cos$
We are now in a position to present the measured data. Fig. 5(a)-(d) shows the C-band radar cross
636 IEEE TRANSACTIONS ON AEROSPACE AND ELECTRONIC SYSTEMS VOL. 30, NO. 2 APRIL 1994
~ r 7 ~~

TABLE I11 Radar Cross Section (dBsm) of Smooth Cylinders 1 m Long
section for the 30 cm long cables 1 through 4. The measured RCS of a 30 cm long smooth cylinder with a diameter similar to that of cable 1 is shown in Fig. 5(e) for comparison. The co-polarized components (W, HH) of the scattering matrix are more or less similar to those of the smooth cylinders except for cable 4 where oVv is slightly higher than (Thh. At incidence angles beyond 50 degrees scattering is dominated by the end cap of the cables. There is also a rather significant decrease in the ratio (Tvv/(Thh
for the cables, when compared with the same ratio for smooth cylinders at normal incidence (see Table I11 for RCS of the smooth cylinders). The reason for this phenomena is that the surface of the cables shows two different surface impedances due to the corrugations and the surface impedance is higher for vertical polarization (TE case) than for horizontal polarization (TM case) [Sarabandi and Ulaby, 19911. The decrease in the ratio of the copolarized terms is inversely proportional to the diameter of the cables. It is also important to note the differences between the levels of the braided cables and the smooth cylinder. Braided co-pol responses are about 10 dB higher for nonnormal incidence angles. Braided cross-pol responses are about 30 dB higher for all angles. These two differences are critical to the performance of our cable detection algorithm for all incidence angles.
Fig. 6 gives the near field measurements of cable 4 and its smooth cylinder counterpart. The near field effect reduces the RCS at normal incidence, widens the RCS pattern, and enhances the increase in uvv and (Thh.
of 30 cm long cables at X-band and Fig. 7(e) shows the measurement of the cylinder counterpart of cable 1. The near field measurements of cable 4 and its reference cylinder are shown in Fig. 8. Similar scattering features, but more pronounced than those observed for C-band, exist in the X-band data. The most important scattering feature is the increase in uvv at angles away from normal incidence. This increase in uvv can be interpreted as follows. The surface of a cable can be viewed as a cylinder with a number of parallel slanted narrow grooves on the surface. The inclination angle of the grooves is equal to the pitch angle of the helices which is around 15O. The backscatter from a metallic groove for the TE case (electric field perpendicular to the groove axis) is much
Fig. 7(a)-(d) gives the backscattering cross section
40.1 " " " " ' -10. 0. 10. 20. 30. 40.
Incidence Angle (Degrees)
-10. 0. 10. U). U). 40.
Incidencehgle @egrees)
(b)
Fig. 6. Near field radar backscatter cross section for U) cm long cable. (a) Cable 4. (b) Smooth cylinder of diameter 3.49 cm at
4.75 GHz.
stronger than for the TM case (electric field parallel to the groove axis) [Senior, et al., 19901, because in the TE case the groove is capable of supporting a transverse electromagnetic (TEM) wave and in the TM case the groove is incapable of supporting any waveguide mode. Since the grooves are almost parallel to the axis of the cylinder the backscatter for W-polarization is much stronger.
Fig. 9 shows the RCS of the 30 cm long cables at Ka-band. The RCS response of the cables at all polarizations has peaks at approximately 1Oo-15O from the backscatter direction (see Fig. 9). These peaks are due to the Bragg modes in backscatter. For a periodic target the Bragg backscatter occurs for incidence angles according to
8, = sin-' (g) (3)
where X is the wavelength and L is the period (Fig. 3). Since most of the scattered energy is in the specular direction, the higher order Bragg modes are very weak at angles away from normal incidence.
In these cables only one of the Bragg modes is observable, and, as in the lower frequencies, the
CORRESPONDENCE 637

10. . , . , . , . , . , . , . , . , ~ 0"
or 0. _ _ ._ . . . . .
-10. 0. IO. 20. 30. 40. 50. 60. 70. 80
Incidence Angk (Degms)
(4
-50.1 ' ' ' ' ' ' 1 . ' ' ' ' ' " ' ' ' I I
-10. 0.10.m.30.40.50.60.70.80
IncidemAngle (Degrees)
-10.
-20.
-?a.
4.
-50,
do. -10. 0. IO. 20. 30. 40. 50. 60. 70. 80.
Incidence Angle (Degrees)
-10. 0. 10. 20. 30. 40. 50. 60. 70. 80.
Incidence Angle @cprees)
-10.
5 -20. 5 H -30. 4.
-50.
nl w.
-10. 0. 10. 20. 30. 40. 50. 60. 70. 80.
Incidence Angk (Degrees)
(e)
Fig. 7. Radar backscatter cross section for 30 cm long cable. (a) Cable 1. (b) Cable 2. (c) Cable 3. (d) Cable 4. (e) Smooth cylinder of diameter 1.27 cm, at 9.5 GHz.
backscatter for W-polarization is significantly higher than the other components. The effect of curvature on cable 2 has also been tested and the result is shown in Fig. 11 for a curved cable with radius of curvature of about 10 m. The curvature lowers the RCS of the cable at normal incidence and the Bragg directions and widens the scattering patterns. Also the near field measurement of cable 4 and its cylinder counterpart are shown in Fig. 10.
The backscattering measurements are performed polarimetrically so that the target response to any desired transmit and receive polarization configuration can be synthesized [van Zyl and Ulaby, 19901. Obviously for detection purposes the desired polarization is the one which maximizes the target response. It turns out that all the polarization signatures closely resemble the polarization signature of a vertical dipole. Thus the optimum polarization for detection, as expected, is W-polarization when the cable is in the H-plane of the antenna system. If
the cable were not in the H-plane, then the optimum polarization would still be a linear polarization with rotation angle $ as given by (1).
D. Summary of Experimental Results
Near field and far field polarimetric backscattering measurements of four powerline cable samples have been presented at C-, X-, and Ka-band over a wide range of incidence angles. The near field measurements of smooth cylinders with a length and diameter similar to those of the cables were also performed for comparison. The experimental results from the backscatter measurements of cables and cylinders indicate the following.
1) At normal incidence there is a significant decrease in (Tvv/(Thh of the cables in comparison with the ratio for the smooth cylinders. This decrease is inversely proportional to the diameter of the cables.
638 IEEE TRANSACTIONS ON AEROSPACE AND ELECTRONIC SYSTEMS VOL. 30, NO. 2 APRIL 1994
I ~~

' : : m i _ _ _ _ _ _ . . . . . . . . .
1
-10. 0. 10. 25. 30. 40. 50. 60. 70. 80.
lncidencehgle (Degrees)
(a)
LO.
0.
-10.
h
B -20. 3 2 -30.
4.
-50.
60. -10. 0. 10. 25. 30. 40. 50. 60. 70. SO.
Incidencehgk (Degrees)
(b) Fig. 8. Near field radar backscatter (xoss section for 120 cm long
cable (a) Cable 4. (b) Smooth cylinder of diameter 149 cm at 9.5 GHz.
2) At low frequencies and for small diameter cables (D/A << 1) there is no significant backscatter at angles away from normal incidence.
3) The cross-polarized component of the cable backscatter is very high over the entire range of incidence angles. The cross-polarized RCS level is directly proportional to the cable and the cable strand diameters.
wavelength there is a considerable increase in ovv in off-specular directions and this increase depends on the diameter of the cable strands.
5) At millimeter wavelengths the Bragg modes are observable at angles close to normal incidence (ei < 15.). The W-polarized backscatter for the Bragg modes is much higher than the other polarizations.
4) When the cable diameter is comparable to the
Ill. DETECTION
A. Introduction
For imaging radars the powerline is not necessarily in the H-plane of the antenna system, however the
CORRESPONDENCE
circular symmetry of the cables can be used to derive the scattering matrix of the cable (S), with an arbitrary orientation with respect to the antenna system, in terms of the scattering matrix of the cable in the principal plane (S,).
The scattering matrix of the cable in this situation S, in terms of the scattering matrix of the cable in the principal plane S,, can be obtained from (2) , and the scattering matrix in the principal plane away from normal incidence can be approximated by
(4)
where (T is the radar cross section of the cable.
of powerlines, we attempted to extract the location of powerlines by applying standard techniques such as 1) Polarization Synthesis and Optimization [van Zyl and Ulaby, 19901, and 2) Speckle Reduction Through Application of the Polarimetric Whitening Filter, [Novak et al., 19911. Unfortunately we were not successful in extracting the powerline features by applying the mentioned methods. One reason for this failure was perhaps the limited polarimetric images and the associated ground-truth available to us. But the main reason is that the signal to clutter ratio, for most practical purposes, is usually very low which makes the detection very difficult if not impossible.
Knowing the optimum polarization for detection
B. Detection Algorithm
A major difficulty in extraction of powerlines positions from a polarimetric radar image is the lack of enough signal-to-clutter ratio. Here signal refers to the radar backscatter from a powerline cable alone and clutter is referred to the backscattering coefficient of the terrain beneath the powerline. Depending on the type of the terrain the average signal-to-clutter ratio may vary from 0 to -15 dB at higher microwave and millimeter wave frequencies. Obviously any detection method using single pixels would fail when faced with poor signal-to-clutter ratios from a 20 dB variation in clutter due to speckle. Any successful algorithm must be based on the statistics of the clutter, which can be obtained from the image itself, to reduce not only the speckle but also the energy in the clutter signal.
To demonstrate how the statistics of the clutter can be exploited in the detection of a signal contaminated by noise, suppose ,C is an operator on the elements of the scattering matrix which satisfies the following
( L ( S C ) ) = 0 (5 ) where Sc is the measured scattering matrix of the clutter and (.) represents ensemble averaging. If L is applicd :c a number of pixels which include the powerline cable all with scattering matrix S,, then the measured scattering matrix is S = S, + S,. Since L may
639

I: -1 . . . . . . . . .
~10. - $ -20.
s $ -30. d
-40.
-50.
-6a -20. -10. 0. IO. 20. 30. 40. 50.
Incidence Angle (Degrees)
(4
IO.
0.
-10. ,-. ; -20.
'0 $ -30. d
-40.
-50.
-6n -20. -10. 0. IO. 20. 30. 40. 50.
Incidence Angle (Degrees)
(4
-20 -10 0 IO. 20 30 40 50
Incidence Angle (Degrees)
-""
(b)
IO.
0.
-IO.
I -20. B
-30.
40.
-50.
, .
eta . . . . . . . . . ~ .-I
, , . I , , A . , , , , I a. -20 -10. 0. IO. 20. 30. 40. 50
Incidence Angle (Degrees)
(4 Fig. 9. Radar backscatter cross section for 30 cm long cable. (a) Cable 1. (b) Cable 2. (c) Cable 3. (d) Cable 4 at 34.5 GHz.
need to be a nonlinear operator let us further assume that
with ('It@)) = 0. If such an operator exists, then (L(S)) M 0 along every line in the image which does not include the powerline.
In the electromagnetic modeling of a layer of randomly oriented small particles above a ground layer, it is shown that for azimuthally symmetric particle orientation the co- and cross-polarized components of the scattering matrix are uncorrelated [Borgeaud et al., 1987; Tsang et al., 1991; Nghiem et al., 19921. In other words (&AS$) = (SvvS$) = 0 which satisfies the conditions required for L, noticing that for distributed targets (Shh) = (Svv) = (Svh) = 0. Based on our recent polarimetric measurements of rough surfaces at microwave frequencies, we may postulate that the co- and cross-polarized components of the scattering matrix are uncorrelated for a general random medium with azimuthal symmetry [Sarabandi, 19921. In fact this assumption is used in a calibration routine for polarimetric imaging SARs to remove the antenna cross-talk factors [van Zyl, 19891.
L(S) = L(SC) + L(SS) + G ( S S ) ? - I ( S C ) (6)
C. Results of Simulation
To verify the applicability of this operator, we used a portion of an L-band polarimetric SAR
image to simulate extraction of a powerline with -6 dB signal-to-clutter ratio. The L-band image is from JPL AIRSAR of northern Michigan and is fully polarimetric. The resolution of each pixel is approximately 12m x 6.66m/sinO where O is the incidence angle. A random number generator picked a point with a distance p from the c5nter of the image and the direction of the powerline ($) was chosen to be normal to the line connecting the point and the center. The scattering matrix of the cable for each pixel was then calculated according to (2). The calculated scattering matrix for the powerline was then added to the clutter signal along the chosen direction. Fig. 12 shows a portion of the L-band SAR image without a powerline and Fig. 13 shows the same image after the powerline is added. These images display the total power for each pixel which is defined as
No discernible feature of the power line can be observed by comparing the two figures.
powerline and find its location in the image. This can be accomplished by noting that every line in the x - y plane can be mapped into a point in p - $ plane where p is the distance of the origin to the line and @ is the angle specifying the direction as shown in Fig. 14. The
Next we need an automated algorithm to detect the
640 IEEE TRANSACTIONS ON AEROSPACE AND ELECTRONIC SYSTEMS VOL. 30, NO. 2 APRIL 1994
T-- nn

0.
-10.
h
E -20.
3 -30. 3
4.
-50.
M
- a-. 0. - %A- . . . . . . . . .
"". -U). -10. 0. 10. U). 30. 40. 50.
Incidence Angle (Degrees)
(a)
Fig. 12. Portion of L-band polarimetric SAR image in northern Michigan. Figure shows total power image.
3 -30.
4.
-50.
Ln w.
-20. -10. 0. 10. U). 30. 40. 50.
Incidence Angle (Degrees)
04 Fig. 10. Near field radar backscatter cross section for 120 cm long
cable. (a) Cable 4. (b) Smooth cylinder of diameter 3.49 cm at 34.5 GHz.
60.1 , ' . ' , 1 , ' , ' , , ' I,
-20. -10. 0. 10. U). 30. 40. 50
Incidence Angle (Degrees)
Fig. 11. Radar backscatter cross section of curved 30 cm long cable 2 at 34.5 GHz versus incidence angle (radius of curvature
z 10 cm).
operator C can be chosen as given by
Fig. 13. Portion of L-band polarimetric SAR image in northern Michigan with inserted powerline whose RCS is 6 dB lower than
average clutter power.
with inserted powerline for all values of p and @ and the result is shown in Fig. 15 in the transformed p - @ plane. The brightest spot represents the direction and position of the powerline. Fig. 16 shows the powerline in the image after detection. The bright spot in the p - @ plane is about 5 dB higher than all other points.
4 s ) = Re[&JL] + Im[%l%ll (7) IV. CONCLUSIONS AND FUTURE WORK
and averaging should be performed along each line. The real quantity C(S) was computed for the image
This simulation encourages further investigations in the statistical properties of distributed targets
CORRESPONDENCE 641

Transformation
/ 4 b
x-y plane I p 4 plane I Fig. 14. 'Ransformation of line in the x - y plane to a point in
p - @ plane.
Fig. 15. (L(S)) of L-band image in p - @ plane.
642
Fig. 16. L-band polarimetric SAR image after powerline detection algorithm.
at different frequencies which can guide us in choosing the best operator according to the clutter type. What is needed in the future is polarimetric scattering measurements of distributed targets such as bare surfaces, grass land, and surfaces covered with shrubs in order to characterize the statistical properties of clutter background for powerlines. These measurements would enable us to find the best operator, C, and after completion of this stage we can apply our algorithm to real cases. For the final step we would require polarimetric SAR images at millimeter wavelengths which include powerlines. Of particular interest is the MIT Lincoln Laboratory 35 GHz SAR system. The images should be acquired at different incidence angles and look directions and ground-truth data should also be collected immediately after the flights.
KAMAL SARABAND1 LELAND PIERCE YISOK OH FAWWAZ T. ULABY Radiation Laboratory Department of Electrical Engineering and Computer Science University of Michigan Ann Arbor, MI 48109-2122
REFERENCES
(11 Borgeaud, M., Shin, R. T., and Kong, J. A. (1987) Theoretical models for radar clutter. Journal of Electromagnetic Wmes and Appk'catwn, 1, 1 (1989,7349.
[2] Ioannidis, G. A., and Hammers, D. E. (1979) Optimum antenna polarization for target discrimination in clutter. IEEE Pamactwm on Antennas Propagation, 27, 5 (May 1979).
[3] Kuga, Y., Sarabandi, K., Nashashibi, A., Ulaby, E T, and Austin, R. (1991)
Millimeter wave polarimetric Scatterometer systems: Measurement and calibration techniques. In Proceedings of AGARD, Electromagnetic Wnve Propagation Panel 48 Symposium, Montreal, May 1991.
Liepa, V. V., Sarabandi, K., and %ssoudji, M. A. (1989) A pulsed network analyzer based scatterometer. In Proceedings of IEEE Geoscience Remote Sensing Symposium, Vancouver, July 1989.
[4]
[SI Novak, L. M., Burl, M. C., Irving, W. W., and Owirka, G. J.
Optimal polarimetric processing for enhanced target detection. In Proceedings of National Telesystons Conference, Mar. 26-27, 1991.
Nghiem, S. V., Yueh, S. H., Kwok, R., and Li, E K. (1992) Symmetry properties in polarimetric remote sensing. Radio Science, 27, 5 (Sept. 1992), 693-711.
(1991)
[6]
[7l Rembold, B., Wippich, H. G., Bischoff, M., and Frank, W. E X. (1982)
A MM-wave collision warning sensor for helicopters. Proceedings of Military Microwave., (1982), London, 344-351.
IEEE TRANSACTIONS ON AEROSPACE AND ELECTRONIC SYSTEMS VOL. 30, NO. 2 APRIL 1994
T--- 7
1121
1131
~ 4 1
Rembold, B. (1984) Radar (ros9 section of long wires. IEEE l h " t w n s on Antennas Propagation, 32, 10 (Oct. 1984).
Senior, T B. A., Sarabandi, K., and Natzke, J. (1990) Scattering by a narrow gap. IEEE Trmrrodionr on Antennas Propagation, 38,7 (July 1990), 11m-1110.
Sarabandi, K. (1992) Derivation of phase statistics of distributed targets from the Mueller matrix. Rodio Science, 27, 5 (Sept.-Oct., 1992), 553-560.
High frequency scattering from corrugated stratified cylinders. IEEE Transactwns on Antennas Propagation, 39,4 (Apr. 1991), 512-520.
A convenient technique for polarimetric calibration of radar systems. IEEE Transactwns on Geoscience and Remote Sensing, 28, 6 (Nov. 1990).
Reflectance of wires and cables at 10.6 micrometer. MSEL-NV-TR-0063, Center for Night Vision and Electro-optics, Jan. 1988.
"oudji, M. A., Sarabandi, K., and Ulaby, E T. (1989) Design consideration and implementation of the LCX polarimetric scatterometer (POLARSCAT). Radiation Laboratory Report No. 022486T-2, The University of Michigan, Ann Arbor, June 1989.
Polarimetric signatures of a layer of random nonspherical discrete scatterers overlaying a homogeneous half-space based on Erst- and second-order radiative transfer theory. IEEE T*mtSactwns on Gemcience and Remote Sensing, 29 (Mar. 1991), 242-253.
In Ulaby, E T., and Elachi, C. (Eds.), Radnr Polarimetry for Geoscience. Dedham, MA: Art& House, ch. 2,1990.
van Zyl, J. J. (1990) Calibration of polarimetric radar images using only image parameters and trihedral comer reflector responses. IEEE lh"twns on Geoscience and Remote Sensing, 28 (May 1990), 337-348.
Sarabandi, K., and Uaby, E T. (1991)
Sarabandi, K., and Ulaby, E T. (1990)
Savan, M., and Barr, D. N. (1988)
Tsang, L., and Ding, K. H. (1991)
van Zyl, J. J., and Ulaby, E T. (1990)
Multiple Target Angle Tracking Algorithm Using Predicted Angles
We nmdify a multiple target angle tracking algorithm presented by Sword, et aL The predicted estimates, instead of the existing estimates, of the target angles are updated by the most recent
output of the sensor array to improve the tracking performance of
the algorithm for crossing targets. Also, the least square solution is mDdified to avoid abnormally large angular innovations when the target angles are very close. The improved performance of the proposed algorithm is demonstrated by computer simulations.
I. INTRODUCTION
Multiple target tracking problem has received considerable interest recently, owing to its various applications in sonar, radar, remote sensing, communications, air traffic control, and others [l-21. In target state model approach, a dynamic model of target state is established and tracking is performed by estimating the state vector using measurements [U]. In target angle tracking approach, tracking is performed by estimating the time delay of the target signals with respect to sensors in the array [5]. These approaches have the data association problem in tracking multiple targets.
An alternative approach of tracking multiple target angles has been proposed by Sword, et al. [6]. A signal subspace algorithm such as the MUSIC (multiple signal classification) algorithm ['7l is first applied to yield the initial estimates of the number of targets, sensor noise power, target signal power, and the target angles. The angular displacements of the targets during a sampling period are estimated in the least square sense using the most recent estimate of the sensor output covariance matrix. The target angles are then tracked recursively by adding the estimated angular displacements to the existing estimates of the target angles. This algorithm has attractive features of simple structure and avoidance of data association problem. However, it has some drawbacks. The approximation errors in estimating the angular displacements are relatively large, which are propagated into the next step. More seriously, it's poor performance for multiple targets with crossing angles prohibits the general use of the algorithm.
[SI. Lo's algorithm reduces the propagation errors by Sword's algorithm has been modified by Lo and Li
Manuscript received August 7, 1993, revised November 10, 1993.
IEEE Log No. T-AESBOL'15834.
0018-9251/94/$4.00 @ 1994 IEEE
CORRESPONDENCE 643