Embed Size (px)
Citation preview
Wilm, A; Aw, PP; Bertrand, D; Yeo, GH; Ong, SH; Wong, CH;Khor, CC; Petric, R; Hibberd, ML; Nagarajan, N (2012) LoFreq:a sequence-quality aware, ultra-sensitive variant caller for uncover-ing cell-population heterogeneity from high-throughput sequencingdatasets. Nucleic acids research, 40 (22). pp. 11189-201. ISSN 0305-1048 DOI: https://doi.org/10.1093/nar/gks918
Downloaded from: http://researchonline.lshtm.ac.uk/2017840/
DOI: 10.1093/nar/gks918
Usage Guidelines
Please refer to usage guidelines at http://researchonline.lshtm.ac.uk/policies.html or alterna-tively contact [email protected].
Available under license: Creative Commons Attribution Non-commercialhttp://creativecommons.org/licenses/by-nc/3.0/
LoFreq: a sequence-quality aware, ultra-sensitivevariant caller for uncovering cell-populationheterogeneity from high-throughputsequencing datasetsAndreas Wilm1, Pauline Poh Kim Aw1, Denis Bertrand1, Grace Hui Ting Yeo1,
Swee Hoe Ong1, Chang Hua Wong1, Chiea Chuen Khor1, Rosemary Petric2,
Martin Lloyd Hibberd1 and Niranjan Nagarajan1,*
1Genome Institute of Singapore, 60 Biopolis Street, Genome, #02-01, Singapore 138672, Singapore and2Hoffmann-La Roche, Bldg 85/521340 Kingsland Street, Nutley, NJ 07110, USA
Received July 29, 2012; Revised September 10, 2012; Accepted September 11, 2012
ABSTRACT
The study of cell-population heterogeneity in arange of biological systems, from viruses to bacter-ial isolates to tumor samples, has been transformedby recent advances in sequencing throughput. Whilethe high-coverage afforded can be used, in prin-ciple, to identify very rare variants in a population,existing ad hoc approaches frequently fail to distin-guish true variants from sequencing errors. Wereport a method (LoFreq) that models sequencingrun-specific error rates to accurately call variantsoccurring in <0.05% of a population. Using simu-lated and real datasets (viral, bacterial and human),we show that LoFreq has near-perfect specificity,with significantly improved sensitivity comparedwith existing methods and can efficiently analyzedeep Illumina sequencing datasets without resort-ing to approximations or heuristics. We alsopresent experimental validation for LoFreq on twodifferent platforms (Fluidigm and Sequenom) andits application to call rare somatic variants fromexome sequencing datasets for gastric cancer.Source code and executables for LoFreq are freelyavailable at http://sourceforge.net/projects/lofreq/.
INTRODUCTION
Recent advances in sequencing technologies have enabledmore widespread study of heterogeneity and sub-populations in a cell population, and a migration awayfrom a ‘consensus sequence’ view of their evolution.Such a ‘population perspective’ has applications in a
range of biological systems, from the characterizationof viral quasi species and intra-host variation (1,2), tobacterial sub-populations (3–5), to sub-clonal evolutionin cancer (6–8). Precise characterization of populationstructure (and rare sub-populations) in these studies isfundamental to the analysis of population evolution anddynamics as a function of host response or drug exposure.Several recent cancer sequencing studies have furtheremphasized the functional role of rare sub-populationsand variants in aspects such as tumor growth, drug resist-ance and metastasis (9,10) and the need for computationaltools to study them.In principle, the high throughput of massively parallel
sequencing allows for sampling of even rare sub-populations. Sequencing errors, however, complicate thedetermination of true variations in the population.Sequencing error rates are known to be highly variableand differ significantly between technologies, runs, lanes,multiplexes, genomic location as well as substitution types(11–13). While approaches to correct for these have beenstudied, the majority of variant-calling methods havefocused on low-coverage human re-sequencing data anddiploid calls (14–16) with discrete frequencies of interest(i.e. 0, 0.5 and 1; a related set of methods are those tailoredfor calling diploid genotypes in pooled sequencing data(17–20) and are not generally applicable).Studies of RNA viruses have provided the exceptions to
this rule (21–24). RNA viruses have high mutation rates(due to poor or missing proof-reading capability of theviral RNA-dependent DNA polymerase) and high repli-cation rates, and the resulting intra-host variations haveimplications for drug treatment strategies (25) and thegenetic monitoring of live vaccines (26). The methodsused in these studies though rely on ad hoc trimming,filtering and thresholds to call variants, limiting their
*To whom correspondence should be addressed. Tel: +65 6808 8071; Fax: +65 6808 8292; Email: [email protected]
Published online 12 October 2012 Nucleic Acids Research, 2012, Vol. 40, No. 22 11189–11201doi:10.1093/nar/gks918
� The Author(s) 2012. Published by Oxford University Press.This is an Open Access article distributed under the terms of the Creative Commons Attribution License (http://creativecommons.org/licenses/by-nc/3.0/), whichpermits non-commercial reuse, distribution, and reproduction in any medium, provided the original work is properly cited. For commercial re-use, please [email protected].

sensitivity and widespread applicability (needing manualadjustment per sample or sequencing run). Recent model-based approaches such as Breseq (27,28) and SNVer (29)are potentially more sensitive and generic, but rely onsimple binomial models and are not tailored to accommo-date biases in error rates. A more sophisticated approach,that relies on phasing to reduce the effect of sequencingerrors and is tailored to 454 sequencing has recently beenapplied to viral datasets (30). This method is, however, notdirectly applicable to other technologies and cannot berun on large genomes or sequencing datasets.In emerging clinical applications that use sequencing to
monitor the genomic state of cells, the ability to detect rarevariants in a population and to do so at the edge of de-tection limits is an important unfulfilled capability. On theone hand, increased sensitivity in variant callers can makeit possible to monitor rare but important sub-populations(e.g. cancer stem cell mutations) and on the other hand,sensitivity is essential for early detection of say a drug-resistant sub-population (e.g. with antiretroviral drugsfor HIV). In such settings, ad hoc approaches lack thedesired adaptability and robustness and may suffer froman artificial cap in the sensitivity of variant detection.Precise modeling of sequencing errors is essential topush sensitivity limits and it is this need that we seek toaddress.In this work, we present a sensitive and robust approach
for calling single-nucleotide variants (SNVs) fromhigh-coverage sequencing datasets, based on a formalmodel for biases in sequencing error rates. We show thatrigorous statistical testing can be done efficiently underthis model, without resorting to approximations, thusallowing for the exact analysis of large genomes andhigh-coverage datasets. The resulting method, LoFreq,adapts automatically to sequencing run and position-specific sequencing biases and can call SNVs at a fre-quency lower than the average sequencing error rate in adataset. LoFreq’s robustness, sensitivity and specificitywere validated using several simulated and real datasets(viral, bacterial and human) and on two experimentalplatforms (Fluidigm and Sequenom). Our results fromapplying LoFreq to call rare somatic SNVs (in exomesequencing datasets for gastric cancer) and for studyingdengue virus quasi species before and after treatment in aclinical study (of a nucleoside-analog drug Balapiravir)further highlight the robustness and versatility of thisapproach.
MATERIALS AND METHODS
Sequencing data
All dengue virus samples were sequenced in the GenomeInstitute of Singapore, as described below. For a descrip-tion of the clinical samples, see Nguyet et al. (31).Sequencing data for an Escherichia coli str. K-12 substr.MG1655 clone were downloaded from the Sequence ReadArchive (SRA submission ERA000206; 2� 100 bp reads).Mapped whole-genome and exome sequencing data forgastric cancer were taken from Zang et al. (32).
Sequencing of dengue virus samples
Library constructionA single RT-primer was designed to bind specifically tothe 30-end of dengue viruse genomes. For complementaryDNA (cDNA) synthesis, the RevertAidTM Premium FirstStrand cDNA Synthesis Kit (Fermentas, St. Leon-Rot,Germany) was used. Primer pairs were designed togenerate multiple overlapping polymerase chain reaction(PCR) fragments, roughly 2 kb in size. PCR was per-formed using the PfuUltraTM II Fusion HS DNAPolymerase (Stratagene, La Jolla, CA, USA) accordingto the manufacturer’s instructions. The fragments weregel extracted from 1% agarose gel prepared in 1� TBEbuffer and the concentrations were measured using theNanoDrop ND 1000 Spectrophotometer (Thermo FisherScientific, Waltham, MA, USA). Equal concentration ofDNA products of each sample was combined and frag-mented into a peak size range of 100–300 bp using theCovaris S2 (Covaris, Woburn, MA, USA) (shearing con-ditions—duty cycle: 20%; intensity: 5; cycles per burst:200 and time: 110 s). After fragmentation, the sampleswere purified using the Qiagen PCR purification kit(Qiagen, Valencia, CA, USA). Fragmented productswere quality-checked (2100 Bioanalyzer with a DNA1000 Chip, Agilent Technologies, Santa Clara, CA,USA). For library preparation, the NEBNext DNASample Prep Master Mix 1 kit (New England Biolabs)was used. The DNA samples underwent end-repair,A-tailing and ligation of adapters according to the manu-facturer’s instructions. After quality check of the ligatedproduct on the Bioanalyzer, fragments in the range200–400 bp were extracted from 2% agarose gelprepared in 1� TAE buffer, cleaned using the QiagenGel extraction kit (Qiagen) and quality-checked again.Finally, using the Multiplexing Sample PreparationOligonucleotide Kit (Illumina, San Diego, CA, USA),samples underwent 16 PCR cycles to incorporate indicesand were quality-checked again using the Bioanalyzerand the LightCycler 480 SYBR Green I Master mix(Roche Applied Science, Indianapolis, IN, USA) in aLightCycler� 480 II real-time thermal cycler (RocheApplied Science) according to the manufacturer’sinstructions.
Multiplex replicatesTo study consistency and reproducibility, six library rep-licates of DENV2 TSV01 viruses were created. The viruseswere grown in c6/36 cells and RNA was extracted usingthe QIAamp Viral RNA Mini Kit (Qiagen). The extractedRNA underwent library preparation as describedabove. In the final PCR step, the sample was dividedinto six reactions, which were indexed and multiplexedaccordingly.
SequencingDengue virus samples were sequenced in the GenomeInstitute of Singapore on an Illumina GA-II sequencerto obtain 35 bp reads. Base calling was done withCASAVA 1.7 and reads that did not pass Illumina’schastity filter (CASAVA 1.7 user guide) were removed.
11190 Nucleic Acids Research, 2012, Vol. 40, No. 22
Experimental validation
Fluidigm digital arrayDENV2 NGC cDNA was used to construct two sets oflibraries in parallel (PCR duplicates) and sequenced on anIllumina Genome Analyzer II to obtain 2� 75 bppaired-end reads. SNVs were called on both replicatesusing LoFreq, SNVer and Breseq and 12 low-frequencySNVs were selected from the union (found in both repli-cates, frequency �5%, discordant calls between methods,>50 bp away from PCR fragment ends) for validation onthe Fluidigm Digital ArrayTM (Fluidigm, San Francisco,CA, USA). cDNA quantification was performed on aTecan GENios microplate detection device (Tecan Inc.,Research Triangle Park, NC, USA) and the sample wasdiluted accordingly. Taqman assays were designed basedon the positions of the 12 SNVs. The main components inthe sample preparation pre-mix include the TaqMan�
Gene Expression Master Mix (Applied Biosystems, LifeTechnologies, Foster City, CA, USA), 20� GE sampleloading reagent (Fluidigm) and 20� gene-specific assays(Applied Biosystems). The diluted cDNA and pre-mixwere transferred into the primed chip and loaded usingan Integrated Fluidic Circuit Controller MX (Fluidigm)following manufacturer’s instructions. The chip was thenrun on the The BioMarkTM System (Fluidigm) using theData Collection Software. Data were extracted andanalyzed using the Digital PCR Analysis Software(Fluidigm). SNV frequencies were determined inquadruplicates.
Sequenom MassArrayWe attempted to detect sequence variants within the poolof dengue virus genomes using the Sequenom MassArrayiPLEX primer extension platform (Sequenom, San Diego,CA, USA). Note that this approach is not expected to beas sensitive as digital PCR and correspondingly we onlyused it to measure the Type II error rate. Assays for thesequence variants were designed in multiplex and thegenotyping step comprises an initial PCR reaction toamplify the viral genomic region of interest followed byprimer extension based on viral genotype status. The sizeof the extended products thus represents viral genotypestatus and was then resolved by mass spectrometry timeof flight. In total, 18 clinical samples and 4 cell-culturesamples (all DENV2) were assayed in two replicates at79 and 13 positions, respectively (1474 primer/samplecombinations). Moderate and sample-specific calls werethen compared with sequencing-based LoFreq calls toassess concordance.
Simulated datasets
Simulated sequencingWe generated 10 mutants of the DENV2 Refseq sequenceNC_001474.2, by randomly mutating 0.1% of the pos-itions (without replacement), and thus obtained a list oftrue-positive SNVs. From the haplotype sequences, wesimulated 35 bp reads using Metasim (33), with errorrates derived from average quality per read positionfor the clinical DENV2 samples. For each coveragelevel (50�, 100�, 500�, 1000�, 5000� and 10 000�),
10 replicates were simulated. The quality values wereadded to the simulated fasta file to produce a FastQ filewith base-call qualities. The abundance of the haplotypes(Metasim’s taxonomy profile) was set according to a geo-metric series (multiplicative factor of 2) resulting in haplo-type and corresponding SNV frequencies ranging from alower bound of 0.1–50%.
Simulated populationFrom the clinical DENV2 samples, we took the sixdatasets with highest coverage and used the most sensitiveSNV-calling module (LoFreq-NQ; see below) to callvariants. Reads supporting any called variants wereremoved to make the datasets appear ‘clonal’ while retain-ing sequencing errors. The consensus genome for each ofthe six datasets was then aligned to Genbank sequenceEU660415 (which was also used for read mapping) to de-termine true-positive SNVs. The six datasets were thenrandomly sub-sampled and pooled according to a geomet-ric series, leading to a range of haplotype/SNV frequencies(�1–50%) and total coverage of �100�.
Detection limit testTo test the detection limits of the various methods, weartificially created short alignments with variouscoverage values and controlled counts of non-referencebases (i.e. SNVs to be detected), where each base wasassigned the same uniform quality. For each givenquality/coverage combination, we recorded the minimumnumber of non-reference bases needed to call a SNV.Breseq did not make any calls for this dataset and wesuspect that this is because it is based on a likelihoodratio test using background frequencies from the wholealignment, and these were not meaningful for this artificialand short dataset.
SNV calling with LoFreq
Modeling sequencing errorGiven an alignment of reads to a consensus reference,LoFreq treats each base in a column as arising from aBernoulli trial (success= reference/consensus base; fail-ure=variant base). Each trial is assumed to be independ-ent with an associated sequencing error probability thatcan be derived from a Phred-scaled quality value (Q) forthe base (P=10 exp (�Q/10)). The number of variantbases (K) in a column of N bases is then given by aPoisson–binomial distribution—a generalization of thebinomial distribution, where each Bernoulli trial canhave a distinct success probability. To compute exact P-values under this null model, we employed the followingrecursion formula that is easy to derive from firstprinciples:
Prn X ¼ kð Þ ¼ Prn�1ðX ¼ kÞð1� PnÞ+Prn�1ðX ¼ k� 1ÞPn,
ð1Þ
where Prn(X=k) is the probability of observing k variantsin the first n bases and Pn is the error probability for thenth base. The P-value is then given by
Pk�K PrN (X=k),
i.e. the sum of the tail of the probability mass function(pmf) for n=N.
Nucleic Acids Research, 2012, Vol. 40, No. 22 11191
Runtime optimizationWhile a naive recursion based on Equation (1) can taketime exponential in N, a dynamic programming approachto save intermediate results allows for the computation ofthe pmf in O(N2) time. As N can be large in practice, weaimed to reduce runtime by limiting computation to theportions of intermediate pmfs that affect the final P-value.In particular, it is easy to show that Prn(X=k)=0 for k>nand that entries for n>N�K, k<K�N+n do not affectthe final P-value. Also, for a given threshold (t) on theP-value, if
Pk�K Prn(X=k)>t for any n, then the
P-value will also be greater than t (as shown below)allowing for computation to terminate prematurely formost columns in an alignment (the non-variantcolumns). Finally, a key refinement in LoFreq is basedon the following recursion:
Sn ¼ Sn�1+Prn�1ðX ¼ K� 1ÞPn ð2Þ
where Sn =P
k�K Prn(X = k). This recursion can bederived directly from Equation (1) and allows LoFreq toonly compute the pmf for k < K, in addition to keepingtrack of Sn using Equation (2). Thus, the worst-caseruntime for LoFreq is reduced to O(KN)—a significantgain when most columns have few variant bases.Note that to maintain numerical precision, allarithmetic in LoFreq is done in log-space where wecompute log(a)+log(b), a > b, using the formulalog(a)+log(1+exp(log(b)� log(a))).
Sequencing qualityWhere available, LoFreq takes in Phred-scaled qualityvalues provided by the sequencing instrument as inputto its model. Quality calibration, as described in (15) canalso be used to further refine these values and reduce bias.For variant bases, a user-defined threshold T (default Q20or 1% error rate) was used to conservatively remove baseswith quality below the threshold and variant bases wereassigned a quality of T. In the absence of user-providedquality values, LoFreq models error rates for all 12possible base substitution classes (PX>Y, X 6¼ Y) and esti-mates them using an Expectation–Maximization (EM)approach (34). For this, each column (C) was assumedto come from one of two models, either a referencebase with a 12-parameter model for sequencing error (R)or a variant column (V, i.e. ZC 2 {R,V}). During thetraining phase, error probabilities for all substitutionclasses are learnt directly from the data: the expectationstep calls SNVs using a binomial test (Bonferroni-corrected P-value< 0.05) with the current errorprobabilities and the maximization step updates theerror probabilities based on base counts in columnsin which the respective substitution class was notcalled a SNV (i.e. PX4Y ¼ ð
PZC¼R;bðCÞ¼X nCYÞ=
ðP
ZC¼R;bðCÞ¼X nCXÞ, where b(C) is the reference base incolumn C and nCY is the number of Y bases seen incolumn C; this assignment can be shown to maximizethe likelihood function). The maximization and expect-ation steps are iterated until error probabilities converge(<10�9). For final SNV calling, the expectation step wasused with the converged error probabilities. This
EM-based approach (LoFreq-NQ) is faster and more sen-sitive (but has higher false-positive rates; data not shown)and can be employed when quality values are missing orunreliable.
Calling somatic/sample-specific variantsIn order to identify sample-specific variants (say somaticin A when compared with tissue B), LoFreq employs thefollowing approach: (1) variants called in Sample A arethen tested in B and (2) variants that are not called in B byLoFreq are further tested to see if this could be because ofinadequate read coverage in B (using a binomial test withSNV frequency from A). Variants that pass this test arethen reported as being specific to/somatic in A.
Flagging strand biasAnalogous to the tests in other methods (14,27,29),LoFreq allows the user to identify variant positionsmarked by a significant bias in the strand from whichthe supporting reads are derived. It does so by doing atwo-tailed Fisher’s exact test of the hypothesis thatvariant-base forward and reverse strand counts comefrom the same distribution as the consensus base. A usercan then choose to ignore variants with high strand bias(low P-value; Holm–Bonferroni corrected for multiple-hypothesis testing).
Dengue data analysis
For mapping of DENV2 cell-culture sequencing reads, weused RefSeq sequence NC_001474. Reads of the clinicalDENV1 and DENV2 samples were mapped againstGenbank sequences FJ410275 and EU660415, respectively.Reads were uniquely mapped using RazerS version 1.0 (35)against the respective reference, with the recognition rateset to 100%, allowing no indels. A two-step mappingapproach (following the recipe in Nguyet et al. (31)) wasused in which a consensus was derived from the initialmapping, which was then used as reference in a secondstep. For this, we gradually lowered RazerS’ identitythresholds in 2% steps from the default of 92%. Updatedmappings were kept if the number of newly mapped readsincreased by at least 1%. Base-quality values wererecalibrated using GATK (15) Version 1.0.5336 andQualityScore, Cycle and Dinucleotide covariates (exceptfor the simulated sequences). For this, sites showing a vari-ation of at least 1% variation were marked as ‘known’variations. Primer positions with coverage spikes wereexcluded from SNV calling and reads mapping there wereexcluded during quality recalibration.
Shift in mutation frequenciesTo compare the frequency of C>N mutations in theplacebo group versus the drug group, for each pairedsample (Table 3) we called SNVs in pre- and post-dosesamples using LoFreq. We then subtracted the sum ofSNV frequencies from pre-dose samples from the sumfor post-dose samples and normalized by the time differ-ence and the number of cytosine bases in the consensussequence. The resulting numbers (a measure of averagemutation rate) were compared for drug and placebogroup pairs using the Mann–Whitney test.
11192 Nucleic Acids Research, 2012, Vol. 40, No. 22
Hotspots and cold-spotsFor identifying mutational hotspots, we used a scanningwindow approach to scan the dengue virus genome foreach sample (window size of 20 and an overlap of fivenucleotides) to look for an excess of SNVs in a windowcompared with the genome-wide average (binomial test;Bonferroni-corrected P-value< 0.05). For cold-spots, wepooled SNVs from all samples and scanned for windows(minimum size of 40) with a depletion of SNVs (binomialtest; Bonferroni-corrected P-value< 0.05).
Escherichia coli data analysis
Simulated reads were generated using Metasim (RefSeqentry NC_000913 as reference) with error rates andnumber of reads set to those observed from the realdataset. Reads from the simulated and real datasets wereuniquely mapped against RefSeq entry NC_000913 usingBWA (36), which resulted in an average coverage of�560�. Quality recalibration was performed for the realdataset in the same way as was done for the dengue data.The real dataset was assumed to be genetically clonal withno true rare SNVs to be detected.
Gastric cancer data analysis
Mitochondrial heteroplasmyReads mapping against the mitochondrial genome wereextracted from the hg18-mapped BAM files and strin-gently remapped (BWA unique) against the Cambridgereference (37) to allow for easy comparison withMitomap entries. This was followed by quality recalibra-tion (as was done for the dengue data) and SNV callingusing LoFreq.
Whole-genome sequencing dataFor the analysis of the whole-genome sequencing data, weapplied the same filtering rules for samtools (Version0.1.18; (14)) and LoFreq to allow for a fair comparison.Specifically, we set the coverage cap to 10 000, removed anybases with a quality <13 (samtools default correspondingto an error rate of 5%), removed predicted SNVs with aquality <40 (0.01% error rate) and removed SNVs if morethan three are present in a window of 20 bp, to reduceindel-associated artifacts. No extra strand-bias filter wasapplied. SNP calls for validation were obtained usingdata from a Illumina Human610-Quadv1 array (32).Positive predictive value (PPV) was computed as thefraction of samtools or LoFreq calls at array positionsthat were concordant with the SNP array and sensitivitywas measured as the fraction of genotyped positions thatwere correctly called by the variant callers.
Exome sequencing dataSomatic SNVs were called with LoFreq and comparedwith the calls made using a samtools-based pipeline (32).Specifically, a somatic variant was reported for a variantcall unique to the tumor, where the normal genotypecalled by samtools was different and where less than tworeads of the variant genotype were seen in the normalsample. P-values for somatic SNV calls produced byLoFreq were Bonferroni corrected and if more than
three SNPs where present in a window of 20 bp, theywere removed to reduce indel-associated artifacts (thiswas done for the samtools calls as well).
Parameters for SNV calling
Goto et al. and Wright et al.In order to enable comparisons with the methodsdescribed in these publications—which were chosen asrepresentatives for non-model-based algorithms—were-implemented them and these are now available aspart of the LoFreq package.
SNVerWe used SNVer Version 0.3.1, which automatically deter-mines error rates, whereas the original version needed afixed, user-defined sequencing error threshold (29). TheSNVerIndividual.jar module was used for SNV calling.The number of haploids was set to 1 and the alt/refratio threshold was set to 0.0 to switch off filtering ofvariants with frequencies below the default of 25%.
BreseqWe used Breseq Version 0.18 (27,28) and switched on its‘polymorphism-prediction’ function for calling variants.Note that Breseq is an end-to-end protocol for theanalysis of microbial short-read data with many morefeatures, but here we only used its ability to predict sub-stitutions. We ran the full Breseq pipeline (SSAHA2Version 2.5.5 for mapping), starting from the unmappedreads and parsed SNVs from the final html output. Whereit made sense to use Breseq’s stand-alone variant caller(e.g. in the runtime comparison), we used this versionand denote it as ‘Breseq*’.
LoFreqLoFreq takes a samtools pileup as input (samtoolsmpileup; Version 0.1.18). By default samtools applies acoverage cap and we set this to be sufficiently high toavoid filtering reads in a sample (-d 100000). Wheneverindels were not allowed for read mapping, we switchedoff samtools BAQ computation (-B). SNVs were calledwith a Bonferroni-corrected P-value threshold of 0.05and the same threshold was applied for calling somaticvariants with the binomial test. Unless stated otherwise,we removed variant positions with a significant strandbias (Holm–Bonferroni-corrected P-value< 0.05) fromLoFreq predictions.
Availability of datasets
All simulated and sequencing datasets generated in thisstudy can be downloaded from http://collaborations.gis.a-star.edu.sg/�wilma/lofreq_paper_data/ and sequencingdata will be available soon from the Sequence Read Archive.
RESULTS
Sensitivity/specificity tradeoffs and detection limits
To benchmark LoFreq against existing methods (SNVer,Breseq, Goto et al. (38) and Wright et al. (23)), we con-structed several in silico datasets with varying
Nucleic Acids Research, 2012, Vol. 40, No. 22 11193
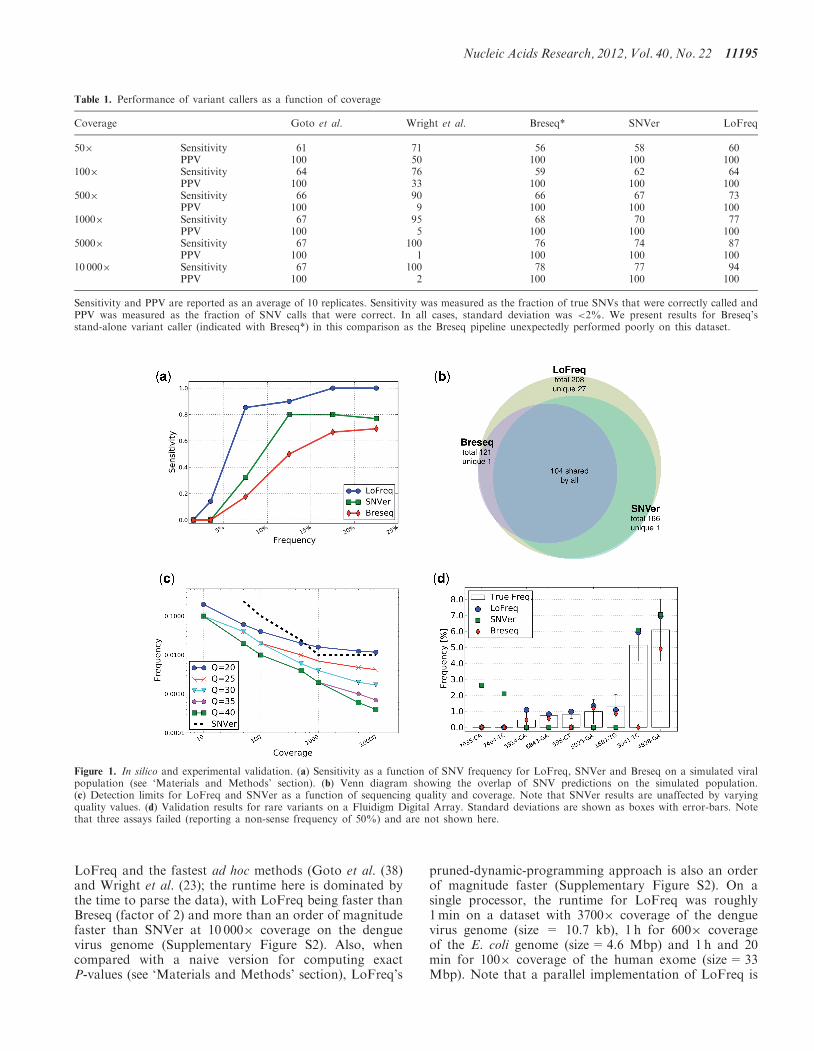
characteristics. In particular, we constructed datasets withsimulated reads mimicking the characteristics of the denguevirus sequencing datasets in this study (see ‘Materials andMethods’ section) and designed to contain 10 haplotypeswith the rarest being represented at a frequency of 0.1%.These datasets allowed us to investigate the performance ofthe various methods as a function of sequencing coverage(from 50� to 10000�). Overall, the heuristic approachesperformed poorly in terms of sensitivity (Goto et al.) orPPV (Wright et al.), while all the model-based approaches(SNVer, Breseq and LoFreq) had perfect PPV and there-fore perfect specificity (Table 1). LoFreq was also the mostsensitive method with perfect specificity and called 96% ofvariants at 0.2% frequency with 10000� coverage(compared with 0 and 8% for SNVer and Breseq, respect-ively). As expected, with lower coverage, sensitivity fell forall methods but LoFreq continued to improve on resultsfrom SNVer and Breseq. These results highlight the utilityof the quality-aware approach in LoFreq for being able toexploit information present in high-coverage sequencingdatasets to call variants with high sensitivity and specificity.In order to more closely mimic the biases in sequencing
read coverage and base qualities, we also created‘simulated population’ datasets using real sequencingdata (see ‘Materials and Methods’ section). As beforeSNVer, Breseq and LoFreq had perfect specificity, butLoFreq consistently detects the highest number of trueSNVs in all frequency ranges (Figure 1a). A strikingaspect of these results is that even for SNVs with fre-quency >10%, LoFreq finds >40 variants that aremissed by SNVer and Breseq, providing a 10–20% boostin sensitivity in this range (Figure 1a). In fact, predictionsmade by Breseq and SNVer were found to be essentially asubset of LoFreq’s prediction (Figure 1b) with LoFreqincreasing overall sensitivity by 25 and 71% comparedwith SNVer and Breseq, respectively.The detection limits of rare variant-calling methods
have not been systematically assessed before and thegeneral assumption has been that variants at a frequencylower than the average error rate in a dataset are likely tobe undetectable (23). To study this aspect further, weevaluated the methods on datasets with controlledcoverage values and counts for non-reference bases (see‘Materials and Methods’ section). Our results show thatLoFreq successfully exploits high-coverage (10 000�) andhigh-quality (Q40) sequencing data and calls variantswith frequency as low as 0.05% under these conditions(Figure 1c). In contrast, the model-based approachin SNVer had a substantially higher detection limit (1%)that was unaffected by the quality of the data (Figure 1c).LoFreq’s ability to automatically tune its stringency thusallows it to adjust to local variations in sequencing qualityand maximize its power to detect variants.
Robustness and false-positive rates
We further evaluated LoFreq and other variant-callingmethods on several large sequencing datasets (viral, bac-terial and human). In particular, we applied the methodsto six technical replicates of DENV2 cell-culture isolatesto measure the robustness and reproducibility of their
results (see ‘Materials and Methods’ section). In thisanalysis, all methods did well in terms of reproducibility(% of SNVs called in at least two replicates) but LoFreqwas the most sensitive among them, calling twice as manyvariants on average compared with SNVer (Table 2). Forrobustness, LoFreq results on the pooled data werenearly a superset of the individual calls (SupplementaryFigure S1) and were as robust as the calls for SNVer(Table 2). The analysis here suggests that sensitivity isthe major limiting factor for variant callers. In addition,the presence of SNVs seen in two or more replicates, butnot in all six replicates (Supplementary Figure S1),suggests that sequencing coverage may be a bottleneckto fully capture true variants in the population.
Our results from simulated and real datasets suggestthat LoFreq is a conservative as well as an ultra-sensitivevariant caller. To characterize the false-positive rates forLoFreq further, we analyzed simulated as well as real datafor an E. coli clone (560� coverage; see ‘Materials andMethods’ section). With over 4.6 million positions, theE. coli genome provides a larger test case and withsimulated reads, LoFreq reported no false-positive calls.From the sequencing data, Breseq, LoFreq and SNVerreported 79, 2 and 0, potentially false-positive variants,respectively. It is possible that some of these SNVs arein fact real as it is known that ‘clonal’ bacterial popula-tions evolve under laboratory conditions (27), maintainingvariation even in equilibrium conditions in chemostats(39,40). Nevertheless, our results suggest that all threemethods are conservative and that LoFreq has low false-positive rates (<0.00005% in this dataset).
While LoFreq was designed with applications to high-coverage sequencing of viral or bacterial genomes in mind,it is generic and fast enough to be applied to largegenomes and low-coverage datasets as well. To highlightthis, we analyzed whole-genome sequencing data for twogastric adenocarcinoma samples (�30� coverage; (32))with LoFreq and compared results with those from acommonly used genotype caller on human re-sequencingdatasets, samtools (14) (using SNP quality threshold of 40and identical filtering rules; see ‘Materials and Methods’section). Interestingly, we found that LoFreq’s predictionswere an almost perfect superset of those made by samtools(>99.7% of samtools predictions are shared withLoFreq), while >14% of LoFreq’s predictions wereunique to it. Overall, LoFreq had similar precision assamtools (PPV=99.8% for both methods and datasets),but higher sensitivity (�99% versus �95% on bothdatasets) as measured on a SNP array (see ‘Materialsand Methods’ section). These results provide the basisfor applying LoFreq to sensitively and accurately callsomatic variants from paired tumor/normal sequencingdatasets (as discussed later) and note that this comparisonis not meant to suggest that LoFreq can be used agenotype caller, as is the case for samtools.
Runtime efficiency
Similar to other variant callers, LoFreq’s runtime scaleslinearly with the size of the genome. Runtime increases asa function of the depth of coverage was similar between
11194 Nucleic Acids Research, 2012, Vol. 40, No. 22
LoFreq and the fastest ad hoc methods (Goto et al. (38)and Wright et al. (23); the runtime here is dominated bythe time to parse the data), with LoFreq being faster thanBreseq (factor of 2) and more than an order of magnitudefaster than SNVer at 10 000� coverage on the denguevirus genome (Supplementary Figure S2). Also, whencompared with a naive version for computing exactP-values (see ‘Materials and Methods’ section), LoFreq’s
pruned-dynamic-programming approach is also an orderof magnitude faster (Supplementary Figure S2). On asingle processor, the runtime for LoFreq was roughly1min on a dataset with 3700� coverage of the denguevirus genome (size = 10.7 kb), 1 h for 600� coverageof the E. coli genome (size=4.6 Mbp) and 1 h and 20min for 100� coverage of the human exome (size=33Mbp). Note that a parallel implementation of LoFreq is
Figure 1. In silico and experimental validation. (a) Sensitivity as a function of SNV frequency for LoFreq, SNVer and Breseq on a simulated viralpopulation (see ‘Materials and Methods’ section). (b) Venn diagram showing the overlap of SNV predictions on the simulated population.(c) Detection limits for LoFreq and SNVer as a function of sequencing quality and coverage. Note that SNVer results are unaffected by varyingquality values. (d) Validation results for rare variants on a Fluidigm Digital Array. Standard deviations are shown as boxes with error-bars. Notethat three assays failed (reporting a non-sense frequency of 50%) and are not shown here.
Table 1. Performance of variant callers as a function of coverage
Coverage Goto et al. Wright et al. Breseq* SNVer LoFreq
50� Sensitivity 61 71 56 58 60PPV 100 50 100 100 100
100� Sensitivity 64 76 59 62 64PPV 100 33 100 100 100
500� Sensitivity 66 90 66 67 73PPV 100 9 100 100 100
1000� Sensitivity 67 95 68 70 77PPV 100 5 100 100 100
5000� Sensitivity 67 100 76 74 87PPV 100 1 100 100 100
10 000� Sensitivity 67 100 78 77 94PPV 100 2 100 100 100
Sensitivity and PPV are reported as an average of 10 replicates. Sensitivity was measured as the fraction of true SNVs that were correctly called andPPV was measured as the fraction of SNV calls that were correct. In all cases, standard deviation was <2%. We present results for Breseq’sstand-alone variant caller (indicated with Breseq*) in this comparison as the Breseq pipeline unexpectedly performed poorly on this dataset.
Nucleic Acids Research, 2012, Vol. 40, No. 22 11195
straightforward and would provide further runtime im-provements for large genomes.
Experimental validation
Validation of low-frequency SNVs reported by variantcallers is a challenging task and one that has not beenattempted before in published methods (21–24,27,29). Therecent availability of micro-fluidic digital PCR systems hasmade this more accessible but significant cost limitationsand technical challenges remain for large-scale validation.As a proof-of-principle, we designed an experiment on theFluidigm Digital ArrayTM (Fluidigm) based on 12randomly chosen SNVs with discordant calls fromLoFreq, SNVer and Breseq on two replicate dengue virussequencing datasets (see ‘Materials and Methods’ section;Supplementary Figure S3). Strikingly, LoFreq predictionswere validated in all experiments (nine out of nine validcalls; Figure 1d) with the rarest SNV detected by LoFreqbeing just <0.5% in frequency. Also, the frequenciesestimated by LoFreq were within the experimentallypredicted ranges in all cases. In contrast, Breseq wascorrect in seven out of nine predictions while SNVer wasonly able to correctly call two of the higher frequencyvariants (Figure 1d). Despite being the most conservativevariant caller on the simulated datasets, SNVer had twofalse-positive calls on this dataset.As an additional validation, we designed an experiment
on the Sequenom MassArray iPLEX platform for testing92 variant positions in 18 clinical and 4 cell-culture denguevirus samples (see ‘Materials and Methods’ section). Intotal, 1474 variant position/sample combinations weretested in this experiment. All calls made by SequenomMassArray were also captured in the results fromLoFreq (5/5) indicating that the Type II error rate forLoFreq is likely to be low. SNVer also detected all fivecalls and Breseq detected four out of five calls. Theseresults highlight the fact that LoFreq calls (andSNVer’s) are likely to be at least as sensitive as thiscommonly used mass-spectrometry-based gold-standardfor validating SNVs.
Application: tumor heterogeneity in gastric cancer
High-coverage exome and whole-genome sequencingdatasets for matched tumor and normal samples fromcancer patients are increasingly being generated to
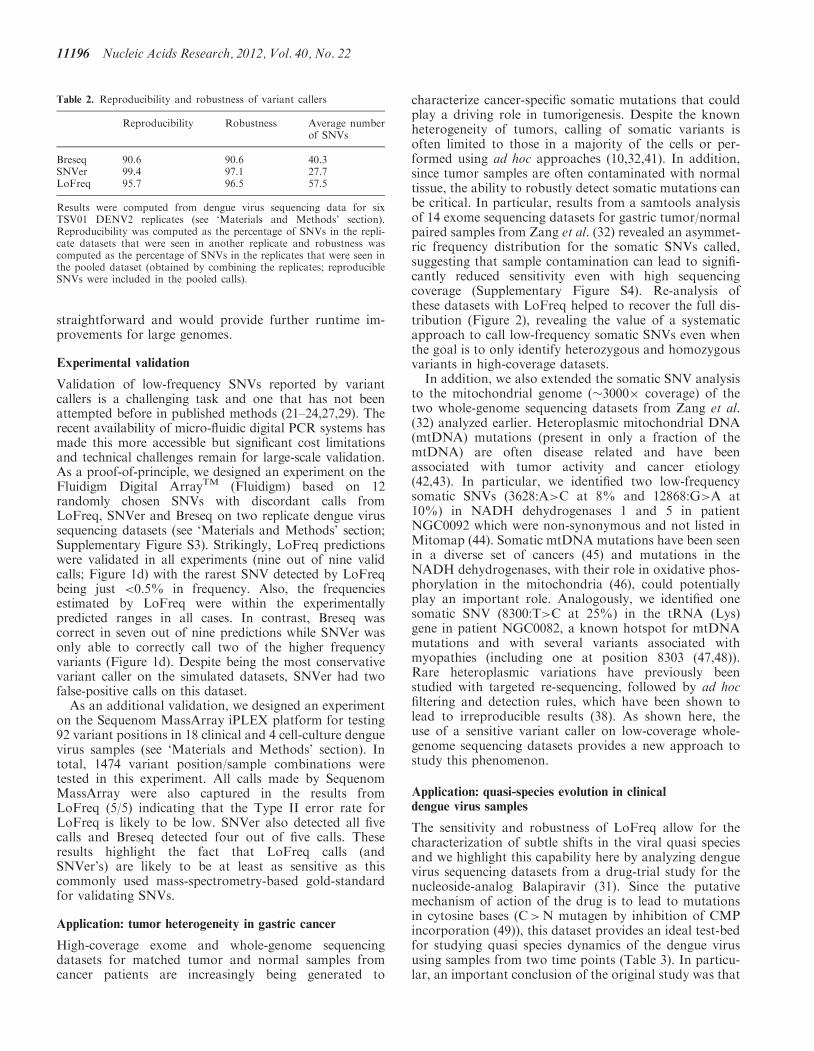
characterize cancer-specific somatic mutations that couldplay a driving role in tumorigenesis. Despite the knownheterogeneity of tumors, calling of somatic variants isoften limited to those in a majority of the cells or per-formed using ad hoc approaches (10,32,41). In addition,since tumor samples are often contaminated with normaltissue, the ability to robustly detect somatic mutations canbe critical. In particular, results from a samtools analysisof 14 exome sequencing datasets for gastric tumor/normalpaired samples from Zang et al. (32) revealed an asymmet-ric frequency distribution for the somatic SNVs called,suggesting that sample contamination can lead to signifi-cantly reduced sensitivity even with high sequencingcoverage (Supplementary Figure S4). Re-analysis ofthese datasets with LoFreq helped to recover the full dis-tribution (Figure 2), revealing the value of a systematicapproach to call low-frequency somatic SNVs even whenthe goal is to only identify heterozygous and homozygousvariants in high-coverage datasets.
In addition, we also extended the somatic SNV analysisto the mitochondrial genome (�3000� coverage) of thetwo whole-genome sequencing datasets from Zang et al.(32) analyzed earlier. Heteroplasmic mitochondrial DNA(mtDNA) mutations (present in only a fraction of themtDNA) are often disease related and have beenassociated with tumor activity and cancer etiology(42,43). In particular, we identified two low-frequencysomatic SNVs (3628:A>C at 8% and 12868:G>A at10%) in NADH dehydrogenases 1 and 5 in patientNGC0092 which were non-synonymous and not listed inMitomap (44). Somatic mtDNA mutations have been seenin a diverse set of cancers (45) and mutations in theNADH dehydrogenases, with their role in oxidative phos-phorylation in the mitochondria (46), could potentiallyplay an important role. Analogously, we identified onesomatic SNV (8300:T>C at 25%) in the tRNA (Lys)gene in patient NGC0082, a known hotspot for mtDNAmutations and with several variants associated withmyopathies (including one at position 8303 (47,48)).Rare heteroplasmic variations have previously beenstudied with targeted re-sequencing, followed by ad hocfiltering and detection rules, which have been shown tolead to irreproducible results (38). As shown here, theuse of a sensitive variant caller on low-coverage whole-genome sequencing datasets provides a new approach tostudy this phenomenon.
Application: quasi-species evolution in clinicaldengue virus samples
The sensitivity and robustness of LoFreq allow for thecharacterization of subtle shifts in the viral quasi speciesand we highlight this capability here by analyzing denguevirus sequencing datasets from a drug-trial study for thenucleoside-analog Balapiravir (31). Since the putativemechanism of action of the drug is to lead to mutationsin cytosine bases (C>N mutagen by inhibition of CMPincorporation (49)), this dataset provides an ideal test-bedfor studying quasi species dynamics of the dengue virususing samples from two time points (Table 3). In particu-lar, an important conclusion of the original study was that
Table 2. Reproducibility and robustness of variant callers
Reproducibility Robustness Average numberof SNVs
Breseq 90.6 90.6 40.3SNVer 99.4 97.1 27.7LoFreq 95.7 96.5 57.5
Results were computed from dengue virus sequencing data for sixTSV01 DENV2 replicates (see ‘Materials and Methods’ section).Reproducibility was computed as the percentage of SNVs in the repli-cate datasets that were seen in another replicate and robustness wascomputed as the percentage of SNVs in the replicates that were seen inthe pooled dataset (obtained by combining the replicates; reproducibleSNVs were included in the pooled calls).
11196 Nucleic Acids Research, 2012, Vol. 40, No. 22
despite encouraging results in in vitro studies, the drug didnot work as expected in vivo (31). To investigate thisaspect further, we compared the frequency of C>N mu-tations in the placebo group versus the drug group (see‘Materials and Methods’ section) in dengue virus serotype1, 2 and 3 (DENV1, DENV2 and DENV3) samples usingLoFreq SNV calls (see ‘Materials and Methods’ section).
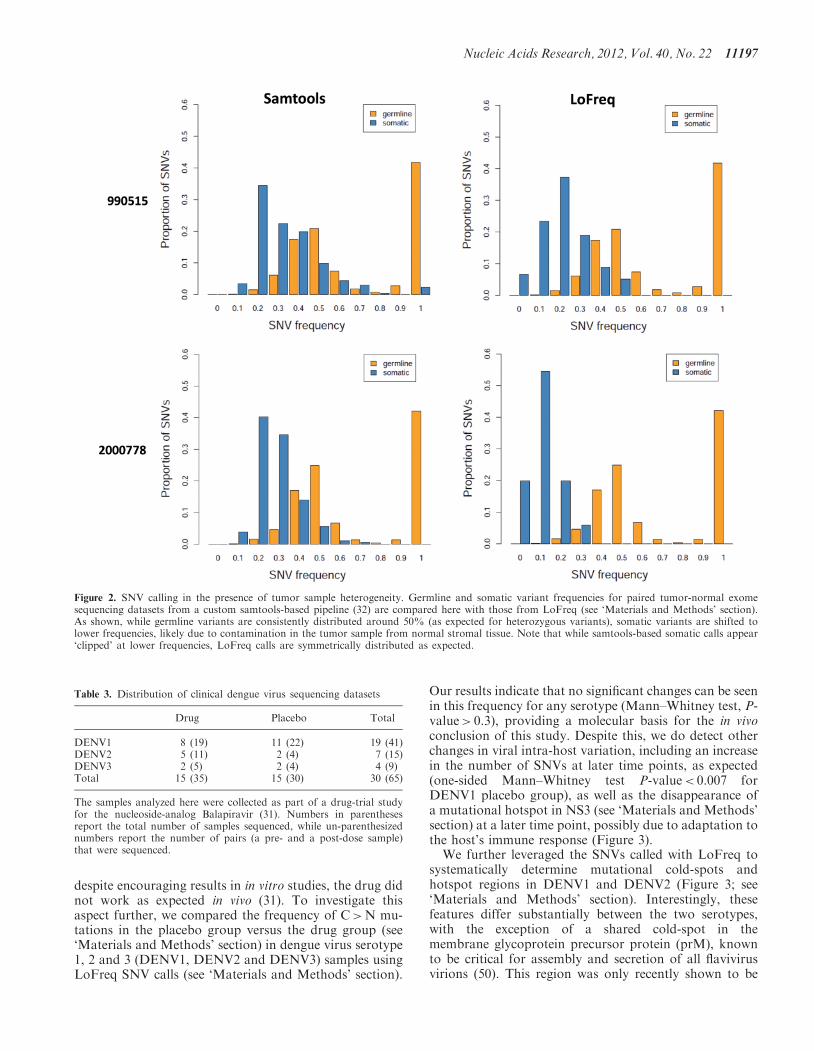
Our results indicate that no significant changes can be seenin this frequency for any serotype (Mann–Whitney test, P-value> 0.3), providing a molecular basis for the in vivoconclusion of this study. Despite this, we do detect otherchanges in viral intra-host variation, including an increasein the number of SNVs at later time points, as expected(one-sided Mann–Whitney test P-value< 0.007 forDENV1 placebo group), as well as the disappearance ofa mutational hotspot in NS3 (see ‘Materials and Methods’section) at a later time point, possibly due to adaptation tothe host’s immune response (Figure 3).We further leveraged the SNVs called with LoFreq to
systematically determine mutational cold-spots andhotspot regions in DENV1 and DENV2 (Figure 3; see‘Materials and Methods’ section). Interestingly, thesefeatures differ substantially between the two serotypes,with the exception of a shared cold-spot in themembrane glycoprotein precursor protein (prM), knownto be critical for assembly and secretion of all flavivirusvirions (50). This region was only recently shown to be
Figure 2. SNV calling in the presence of tumor sample heterogeneity. Germline and somatic variant frequencies for paired tumor-normal exomesequencing datasets from a custom samtools-based pipeline (32) are compared here with those from LoFreq (see ‘Materials and Methods’ section).As shown, while germline variants are consistently distributed around 50% (as expected for heterozygous variants), somatic variants are shifted tolower frequencies, likely due to contamination in the tumor sample from normal stromal tissue. Note that while samtools-based somatic calls appear‘clipped’ at lower frequencies, LoFreq calls are symmetrically distributed as expected.
Table 3. Distribution of clinical dengue virus sequencing datasets
Drug Placebo Total
DENV1 8 (19) 11 (22) 19 (41)DENV2 5 (11) 2 (4) 7 (15)DENV3 2 (5) 2 (4) 4 (9)Total 15 (35) 15 (30) 30 (65)
The samples analyzed here were collected as part of a drug-trial studyfor the nucleoside-analog Balapiravir (31). Numbers in parenthesesreport the total number of samples sequenced, while un-parenthesizednumbers report the number of pairs (a pre- and a post-dose sample)that were sequenced.
Nucleic Acids Research, 2012, Vol. 40, No. 22 11197
conserved across flaviviruses (51), though this conserva-tion cannot be readily observed from an alignment of>2900 complete dengue virus genomes available inGenBank (Supplementary Figure S5). Comparison ofclinical and cell-culture samples for DENV2 alsorevealed a shared hotspot in the known variable regionof the 3-UTR (52), which has been shown to be dispens-able for replication in some host cell types (53).The value of cold-spot and hotspot analysis for iden-
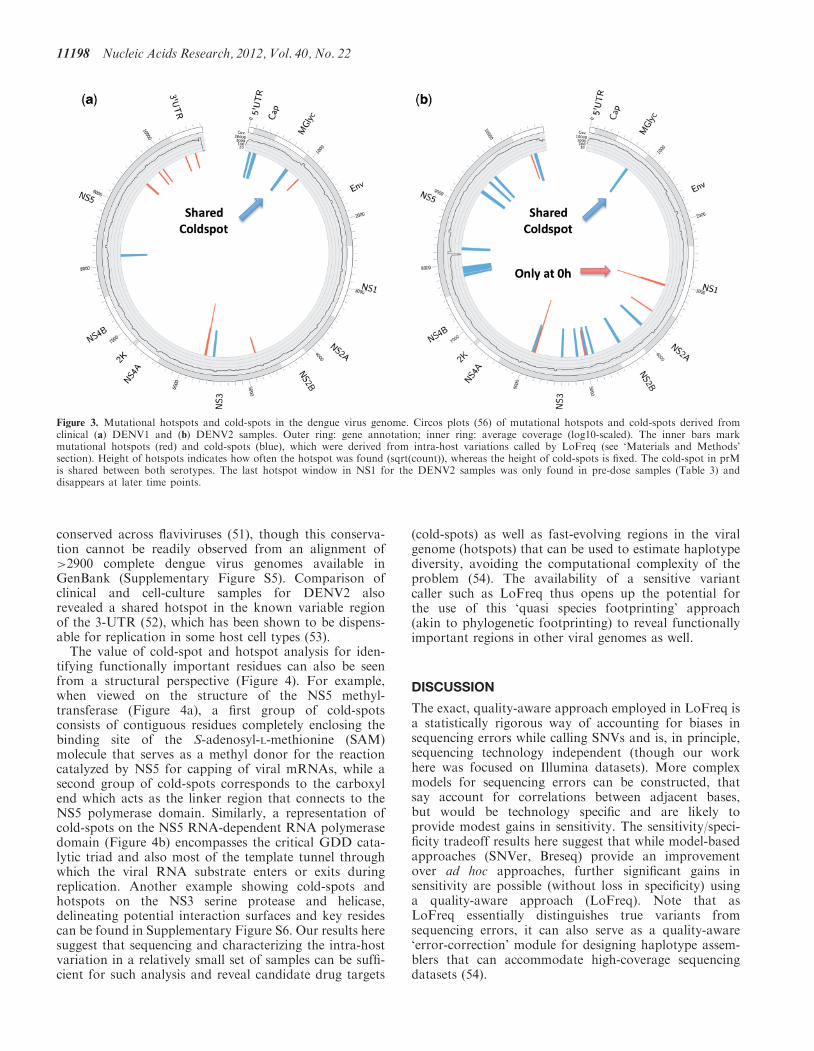
tifying functionally important residues can also be seenfrom a structural perspective (Figure 4). For example,when viewed on the structure of the NS5 methyl-transferase (Figure 4a), a first group of cold-spotsconsists of contiguous residues completely enclosing thebinding site of the S-adenosyl-L-methionine (SAM)molecule that serves as a methyl donor for the reactioncatalyzed by NS5 for capping of viral mRNAs, while asecond group of cold-spots corresponds to the carboxylend which acts as the linker region that connects to theNS5 polymerase domain. Similarly, a representation ofcold-spots on the NS5 RNA-dependent RNA polymerasedomain (Figure 4b) encompasses the critical GDD cata-lytic triad and also most of the template tunnel throughwhich the viral RNA substrate enters or exits duringreplication. Another example showing cold-spots andhotspots on the NS3 serine protease and helicase,delineating potential interaction surfaces and key residescan be found in Supplementary Figure S6. Our results heresuggest that sequencing and characterizing the intra-hostvariation in a relatively small set of samples can be suffi-cient for such analysis and reveal candidate drug targets
(cold-spots) as well as fast-evolving regions in the viralgenome (hotspots) that can be used to estimate haplotypediversity, avoiding the computational complexity of theproblem (54). The availability of a sensitive variantcaller such as LoFreq thus opens up the potential forthe use of this ‘quasi species footprinting’ approach(akin to phylogenetic footprinting) to reveal functionallyimportant regions in other viral genomes as well.
DISCUSSION
The exact, quality-aware approach employed in LoFreq isa statistically rigorous way of accounting for biases insequencing errors while calling SNVs and is, in principle,sequencing technology independent (though our workhere was focused on Illumina datasets). More complexmodels for sequencing errors can be constructed, thatsay account for correlations between adjacent bases,but would be technology specific and are likely toprovide modest gains in sensitivity. The sensitivity/speci-ficity tradeoff results here suggest that while model-basedapproaches (SNVer, Breseq) provide an improvementover ad hoc approaches, further significant gains insensitivity are possible (without loss in specificity) usinga quality-aware approach (LoFreq). Note that asLoFreq essentially distinguishes true variants fromsequencing errors, it can also serve as a quality-aware‘error-correction’ module for designing haplotype assem-blers that can accommodate high-coverage sequencingdatasets (54).
Figure 3. Mutational hotspots and cold-spots in the dengue virus genome. Circos plots (56) of mutational hotspots and cold-spots derived fromclinical (a) DENV1 and (b) DENV2 samples. Outer ring: gene annotation; inner ring: average coverage (log10-scaled). The inner bars markmutational hotspots (red) and cold-spots (blue), which were derived from intra-host variations called by LoFreq (see ‘Materials and Methods’section). Height of hotspots indicates how often the hotspot was found (sqrt(count)), whereas the height of cold-spots is fixed. The cold-spot in prMis shared between both serotypes. The last hotspot window in NS1 for the DENV2 samples was only found in pre-dose samples (Table 3) anddisappears at later time points.
11198 Nucleic Acids Research, 2012, Vol. 40, No. 22
Our experimental validation results confirm that therare variants discovered by LoFreq are indeed real (withthe rarest being at a frequency of 0.5%) and that LoFreqmay provide a sensitivity boost on even low-coveragewhole-genome sequencing datasets. Despite not relyingon any approximations, LoFreq is fast and genericenough to be applied to high-coverage human whole-exome and genome sequencing datasets and thus has ap-plications beyond the analysis of low-frequency variants inviral and microbial sequencing datasets. The ability to callrare somatic variants, in particular, can be valuable ingenomic studies of tumor heterogeneity and evolution aswell as in emerging applications such as in tumor moni-toring by sequencing of cell-free DNA (55). LoFreq’s sen-sitivity can help detect subtle shifts in cell populations andthus be valuable for sequencing-based monitoring andevolutionary studies of viral, bacterial and cancer samples.
The ability to call rare variants is dictated in general byboth sequencing quality and read coverage and LoFreqallows the user to exploit local variations in both param-eters. More extensive simulations of the sort depicted inFigure 1c can be employed by a user to help guide experi-mental design when the goal is to capture SNVs at acertain frequency. LoFreq is based on calibrated qualityvalues that are commonly generated from sequencing dataand where this is not feasible, conservative quality valuesor an estimate of average quality values (as used inLoFreq-NQ; see ‘Materials and Methods’ section) canbe employed with an accompanying loss in sensitivityand specificity, respectively.
While sequencing quality is a key for correctly callingSNVs, indel variants are more likely to be influenced byalignment quality. LoFreq’s variant-calling model couldbe extended to indels (and other classes of variants) if
the probability of error in a variant-supporting read canbe encoded in a suitably computed quality value. Also, incalling SNVs, LoFreq requires unique read mappings andhigh-quality alignments, similar to other variant callers.Calling rare SNVs in regions with non-unique mappingsand alignment uncertainty represents a significant tech-nical challenge and is a potential direction for future ex-tensions to LoFreq.
SUPPLEMENTARY DATA
Supplementary Data are available at NAR Online:Supplementary Figures 1–6.
ACKNOWLEDGMENTS
We thank the authors of SNVer and Breseq for help withrunning their programs. We also thank Drs Daniel Chin,Hans Bitter, Lore Gruenbaum, Erik Rasmussen and TomChu at Hoffmann-La Roche Inc. as well as the PP22799study team for the clinical Dengue samples. Drs SwaineChen and Shyam Prabhakar provided insightfulcomments and suggestions on a draft of this article.M.L.H and N.N. conceived and designed the project.P.P.K.A. conducted library preparation and sequencingof dengue samples. C.C.K., C.H.W. and P.P.K.A.designed and conducted the validation experiments. D.B.analyzed the gastric cancer datasets. G.H.T.Y. imple-mented LoFreq-NQ and A.W. implemented LoFreq.A.W. analyzed all other datasets. A.W. and N.N. wrotethe draft manuscript. All authors contributed to the finalmanuscript.
Figure 4. Structural view of hot and cold-spots in the dengue virus genome. (a) Surface representation of dengue virus NS5 methyltransferase (PDBaccession number 1R6A). The nucleoside-analog ribavirin 50-triphosphate (RTP) is shown in blue and the by-product of S-adenosyl-L-methionine(SAM) after the transfer of a methyl group, S-adenosyl-L-homocysteine (SAH), is in red, both in ball-and-stick representation. Cold-spots are coloredin violet. The first group of cold-spots consists of contiguous residues which completely enclose the binding site for SAM. SAM molecules serve as amethyl donor in the reaction catalyzed by the NS5 methyltransferase, which results in the capping of viral mRNAs. The second group of cold-spotscorresponds to the carboxyl end of the NS5 methyltransferase which act as the linker region that connects the domain to the NS5 polymerasedomain. (b) Surface representation of dengue virus NS5 RNA-dependent RNA polymerase (PDB accession number 2J7W). The GDD catalytic triadis colored in red whereas the cold-spots identified from SNV analysis are colored in violet. Cold-spots include the dengue virus NS5 RNA-dependentRNA polymerase GDD catalytic triad and also parts of the template tunnel through which the viral RNA substrate enters and exits duringreplication.
Nucleic Acids Research, 2012, Vol. 40, No. 22 11199
FUNDING
Funding for open access charge: Agency for ScienceTechnology and Research (A*STAR), Singapore.
Conflict of interest statement. None declared.
REFERENCES
1. Eigen,M. (1971) Selforganization of matter and the evolution ofbiological macromolecules. Die Naturwissenschaften, 58, 465–523.
2. Thai,K.T.D., Henn,M.R., Zody,M.C., Tricou,V., Nguyet,N.M.,Charlebois,P., Lennon,N.J., Green,L., de Vries,P.J., Hien,T.T.et al. (2012) High-resolution analysis of intrahost genetic diversityin dengue virus serotype 1 infection identifies mixed infections.J. Virol., 86, 835–843.
3. Lee,H.H., Molla,M.N., Cantor,C.R. and Collins,J.J. (2010)Bacterial charity work leads to population-wide resistance.Nature, 467, 82–85.
4. Toprak,E., Veres,A., Michel,J.-B., Chait,R., Hartl,D.L. andKishony,R. (2012) Evolutionary paths to antibiotic resistanceunder dynamically sustained drug selection. Nat. Genet., 44,101–105.
5. Blaby,I.K., Lyons,B.J., Wroclawska-Hughes,E., Phillips,G.C.F.,Pyle,T.P., Chamberlin,S.G., Benner,S.A., Lyons,T.J., Crecy-Lagard,V. de and Crecy,E. de (2012) Experimental evolution of afacultative thermophile from a mesophilic ancestor. Appl. Environ.Microbiol., 78, 144–155.
6. Ding,L., Ellis,M.J., Li,S., Larson,D.E., Chen,K., Wallis,J.W.,Harris,C.C., McLellan,M.D., Fulton,R.S., Fulton,L.L. et al.(2010) Genome remodelling in a basal-like breast cancermetastasis and xenograft. Nature, 464, 999–1005.
7. Gerlinger,M., Rowan,A.J., Horswell,S., Larkin,J., Endesfelder,D.,Gronroos,E., Martinez,P., Matthews,N., Stewart,A., Tarpey,P.et al. (2012) Intratumor heterogeneity and branched evolutionrevealed by multiregion sequencing. New Eng. J. Med., 366,883–892.
8. Harismendy,O., Schwab,R.B., Bao,L., Olson,J., Rozenzhak,S.,Kotsopoulos,S.K., Pond,S., Crain,B., Chee,M.S., Messer,K. et al.(2011) Detection of low prevalence somatic mutations in solidtumors with ultra-deep targeted sequencing. Genome Biol., 12,R124.
9. Inda,M.-del-M., Bonavia,R., Mukasa,A., Narita,Y., Sah,D.W.Y.,Vandenberg,S., Brennan,C., Johns,T.G., Bachoo,R., Hadwiger,P.et al. (2010) Tumor heterogeneity is an active process maintainedby a mutant EGFR-induced cytokine circuit in glioblastoma.Genes Dev., 24, 1731–1745.
10. Ding,L., Ley,T.J., Larson,D.E., Miller,C.A., Koboldt,D.C.,Welch,J.S., Ritchey,J.K., Young,M.A., Lamprecht,T.,McLellan,M.D. et al. (2012) Clonal evolution in relapsed acutemyeloid leukaemia revealed by whole-genome sequencing. Nature,481, 506–510.
11. Suzuki,S., Ono,N., Furusawa,C., Ying,B.-W. and Yomo,T. (2011)Comparison of sequence reads obtained from threenext-generation sequencing platforms. PLoS One, 6, e19534.
12. Minoche,A.E., Dohm,J.C. and Himmelbauer,H. (2011) Evaluationof genomic high-throughput sequencing data generated onIllumina HiSeq and Genome Analyzer systems. Genome Biol., 12,R112.
13. Nakamura,K., Oshima,T., Morimoto,T., Ikeda,S., Yoshikawa,H.,Shiwa,Y., Ishikawa,S., Linak,M.C., Hirai,A., Takahashi,H. et al.(2011) Sequence-specific error profile of Illumina sequencers.Nucleic Acids Res., 39, e90.
14. Li,H., Handsaker,B., Wysoker,A., Fennell,T., Ruan,J., Homer,N.,Marth,G., Abecasis,G. and Durbin,R. (2009) The Sequencealignment/map format and SAMtools. Bioinformatics, 25,2078–2079.
15. McKenna,A., Hanna,M., Banks,E., Sivachenko,A., Cibulskis,K.,Kernytsky,A., Garimella,K., Altshuler,D., Gabriel,S., Daly,M.et al. (2010) The Genome Analysis Toolkit: a MapReduceframework for analyzing next-generation DNA sequencing data.Genome Res., 20, 1297–1303.
16. Nielsen,R., Paul,J.S., Albrechtsen,A. and Song,Y.S. (2011)Genotype and SNP calling from next-generation sequencing data.Nat. Rev. Genet., 12, 443–451.
17. Bansal,V. (2010) A statistical method for the detection of variantsfrom next-generation resequencing of DNA pools. Bioinformatics(Oxford, England), 26, i318–i324.
18. Druley,T.E., Vallania,F.L.M., Wegner,D.J., Varley,K.E.,Knowles,O.L., Bonds,J.A., Robison,S.W., Doniger,S.W.,Hamvas,A., Cole,F.S. et al. (2009) Quantification of rare allelicvariants from pooled genomic DNA. Nat. Methods, 6, 263–265.
19. Vallania,F.L.M., Druley,T.E., Ramos,E., Wang,J., Borecki,I.,Province,M. and Mitra,R.D. (2010) High-throughput discovery ofrare insertions and deletions in large cohorts. Genome Res., 20,1711–1718.
20. Koboldt,D.C., Chen,K., Wylie,T., Larson,D.E., McLellan,M.D.,Mardis,E.R., Weinstock,G.M., Wilson,R.K. and Ding,L. (2009)VarScan: variant detection in massively parallel sequencing ofindividual and pooled samples. Bioinformatics, 25, 2283–2285.
21. Cordey,S., Junier,T., Gerlach,D., Gobbini,F., Farinelli,L.,Zdobnov,E.M., Winther,B., Tapparel,C. and Kaiser,L. (2010)Rhinovirus genome evolution during experimental humaninfection. PLoS One, 5, e10588.
22. Eckerle,L.D., Becker,M.M., Halpin,R.A., Li,K., Venter,E., Lu,X.,Scherbakova,S., Graham,R.L., Baric,R.S., Stockwell,T.B. et al.(2010) Infidelity of SARS-CoV Nsp14-exonuclease mutant virusreplication is revealed by complete genome sequencing. PLoSPathog., 6, e1000896.
23. Wright,C.F., Morelli,M.J., Thebaud,G., Knowles,N.J., Herzyk,P.,Paton,D.J., Haydon,D.T. and King,D.P. (2011) Beyond theconsensus: dissecting within-host viral population diversity offoot-and-mouth disease virus by using next-generation genomesequencing. J. Virol., 85, 2266–2275.
24. Nasu,A., Marusawa,H., Ueda,Y., Nishijima,N., Takahashi,K.,Osaki,Y., Yamashita,Y., Inokuma,T., Tamada,T., Fujiwara,T.et al. (2011) Genetic heterogeneity of hepatitis C virus inassociation with antiviral therapy determined by ultra-deepsequencing. PLoS One, 6, e24907.
25. Lauring,A.S. and Andino,R. (2010) Quasispecies theory and thebehavior of RNA viruses. PLoS Pathog., 6, e1001005.
26. Neverov,A. and Chumakov,K. (2010) Massively parallelsequencing for monitoring genetic consistency and quality controlof live viral vaccines. Proc. Natl Acad. Sci. USA, 107,20063–20068.
27. Barrick,J.E., Yu,D.S., Yoon,S.H., Jeong,H., Oh,T.K.,Schneider,D., Lenski,R.E. and Kim,J.F. (2009) Genome evolutionand adaptation in a long-term experiment with Escherichia coli.Nature, 461, 1243–1247.
28. Barrick,J.E. and Lenski,R.E. (2009) Genome-wide mutationaldiversity in an evolving population of Escherichia coli. ColdSpring Harb. Symp. Quant. Biol., 74, 119–129.
29. Wei,Z., Wang,W., Hu,P., Lyon,G.J. and Hakonarson,H. (2011)SNVer: a statistical tool for variant calling in analysis of pooledor individual next-generation sequencing data. Nucleic Acids Res.,39, e132.
30. Macalalad,A.R., Zody,M.C., Charlebois,P., Lennon,N.J.,Newman,R.M., Malboeuf,C.M., Ryan,E.M., Boutwell,C.L.,Power,K.A., Brackney,D.E. et al. (2012) Highly sensitive andspecific detection of rare variants in mixed viral populations frommassively parallel sequence data. PLoS Comput. Biol., 8,e1002417.
31. Nguyen,N.M., Tran,C.N.B., Phung,L.K., Duong,K.T.H.,Huynh,H. le A., Farrar,J., Nguyen,Q.T.H., Tran,H.T.,Nguyen,C.V.V., Merson,L. et al. (2012) A randomized,double-blind placebo controlled trial of balapiravir, a polymeraseinhibitor, in adult dengue patients. J. Infect. Dis., August 30(doi:10.1093/infdis/jis470; epub ahead of print).
32. Zang,Z.J., Cutcutache,I., Poon,S.L., Zhang,S.L., McPherson,J.R.,Tao,J., Rajasegaran,V., Heng,H.L., Deng,N., Gan,A. et al. (2012)Exome sequencing of gastric adenocarcinoma identifies recurrentsomatic mutations in cell adhesion and chromatin remodelinggenes. Nat. Genet., 44, 570–574.
33. Richter,D., Ott,F., Auch,A. and Schmid,R. (2008) MetaSim: asequencing simulator for genomics and metagenomics. PLoS One,3, e3373.
11200 Nucleic Acids Research, 2012, Vol. 40, No. 22
34. Dempster,A.P., Dempster,A.P., Laird,N.M. and Rubin,D.B.(1977) Maximum likelihood from incomplete data via the EMalgorithm. J. Roy. Stat. Soc. B, 39, 1–38.
35. Weese,D., Emde,A.-K., Rausch,T., Doring,A. and Reinert,K.(2009) RazerS—fast read mapping with sensitivity control.Genome Res., 19, 1646–1654.
36. Li,H. and Durbin,R. (2009) Fast and accurate short readalignment with Burrows–Wheeler transform. Bioinformatics, 25,1754–1760.
37. Andrews,R.M., Kubacka,I., Chinnery,P.F., Lightowlers,R.N.,Turnbull,D.M. and Howell,N. (1999) Reanalysis and revision ofthe Cambridge reference sequence for human mitochondrialDNA. Nat. Genet., 23, 147.
38. Goto,H., Dickins,B., Afgan,E., Paul,I.M., Taylor,J., Makova,K.D.and Nekrutenko,A. (2011) Dynamics of mitochondrialheteroplasmy in three families investigated via a repeatablere-sequencing study. Genome Biol., 12, R59.
39. Maharjan,R., Seeto,S., Notley-McRobb,L. and Ferenci,T. (2006)Clonal adaptive radiation in a constant environment. Science,313, 514–517.
40. Beardmore,R.E., Gudelj,I., Lipson,D.A. and Hurst,L.D. (2011)Metabolic trade-offs and the maintenance of the fittest and theflattest. Nature, 472, 342–346.
41. Wu,X., Northcott,P.A., Dubuc,A., Dupuy,A.J., Shih,D.J.H.,Witt,H., Croul,S., Bouffet,E., Fults,D.W., Eberhart,C.G. et al.(2012) Clonal selection drives genetic divergence of metastaticmedulloblastoma. Nature, 482, 529–533.
42. Brandon,M., Baldi,P. and Wallace,D.C. (2006) Mitochondrialmutations in cancer. Oncogene, 25, 4647–4662.
43. Kloss-Brandstatter,A., Schafer,G., Erhart,G., Huttenhofer,A.,Coassin,S., Seifarth,C., Summerer,M., Bektic,J., Klocker,H. andKronenberg,F. (2010) Somatic mutations throughout the entiremitochondrial genome are associated with elevated PSA levels inprostate cancer patients. Am. J. Hum. Genet., 87, 802–812.
44. Ruiz-Pesini,E., Lott,M.T., Procaccio,V., Poole,J.C., Brandon,M.C.,Mishmar,D., Yi,C., Kreuziger,J., Baldi,P. and Wallace,D.C. (2007)An enhanced MITOMAP with a global mtDNA mutationalphylogeny. Nucleic Acids Res., 35, D823–D828.
45. Chatterjee,A., Dasgupta,S. and Sidransky,D. (2011) Mitochondrialsubversion in cancer. Cancer Prev. Res., 4, 638–654.
46. Nakamaru-Ogiso,E., Han,H., Matsuno-Yagi,A., Keinan,E.,Sinha,S.C., Yagi,T. and Ohnishi,T. (2010) The ND2 subunit islabeled by a photoaffinity analogue of asimicin, a potent complexI inhibitor. FEBS Lett., 584, 883–888.
47. Silvestri,G., Santorelli,F.M., Shanske,S., Whitley,C.B.,Schimmenti,L.A., Smith,S.A. and DiMauro,S. (1994) A newmtDNA mutation in the tRNA(Leu(UUR)) gene associated withmaternally inherited cardiomyopathy. Hum. Mutat., 3, 37–43.
48. Noer,A.S., Sudoyo,H., Lertrit,P., Thyagarajan,D., Utthanaphol,P.,Kapsa,R., Byrne,E. and Marzuki,S. (1991) A tRNA(Lys)mutation in the mtDNA is the causal genetic lesion underlyingmyoclonic epilepsy and ragged-red fiber (MERRF) syndrome.Am. J. Hum. Genet., 49, 715–722.
49. Klumpp,K., Leveque,V., Le Pogam,S., Ma,H., Jiang,W.-R.,Kang,H., Granycome,C., Singer,M., Laxton,C., Hang,J.Q. et al.(2006) The novel nucleoside analog R1479 (40-azidocytidine) is apotent inhibitor of NS5B-dependent RNA synthesis and hepatitisC virus replication in cell culture. J. Biol. Chem., 281, 3793–3799.
50. Li,L., Lok,S.-M., Yu,I.-M., Zhang,Y., Kuhn,R.J., Chen,J. andRossmann,M.G. (2008) The flavivirus precursormembrane-envelope protein complex: structure and maturation.Science, 319, 1830–1834.
51. Yoshii,K., Igarashi,M., Ichii,O., Yokozawa,K., Ito,K., Kariwa,H.and Takashima,I. (2012) A conserved region in the prM proteinis a critical determinant in the assembly of flavivirus particles.J. Gen. Virol., 93, 27–38.
52. Shurtleff,A.C., Beasley,D.W., Chen,J.J., Ni,H., Suderman,M.T.,Wang,H., Xu,R., Wang,E., Weaver,S.C., Watts,D.M. et al. (2001)Genetic variation in the 30 non-coding region of dengue viruses.Virology, 281, 75–87.
53. Alvarez,D.E., De Lella Ezcurra,A.L., Fucito,S. andGamarnik,A.V. (2005) Role of RNA structures present at the30-UTR of dengue virus on translation, RNA synthesis, and viralreplication. Virology, 339, 200–212.
54. Zagordi,O., Bhattacharya,A., Eriksson,N. and Beerenwinkel,N.(2011) ShoRAH: estimating the genetic diversity of a mixedsample from next-generation sequencing data. BMCBioinformatics, 12, 119.
55. Forshew,T., Murtaza,M., Parkinson,C., Gale,D., Tsui,D.W.Y.,Kaper,F., Dawson,S.-J., Piskorz,A.M., Jimenez-Linan,M.,Bentley,D. et al. (2012) Noninvasive identification and monitoringof cancer mutations by targeted deep sequencing of plasma DNA.Sci. Transl. Med., 4, 136ra68.
56. Krzywinski,M., Schein,J., Birol,I., Connors,J., Gascoyne,R.,Horsman,D., Jones,S.J. and Marra,M.A. (2009) Circos: aninformation aesthetic for comparative genomics. Genome research,19, 1639–45.
Nucleic Acids Research, 2012, Vol. 40, No. 22 11201