Embed Size (px)
Citation preview

This article was downloaded by: [York University Libraries]On: 10 October 2013, At: 06:10Publisher: Taylor & FrancisInforma Ltd Registered in England and Wales Registered Number: 1072954 Registeredoffice: Mortimer House, 37-41 Mortimer Street, London W1T 3JH, UK
International Journal of Green EnergyPublication details, including instructions for authors andsubscription information:http://www.tandfonline.com/loi/ljge20
Wind Characteristics Analyses andDetermination of Appropriate WindTurbine for Amasra—Black Sea Region,TurkeyS. A. Akdağ a & Ö. Güler a
a Energy Planning and Management Division, Energy Institute,Istanbul Technical University , Maslak, Istanbul, TurkeyPublished online: 19 Jul 2010.
To cite this article: S. A. Akdağ & Ö. Güler (2010) Wind Characteristics Analyses and Determinationof Appropriate Wind Turbine for Amasra—Black Sea Region, Turkey, International Journal of GreenEnergy, 7:4, 422-433, DOI: 10.1080/15435075.2010.493819
To link to this article: http://dx.doi.org/10.1080/15435075.2010.493819
PLEASE SCROLL DOWN FOR ARTICLE
Taylor & Francis makes every effort to ensure the accuracy of all the information (the“Content”) contained in the publications on our platform. However, Taylor & Francis,our agents, and our licensors make no representations or warranties whatsoever as tothe accuracy, completeness, or suitability for any purpose of the Content. Any opinionsand views expressed in this publication are the opinions and views of the authors,and are not the views of or endorsed by Taylor & Francis. The accuracy of the Contentshould not be relied upon and should be independently verified with primary sourcesof information. Taylor and Francis shall not be liable for any losses, actions, claims,proceedings, demands, costs, expenses, damages, and other liabilities whatsoever orhowsoever caused arising directly or indirectly in connection with, in relation to or arisingout of the use of the Content.
This article may be used for research, teaching, and private study purposes. Anysubstantial or systematic reproduction, redistribution, reselling, loan, sub-licensing,systematic supply, or distribution in any form to anyone is expressly forbidden. Terms &Conditions of access and use can be found at http://www.tandfonline.com/page/terms-and-conditions

WIND CHARACTERISTICS ANALYSES ANDDETERMINATION OF APPROPRIATE WIND TURBINE FORAMASRA—BLACK SEA REGION, TURKEY
S. A. Akdag and O. GulerEnergy Planning and Management Division, Energy Institute, Istanbul Technical
University, Maslak, Istanbul, Turkey
In this study, wind characteristics of Amasra were analyzed with hourly wind data collected
between 1997 and 2006. Wind characteristics such as monthly average mean speeds, power
densities, turbulence intensities, maximum gust, and prevailing wind directions were
identified. Weibull distribution model was used to determine energy output of thirty
commercial wind turbines ranging from 335 to 3000 kW. Estimated mean capacity factors
were calculated between 26.8% and 43.9%.
Keywords: Capacity factor; Turkey; Wind energy; Wind turbine
INTRODUCTION
Electricity has played a key role in the living quality of people, industrialization, and
development because it is the input to nearly all products. Like many developing countries,
electricity consumption of Turkey increases considerably because of industrialization
activities, rapid urbanization, increase in the living standards, population, and economic
growth. Installed electrical power capacity of Turkey was 41,802.6 MW and the electrical
energy generation was 198.32 TWh in 2008 (Energy Market Regulatory Authority 2009a).
Turkey’s energy source does not meet her energy demand, and therefore it has been
purchasing energy from foreign countries. According to the statistics of 2007, share of
indigenous primary energy source was only 25.5% (Ministry of Energy and Natural
Resources 2009). Since most part of the energy was imported, tiny increase in energy
prices strongly affects economy. It is vital for Turkey to supply reliable and sustainable
energy from her indigenous renewable energy sources such as hydro and wind.
Wind energy is one of the most promising renewable energy sources in Turkey. Wind
Energy Potential Atlas of Turkey (REPA) was prepared by using satellite data and
numerical weather prediction methodologies in 2006. According to the REPA (Wind
Energy Potential Atlas), wind energy potential at 50 m height above the ground in land
regions was calculated to be 131,756 MW, which is equivalent to the wind power density
larger than 300 W/m2 (Malkoc 2007). Therefore, wind energy can significantly contribute
to decreasing dependency of imported fuels, increasing self-sufficiency, and improving
International Journal of Green Energy, 7: 422–433, 2010
Copyright # Taylor & Francis Group, LLC
ISSN: 1543-5075 print / 1543-5083 online
DOI: 10.1080/15435075.2010.493819
Address correspondence to S. A. Akdag, Energy Institute, Istanbul Technical University, Ayazaga
Campus, 34469 Maslak, _Istanbul, Turkey. E-mail: [email protected]
422
Dow
nloa
ded
by [
Yor
k U
nive
rsity
Lib
rari
es]
at 0
6:10
10
Oct
ober
201
3
national energy security of Turkey. However, contribution of wind energy in electricity
production mix is very low, but is increasing rapidly. Turkey has twenty-two operating
wind power plants with 727.45 MW installed capacity. Capacity of wind power plants has
varied between 0.85 and 90 MW (Energy Market Regulatory Authority 2009b).
As stated by Akdag and Guler (2009), a large number of researches have been carried
out about wind energy potential, characteristics, and feasibility analysis of various regions in
Turkey. However, no detailed academic research has been carried out about wind energy
potential and characteristic of Amasra, located in the NW of Turkey (41� 440 latitude, 32� 230
longitude). Because of the lack of research about wind energy potential and characteristics of
the region, the present article attempts to determine wind characteristics and wind energy
potential of this region from hourly mean wind data between 1997 and 2006, which was
recorded by State Meteorological Works General Directorate. Weibull distribution model
was used to determine wind energy potential of the region. To determine wind turbines
capacity factors and energy output, a wide set of commercial wind turbines were used with
various hub heights. Analysis was carried out among thirty commercial wind turbines, ranged
from 335 to 3000 kW. Monthly and annual electrical energy production and capacity factors
were calculated using Weibull distribution and Wasp Turbine Editor Software.
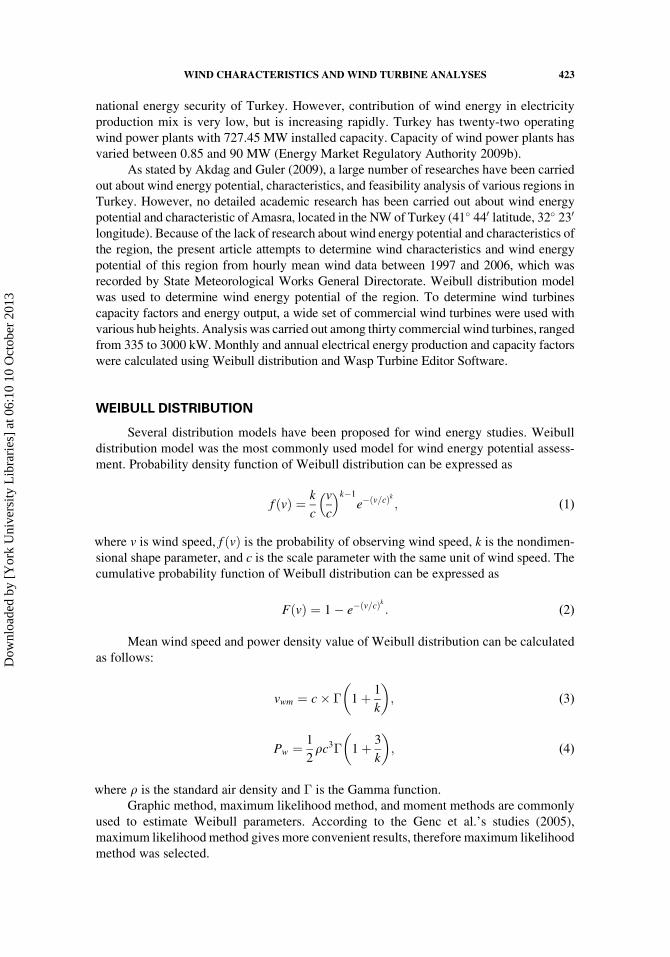
WEIBULL DISTRIBUTION
Several distribution models have been proposed for wind energy studies. Weibull
distribution model was the most commonly used model for wind energy potential assess-
ment. Probability density function of Weibull distribution can be expressed as
f vð Þ ¼ k
c
v
c
� �k�1
e� v=cð Þk ; (1)
where v is wind speed, f vð Þ is the probability of observing wind speed, k is the nondimen-
sional shape parameter, and c is the scale parameter with the same unit of wind speed. The
cumulative probability function of Weibull distribution can be expressed as
F vð Þ ¼ 1� e� v=cð Þk : (2)
Mean wind speed and power density value of Weibull distribution can be calculated
as follows:
vwm ¼ c� � 1þ 1
k
� �; (3)
Pw ¼1
2rc3� 1þ 3
k
� �; (4)
where r is the standard air density and � is the Gamma function.
Graphic method, maximum likelihood method, and moment methods are commonly
used to estimate Weibull parameters. According to the Genc et al.’s studies (2005),
maximum likelihood method gives more convenient results, therefore maximum likelihood
method was selected.
WIND CHARACTERISTICS AND WIND TURBINE ANALYSES 423
Dow
nloa
ded
by [
Yor
k U
nive
rsity
Lib
rari
es]
at 0
6:10
10
Oct
ober
201
3

Weibull distribution’s goodness of fit was evaluated according to the R2 and root
mean square error (RMSE) error analysis and differences of power densities derived from
Weibull distribution and time series to check the suitability of proposed distribution. Table
1 shows the monthly and annual base Weibull parameters, mean speeds, power densities
with R2, and RMSE results. As can be seen from Table 1, monthly value of R2 changes
between 0.9151 and 0.9815 and RMSE ranged from 0.0058 to 0.0166. Annual value of R2
and RMSE are 0.9560 and 0.009906, respectively. Cumulative distribution for observed
and Weibull distribution are shown in Figure 1.
Figure 2 shows the differences of power densities derived from the Weibull distribution
and observed time series. According to the observed time series, the maximum time series
power density was obtained for December and it was 343.154 W/m2, minimum was 152.409
W/m2 for June. Similarly, maximum Weibull power density was calculated for December and
Table 1 Weibull parameters, mean speeds, power densities, and error analysis results.
Months k C (m/s) vwm (m/s) vtsm (m/s) Pw (W/m2) Pts (W/m2) R2 RMSE
January 1.613 6.296 5.641 5.627 269.7 268.7 0.9575 0.0090
February 1.690 6.597 5.888 5.878 288.7 283.9 0.9377 0.0106
March 1.582 6.321 5.673 5.655 281.7 286.6 0.9566 0.0092
April 1.470 5.284 4.783 4.761 187.8 194.3 0.9208 0.0148
May 1.325 4.798 4.415 4.389 174.9 196.3 0.9151 0.0166
June 1.444 4.781 4.337 4.305 144.0 152.4 0.9227 0.0161
July 1.401 5.125 4.671 4.636 188.6 217.3 0.9165 0.0158
August 1.445 5.270 4.781 4.754 192.5 205.7 0.9461 0.0123
September 1.590 5.202 4.666 4.633 155.8 167.9 0.9528 0.0121
October 1.497 5.801 5.238 5.209 240.0 252.4 0.9346 0.0120
November 1.517 5.780 5.211 5.190 231.9 231.8 0.9424 0.0112
December 1.574 6.618 5.943 5.923 326.1 343.2 0.9815 0.0058
Annual 1.484 5.616 5.077 5.052 221.4 231.3 0.9560 0.0099
1 Observed Wind Distribution
Weibull Distribution
0.8
0.6
0.4
Cum
ulat
ive
freq
uenc
y di
stri
butio
n
0.2
0
1 2 3 4 5 6 7 8 9 10 11 12 13 14
v15 16 17 18 19 20 21 22 23 24 25 26 27 28 29
Figure 1 Weibull and observed cumulative distribution.
424 AKDAG AND GULER
Dow
nloa
ded
by [
Yor
k U
nive
rsity
Lib
rari
es]
at 0
6:10
10
Oct
ober
201
3

it was 326.103 W/m2 and minimum was 143.959 W/m2 for June. Yearly average mean power
density of observed time series and Weibull distribution was 231.261 and 221.41 W/m2,
respectively. Power density error analysis was carried out using the following:
Errorð%Þ ¼ Pw � Pts
Pts
; (5)
where Pts is the power density calculated from the time series.
WIND DATA ANALYSIS
It is necessary to measure wind speeds at hub heights to estimate wind turbine energy
output correctly. However, in Turkey, wind speed measurements are generally carried out
10 m above the ground level. Hence, it is necessary to estimate wind speed at the hub height
of wind turbine. For this reason, wind speed measurements are extrapolated to the wind
turbine hub height. The shape parameter of Weibull distribution is not affected by extra-
polation of wind speeds. But the scale parameter of the distribution changes at the same
ratio with the wind speed according to the maximum likelihood method and the variation
can be represented by as follows:
c2 ¼ c1 �h2
h1
� �a
: (6)
Hourly, monthly, and yearly average wind speeds and power densities have been
calculated for various wind turbine hub heights. Mean wind speeds of monthly observed
time series and Weibull distribution parameters and turbulence intensity are presented in
Table 2 at 50 m above the ground.
Hourly variation of the mean wind speed and power density at 10 m above ground
level is presented in Figure 3. It is also clear from this figure that wind blows more severely
between 10:00 and 19:00 h. Maximum mean wind speed reached to 6.15 m/s. Differences
between minimum and maximum wind speed was not higher than 30% and there were no
–18
–16
–14
–12
–10
–8–6
–4
–2
0
2
4
1 2 3 4 5 6 7 8 9 10 11 12
Months
Err
or (
%)
Figure 2 Power density error analysis.
WIND CHARACTERISTICS AND WIND TURBINE ANALYSES 425
Dow
nloa
ded
by [
Yor
k U
nive
rsity
Lib
rari
es]
at 0
6:10
10
Oct
ober
201
3

considerable wind speed differences. For this reason, it can be regarded as diurnal reg-
ularity. Hourly mean wind speed decreases sharply after 16:00 h. Hourly variation of mean
power density has nearly same trend with wind speed variation.
Figure 4 shows annual variations of observed mean wind speed. Maximum annual
mean wind speed occurred in 2001, minimum was in 2003, and they were 5.53 and 4.59 m/s,
respectively. Mean wind speed for ten-year observed data was 5.05 m/s and maximum wind
speed in this period was 28.8 m/s.
Mean wind speeds and power densities according to the directions are vital for wind
turbine sitting. Table 3 shows mean wind speeds, power densities, and frequencies of these
directions at 10 m above ground level. Prevailing wind direction was found to be S with
17.44% frequency, but E wind direction was also dominant. Furthermore, the value of
highest mean wind speed and power density for E wind direction was 4.87 m/s and 570.36
W/m2, respectively. It is interesting to note that if mean wind speed is higher for one
direction, it does not mean that it has higher power density. For instance, mean wind speeds
in NE and ESE directions were 4.79 and 4.54 m/s, but their power densities were 169.46 and
206.41 W/m2, respectively. As stated earlier, wind speed distribution is vital for wind
Table 2 Weibull and observed time series parameters for 50 m.
Months k c (m/s) vwm (m/s) vtsm (m/s) Turbulence
January 1.613 8.687 7.783 7.763 0.633
February 1.690 9.102 8.124 8.110 0.604
March 1.582 8.721 7.827 7.803 0.650
April 1.470 7.291 6.599 6.568 0.703
May 1.325 6.620 6.091 6.055 0.799
June 1.444 6.596 5.984 5.939 0.724
July 1.401 7.072 6.444 6.396 0.764
August 1.445 7.272 6.596 6.559 0.722
September 1.590 7.177 6.438 6.393 0.662
October 1.497 8.004 7.227 7.188 0.693
November 1.517 7.975 7.190 7.161 0.672
December 1.574 9.132 8.200 8.172 0.655
Annual 1.484 7.749 7.005 6.970 0.697
0
1
2
3
4
5
6
7
Hours
Mea
n W
ind
Spee
d (m
/s)
0
50
100
150
200
250
300
350
400
450
Pow
er D
ensi
ty (W
/m2 )
Power Density Wind Speed
1 2 3 4 5 6 7 8 9 10 11 12 13 14 15 16 17 18 19 20 21 22 23 24
Figure 3 Hourly mean wind speed and power density variation.
426 AKDAG AND GULER
Dow
nloa
ded
by [
Yor
k U
nive
rsity
Lib
rari
es]
at 0
6:10
10
Oct
ober
201
3

energy applications. So, mean wind speed, power density, and frequency distribution are
important to locate wind turbines. Optimum direction to produce more energy can be
determined using these parameters. In other word, not only the frequency of wind direction
is crucial to place wind turbines but also mean wind speed, power density, and direction of
wind speed distribution are important.
ENERGY OUTPUT ANALYSIS
One of the most vital indicators of wind turbine performance is the capacity factor,
which can be defined as the ratio between average power output and rated power. However,
capacity factor may not be the only parameter for selection of wind turbines; moreover,
economical analyses results should be considered for wind turbines. In the literature, there
are various studies in order to determine most suitable wind turbine (Hu and Cheng 2007;
Jangamshetti and Rau 1999; Pallabazzer 2003, 2004b). But to design and produce most
0
1
2
3
4
5
6
1997 1998 1999 2000 2001 2002 2003 2004 2005 2006
Years
Mea
n W
ind
Spee
d (m
/s)
Figure 4 Yearly mean wind speed variation.
Table 3 Parameters according to the directions.
Direction vtsm (m/s) Pts (W/m2) Frequency (%)
N 4.50 180.10 3.20
NNE 3.93 150.85 0.77
NE 4.79 169.46 3.49
ENE 3.66 120.70 1.01
E 7.26 570.36 16.89
ESE 4.54 206.41 4.22
SE 2.79 32.20 9.13
SSE 1.92 10.15 3.83
S 4.87 156.93 17.44
SSW 4.78 144.32 4.94
SW 5.80 192.79 10.70
WSW 3.22 73.57 1.32
W 5.41 246.87 7.17
WNW 5.36 272.53 5.76
NW 5.01 202.38 8.52
NNW 3.68 144.21 1.62
WIND CHARACTERISTICS AND WIND TURBINE ANALYSES 427
Dow
nloa
ded
by [
Yor
k U
nive
rsity
Lib
rari
es]
at 0
6:10
10
Oct
ober
201
3

suitable wind turbine for one region is costly. For this reason, it is more convenient to select
suitable wind turbine among commercial ones. In this study, energy output analysis was
carried out for thirty commercial wind turbines. Cut in, rated, and cut out wind speeds of
wind turbines are generally change between 2 and 4, 13 and 14, and 21 and 25 m/s,
respectively. Detailed information about technical data of wind turbines can be obtained
from DeWind (2008), ENERCON (2008), Gamesa (2008), GE Power (2008), Nordex
(2008), Suzlon (2008), VESTAS (2008), and WASP (2008).
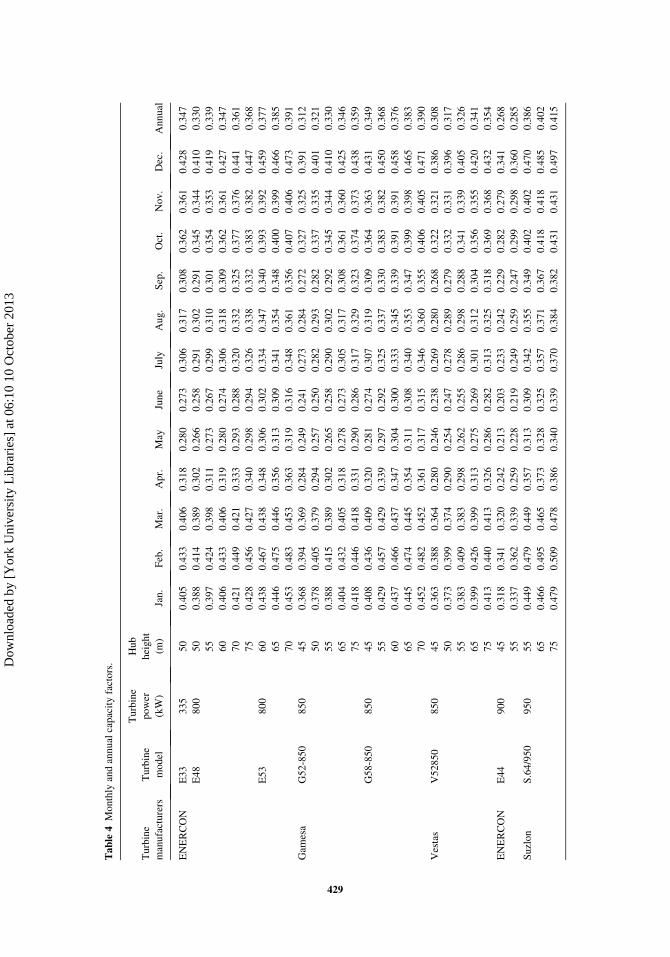
Selected wind turbines are divided into three groups, which are lower than 1000 kW,
between 1000 and 2000 kW, and greater than 2000 kW. Monthly and annual capacity
factors were calculated using Weibull distribution and Wasp Turbine Editor Software.
Results of the calculations are listed in Tables 4–6.
In the first group, the largest calculated annually capacity factor was 0.415 and the
maximum monthly capacity factor was 0.509 in February at 75 m hub height for Suzlon
S64/950. While hub height decreased from 75 to 65 m, capacity factor decreased from
0.415 to 0.402. In other words, energy output decreased 108,186 kWh yearly. When hub
height of turbine increased from 55 to 65 m, capacity factor increased to 0.016, which was
equivalent to 133,152 kWh yearly estimated energy output. Variation of energy output per
meter was related with the turbine power curves and wind distribution of the region.
In the second group, Vestas V90 1800 kW at 95-m hub height had the largest annually
capacity factor with 0.439. The maximum monthly capacity factor was obtained as 0.533 in
February for the same turbine with the same hub height. While hub height decreased from
95 to 80 m, capacity factor decrease from 0.439 to 0.423, which was equivalent to 252,288
kWh yearly estimated energy output.
In the third group, the largest annual capacity factor was 0.426 at 100 m hub height
for Gamese G90 2000 kW wind turbine. The maximum monthly capacity factor calculated
as 0.519 in February for the same turbine with same hub height. While hub height decreased
from 100 to 80 m, capacity factor decreased from 0.426 to 0.407, which was equivalent to
333,880 kWh yearly estimated energy output.
Wind turbine’s kilowatt price changes according to the manufacturer, location, and size
range. Ultimate price of wind turbines is determined according to the negotiation between
client and manufacturer (Pallabazzer 2004a). Besides, it is difficult to obtain a price because
of market conditions. For this reason, no economic analysis is carried out in this study.
CONCLUSION
Wind energy potential of Amasra was neglected and no wind farm has been installed.
However, this study shows that there is significant wind energy potential. Monthly average
mean wind speeds varied between 4.34 and 5.94 m/s at 10 m above the ground level. Yearly
mean wind speeds changed from 4.59 to 5.53 m/s. Mean wind speed was 5.05 m/s for ten-
year data. Monthly mean power densities were between 152.41 and 286.63 W/m2. Power
density was 231.26 W/m2 and maximum wind speed was 28.8 m/s for ten-year data.
Prevailing wind direction was S with 17.44% frequency, but E direction was also dominant.
As a result of calculations, wind turbines capacity factors based on ten year changed
between 0.268 and 0.439. World’s estimated mean capacity factor is 0.20. For this reason,
installation of wind farm in Amasra will be very profitable.
Energy output of wind turbine not only depends on mean wind speed but also power
density, shape of wind distribution, and wind turbine’s power curve. In conclusion, even if a
428 AKDAG AND GULER
Dow
nloa
ded
by [
Yor
k U
nive
rsity
Lib
rari
es]
at 0
6:10
10
Oct
ober
201
3
Ta
ble
4M
onth
lyan
dan
nu
alca
pac
ity
fact
ors
.
Tu
rbin
e
man
ufa
ctu
rers
Tu
rbin
e
mod
el
Tu
rbin
e
po
wer
(kW
)
Hu
b
hei
gh
t
(m)
Jan
.F
eb.
Mar
.A
pr.
May
Jun
eJu
lyA
ug
.S
ep.
Oct
.N
ov
.D
ec.
An
nu
al
EN
ER
CO
NE
33
33
55
00
.40
50
.433
0.4
06
0.3
18
0.2
80
0.2
73
0.3
06
0.3
17
0.3
08
0.3
62
0.3
61
0.4
28
0.3
47
E4
88
00
50
0.3
88
0.4
14
0.3
89
0.3
02
0.2
66
0.2
58
0.2
91
0.3
02
0.2
91
0.3
45
0.3
44
0.4
10
0.3
30
55
0.3
97
0.4
24
0.3
98
0.3
11
0.2
73
0.2
67
0.2
99
0.3
10
0.3
01
0.3
54
0.3
53
0.4
19
0.3
39
60
0.4
06
0.4
33
0.4
06
0.3
19
0.2
80
0.2
74
0.3
06
0.3
18
0.3
09
0.3
62
0.3
61
0.4
27
0.3
47
70
0.4
21
0.4
49
0.4
21
0.3
33
0.2
93
0.2
88
0.3
20
0.3
32
0.3
25
0.3
77
0.3
76
0.4
41
0.3
61
75
0.4
28
0.4
56
0.4
27
0.3
40
0.2
98
0.2
94
0.3
26
0.3
38
0.3
32
0.3
83
0.3
82
0.4
47
0.3
68
E5
38
00
60
0.4
38
0.4
67
0.4
38
0.3
48
0.3
06
0.3
02
0.3
34
0.3
47
0.3
40
0.3
93
0.3
92
0.4
59
0.3
77
65
0.4
46
0.4
75
0.4
46
0.3
56
0.3
13
0.3
09
0.3
41
0.3
54
0.3
48
0.4
00
0.3
99
0.4
66
0.3
85
70
0.4
53
0.4
83
0.4
53
0.3
63
0.3
19
0.3
16
0.3
48
0.3
61
0.3
56
0.4
07
0.4
06
0.4
73
0.3
91
Gam
esa
G52-8
50
850
45
0.3
68
0.3
94
0.3
69
0.2
84
0.2
49
0.2
41
0.2
73
0.2
84
0.2
72
0.3
27
0.3
25
0.3
91
0.3
12
50
0.3
78
0.4
05
0.3
79
0.2
94
0.2
57
0.2
50
0.2
82
0.2
93
0.2
82
0.3
37
0.3
35
0.4
01
0.3
21
55
0.3
88
0.4
15
0.3
89
0.3
02
0.2
65
0.2
58
0.2
90
0.3
02
0.2
92
0.3
45
0.3
44
0.4
10
0.3
30
65
0.4
04
0.4
32
0.4
05
0.3
18
0.2
78
0.2
73
0.3
05
0.3
17
0.3
08
0.3
61
0.3
60
0.4
25
0.3
46
75
0.4
18
0.4
46
0.4
18
0.3
31
0.2
90
0.2
86
0.3
17
0.3
29
0.3
23
0.3
74
0.3
73
0.4
38
0.3
59
G5
8-8
50
85
04
50
.40
80
.436
0.4
09
0.3
20
0.2
81
0.2
74
0.3
07
0.3
19
0.3
09
0.3
64
0.3
63
0.4
31
0.3
49
55
0.4
29
0.4
57
0.4
29
0.3
39
0.2
97
0.2
92
0.3
25
0.3
37
0.3
30
0.3
83
0.3
82
0.4
50
0.3
68
60
0.4
37
0.4
66
0.4
37
0.3
47
0.3
04
0.3
00
0.3
33
0.3
45
0.3
39
0.3
91
0.3
91
0.4
58
0.3
76
65
0.4
45
0.4
74
0.4
45
0.3
54
0.3
11
0.3
08
0.3
40
0.3
53
0.3
47
0.3
99
0.3
98
0.4
65
0.3
83
70
0.4
52
0.4
82
0.4
52
0.3
61
0.3
17
0.3
15
0.3
46
0.3
60
0.3
55
0.4
06
0.4
05
0.4
71
0.3
90
Ves
tas
V5
28
50
85
04
50
.36
30
.388
0.3
64
0.2
80
0.2
46
0.2
38
0.2
69
0.2
80
0.2
68
0.3
22
0.3
21
0.3
86
0.3
08
50
0.3
73
0.3
99
0.3
74
0.2
90
0.2
54
0.2
47
0.2
78
0.2
89
0.2
79
0.3
32
0.3
31
0.3
96
0.3
17
55
0.3
83
0.4
09
0.3
83
0.2
98
0.2
62
0.2
55
0.2
86
0.2
98
0.2
88
0.3
41
0.3
39
0.4
05
0.3
26
65
0.3
99
0.4
26
0.3
99
0.3
13
0.2
75
0.2
69
0.3
01
0.3
12
0.3
04
0.3
56
0.3
55
0.4
20
0.3
41
75
0.4
13
0.4
40
0.4
13
0.3
26
0.2
86
0.2
82
0.3
13
0.3
25
0.3
18
0.3
69
0.3
68
0.4
32
0.3
54
EN
ER
CO
NE
44
90
04
50
.31
80
.341
0.3
20
0.2
42
0.2
13
0.2
03
0.2
33
0.2
42
0.2
29
0.2
82
0.2
79
0.3
41
0.2
68
55
0.3
37
0.3
62
0.3
39
0.2
59
0.2
28
0.2
19
0.2
49
0.2
59
0.2
47
0.2
99
0.2
98
0.3
60
0.2
85
Su
zlo
nS
.64
/95
09
50
55
0.4
49
0.4
79
0.4
49
0.3
57
0.3
13
0.3
09
0.3
42
0.3
55
0.3
49
0.4
02
0.4
02
0.4
70
0.3
86
65
0.4
66
0.4
95
0.4
65
0.3
73
0.3
28
0.3
25
0.3
57
0.3
71
0.3
67
0.4
18
0.4
18
0.4
85
0.4
02
75
0.4
79
0.5
09
0.4
78
0.3
86
0.3
40
0.3
39
0.3
70
0.3
84
0.3
82
0.4
31
0.4
31
0.4
97
0.4
15
429
Dow
nloa
ded
by [
Yor
k U
nive
rsity
Lib
rari
es]
at 0
6:10
10
Oct
ober
201
3

Ta
ble
5M
onth
lyan
dan
nu
alca
pac
ity
fact
ors
.
Man
ufa
ctu
rer
Tu
rbin
e
mod
el
Po
wer
(kW
)
Hu
b
hei
gh
t(m
)Ja
n.
Feb
.M
ar.
Ap
r.M
ayJu
ne
July
Au
g.
Sep
.O
ct.
No
v.
Dec
.A
nn
ual
Gen
eral
Ele
ctri
cG
EV
HP
10
00
60
0.4
17
0.4
45
0.4
17
0.3
30
0.2
90
0.2
85
0.3
16
0.3
29
0.3
21
0.3
73
0.3
72
0.4
38
0.3
58
70
0.4
32
0.4
60
0.4
31
0.3
44
0.3
02
0.2
99
0.3
30
0.3
42
0.3
36
0.3
87
0.3
86
0.4
51
0.3
72
DeW
ind
D6
12
50
65
0.3
88
0.4
14
0.3
87
0.3
06
0.2
67
0.2
63
0.2
92
0.3
04
0.2
98
0.3
46
0.3
45
0.4
05
0.3
32
Su
zlo
nS
.64
/12
50
12
50
55
0.3
79
0.4
06
0.3
80
0.2
94
0.2
58
0.2
50
0.2
82
0.2
93
0.2
83
0.3
37
0.3
35
0.4
01
0.3
22
65
0.3
95
0.4
23
0.3
96
0.3
09
0.2
71
0.2
65
0.2
97
0.3
08
0.3
00
0.3
52
0.3
51
0.4
16
0.3
37
75
0.4
09
0.4
37
0.4
09
0.3
22
0.2
82
0.2
78
0.3
09
0.3
21
0.3
14
0.3
65
0.3
64
0.4
29
0.3
50
S.6
6/1
25
01
25
05
50
.38
70
.414
0.3
87
0.3
01
0.2
64
0.2
57
0.2
89
0.3
00
0.2
90
0.3
44
0.3
42
0.4
09
0.3
29
65
0.4
03
0.4
31
0.4
03
0.3
16
0.2
77
0.2
72
0.3
03
0.3
15
0.3
07
0.3
60
0.3
58
0.4
24
0.3
44
75
0.4
17
0.4
45
0.4
17
0.3
29
0.2
89
0.2
85
0.3
16
0.3
28
0.3
21
0.3
73
0.3
71
0.4
37
0.3
57
No
rtex
S7
0/1
50
01
50
06
50
.40
30
.431
0.4
03
0.3
15
0.2
75
0.2
69
0.3
02
0.3
14
0.3
05
0.3
58
0.3
57
0.4
24
0.3
43
80
0.4
23
0.4
51
0.4
22
0.3
34
0.2
92
0.2
88
0.3
20
0.3
32
0.3
26
0.3
77
0.3
77
0.4
42
0.3
62
85
0.4
29
0.4
57
0.4
28
0.3
39
0.2
97
0.2
94
0.3
25
0.3
38
0.3
32
0.3
83
0.3
82
0.4
47
0.3
68
90
0.4
34
0.4
63
0.4
33
0.3
45
0.3
02
0.2
99
0.3
30
0.3
43
0.3
38
0.3
88
0.3
88
0.4
52
0.3
73
10
00
.44
40
.473
0.4
42
0.3
54
0.3
10
0.3
08
0.3
39
0.3
52
0.3
49
0.3
97
0.3
97
0.4
61
0.3
82
S7
7/1
50
01
50
06
50
.42
70
.456
0.4
27
0.3
38
0.2
96
0.2
92
0.3
24
0.3
37
0.3
30
0.3
82
0.3
81
0.4
48
0.3
67
80
0.4
47
0.4
77
0.4
47
0.3
57
0.3
13
0.3
11
0.3
42
0.3
55
0.3
51
0.4
01
0.4
01
0.4
66
0.3
86
85
0.4
53
0.4
82
0.4
52
0.3
63
0.3
18
0.3
16
0.3
47
0.3
61
0.3
57
0.4
07
0.4
06
0.4
71
0.3
91
90
0.4
58
0.4
88
0.4
57
0.3
68
0.3
23
0.3
22
0.3
52
0.3
66
0.3
63
0.4
12
0.4
11
0.4
76
0.3
96
10
00
.46
80
.497
0.4
66
0.3
78
0.3
31
0.3
31
0.3
61
0.3
75
0.3
74
0.0
40
0.4
21
0.4
84
0.4
06
Ves
tas
V8
2-1
65
01
65
08
00
.44
00
.467
0.4
36
0.3
61
0.3
16
0.3
20
0.3
44
0.3
58
0.3
62
0.3
97
0.3
98
0.4
49
0.3
84
V9
0-1
80
01
80
08
00
.48
70
.518
0.4
86
0.3
94
0.3
46
0.3
47
0.3
77
0.3
92
0.3
91
0.4
39
0.4
39
0.5
05
0.4
23
95
0.5
03
0.5
33
0.5
01
0.4
10
0.3
61
0.3
63
0.3
92
0.4
07
0.4
09
0.4
54
0.4
55
0.5
18
0.4
39
430
Dow
nloa
ded
by [
Yor
k U
nive
rsity
Lib
rari
es]
at 0
6:10
10
Oct
ober
201
3

Ta
ble
6M
onth
lyan
dan
nual
capac
ity
fact
ors
.
Man
ufa
ctu
rer
Tu
rbin
em
od
elP
ow
er(k
W)
Hu
bh
eigh
t(m
)Ja
n.
Feb
.M
ar.
Ap
r.M
ayJu
ne
July
Au
g.
Sep
.O
ct.
No
v.
Dec
.A
nn
ual
DeW
ind
D8
.22
00
08
00
.420
0.4
49
0.4
20
0.3
33
0.2
91
0.2
88
0.3
19
0.3
31
0.3
25
0.3
76
0.3
75
0.4
40
0.3
61
10
00
.441
0.4
70
0.4
40
0.3
53
0.3
09
0.3
08
0.3
38
0.3
51
0.3
48
0.3
95
0.3
95
0.4
58
0.3
80
EN
ER
CO
NE
82
20
00
80
0.4
65
0.4
95
0.4
64
0.3
72
0.3
27
0.3
25
0.3
57
0.3
70
0.3
66
0.4
17
0.4
17
0.4
84
0.4
01
90
0.4
76
0.5
06
0.4
75
0.3
83
0.3
37
0.3
36
0.3
67
0.3
81
0.3
79
0.4
28
0.4
28
0.4
94
0.4
12
10
00
.486
0.5
16
0.4
84
0.3
93
0.3
46
0.3
46
0.3
76
0.3
91
0.3
90
0.4
37
0.4
37
0.5
02
0.4
22
Gam
esa
G80-2
.02000
60
0.3
90
0.4
17
0.3
90
0.3
04
0.2
67
0.2
61
0.2
92
0.3
04
0.2
94
0.3
47
0.3
46
0.4
11
0.3
32
65
0.3
98
0.4
25
0.3
98
0.3
12
0.2
73
0.2
68
0.2
99
0.3
11
0.3
02
0.3
55
0.3
53
0.4
19
0.3
40
80
0.4
18
0.4
46
0.4
17
0.3
31
0.2
90
0.2
86
0.3
17
0.3
29
0.3
23
0.3
73
0.3
73
0.0
37
0.3
58
10
00
.438
0.4
67
0.4
37
0.3
51
0.3
07
0.3
06
0.3
36
0.3
49
0.3
45
0.3
93
0.3
93
0.4
55
0.3
78
G8
3-2
.02
00
06
50
.408
0.4
36
0.4
08
0.3
20
0.2
81
0.2
75
0.3
07
0.3
19
0.3
11
0.3
64
0.3
63
0.4
29
0.3
49
80
0.4
28
0.4
56
0.4
27
0.3
39
0.2
97
0.2
94
0.3
25
0.3
38
0.3
32
0.3
83
0.3
82
0.4
47
0.3
67
G8
7-2
.02
00
06
50
.432
0.4
61
0.4
32
0.3
43
0.3
00
0.2
96
0.3
28
0.3
41
0.3
35
0.3
87
0.3
86
0.4
52
0.3
71
80
0.4
52
0.4
81
0.4
51
0.3
62
0.3
17
0.3
15
0.3
46
0.3
60
0.3
56
0.4
06
0.4
05
0.4
70
0.3
90
10
00
.472
0.5
02
0.4
71
0.3
82
0.3
35
0.3
36
0.3
66
0.3
80
0.3
79
0.4
25
0.4
25
0.4
88
0.4
10
G9
0-2
.02
00
08
00
.469
0.4
99
0.4
68
0.3
78
0.3
32
0.3
31
0.3
62
0.3
76
0.3
73
0.4
22
0.4
22
0.4
87
0.4
07
10
00
.489
0.5
19
0.4
87
0.3
98
0.3
51
0.3
52
0.3
81
0.3
96
0.3
96
0.4
42
0.4
42
0.5
05
0.4
26
Ves
tas
V8
0-2
00
02
00
06
00
.390
0.4
17
0.3
90
0.3
04
0.2
67
0.2
61
0.2
92
0.3
04
0.2
94
0.3
47
0.3
46
0.4
11
0.3
32
70
0.4
05
0.4
32
0.4
05
0.3
18
0.2
79
0.2
74
0.3
05
0.3
17
0.3
10
0.3
61
0.3
60
0.4
25
0.3
46
80
0.4
18
0.4
46
0.4
17
0.3
31
0.2
90
0.2
86
0.3
17
0.3
29
0.3
23
0.3
73
0.3
73
0.4
37
0.3
58
10
00
.438
0.4
67
0.4
37
0.3
51
0.3
07
0.3
06
0.3
36
0.3
49
0.3
45
0.3
93
0.3
93
0.4
55
0.3
78
V9
0-2
00
02
00
08
00
.468
0.4
98
0.4
67
0.3
76
0.3
30
0.3
29
0.3
60
0.3
74
0.3
71
0.4
21
0.4
20
0.4
86
0.4
05
95
0.4
84
0.5
14
0.4
82
0.3
92
0.3
44
0.3
45
0.3
75
0.3
90
0.3
89
0.4
36
0.4
36
0.5
00
0.4
20
(Co
nti
nu
ed)
431
Dow
nloa
ded
by [
Yor
k U
nive
rsity
Lib
rari
es]
at 0
6:10
10
Oct
ober
201
3

Ta
ble
6(C
on
tin
ued
).
Man
ufa
ctu
rer
Tu
rbin
em
od
elP
ow
er(k
W)
Hu
bh
eigh
t(m
)Ja
n.
Feb
.M
ar.
Ap
r.M
ayJu
ne
July
Au
g.
Sep
.O
ct.
No
v.
Dec
.A
nn
ual
Su
zlo
nS
88/2
10
02
10
08
00
.441
0.4
70
0.4
40
0.3
51
0.3
07
0.3
04
0.3
36
0.3
49
0.3
44
0.3
95
0.3
94
0.4
60
0.3
79
EN
ER
CO
NE
70
23
00
70
0.3
67
0.3
92
0.3
67
0.2
85
0.2
50
0.2
43
0.2
73
0.2
84
0.2
74
0.3
26
0.3
25
0.3
88
0.3
12
75
0.3
73
0.3
99
0.3
74
0.2
91
0.2
55
0.2
48
0.2
79
0.2
90
0.2
81
0.3
32
0.3
31
0.3
94
0.3
18
80
0.3
79
0.4
06
0.3
80
0.2
96
0.2
60
0.2
54
0.2
84
0.2
96
0.2
87
0.3
38
0.3
37
0.3
99
0.3
18
90
0.3
90
0.4
17
0.3
90
0.3
07
0.2
69
0.2
64
0.2
94
0.3
06
0.2
98
0.3
48
0.3
47
0.4
09
0.3
34
10
00
.400
0.4
27
0.3
99
0.3
16
0.2
77
0.2
73
0.3
03
0.3
15
0.3
08
0.3
57
0.3
56
0.4
18
0.3
43
No
rtex
N9
0/2
30
02
30
06
00
.409
0.4
37
0.4
09
0.3
21
0.2
81
0.2
75
0.3
08
0.3
20
0.3
11
0.3
65
0.3
64
0.4
30
0.3
49
70
0.4
24
0.4
53
0.4
24
0.3
35
0.2
94
0.2
89
0.3
21
0.3
34
0.3
27
0.3
79
0.3
78
0.4
44
0.3
64
80
0.4
37
0.4
66
0.4
36
0.3
47
0.3
04
0.3
01
0.3
33
0.3
46
0.3
41
0.3
91
0.3
91
0.4
56
0.3
76
10
00
.458
0.4
87
0.4
56
0.3
68
0.3
22
0.3
22
0.3
52
0.3
66
0.3
63
0.4
11
0.4
11
0.4
74
0.3
96
N1
00
/25
00
25
00
10
00
.449
0.4
75
0.4
45
0.3
71
0.3
24
0.3
31
0.3
53
0.3
67
0.3
75
0.4
06
0.4
07
0.4
55
0.3
93
N8
0/2
50
02
50
06
00
.346
0.3
71
0.3
47
0.2
66
0.2
32
0.2
24
0.2
55
0.2
65
0.2
53
0.3
07
0.3
05
0.3
68
0.2
92
70
0.3
61
0.3
87
0.3
62
0.2
79
0.2
44
0.2
37
0.2
68
0.2
78
0.2
68
0.3
20
0.3
19
0.3
82
0.3
06
80
0.3
74
0.4
00
0.3
74
0.2
91
0.2
54
0.2
48
0.2
79
0.2
90
0.2
81
0.3
32
0.3
31
0.3
94
0.3
18
10
00
.394
0.4
22
0.3
94
0.3
10
0.2
71
0.2
67
0.2
07
0.3
09
0.3
03
0.3
52
0.3
51
0.4
13
0.3
37
Ves
tas
V9
0-3
00
03
00
08
00
.391
0.4
18
0.3
91
0.3
07
0.2
69
0.2
63
0.2
94
0.3
06
0.2
98
0.3
49
0.3
48
0.4
11
0.3
34
432
Dow
nloa
ded
by [
Yor
k U
nive
rsity
Lib
rari
es]
at 0
6:10
10
Oct
ober
201
3

region has high mean wind speed and power density, it is not a universal rule that this
location has higher energy output.
NOMENCLATUREf ðvÞ probability of observing wind speed
v wind speed
k Weibull shape parameter
c Weibull scale parameter
FðvÞ cumulative probability function
vwm Weibull distribution mean wind speed
Pw Weibull power density
� Gamma function
r air density
vtsm time series mean wind speed
Pts time series mean power density
h height
a power law coefficient
REFERENCES
Akdag, S.A., and O. Guler. 2009. Calculation of wind energy potential and economic analysis by
using Weibull distribution a case study from Turkey. Part 2: Economic analysis. Energy
Sources, Part B: Economics, Planning and Policy 4: 9–16.
DeWind. 2008. http://www.compositetechcorp.com/windpower.htm (Accessed August 2009).
Energy Market Regulatory Authority. 2009a. Activity Report, http://www.epdk.gov.tr/yayin_rapor/
yillik/yillik.htm (Accessed November 2009).
Energy Market Regulatory Authority. 2009b. http://www.epdk.gov.tr/lisans/elektrik/yek/yek.html
(Accessed November 2009).
ENERCON. 2008. http://www.enercon.de/en/_home.htm (Accessed August 2008).
Gamesa. 2008. http://www.gamesa.es/en (Accessed August 2008).
Genc, A., M. Erisoglu, A. Pekgor, G. Oturanc, A. Hepbasli, and K. Ulgen. 2005. Estimation of wind
power potential using Weibull distribution. Energy Sources 27: 809–822.
GE Power. 2008. http://www.gepower.com/businesses/ge_wind_energy/en/index.htm (Accessed
August 2008).
Hu, S., and J. Cheng. 2007. Performance evaluation of pairing between sites and wind turbines.
Renewable Energy 32(11): 1934–1947.
Jangamshetti, S.H., and V.G. Rau. 1999. Site matching of wind turbine generators: A case study.
Energy Conversion, IEEE Transaction on 14(4): 1537–1543.
Malkoc, Y. 2007. Numerical Wind Energy Potential Map, 26th Energy Efficiency Weeks, Ankara
(in Turkish).
Ministry of Energy and Natural Resources. 2009. http://www.enerji.gov.tr (Accessed November 2009).
Nordex. 2008. http://www.nordex-online.com/en (Accessed August 2008).
Pallabazzer, R. 2003. Parametric analysis of wind siting efficiency. Journal of Wind Engineering and
Industrial Aerodynamics 91(11): 1329–1352.
Pallabazzer, R. 2004a. Effects of site wind properties on wind-electric conversion costs. Wind
Engineering 28(6): 679–694.
Pallabazzer, R. 2004b. Previsional estimation of the energy output of windgenerators. Renewable
Energy 29(3): 413–420.
Suzlon. 2008. http://www.suzlon.com/ (Accessed August 2008).
VESTAS. 2008. http://vestas.com/ (Accessed August 2008).
WASP. 2008. http://www.wasp.dk/Download/PowerCurves.html (Accessed August 2008).
WIND CHARACTERISTICS AND WIND TURBINE ANALYSES 433
Dow
nloa
ded
by [
Yor
k U
nive
rsity
Lib
rari
es]
at 0
6:10
10
Oct
ober
201
3