Embed Size (px)
Citation preview
Wind Climatology, Climate Change, and Wind Energy
Scott Greene1*, Mark Morrissey2 and Sara E. Johnson3
1Department of Geography and Oklahoma Wind Power Initiative, University of Oklahoma2School of Meteorology, University of Oklahoma3University of Indiana
Abstract
This article presents an overview of research in wind climatology and wind energy. Specifically,patterns and trends in wind speed are examined. This article looks at both past variability andtrends and projected future patterns of the wind resource in various locations across the globe. Areview of the historical and current research and results in each one of these areas is presented. Inaddition, results from research into one of these areas (e.g., analysis of wind speed patterns) arepresented as an example within the overall broader review to illustrate current and potential futureavenues of investigation. In the past, there has been disconnect between the research being con-ducted on wind speed climatology and the efforts of the wind industry to understand changes inthe resource, and this article represents an attempt to summarize the current status of the research,and also suggest possible avenues of future research.
Introduction
‘The renewable energy era has begun’. This quote (Sims 2004) summarizes a detailedanalysis and comparison of the costs of renewable energy systems with fossil fuel-derivedenergy services (see also Islas et al. 2004; Sims et al. 2003). The importance of renewableenergy for sustainable development, energy security, diversification of energy supply, andenvironmental preservation has also been increasingly recognized. The wind industry hasbeen growing at a tremendous rate over the past decade, with installed capacity world-wide increasing over 1000% (American Wind Energy Association, 2010). There is wide-spread recognition at the national and international levels of the importance of renewableenergy technologies. Governments around the world have ambitious plans to help facili-tate this expansion, including, for example, the report from the US Department ofEnergy or US DoE outlining a plan for the country to receive 20% of its electricity fromwind energy by 2030 (US DoE, 2008). However, there has not been a concomitantincrease in the awareness of the impacts that any spatial and temporal trends in theresource (e.g., in the wind speeds themselves) may have on long-term production, use,and implementation of renewable energy and renewable energy policy. Thus, it is thepurpose of this article to provide an overview and summary of research on wind climate,wind variability, and wind energy and to examine their potential impacts on this expandingfield of interest. This is designed as a complement to Barthelmie (2007) who provided anoverview of trends and status of the wind industry. Thus, rather than reproduce an analysisof the industry status, this article will examine the key themes in the relationship betweenwind climate research and wind energy. As will be described in more detail next, themain topics under examination are: (i) examination of changes in patterns and trends inwind speed and wind power density (WPD); and (ii) potential implications of climatechange on the wind resource of the future.
Geography Compass 4/11 (2010): 1592–1605, 10.1111/j.1749-8198.2010.00396.x
ª 2010 The AuthorsGeography Compass ª 2010 Blackwell Publishing Ltd
Past and Present Wind Trends
Programs such as the DoE 20% vision (US DoE, 2008) and wind farm developers typi-cally assume a stationary pattern in the wind resource to determine anything from devel-opment of policy to the economics of a wind farm. However, climate is variable, andtherefore analysis of any changes in the wind speeds over time needs to be performed, asany changes can have substantial impact on wind farm energy production (Palutikof1987). Thus, any trends, or non-stationarities, in the resource need to be investigated,and any such spatial and temporal changes to the wind resource and potential electricityoutput could then quantified. For example, there is often a wide disparity between thewind energy generated in different months (Archer and Jacobson 2003; Baker et al.1990). Thus, the overall yearly wind energy may be almost exclusively generated in just afew months during the year. Any changes in the local seasonal wind speeds at regional orlocal scales, as well as on annual or seasonal time-frames can have a significant impact andneeds to be examined. This could then be, for example, input into an economic analysisto determine the financial impacts of the variability.
There has been a range of studies investigating wind speed variability. Many havefocused on large-scale circulation and seasonal patterns, e.g., wind patterns associated withthe positive and negative phases of the El Nino ⁄ Southern Oscillation Index (Enloe et al.2003), or Pacific ⁄North American Oscillation (Klink 2007) or with mesoscale systems likethe Low-Level Jet (Greene et al. 2009; Lundquist and Mirocha 2008; Storm et al. 2008);or with small local systems where wind flow patterns may result from urban development(Schwartz and Elliott 2006). However, this review will focus on those articles that specifi-cally examine long-term changes in patterns or trends in wind speeds (or WPD). Becauselong-term, consistently geographically spaced wind speed records do not exist at manylocations, some of the current research has examined the model output from the NorthAmerican Regional Reanalysis (NARR; Mesinger 2006), the European Center for Med-ium-Range Weather Forecasts reanalysis data (ECMWF; Uppala et al. 2005), or othersimilar modeling efforts.
There has been research that has examined methods to reconstruct long-term windrecords. These approaches have focused on the techniques themselves, rather than theanalysis of any long-term trends. For example, Palutikof et al. (1992) developed anapproach to examine such long-term variability in the United Kingdom using a techniquethat reconstructed wind speeds. They used a data set consisting of gridded mean sea levelpressure from 1881 to the present. Their effort was not aimed at analyzing trends in thedata, but rather to illustrate how to best reproduce or model long-term wind measure-ments, and the impact of inter-annual variability. For example, they showed that theannual mean varied from about 5 to 7 m ⁄ s, which would correspond to an almost 50%change in electrical output. Similarly, Dukes and Palutikof (1995) were able to recon-struct a series of hourly speeds and gusts for locations in the British Isles to determine theimpact of extreme wind speed events. Using a combined one-step Markov chain modeland a modified form of Monte Carlo analysis, they were able to extrapolate a synthesizedseries to determine the return period of extreme events on the order of hundreds tothousands of years. The aim of their article was to develop an approach to analysis long-term wind variability, rather than actually examine the variability itself. They concludethat, ‘results from the Markov model may be more realistic’ than a traditional extremeevent analysis. The development and estimation of the wind power resource requires anaccurate fit of the probability density function of the wind speeds and WPD (Manwellet al. 2002; Petersen et al. 1997). It has been shown that improved and, more specifically,
Wind climatology and wind energy 1593
ª 2010 The Authors Geography Compass 4/11 (2010): 1592–1605, 10.1111/j.1749-8198.2010.00396.xGeography Compass ª 2010 Blackwell Publishing Ltd
direct, fits to the WPD probability density function can dramatically improve the overallunderstanding of the wind resource (Morrissey et al. 2010). As the WPD is a function ofthe cube of the velocity of the wind, it is critical to have the power curve fit mostaccurately at the high end of the wind speed distribution. Thus, methods like the oneoutlined in Dukes and Palutikof (1995), and the ability to reproduce or generate estimatesof the return time of high-speed ⁄power events are important to the improved under-standing of the overall wind resource.
As discussed before, there have been articles that have examined patterns or trends inthe wind resource in several different geographical locations. Klink (1999, 2002) noted adecrease in the annual mean daily wind speeds across the northern US plains. However,results (Klink 1999) also suggested a more complex pattern than a simple decrease, asthere appeared to be increased maximum monthly wind speeds, in addition to an overallreduction. Keimig and Bradley (2002) showed that for a majority of stations in their analysisacross western Canada and Alaska there has been a decrease in wind speeds. Pryoret al. (2005a) evaluated wind speeds and wind energy output over a 30-year period(1961–1990) across northern Europe. This article used the Weibull distribution parameterto model the wind probability density function (PDF). They note an increase in windspeeds over northern Europe (see also Pryor and Barthelmie 2003). In a similar study, alsousing a Weibull distribution Garcia-Bustamante et al. (2008) examined monthly windenergy trends over a 5-year period in Spain. They noted no specific trend in the data,although such a short time period does not lend itself to long-term trend analysis. How-ever, they did point out that that energy calculations using a Weibull fit results in anunderestimation of total wind energy.
Using reanalysis data, Najac et al. (2009), examined 10-m wind speed patterns inFrance, using data from 1971 to 2002. They note a decrease in wind speed, especially inthe Mediterranean area, and attempted to link this to changes in weather types. Forexample, they found that for Southeast France in the cold season, there was a decrease inthe mean 10-m wind speed and in the number of windy days, and this could be linkedto changes in synoptic-scale disturbances. Specifically, they theorize that the synopticpatterns over the Atlantic and Mediterranean Sea are changing, and that this has resultedin the noted changes in the speed and duration of wind patterns.
Many other studies have also pointed out a stilling of the wind in different locationsacross the globe. For example, Pirazzoli and Tomasin (1999, 2003) reported decreasingwinds, especially easterly winds, in the Mediterranean and Adriatic Areas. A decrease inwinds has been reported elsewhere by Tuller (2004), who noted a decrease in meanannual and winter wind speeds in British Columbia. This study also reported an increasein the percentage of calm wind days and a decrease in the number of high wind speedobservations. McVicar et al. (2008) reported a decrease in over 88% of the stations overland in Australia for the period 1975–2006. Over the continent, the averaged trend for1975–2006 was computed to be )0.009 m ⁄ s ⁄ a. A more recent study (McVicar et al.2010) compared the patterns of temporal wind speed changes at different mountain loca-tions (China and Switzerland). For these locations, the noted a decrease in winds, andalso a strong seasonal component, with the trends showing a strong topographical com-ponent as well, as the patterns ranged, from approximately )0.025 m ⁄ s per kilometer peryear in winter to approximately )0.005 m ⁄ s per kilometer per year in winter. As theyreport, wind speeds ‘has declined more rapidly at higher than lower elevations’. In a sim-ilar study over China, Jiang et al. (2010) analyzed wind speed changes in China over1956–2004. They noted a broad decrease in annual wind speed, and also in days ofstrong wind and in maximum wind. They also found small increases in some locations,
1594 Wind climatology and wind energy
ª 2010 The Authors Geography Compass 4/11 (2010): 1592–1605, 10.1111/j.1749-8198.2010.00396.xGeography Compass ª 2010 Blackwell Publishing Ltd
including the Tibetan Plateau and Guangxi. A study of wind patterns from the CzechRepublic (Brazdil 2008) identified a statistically significant reduction in mean windspeeds in all months, seasons, and annual values over the time period of 1961–2005.
In one of the few studies to examine wind speeds closer to hub heights, Schwartz andElliot (2005) analyzed tall towers for selected stations in the central plains. While they didnot report any specific wind trends, they did highlight areas of potential future researchthat might be important to the wind climatology research community. That included, forexample, results that indicate that for some locations (e.g., Kansas), the strength of theLow-Level Jet seems to have the largest impact on determining wind resources (see alsoGreene et al. 2009). In a similar analysis of tall tower data, Klink (2007) examined spatialcoherence between average monthly wind speeds at 70-m turbine heights and large-scaleatmospheric circulation patterns at sites around Minnesota. Although no statistically signif-icant long-term trends were reported, Klink found that a relationship between windspeed and large scale indices (e.g., PNA, ENSO) could be drawn and then applied toclimate change models in to assess future patterns for wind variability at a given location.
Finally, more recently, Pryor et al. (2009) have examined wind speed trends over thecontiguous USA. They note an ‘overwhelming dominance of trends toward decliningvalues’ for the median values and for annual wind speeds. This fits with many of the arti-cles in different locations across the globe, as discussed before. Pryor et al. (2009), do,however, point out a wide range in the spatial patterns of these values, and note that thepatterns are not uniformly consistent between the different models and reanalysis data thatthey used. They also state that,
Given the importance of the wind energy industry to meeting Federal and State mandates forincreased use of renewable energy supplies and the impact of changing wind regimes on a vari-ety of other industries and physical processes, further research on wind climate variability andevolution is required.
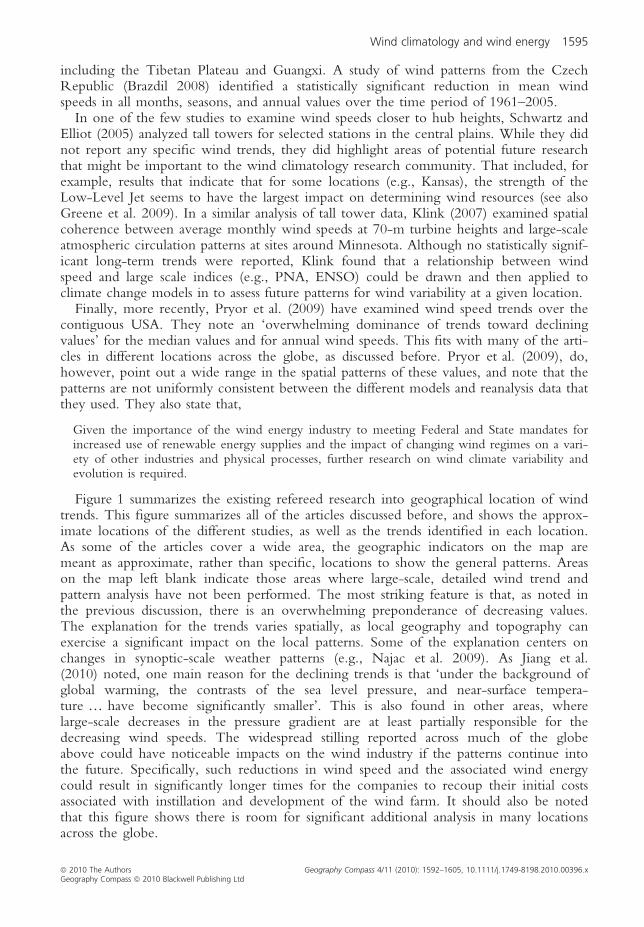
Figure 1 summarizes the existing refereed research into geographical location of windtrends. This figure summarizes all of the articles discussed before, and shows the approx-imate locations of the different studies, as well as the trends identified in each location.As some of the articles cover a wide area, the geographic indicators on the map aremeant as approximate, rather than specific, locations to show the general patterns. Areason the map left blank indicate those areas where large-scale, detailed wind trend andpattern analysis have not been performed. The most striking feature is that, as noted inthe previous discussion, there is an overwhelming preponderance of decreasing values.The explanation for the trends varies spatially, as local geography and topography canexercise a significant impact on the local patterns. Some of the explanation centers onchanges in synoptic-scale weather patterns (e.g., Najac et al. 2009). As Jiang et al.(2010) noted, one main reason for the declining trends is that ‘under the background ofglobal warming, the contrasts of the sea level pressure, and near-surface tempera-ture … have become significantly smaller’. This is also found in other areas, wherelarge-scale decreases in the pressure gradient are at least partially responsible for thedecreasing wind speeds. The widespread stilling reported across much of the globeabove could have noticeable impacts on the wind industry if the patterns continue intothe future. Specifically, such reductions in wind speed and the associated wind energycould result in significantly longer times for the companies to recoup their initial costsassociated with instillation and development of the wind farm. It should also be notedthat this figure shows there is room for significant additional analysis in many locationsacross the globe.
Wind climatology and wind energy 1595
ª 2010 The Authors Geography Compass 4/11 (2010): 1592–1605, 10.1111/j.1749-8198.2010.00396.xGeography Compass ª 2010 Blackwell Publishing Ltd
Changes in WPD and Potential Electrical Output over Oklahoma
Wind speed and potential electrical production are not the same, as the WPD is a func-tion of the cube of the wind speed. While many of the studies described above may beuseful in assessing overall trends in wind speed, it is the WPD that is of most interest toutilities and policy makers. The WPD is required for the estimation of power potentialfrom wind turbines. WPD (see Li and Li 2005), can be expressed as:
WPD ¼Z 1
0
1
2qw3f ðwÞdw
Watts
m2
� �; ð1Þ
where w is the wind speed, q is the air density, and f(w) is the wind speed probabilitydensity function.
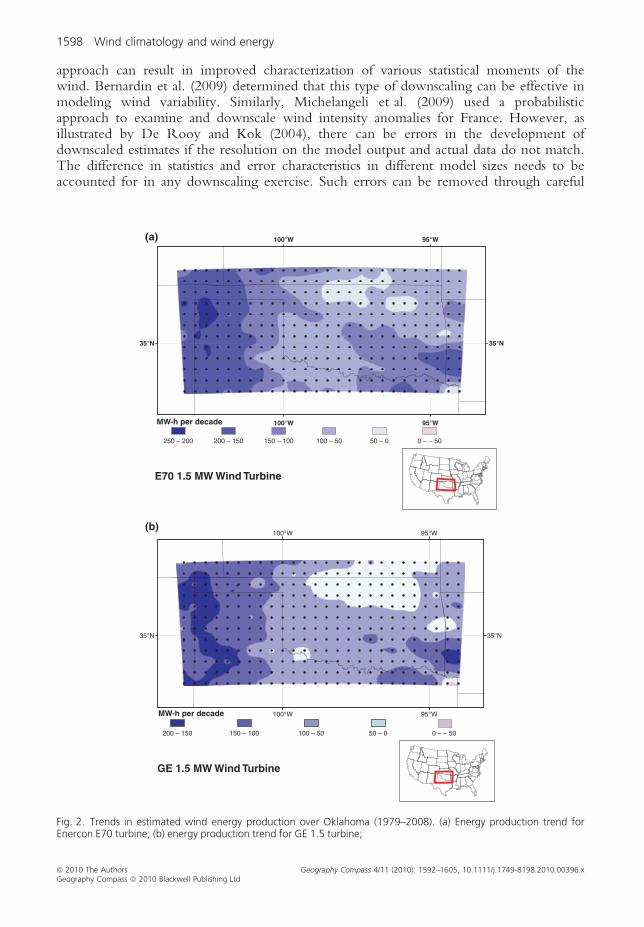
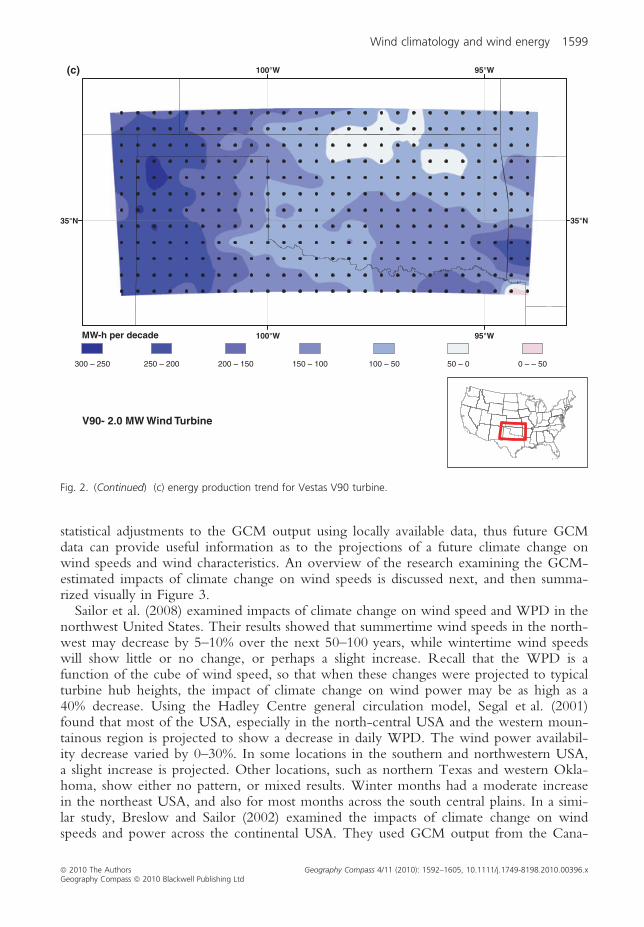
The turbine power output depends on the power curve of the specific turbine used inan individual wind farm. Thus, if one truly wants to examine the impact of climatic vari-ability and change on electricity, one should examine trends in estimated power produc-tion. As an illustration of this, data from the NARR was analyzed to illustrate howtrends in estimated power production can be produced (data obtained from: http://wwwt.emc.ncep.noaa.gov/mmb/rreanl). The NARR data have a temporal resolution of3 h and a spatial resolution of 32 km. The WPD was computed from NARR wind, tem-perature, pressure, and specific humidity data over Oklahoma and regions of adjacentstates for the years 1979–2008. Thus, using the previous equation, WPD was calculatedexplicitly (e.g., using the summation of all the available 3-hourly observations, rather thanan approximation of the WPD PDF). Power curves for three turbines (GE 1.5 MW,Vestas V90 2.0MW, and Enercon E70 2.3MW) were modeled using natural cubicsplines, which were fit to publicly available plots and tables of turbine outputs (see, e.g.,http://www.gepower.com/prod_serv/products/wind_turbines/en/15mw/index.htm as anillustration of the power curves used). Using NARR 30-m wind speeds and applying a
Fig. 1. Summary of reported past and present wind speed trends.
1596 Wind climatology and wind energy
ª 2010 The Authors Geography Compass 4/11 (2010): 1592–1605, 10.1111/j.1749-8198.2010.00396.xGeography Compass ª 2010 Blackwell Publishing Ltd
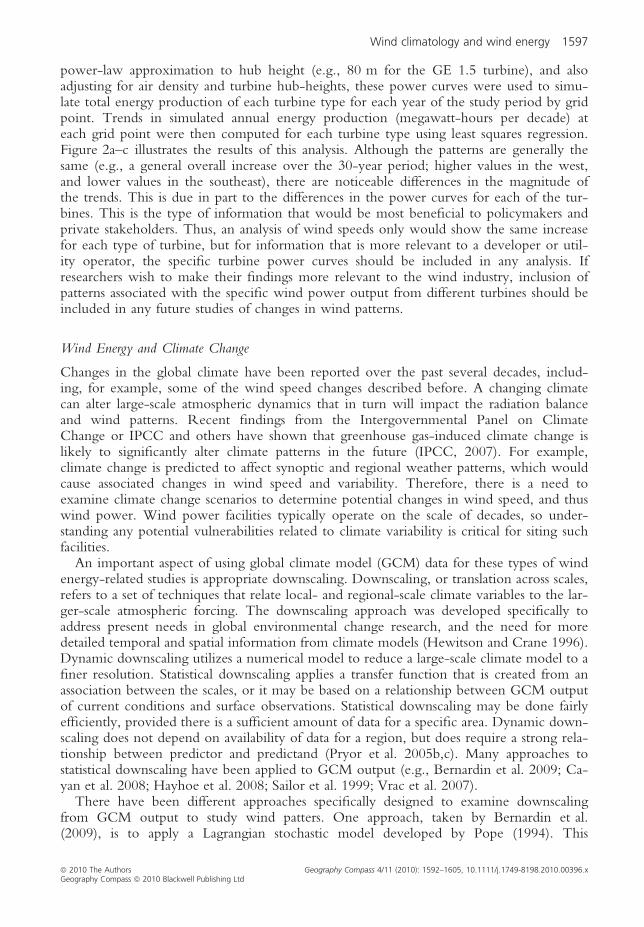
power-law approximation to hub height (e.g., 80 m for the GE 1.5 turbine), and alsoadjusting for air density and turbine hub-heights, these power curves were used to simu-late total energy production of each turbine type for each year of the study period by gridpoint. Trends in simulated annual energy production (megawatt-hours per decade) ateach grid point were then computed for each turbine type using least squares regression.Figure 2a–c illustrates the results of this analysis. Although the patterns are generally thesame (e.g., a general overall increase over the 30-year period; higher values in the west,and lower values in the southeast), there are noticeable differences in the magnitude ofthe trends. This is due in part to the differences in the power curves for each of the tur-bines. This is the type of information that would be most beneficial to policymakers andprivate stakeholders. Thus, an analysis of wind speeds only would show the same increasefor each type of turbine, but for information that is more relevant to a developer or util-ity operator, the specific turbine power curves should be included in any analysis. Ifresearchers wish to make their findings more relevant to the wind industry, inclusion ofpatterns associated with the specific wind power output from different turbines should beincluded in any future studies of changes in wind patterns.
Wind Energy and Climate Change
Changes in the global climate have been reported over the past several decades, includ-ing, for example, some of the wind speed changes described before. A changing climatecan alter large-scale atmospheric dynamics that in turn will impact the radiation balanceand wind patterns. Recent findings from the Intergovernmental Panel on ClimateChange or IPCC and others have shown that greenhouse gas-induced climate change islikely to significantly alter climate patterns in the future (IPCC, 2007). For example,climate change is predicted to affect synoptic and regional weather patterns, which wouldcause associated changes in wind speed and variability. Therefore, there is a need toexamine climate change scenarios to determine potential changes in wind speed, and thuswind power. Wind power facilities typically operate on the scale of decades, so under-standing any potential vulnerabilities related to climate variability is critical for siting suchfacilities.
An important aspect of using global climate model (GCM) data for these types of windenergy-related studies is appropriate downscaling. Downscaling, or translation across scales,refers to a set of techniques that relate local- and regional-scale climate variables to the lar-ger-scale atmospheric forcing. The downscaling approach was developed specifically toaddress present needs in global environmental change research, and the need for moredetailed temporal and spatial information from climate models (Hewitson and Crane 1996).Dynamic downscaling utilizes a numerical model to reduce a large-scale climate model to afiner resolution. Statistical downscaling applies a transfer function that is created from anassociation between the scales, or it may be based on a relationship between GCM outputof current conditions and surface observations. Statistical downscaling may be done fairlyefficiently, provided there is a sufficient amount of data for a specific area. Dynamic down-scaling does not depend on availability of data for a region, but does require a strong rela-tionship between predictor and predictand (Pryor et al. 2005b,c). Many approaches tostatistical downscaling have been applied to GCM output (e.g., Bernardin et al. 2009; Ca-yan et al. 2008; Hayhoe et al. 2008; Sailor et al. 1999; Vrac et al. 2007).
There have been different approaches specifically designed to examine downscalingfrom GCM output to study wind patters. One approach, taken by Bernardin et al.(2009), is to apply a Lagrangian stochastic model developed by Pope (1994). This
Wind climatology and wind energy 1597
ª 2010 The Authors Geography Compass 4/11 (2010): 1592–1605, 10.1111/j.1749-8198.2010.00396.xGeography Compass ª 2010 Blackwell Publishing Ltd
approach can result in improved characterization of various statistical moments of thewind. Bernardin et al. (2009) determined that this type of downscaling can be effective inmodeling wind variability. Similarly, Michelangeli et al. (2009) used a probabilisticapproach to examine and downscale wind intensity anomalies for France. However, asillustrated by De Rooy and Kok (2004), there can be errors in the development ofdownscaled estimates if the resolution on the model output and actual data do not match.The difference in statistics and error characteristics in different model sizes needs to beaccounted for in any downscaling exercise. Such errors can be removed through careful
95°W
95°W
100°W
100°W
35°N 35°N
MW-h per decade
MW-h per decade
0 – – 5050 – 0100 – 50150 – 100200 – 150250 – 200
E70 1.5 MW Wind Turbine
95°W
95°W
100°W
100°W
35°N 35°N
0 – – 50 50 – 0100 – 50150 – 100200 – 150
GE 1.5 MW Wind Turbine
(a)
(b)
Fig. 2. Trends in estimated wind energy production over Oklahoma (1979–2008). (a) Energy production trend forEnercon E70 turbine; (b) energy production trend for GE 1.5 turbine;
1598 Wind climatology and wind energy
ª 2010 The Authors Geography Compass 4/11 (2010): 1592–1605, 10.1111/j.1749-8198.2010.00396.xGeography Compass ª 2010 Blackwell Publishing Ltd
statistical adjustments to the GCM output using locally available data, thus future GCMdata can provide useful information as to the projections of a future climate change onwind speeds and wind characteristics. An overview of the research examining the GCM-estimated impacts of climate change on wind speeds is discussed next, and then summa-rized visually in Figure 3.
Sailor et al. (2008) examined impacts of climate change on wind speed and WPD in thenorthwest United States. Their results showed that summertime wind speeds in the north-west may decrease by 5–10% over the next 50–100 years, while wintertime wind speedswill show little or no change, or perhaps a slight increase. Recall that the WPD is afunction of the cube of wind speed, so that when these changes were projected to typicalturbine hub heights, the impact of climate change on wind power may be as high as a40% decrease. Using the Hadley Centre general circulation model, Segal et al. (2001)found that most of the USA, especially in the north-central USA and the western moun-tainous region is projected to show a decrease in daily WPD. The wind power availabil-ity decrease varied by 0–30%. In some locations in the southern and northwestern USA,a slight increase is projected. Other locations, such as northern Texas and western Okla-homa, show either no pattern, or mixed results. Winter months had a moderate increasein the northeast USA, and also for most months across the south central plains. In a simi-lar study, Breslow and Sailor (2002) examined the impacts of climate change on windspeeds and power across the continental USA. They used GCM output from the Cana-
95°W
95°W
100°W
100°W
35°N 35°N
V90- 2.0 MW Wind Turbine
MW-h per decade
0 – – 5050 – 0100 – 50150 – 100200 – 150250 – 200300 – 250
(c)
Fig. 2. (Continued) (c) energy production trend for Vestas V90 turbine.
Wind climatology and wind energy 1599
ª 2010 The Authors Geography Compass 4/11 (2010): 1592–1605, 10.1111/j.1749-8198.2010.00396.xGeography Compass ª 2010 Blackwell Publishing Ltd

dian Climate Center (CCC) and the Hadley Center to determine variability in seasonalmean wind magnitude. The models were generally consistent in predicting that the USAwill see reduced wind speeds of 1.0–3.2% in the next 50 years, and 1.4–4.5% over thenext 100 years. For summer and fall months the CCC model suggested a 1 m ⁄ s or 15%decrease in wind speeds by the end of the century. These changes, however, do showsome seasonal variability, as spring is projected to show a slight increase while the windspeeds in fall and summer are projected to decrease. Breslow and Sailor (2002), however,suggest that there is a great amount of uncertainty regarding these future estimates. Segalet al. 2001 also note that these efforts should be considered, in their words, an ‘explora-tion’ because of the large uncertainties in the GCM model estimates.
In other locations across the globe, Najac et al. (2009) used linear regression downscal-ing in their examination of winds in France for projected model output out to the end ofthe twenty-first century. Their results noted projected lower wind speeds in winter. Theyalso examined extreme wind days, and noted a projected decrease near the MediterraneanSea and a slight increase in northwestern France. They also noted decreases at moststations during the summer months toward the end of the century. A slight increase,however, is possible for the winds over western Europe (Pryor et al. 2005b,c). Benistonet al. (2007) examined how patterns in wind storms, along with a range of other meteo-rological variables, will change between present (1961–1990) and future (2071–2100).This analysis used present data and diagnostics combined with regional climate modelsimulations. Results showed that for winter storms extreme wind speeds increased, exceptfor some locations near the Alps. Directional patterns also are projected to shifts, andthese extreme winds are estimated to become more north-westerly.
In a combined analysis of past and future wind speed trends, Walter (2006) produced a1 · 1 KM resolution data of monthly wind speeds over Germany from 1951 to 2001.This useful dataset was produced, using a so-called ‘relative altitude’ scheme, interpolatedusing a simple Inverse Distance Weighting approach and retransformed to the actualtopography. Over the entire period, Walter finds patterns similar to those observed else-where, of a stilling, or reduction in long-term wind speeds, with a linear trend of)0.05 m ⁄ s. Walter (2006) also used regional climate models (REMO, MM5, and CLM)
Fig. 3. Summary of estimated future wind speed trends.
1600 Wind climatology and wind energy
ª 2010 The Authors Geography Compass 4/11 (2010): 1592–1605, 10.1111/j.1749-8198.2010.00396.xGeography Compass ª 2010 Blackwell Publishing Ltd
to develop projections of wind speeds for the future. In this case, he produced estimatesfor the time period 2070–2099. Each model showed significant changes in wind speed.This increase was most pronounced over the Baltic Sea and the North Sea. Seasonally,the pattern is for an increase over winter and a decrease during summer. For the Balticregion, the change is up to an increase of 1.0 m ⁄ s in mean wind speeds. Over other loca-tions, such as portions of the Mediterranean are projected to have a similar magnitudedecrease for the 2070–2099 period. In one of the only articles to examine the potentialchanges in the off-shore wind resource, Harrison et al. 2008 looked at the projections forthe off-shore areas of the United Kingdom using series of regional climate scenarios.They note a complex pattern and seasonally varying pattern, with, in general, increasesfor winder and decreases in summer.
More recently, Pryor and Barthelmie (2010) performed a meta-analysis of future pro-jections of wind speeds over northern Europe. Their analysis suggests that, ‘natural vari-ability exceeds the climate change signal in the wind energy resource and extreme windspeeds’. Their conclusion for northern Europe is that by the end of the twenty-first cen-tury there will be a small change in wind speeds, and slight increase in higher andextreme wind speed events. Thus, as noted by this discussion, there is a wide estimationin the impacts of climate change, illustrating that there is much uncertainty in thesefuture projections. This is in part due to the reliance of the model output on differentinput parameters (e.g., Pryor et al. 2005b,c), and also the different downscalingapproaches. It is clear from this analysis that additional work on estimating future patternsof trends in wind speeds and WPD is necessary.
The results of the studies analyzing projected changes in wind speeds for the future aresummarized in Figure 3. Several of the studies listed before note a seasonal pattern in theprojected trends, where one seasonal might show a positive trend and another a negativetrend. This is reflected in the map by a ‘ ⁄ ’, where the value before the slash is summerand the value after the slash is winter. So, a reading of ‘±’ would mean a projected posi-tive trend in summer and a negative one in winter. As can been seen by Figure 3, theprojections are for the stilling patterns of the past few decades to continue, although thereis much more uncertainty about the future projections, and there are several locationswhich are projected to show a complicated pattern, or slight increases.
Summary and Conclusions
This article has provided an overview of the linkages between research into wind clima-tology and wind energy. The focus has been on two areas of importance in this topic: (i)examination of trends in wind speed and WPD for past and present; and (ii) potentialimplications of climate change on the wind resource of the future.
The initial area of discussion focused on the analysis of trends in the wind resource. Aswind farm siting typically assumes a stationary field, any non-stationarities in the windresource can potentially have dramatic impacts on the economic viability of any windfarm. A range of research has been performed at locations worldwide examining windspeed and climatic variability. A large percentage of these articles have noticed a decrease(or ‘stilling’) of winds in many different geographical locations. This suggests, as discussedin some of the literature, that there are larger, synoptic-scale explanations for these trends.However, much of the research examining the trends has failed to include a discussion ofthe statistical significance or provide error bars in the discussion, so the exact explanationof statistical relevance of the trends is hard to assess. In addition, most of these studies arebased upon winds at 10 m (which is where most the available data is located). However,
Wind climatology and wind energy 1601
ª 2010 The Authors Geography Compass 4/11 (2010): 1592–1605, 10.1111/j.1749-8198.2010.00396.xGeography Compass ª 2010 Blackwell Publishing Ltd
changes in electrical output will be noticed at hub height, which can be up to 100 m orhigher. Thus, in addition to improved statistical rigor, additional research using actualdata, or derived products such as the NARR or ERA reanalysis needs to be performed athigher heights to see if the patterns identified near the surface can also been seen athigher elevations.
Finally, a review of research examining the potential implications of climate change onthe wind energy resource was undertaken. The majority of these results show a projectedslight decrease in wind speeds in the future, which would result in serious implicationsfor wind farm siting. In the United States, particularly for the wintertime, this is theo-rized to be associated with a poleward shift of the mean thermal gradient as the earthwarms and results in a northward shift of the associated storm track patterns. There alsoappears to be a strong regional and seasonal pattern. Thus, expanded analysis of this rela-tionship, focusing on location-specific studies of the effects of climate change would bevaluable for industry to improve their wind farm siting efforts.
As described before, the wind industry has been growing at a phenomenal rate, and,with policy efforts like the US DoE 20% plan, is projected to expand and continue toplay an ever-increasing role in electrical production around the world. The geographicaland climatological research community can help with this transition to a sustainableenergy future via an improved understanding of the variables and research questions ofinterest to industry, policymakers, and other stakeholders, and also by addressing some ofthe research deficiencies identified and discussed in this article.
Acknowledgement
The authors like to recognize the Oklahoma Economic Development Generating Excel-lence program, the US Department of Energy, and the Oklahoma state energy office forproviding funding for this project. They also like to thank Nikki Acton, Matt Chatelain,and Ethan Cook for their help with the data processing and mapping.
Short Biographies
Dr. Scott Greene is currently Professor of Geography and Director of the EnvironmentalVerification and Analysis Center and the Oklahoma Wind Power Initiative at the Uni-versity of Oklahoma. Dr. Greene’s current research includes a variety of applied climato-logical research focused on the broad theme of climate diagnostics and analysis of climaticand environmental hazards. Specific examples include examination of the impacts ofextreme climatic events (e.g., drought, heat waves) upon agriculture and human healthand the development of statistical methods to study variability in meteorological patternsacross Oklahoma and the tropical Pacific. Dr. Greene also has extensive expertise in analysisof statistical models for use in validation of applied meteorological modeling. In hiscapacity as director of EVAC and OWPI, Dr. Greene has received numerous researchgrants, and is responsible for overseeing the activities of the center, interacting with avariety of local and state officials, and for coordinating outreach and educational activities.For the last decade, Dr. Greene has also worked with, and is currently director or, theOklahoma Wind Power Initiative (OWPI), a 10-year old, award-winning collaborationbetween the University of Oklahoma and Oklahoma State University. In addition topublishing over 40 papers on renewable energy, applied climatology and statistical meth-ods and teaching a variety of courses, Dr. Greene has also previously served as a technicalconsultant to a wide range of public and private interests. Dr. Greene has also provided
1602 Wind climatology and wind energy
ª 2010 The Authors Geography Compass 4/11 (2010): 1592–1605, 10.1111/j.1749-8198.2010.00396.xGeography Compass ª 2010 Blackwell Publishing Ltd
his consulting expertise to a range of public and privates groups to help support thedevelopment of wind energy in Oklahoma. Finally, Dr. Greene has received a number ofprestigious awards, including a NASA Global Change Fellowship, and the Tromp Scien-tific Award, which is awarded by the International Society of Biometeorology every3 years for outstanding research in biometeorology, as well as different awards for out-standing teaching and research from the University of Oklahoma. Dr. Greene holdsdegrees in Applied mathematics (B.A.; University of California, Berkeley), Geography(M.A., University of Hawaii), and Climatology (Ph.D., University of Delaware).
Mark Morrissey is a professor in the School of Meteorology at the University ofOklahoma. His research interests included wind power assessment and the applicationof random function theory to meteorological and climate problems, especially in theanalysis of tropical meteorology and climate. He received his doctorate in Meteorologyin 1986 from the University of Hawaii. Notable accomplishments include the establish-ment of the Environmental Verification and Analysis Center (EVAC). He is the authoror 48 refereed publications and was the first Pacific Island Global Climate ObservingSystems (PI-GCOS) Coordinator, headquartered in Apia Samoa from 2004 through2005.
Sara Johnson is currently a Geography graduate student at the University of Indiana.Recently, she completed a B.S. in Geography at the University of Oklahoma. While anundergraduate, Sara worked with the Oklahoma Wind Power Initiative where sheresearched past wind trends and future wind power potential for Oklahoma. Otherresearch interests include climate change, applied climatology and natural hazards.
Note
* Correspondence address: Scott Greene, Department of Geography and Oklahoma Wind Power Initiative, Uni-versity of Oklahoma, 100 E. Boyd St., Suite 684, Norman, OK 73019, USA. E-mail: [email protected].
References
American Wind Energy Association. (2010). 2009 Annual Market Report. [Online.] Retrieved on 15 June 2010from: http://www.awea.org/reports/Annual_Market_Report_Press.pdf.
Archer, C. L. and Jacobson, M. (2003). Spatial and temporal distributions of U.S. winds and wind power at 80 mderived from measurements. Journal of Geophysical Research 108 (D9), pp. 4289–4309.
Baker, R. W., Walker, S. and Wade, J. (1990). Annual and seasonal variations in mean wind speed and windturbine energy production. Solar Energy 45 (5), pp. 285–289.
Barthelmie, R. (2007). Wind energy: status and trends. Geography Compass 1 (3), pp. 275–301.Beniston, M., et al. (2007). Future extreme events in European climate: a exploration of regional climate model
projections. Climatic Change 81, pp. 71–95.Bernardin, F., et al. (2009). Stochastic downscaling method: application to wind refinement. Stochastic Environmental
Research and Risk Assessment 23, pp. 851–859.Brazdil, R. (2008). Climate fluctuations in the Czech Republic during the period 1961–2005. International Journal of
Climatology 29, pp. 223–242.Breslow, P. B. and Sailor, D. (2002). Variability of wind power resources to climate change in the continental
United States. Renewable Energy 27 (4), pp. 585–598.Cayan, D., et al. (2008). Climate change scenarios for the California region. Climatic Change 87, pp. 21–42.De Rooy, W. C. and Kok, K. (2004). A combined physical-statistical approach for downscaling of model wind
speed. Weather and Forecasting 19, pp. 485–495.Dukes, M. D. G. and Palutikof, J. P. (1995). Estimation of extreme wind speeds with very long return periods.
Journal of Applied Meteorology 34 (9), pp. 1950–1961.Enloe, J., O’Brien, J. and Smith, S. (2003). ENSO impacts on peak wind gusts in the United States. Journal of
Climate 17, pp. 1728–1737.Garcia-Bustamante, E., et al. (2008). The influence of the Weibull assumption on monthly wind energy estimation.
Wind Energy 11, pp. 483–502.
Wind climatology and wind energy 1603
ª 2010 The Authors Geography Compass 4/11 (2010): 1592–1605, 10.1111/j.1749-8198.2010.00396.xGeography Compass ª 2010 Blackwell Publishing Ltd
Greene, J. S., et al. (2009). Analysis of vertical wind shear in the southern Great Plains and potential impacts onestimation of wind energy production. International Journal of Global Energy Issues 32 (3), pp. 191–211.
Harrison, G. P., Cradden, L. and Chick, J. (2008). Preliminary assessment of climate change impacts on the UKonshore wind energy resource. Energy Sources, Part A 30, pp. 1286–1299.
Hayhoe, K., et al. (2008). Emissions pathways, climate change, and impacts on California. Proceeding of the NationalAcademy of Sciences 101, pp. 12422–12427.
Hewitson, B. C. and Crane, R. (1996). Climate downscaling: techniques and application. Climate Research 7, pp.85–95.
IPCC. (2007). Climate change (2007). In: Solomon, S., Qin, D., Manning, M., Chen, Z., Marquis, M., Averyt, K.B., Tignor, M. and Miller, H. L. (eds) The physical science basis. Contribution of Working Group I to the FourthAssessment Report of the Intergovernmental Panel on Climate Change. Cambridge, UK and New York, NY: Cam-bridge University Press, pp. 750–800.
Islas, J., Manzini, F. and Martinez, M. (2004). CO2 mitigation costs for new renewable energy capacity in the Mex-ican electricity sector using renewable energies. Solar Energy 76, pp. 499–507.
Jiang, Y., Luo, Y., Zhao, Z. C., et al. (2010). Changes in wind speed over China during 1956–2004. Theoreticaland Applied Climatology 99 (3–4), pp. 421–430.
Keimig, F. T. and Bradley, R. S. (2002). Recent changes in wind chill temperatures at high latitudes in NorthAmerica, 2002. Geoophysical Research Letters 29 (8), pp. 1163.1–1163.4; doi: 10.1029/2001GL013228.
Klink, K. (1999). Trends in mean monthly maximum and minimum surface wind speeds in the conterminous Uni-ted States, 1962 to 1990. Climate Research 13, pp. 193–205.
Klink, K. (2002). Trends in and interannual variability of wind speed distributions in Minnesota. Journal of Climate15, pp. 3311–3317.
Klink, K. (2007). Atmospheric circulation effects on wind speed variability at turbine height. Journal of Applied Mete-orology and Climatology 46, pp. 445–456.
Li, M. and Li, X. (2005). MEP-type distribution function: a better alternative to Weibull function for wind speeddistributions. Renewable Energy 30, pp. 1221–1240.
Lundquist, J. K. and Mirocha, J. (2008). Interaction of nocturnal low-level jets with urban geometries as seen injoint urban 2003 data. Journal of Applied Meteorology and Climatology 47 (1), pp. 44–58.
Manwell, J. F., McGowan, J. and Rogers, A. (2002). Wind energy explained: theory, design and application. Chichester:Wiley.
McVicar, T. R., et al. (2008). Wind speed climatology and trends for Australia, 1975–2006: capturing the stillingphenomenon and comparison with near-surface reanalysis output. Geophysical Research Letters 35. L2040.1–L2040.6; doi: 10.1029/2008GL035627.
McVicar, T. R., et al. (2010). Observational evidence from two mountainous regions that nearsurface wind speedsare declining more rapidly at higher elevations than lower elevations: 1960–2006. Geophysical Research Letters 37.L06402.1–L06402.6; doi: 10.1029/2009GL042255.
Mesinger, F. (2006). North American regional reanalysis. Bulletin of the American Meteorological Society 87, pp. 343–360. doi: 10.1175/BAMS-87-3-343.
Michelangeli, P. A., Vrac, M. and Loukos, H. (2009). Probabilistic downscaling approaches: application to windcumulative distribution functions. Geophysical Research Letters 36, pp. 1–6.
Morrissey, M. L., Albers, A., Greene, J. S. and Postawko, S. (2010). An isofactorial change-of-scale model for thewind speed probability density function. Journal of Atmospheric and Oceanic Technology 27 (2), pp. 257–273.
Najac, J., Boe, J. and Terray, L. (2009). A multi-model ensemble approach for assessment of climate change impacton surface winds in France. Climate Dynamics 32, pp. 615–634.
Palutikof, J. P. (1987). Impacts of spatial and temporal wind speed variability on wind energy output. Journal ofClimate and Applied Meteorology 26, pp. 1124–1133.
Palutikof, J. P., Geo, X. and Halliard, J. A. (1992). Climate variability and UK wind resource. Journal of WindEngineering and Industrial Aerodynamics 39 (1:3), pp. 243–249.
Petersen, E. L., et al. (1997). Wind power meteorology. Roskilde, Denmark: Riso National Laboratory, publication #RISO-I-1206.
Pirazzoli, P. and Tomasin, A. (1999). Recent abatement of easterly winds in the northern Adriatic. InternationalJournal of Climatology 19, pp. 1205–1219.
Pirazzoli, P. and Tomasin, A. (2003). Recent near-surface wind changes in the central and Mediterranean andAdriatic areas. International Journal of Climatology 23, pp. 963–973.
Pope, S. (1994). Lagrangian PDF methods for turbulent flows. Annual Review of Fluid Mechanics 26, pp. 23–63.Pryor, S. C. and Barthelmie, R. J. (2003). Long term trends in near surface flow over the Baltic. International Journal
of Climatology 23, pp. 271–289.Pryor, S. C. and Barthelmie, R. J. (2010). Climate change impacts on wind energy: a review. Renewable and
Sustainability Energy Reviews 14 (1), pp. 430–437.Pryor, S. C., Barthelmie, R. J. and Kjellstrom, E. (2005a). Potential climate change impact on wind energy
resources in Northern Europe: analyses using a regional climate model. Climate Dynamics 25, pp. 815–835.
1604 Wind climatology and wind energy
ª 2010 The Authors Geography Compass 4/11 (2010): 1592–1605, 10.1111/j.1749-8198.2010.00396.xGeography Compass ª 2010 Blackwell Publishing Ltd
Pryor, S. C., Schoof, J. T. and Barthelmie, R. J. (2005b). Empirical downscaling of wind speed probability distri-butions. Journal of Geophysical Research 110, 12 pp. D19109; doi:10.1029/2005JD005899.
Pryor, S. C., Schoof, J. T. and Barthelmie, R. J. (2005c). Climate changes impacts on wind speeds and windenergy density in Northern Europe: empirical downscaling of multiple AOGCMs. Climate Research 29, pp. 183–198.
Pryor, S. C., Barthelmie, R. J., Young, D. T., et al. (2009). Wind speed trends over the contiguous United States.Journal of Geophysical Research 114, 18 pp. D14105; doi: 10.1029/2088JD011416.
Sailor, D. J., Rosen, J. N., Hu, T. and Li., X. (1999). A neural network approach to local downscaling of GCMoutput for assessing wind power implications of climate change. Renewable Energy 24, pp. 235–243.
Sailor, D. J., Smith, M. and Hart, M. (2008). Climate change implications for wind power resources in the north-west United States. Renewable Energy 33, pp. 2393–2406.
Schwartz, M. and Elliot, D. (2005). Towards a wind energy climatology at advanced turbine hub heights, Golden, CO:National Renewable Energy Lab. NREL ⁄ CP-500-38109.
Schwartz, M. and Elliott, D. (2006). Wind shear characteristics at central plains tall towers, Golden, CO: NationalRenewable Energy Lab. NREL ⁄ CP-500-40019.
Segal, M., Pan, Z., Arritt, R. W. and Tackle, E. S. (2001). On the potential change in wind power over the USdue to increases of atmospheric greenhouse gases. Renewable Energy 24, pp. 235–243.
Sims, R. E. H. (2004). Renewable energy: a response to climate change. Solar Energy 76, pp. 9–17.Sims, R. E. H., Rogner, H. H. and Gregory, K. (2003). Carbon emission and mitigation costs comparisons
between fossil fuel, nuclear, and renewable energy resources for electricity generation. Energy Policy 31, pp.1315–1326.
Storm, B., et al. (2008). Evaluation of the weather research and forecasting model on forecasting low-level jets:implications for wind energy. Wind Energy 12, pp. 81–90.
Tuller, S. E. (2004). Measured wind speed trends on the west coast of Canada. International Journal of Climatology 24(11), pp. 1359–1374.
Uppala, S. M., et al. (2005). The ERA-40 re-analysis. Quarterly Journal of the Royal Meteorological Society 131, pp.2961–3012.
U.S. Department of Energy. (2008). 20% wind energy by 2030: increasing wind energy’s contribution to U.S. electric sup-ply, Golden, CO. DOE ⁄ GO-102008-2567.
Vrac, M., Stein, M. L., Hayhoe, K., et al. (2007). A general method for validating statistical downscaling methodsunder future climate change. Geophysical Research Letters 34 (18), pp. L18701.1–L10801.5. doi: 10.1029/2007GL030295.
Walter, A. (2006). A high resolution reference data set of Germany Win Velocity, 1951–2001 and comparison withregional climate model results. Meteorologische Zeitschrift 15, pp. 585; doi: 10.1127/0941-2948/2006/0162.
Wind climatology and wind energy 1605
ª 2010 The Authors Geography Compass 4/11 (2010): 1592–1605, 10.1111/j.1749-8198.2010.00396.xGeography Compass ª 2010 Blackwell Publishing Ltd


![SAR Wind Measurements for Wind Climatology: Application to …breeze.colorado.edu/ftp/RSWE/Frank_Monaldo.pdf · 2012. 6. 11. · Coastal and Marine Applications of SAR [19]. Figure](https://img.pdfslide.net/doc/110x75/61108e93d695b745a67f3bc5/sar-wind-measurements-for-wind-climatology-application-to-2012-6-11-coastal.jpg)