Embed Size (px)
Citation preview

A national laboratory of the U.S. Department of EnergyOffice of Energy Efficiency & Renewable Energy
National Renewable Energy Laboratory Innovation for Our Energy Future
Wind Energy and Air Emission Reduction Benefits: A Primer D. Jacobson D.J. Consulting LLC McLean, Virginia
C. High Resource Systems Group Inc. White River Junction, Vermont
Subcontract Report NREL/SR-500-42616 February 2008
NREL is operated by Midwest Research Institute ● Battelle Contract No. DE-AC36-99-GO10337

National Renewable Energy Laboratory1617 Cole Boulevard, Golden, Colorado 80401-3393 303-275-3000 • www.nrel.gov
Operated for the U.S. Department of Energy Office of Energy Efficiency and Renewable Energy by Midwest Research Institute • Battelle
Contract No. DE-AC36-99-GO10337
Subcontract Report NREL/SR-500-42616 February 2008
Wind Energy and Air Emission Reduction Benefits: A Primer D. Jacobson D.J. Consulting LLC McLean, Virginia
C. High Resource Systems Group Inc. White River Junction, Vermont
NREL Technical Monitor: Lori Bird Prepared under Subcontract No. LAM-7-77553-01 Period of Performance: August 1, 2007 — December 31, 2007

NOTICE
This report was prepared as an account of work sponsored by an agency of the United States government. Neither the United States government nor any agency thereof, nor any of their employees, makes any warranty, express or implied, or assumes any legal liability or responsibility for the accuracy, completeness, or usefulness of any information, apparatus, product, or process disclosed, or represents that its use would not infringe privately owned rights. Reference herein to any specific commercial product, process, or service by trade name, trademark, manufacturer, or otherwise does not necessarily constitute or imply its endorsement, recommendation, or favoring by the United States government or any agency thereof. The views and opinions of authors expressed herein do not necessarily state or reflect those of the United States government or any agency thereof.
Available electronically at http://www.osti.gov/bridge
Available for a processing fee to U.S. Department of Energy and its contractors, in paper, from:
U.S. Department of Energy Office of Scientific and Technical Information P.O. Box 62 Oak Ridge, TN 37831-0062 phone: 865.576.8401 fax: 865.576.5728 email: mailto:[email protected]
Available for sale to the public, in paper, from: U.S. Department of Commerce National Technical Information Service 5285 Port Royal Road Springfield, VA 22161 phone: 800.553.6847 fax: 703.605.6900 email: [email protected] online ordering: http://www.ntis.gov/ordering.htm
This publication received minimal editorial review at NREL
Printed on paper containing at least 50% wastepaper, including 20% postconsumer waste
Acknowledgements The authors wish to acknowledge the support that made this report possible. The U.S. Department of Energy’s Wind Powering America Program funded this report. Lori Bird, Laura Vimmerstedt, and Larry Flowers of the National Renewable Energy Laboratory (NREL) provided overall guidance and detailed comments. Andrew Vanderjack of The George Washington University Law School provided valuable research assistance. In addition, we greatly appreciate the input of the following individuals, who provided comments during the review process: Amy Royden-Bloom of the National Association of Clean Air Agencies; Pam Mendelson of Navarro Research and Engineering; Tom Rawls of THR Associates, LLC; Elizabeth Salerno of the American Wind Energy Association; and Paul Denholm and Michael Milligan of NREL. Although we appreciate all contributions, the authors retain full responsibility for the content of the report.
1

Table of Contents
ACKNOWLEDGEMENTS _______________________________________________ 1
EXECUTIVE SUMMARY ________________________________________________ 4
WIND ENERGY AND AIR EMISSION REDUCTION BENEFITS _________________ 6
Introduction ________________________________________________________________________________6
Zero-Emissions Wind Energy Versus Emissions from Fossil Fuel-Fired Generation _____________________6
Major Contribution of Electric Power Plant Emissions to Air Pollution and Climate Change _____________8
Wind Energy Displaces Emissions from Fossil Fuel-Fired Power Plants _______________________________9
Methodologies for Analysis of Avoided Emissions_________________________________________________11
Wind Energy Can Reduce Overall Emissions, Even Under Emissions Trading Programs________________12
State Air Quality Plans Can Recognize Air Emission Reductions Resulting from Wind Energy___________16
Wind Energy Helps to Meet Emission Caps by Reducing Pollution Control Compliance Costs ___________17
Misperceptions about Backup Generation _______________________________________________________18
Conclusion _________________________________________________________________________________18
APPENDICES _______________________________________________________ 19
Appendix A: List of References________________________________________________________________19
Appendix B: Energy Generation and Air Emissions Terminology ___________________________________25
Appendix C: Air Quality Nonattainment and State Implementation Plans: The Basics __________________27
Appendix D: Emissions Trading (Cap and Trade) Background _____________________________________29
Appendix E: Allowance Allocation to Wind Energy under the Clean Air Interstate Rule ________________31
Appendix F: Avoided Emission Rates___________________________________________________________38
2

Table of Figures Figure 1: Contribution of fossil fuel-fired electric power generation to total air emissions in the
United States. _________________________________________________________ 8 Figure 2: Air quality nonattainment areas in the United States.__________________________ 9 Figure 3: States covered by the U.S. EPA Clean Air Interstate Rule. ____________________ 30 Table of Tables Table 1: Summary of the Health and Environmental Effects of Air Emissions from Fossil Fuel-
Fired Power Plants in the United States_____________________________________ 7 Table 2: State Allocation of Nitrogen Oxide Allowances to Energy Efficiency and Renewable
Energy (EE/RE) Under Clean Air Interstate Rule ____________________________ 32 Table 3: Details of State Energy Efficiency and Renewable Energy (EE/RE) Set-Asides for
NOx Allowances Under Clean Air Interstate Rule ___________________________ 33 Table 4: Examples of Avoided Emission Rates for Wind Power in Selected U.S. Regions ___ 38 Table 5: Variation in Fossil Fuel Air Emissions Rates for Major U.S. Electric Power Generating
Companies __________________________________________________________ 40
3

Executive Summary This document provides a summary of the impact of wind energy development on various air pollutants for a general audience. The core document addresses the key facts relating to the analysis of emission reductions from wind energy development. It is intended for use by a wide variety of parties with an interest in this issue, ranging from state environmental officials to renewable energy stakeholders. The appendices provide basic background information for the general reader, as well as detailed information for those seeking a more in-depth discussion of various topics. Zero-Emissions Wind Energy Versus Emissions from Fossil Fuel-Fired Generation: One of the obvious benefits of wind energy is that the production of electricity from this source involves zero direct emissions of air pollutants. In contrast, fossil fuel-fired electric generation from coal, oil, or natural gas results in substantial direct emissions of numerous air pollutants that have adverse impacts on public health and the environment. Electric generation from fossil fuel-fired power plants is a leading source of air emissions that harm human health and contribute to global climate change – resulting in 39% of carbon dioxide (CO2) emissions, 22% of nitrogen oxide (NOx) emissions, 69% of sulfur dioxide (SO2) emissions, and 40% of mercury emissions in the United States. Other pollutants include volatile organic compounds (e.g., benzene, dioxins) and heavy metals (e.g., arsenic, lead). Health experts have documented that pollutants from fossil fueled power plants, particularly coal plants, result in a wide range of serious health effects. These adverse health effects include lung cancer and other respiratory diseases (e.g., asthma), other carcinogenic effects, neurotoxic effects, and elevation of heart disease risks. Wind Energy Displaces Emissions from Fossil Fuel-Fired Power Plants: Wind energy generation results in reductions in air emissions because of the way the electric power system works. Wind energy is a preferred power source on an economic basis because the operating costs to run the turbines are very low and there are no fuel costs. Thus, when the wind turbines produce power, this power source will displace generation at fossil fueled plants, which have higher operating and fuel costs. The specific types of fossil fuel-fired power units that will be displaced by wind generation vary significantly among states and regions. Some states and regions rely on coal plants for a majority of their generation (e.g., West Virginia), whereas other regions and states rely heavily on natural gas-fired units (e.g., most of New England). The displaced emissions of CO2, NOx, SO2, and mercury generally will be greater in areas with large amounts of coal-fired generation and lower in areas where natural gas is the dominant fuel. The emissions level is also influenced by the age of the fossil fuel-fired units, as well as their relative levels of efficiency and pollution control. Methodologies for Analysis of Avoided Emissions: There are a variety of recognized methods to measure the amount of air emission reductions that result when fossil fuel-fired electric generating plants are displaced by wind power. Different methods may be most appropriate depending on the analysis goal. Although there are variations in methodologies, the process involves several major steps: (1) specifying the appropriate geographic areas where the avoided emissions occur; (2) identifying the fossil fuel-fired electric generation that is displaced when
4

wind plants come online; and (3) determining the emission rates for the fossil fuel-fired generation that is displaced in the specific time periods that wind generation is occurring. In addition, analysis of displaced emissions may focus on the effects of avoided emissions from current units operating at the margin and the effects of avoided emissions from the future construction of new fossil fuel-fired units. Wind Energy Can Reduce Overall Emissions Even Under Emissions Trading Programs: The impact of wind generation on overall emissions is more complicated for pollutants —including NOx and SO2 — that currently are subject to emissions trading (cap and trade) programs. In such cases, it is not sufficient to simply analyze the physical operation of the electric system. Rather, it is also necessary to review the specific rules governing the emissions trading program to determine if overall emissions will be reduced below the level of the cap. Moreover, many pollutants that pose serious adverse health and environmental impacts, such as CO2, fine particulate matter, volatile organic compounds (i.e., dioxins), and trace heavy metals are not currently subject to emissions trading requirements. Emissions of these pollutants also may be reduced when fossil fuel generation is backed down by wind generation. State Air Quality Plans Can Recognize Emission Reductions Resulting from Wind Energy: In recent years, the U.S. Environmental Protection Agency (EPA) has formally recognized that wind energy purchases — combined with the retirement of a commensurate amount of emissions allowances by a wind developer or the state — can qualify for emissions reduction credit in a state air quality plan under specified circumstances. Since 2005, several states and municipalities have followed this guidance, and they have relied on wind purchase commitments in their SIPs in conjunction with the retirement of allowances to demonstrate a reduction in NOx emissions. Wind Energy Helps to Meet Emission Caps by Reducing Pollution Control Compliance Costs: Even for projects in which wind energy does not reduce total air emissions below the level of general emission caps, the increased use of wind energy contributes to efforts to meet such caps. When wind energy comes online, it generally reduces the amount of energy that must be generated from fossil fuel-fired generators, thereby reducing emissions from such facilities and lowering the costs faced by the owners of those facilities in complying with pollution control requirements. These reduced pollution control costs will facilitate compliance with emission reduction goals for both greenhouse gases and conventional pollutants. Misperceptions about Backup Generation: One of the misperceptions about wind power generation is that the air emission reduction benefits are extremely limited because of the need to construct significant additional backup fossil fuel generation. With increased experience in integrating wind generation and balancing various sources of electric power over a large power control area, utility grid operators have learned how to reduce variability and limit reserve additions to modest requirements when wind generation is brought online. This operational experience has been demonstrated most clearly at moderate levels of wind penetration of up to 10% to 20%. Conclusion: In summary, wind energy can be cited for several important air emission reduction benefits. It contributes to the reduction of emissions of various harmful air pollutants, has played a role in improving regional air quality, and has supported efforts to meet emission caps in a cost-effective manner.
5

Wind Energy and Air Emission Reduction Benefits
Introduction In recent years, increasing attention has been focused on understanding and quantifying the impact of wind energy development on various air pollutants. The focus on this issue has intensified as public concern about global climate change has heightened and the contribution to greenhouse gas emissions from fossil fuels to this critical problem has been recognized. For example, wind energy’s air emission reduction benefits have been a source of some confusion in state proceedings to site wind turbines. As utility commissions, environmental agencies, and other stakeholders assess the environmental impacts of wind energy, air emission reductions have become an important part of the evaluation. This document provides a description of the impact of wind energy development on air emissions. The core document is intended for use by a variety of parties with an interest in this issue, such as state energy and environmental agencies, county and municipal officials, environmental organizations, and the renewable energy community. The appendices provide full references, as well as detailed information for those seeking a more in-depth discussion of selected topics. One of the obvious benefits of wind energy is that producing electricity from wind produces zero direct emissions of air pollutants. In contrast, fossil fuel-fired electric generation from coal, oil, or natural gas results in substantial direct emissions of numerous air pollutants that have adverse impacts on public health and the environment. The generation of wind energy also displaces generation from individual fossil fuel-fired power plants or units – thereby reducing fuel consumption and the resulting air emissions that would have otherwise occurred. It should be noted that all forms of energy development — from coal and nuclear generation to wind generation — have positive and negative environmental impacts. However, the focus of this document is limited to air emissions, and it is not designed to provide a comprehensive life-cycle analysis of the full range of environmental effects of the various forms of electric generation.
Zero-Emissions Wind Energy Versus Emissions from Fossil Fuel-Fired Generation Wind energy produces zero direct air emissions in the generation process. Wind energy nearly always displaces fossil fuel-fired generation that has direct air emissions of pollutants that adversely impact public health and the environment. As a result of these environmental differences, there generally are air quality benefits when wind generation reduces fossil fuel combustion at existing power plants or reduces the need to build and operate new fossil fueled power plants. The principal air emissions from fossil fuel-fired electric power plants and their major health and environmental effects are described in Table 1.
6

Table 1: Summary of the Health and Environmental Effects of Air Emissions from Fossil Fuel-Fired Power Plants in the United States*
*Emissions references are from the U.S. Environmental Protection Agency, Compilation of Air Pollution Emissions Factors (AP42), Chapter 1.1, updated 2007. The air emission health effects descriptions are based on U.S. EPA, Air Quality Index: A Guide to Air Quality and Your Health, EPA-454/K-03-002, 2003. The description of the mercury health impacts is based on U.S. EPA, Clean Air Mercury Rule: Basic Information, 2004.
Air Pollutant Fossil Fuel Sources
Health & Environmental Impacts
Other Considerations
Sulfur Dioxide (SO2)
Produced by combustion of sulfur in coal- and oil-fired plants
Exacerbates heart disease and chronic lung disease, especially in children, older adults, and asthmatics
A major contributor to acid rain, particulate matter, and regional haze
Nitrogen Oxides (NOx)
Produced during combustion by the oxidation of nitrogen in coal, oil, and natural gas and the oxidation of nitrogen in the air
At high concentrations, can cause adverse respiratory effects in children and adults
Precursor to ground-level ozone that is formed by photochemical reactions with VOCs. Ozone is a lung irritant that affects people with respiratory diseases, including asthma, especially during outdoor exercise. Also a contributor to the formation of particulate matter
Particulate Matter
(PM10 and PM2.5)
Produced by combustion of fossil fuels and by reactions of SO2 and NOx
Can cause or aggravate heart or lung diseases. Causes regional haze and visibility problems
Can be transported long distances and acts as a carrier for toxic substances, including trace heavy metals
Mercury (Hg)
Emitted during coal combustion
Primary exposure is from eating fish high in mercury compounds. Fetal exposure may lead to neurobehavioral and learning problems
Mercury is transferred from the air to water bodies where it accumulates in the food chain
Volatile Organic Compounds
(VOCs)
Produced during combustion from hydrocarbons, principally in coal- and oil-fired plants
VOCs include polynuclear aromatic hydrocarbons, dioxins, furans, formaldehyde, and benzene. These are human carcinogens and toxins
VOCs react with NOx to form ground-level ozone in the lower atmosphere ( See NOx above )
Trace Heavy Metals
Emitted during combustion in coal- and oil-fired plants
Trace heavy metals include arsenic, cadmium, lead, antimony, manganese, nickel, beryllium, cobalt, chromium, and selenium. These are human carcinogens and/or toxins
Trace heavy metals are transferred to water bodies where they accumulate in the food chain
Carbon Dioxide (CO2)
Produced during combustion by the oxidation of carbon in coal, oil, and natural gas
Carbon dioxide is the principal greenhouse gas causing global warming
Combustion of fossil fuels also contributes to emissions of other greenhouse gases: methane (CH4) and nitrous oxide (N2O)
7

Major Contribution of Electric Power Plant Emissions to Air Pollution and Climate Change Electric generation from fossil fuel-fired power plants is one of the major sources of air emissions that harm human health and the environment and contribute to global climate change.
69%
22%
40%
39%
0% 10% 20% 30% 40% 50% 60% 70% 80%
Sulfur Dioxide
Nitrogen Oxides
Mercury
Carbon Dioxide
% of Total US Emissions
Figure 1: Contribution of fossil fuel-fired electric power generation to total air emissions in the United States.1 Fossil fuel-fired power plants, especially coal-fired electric generation, are the largest source of sulfur dioxide emissions, and as a result, fossil fuel-fired electricity is the principal cause of acid precipitation in the Eastern states. In addition, both sulfur dioxide and nitrogen oxide emissions are major contributors to fine particulate pollution and regional haze. Combustion from coal-fired power plants also is the largest source of mercury emissions in the country, and air emissions from coal plants in the United States and other countries are a primary cause of mercury deposition into water bodies. This mercury pollution accumulates in the food chain and results in dangerous concentrations of mercury compounds in freshwater fish used for human consumption.2 In addition, fossil fuel-fired electricity is a major source of nitrogen oxides. On a national basis, electric power plants are approximately co-equal as the major source of nitrogen oxides, along
1 Miller, P.J.; Van Atten, C. North American Power Plant Emissions, Commission on Environmental Cooperation in North America, 2005 (Table 1.1 based on 2002 data). 2 U.S. Environmental Protection Agency, Clean Air Mercury Rule: Basic Information; Letter from Jon Mueller, Chesapeake Bay Foundation, to Mary Major, Virginia Department of Environmental Quality, Concerning the Virginia Clean Air Mercury Rule, November 4, 2005.
8
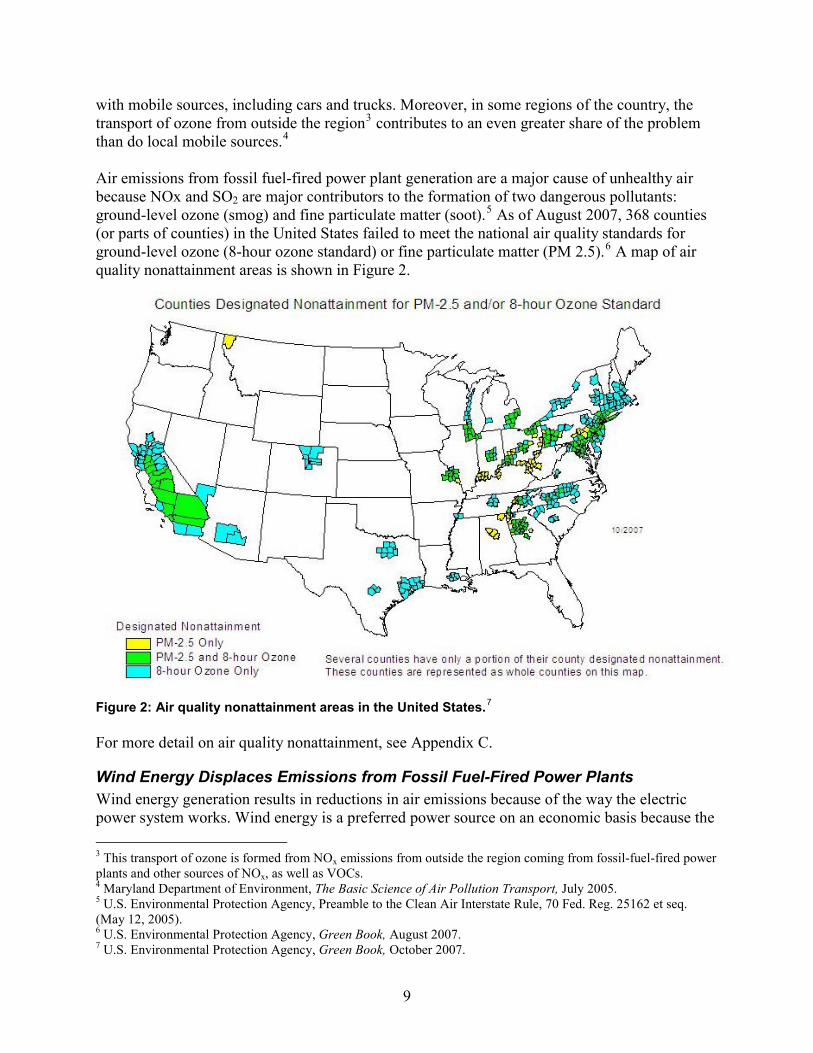
with mobile sources, including cars and trucks. Moreover, in some regions of the country, the transport of ozone from outside the region3 contributes to an even greater share of the problem than do local mobile sources.4 Air emissions from fossil fuel-fired power plant generation are a major cause of unhealthy air because NOx and SO2 are major contributors to the formation of two dangerous pollutants: ground-level ozone (smog) and fine particulate matter (soot).5 As of August 2007, 368 counties (or parts of counties) in the United States failed to meet the national air quality standards for ground-level ozone (8-hour ozone standard) or fine particulate matter (PM 2.5).6 A map of air quality nonattainment areas is shown in Figure 2. Figure 2: Air quality nonattainment areas in the United States.7 For more detail on air quality nonattainment, see Appendix C.
Wind Energy Displaces Emissions from Fossil Fuel-Fired Power Plants Wind energy generation results in reductions in air emissions because of the way the electric power system works. Wind energy is a preferred power source on an economic basis because the 3 This transport of ozone is formed from NOx emissions from outside the region coming from fossil-fuel-fired power plants and other sources of NOx, as well as VOCs. 4 Maryland Department of Environment, The Basic Science of Air Pollution Transport, July 2005. 5 U.S. Environmental Protection Agency, Preamble to the Clean Air Interstate Rule, 70 Fed. Reg. 25162 et seq. (May 12, 2005). 6 U.S. Environmental Protection Agency, Green Book, August 2007. 7 U.S. Environmental Protection Agency, Green Book, October 2007.
9

operating costs to run the turbines are very low8 because there are no fuel costs. Thus, when the wind turbines produce power, electricity supplies from other sources will be reduced or not brought online.9 Almost always, the most expensive power will be “backed down” or avoided.10 Typically, wind power will displace generation at individual fossil fuel-fired power plants, which have higher operating costs and substantial fuel costs. At the same time, wind energy generation almost never displaces nuclear power on the electric grid. Nuclear power plants are normally operated as baseload generators that run at full capacity because they have such low operating costs. In addition, wind energy generally does not reduce hydroelectric energy on the grid because of its low operating costs and flow constraints. Although hydroelectric generation may be shifted in time as a result of wind generation, total generation at such hydroelectric plants is generally not reduced on average. The operating schedule of hydroelectric plants also may be limited by environmental constraints.
Variations by State, Region, and Fuel Type
The specific types of fossil fuel-fired power units that will be displaced by wind generation vary significantly among states and regions of the country. Some states and regions rely on coal plants for a majority of their generation (e.g., West Virginia, Pennsylvania, and other parts of the PJM power market, and parts of the Midwest and the South), whereas other states and regions rely more heavily on natural gas-fired units (e.g., most of New England, New York, and California).11 For example, according to the chief operating officer of the PJM Regional Transmission Organization, wind energy displaced coal-fired generation about 70% of the time in this power market in 2006.12 This result occurs because coal plants provide not only baseload power but also intermediate and peakload power during certain hours and seasons of the year.13 Even in New England, where natural gas is typically the marginal fuel, wind energy backs down some generating units fired by coal and residual oil at certain times.14 The displaced emissions of CO2, NOx, SO2, and mercury generally will be greater in areas with large amounts of coal-fired generation and lower in areas where natural gas is the dominant or load-following fuel. (See Appendix F for a discussion of emission rates for selected regions). 8 Interview with Karl Pfirrmann, Interim President and CEO of PJM Interconnection, PJM and Wind, E-Cubed Publication of Penn Future, December 5, 2007. 9 Ibid. 10 Ibid. 11 U.S. Environmental Protection Agency, Emissions & Generation Resource Integrated Database (eGRID), 2005. 12 Interview with Karl Pfirrmann, Interim President and CEO of PJM Interconnection, PJM and Wind, E-Cubed Publication of Penn Future, December 5, 2007. 13 U.S. Environmental Protection Agency, Emissions & Generation Resource Integrated Database (eGRID), 2005. Once a coal plant is running, the operator can easily increase the amount of fuel that is fired in the boiler, thereby increasing the amount of electricity produced. For example, a large coal-fired plant often provides baseload power in the middle of the night, and then ramps up to intermediate capacity on a summer morning and to peakload power in the afternoon on a hot summer day. Coal plants provide intermediate and peakload power in the markets where such plants are available because of the very high cost of natural gas and residual fuel oil. 14 Independent System Operator New England, 2004 New England Marginal Emission Rate Analysis, 2005.
10

The level of emissions reduction is influenced by the age of the fossil fuel-fired units, their relative levels of energy efficiency, the fuel characteristics (such as sulfur content of the coal), and their relative levels of pollution controls. For example, a new high-efficiency combined-cycle natural gas-fired plant with good pollution controls — typical of natural gas plants constructed in the past 15 years — will have relatively low emission rates for all of the major air pollutants. The typical NOx emission rate for such plants would be less than 0.1 pounds per megawatt-hour (lbs/MWh),15 and the CO2 emission rates are reduced substantially because of the high electric generation efficiency of such plants. In comparison, older natural gas-fired plants that are inefficient and have limited pollution controls may have NOx emission rates of 7 to 8 lbs/MWh.16 (See Appendix B for background on the terminology used in discussing emission rates.) In the United States, the fleet of coal plants includes many older coal plants that are inefficient and have limited pollution controls.17 Such plants have NOx emissions that may exceed 8 lbs/MWh and also have high levels of CO2 emissions. In comparison, modern coal plants with state-of-the-art pollution controls will have much lower emission rates for NOx, SO2, and particulate matter. For example, NOx emission rates for these modern plants are typically less than 0.1 lbs/MWh.18 However, the CO2 emission rates are not affected by pollution controls for NOx and SO2. (See Appendix G for additional detailed information on emission rates of fossil fueled plants).
Methodologies for Analysis of Avoided Emissions There are a variety of recognized methods to measure the amount of air emission reductions that result when the output of conventional electric generating plants is reduced by wind power.19 Expert commentators have stated that different methods may be most appropriate depending on the goal of the analysis.20 Some documents providing guidance on calculating avoided emissions have focused on the analysis of specific pollutants. For example, EPA has issued a specific guidance document concerning the analysis of avoided NOx emissions,21 and the World Resources Institute and the 15 Ibid., U.S. Environmental Protection Agency, Compilation of Air Pollution Control Factors (AP42), updated 2007. 16 U.S. Environmental Protection Agency, Emissions & Generation Resource Integrated Database (eGRID), 2005. This emission rate is for grid-connected plants that are dispatched regularly. It should be noted that small diesel electric generators (typically used to meet emergencies and extreme peak loads) can have much higher NOx emission rates than 7 to 8 lbs/MWh. 17 Ibid. 18 Ibid. 19 World Business Council for Sustainable Development and World Resources Institute, The Greenhouse Gas Protocol - Guidelines for Quantifying GHG Reductions from Grid-Connected Electricity Projects, 2007; Biewald, B.; Using Electric System Operating Margins and Build Margins in the Quantification of Carbon Emission Reductions Attributable to Grid Connected CDM Projects, 2005; Schiller, S., National Action Plan for Energy Efficiency: Model Energy Efficiency Program Impact Evaluation Guide, November 2007. (Although the latter document focuses on avoided emissions from energy efficiency, the methodology is relevant to the analysis of wind energy.) 20 Schiller, S., National Action Plan for Energy Efficiency: Model Energy Efficiency Program Impact Evaluation Guide, November 2007. 21 U.S. Environmental Protection Agency, Guidance on State Implementation Plan (SIP) Credits for Emission Reductions from Electric-sector Energy Efficiency and Renewable Energy Measures, August 2004.
11

EPA Climate Leaders Program have recommended alternative methods for quantifying reductions in greenhouse gas emissions.22 Although there are variations in methodologies, the process of calculating emissions avoided as a result of wind generation involves several major steps:
(1) Specifying the appropriate geographic areas (e.g., power market or National Electric Reliability Council region) where the avoided emissions occur (2) Identifying the fossil fuel-fired electric generation that is displaced when wind plants come online (3) Determining the emission rates for the fossil fuel-fired generation that is displaced in the specific time periods that wind generation occurs.
In addition, the following elements may be included in the analysis. In situations in which greater accuracy is required, more detailed analytic approaches can be used to address these issues:
(1) Incorporating seasonal and daily patterns of wind generation and focusing on the avoided emissions of fossil fuel-fired generating units that are operating at the margin (i.e., those units that are the last to be switched online or first to be switched offline) rather than on the average avoided emissions of all plants on the grid (2) Analyzing the effects of avoided emissions from current units operating at the margin (so-called “operating margin”) and the effect of avoided emissions from the future construction of new fossil fuel-fired units (the “build margin”). The analysis of avoided fossil fuel emissions resulting from wind plant generation is typically weighted primarily on the operating margin if the purpose of the analysis is to estimate avoided emissions in the near term. In comparison, if the analysis is focused on long-term policy effects, such as the impact of enactment of a Renewable Portfolio Standard over several decades, the build margin is weighted more heavily.23 In view of the increasing stringency of air pollution controls, the average calculated avoided emission rates for most conventional pollutants typically decline over time.
Wind Energy Can Reduce Overall Emissions, Even Under Emissions Trading Programs Although it is clear that wind energy reduces the energy production of fossil fuel-fired generation at individual power plants or units and reduces actual emissions at those plants, the impact of wind generation on total overall emissions is more complicated for pollutants that are subject to regulation under emissions trading programs. These pollutants currently include NOx and SO2. In addition, some regions are in the process of developing CO2 emissions caps. EPA’s Clean Air 22 World Resources Institute, The Greenhouse Gas Protocol: Guidelines for Quantifying the GHG Reductions from Grid Connected Electricity Generation, 2007; U.S. Environmental Protection Agency, Climate Leaders Guidance on Purchases of Green Power and Renewable Energy Certificates, December 2007. 23 World Resources Institute, The Greenhouse Gas Protocol: Guidelines for Quantifying the GHG Reductions from Grid Connected Electricity Generation, 2007. It should be noted that emission reduction estimates over the longer term can be calculated as part of detailed wind integration studies, which typically use detailed simulation models that mimic the unit commitment and economic dispatch decisions of the grid operators. These simulations calculate the generation mix that will operate during each hour of the year, given a specific wind generation scenario.
12

Mercury Rule, providing cap and trade requirements for mercury emissions from electric generating units, was recently struck down by the D.C. Circuit Court of Appeals.24 In cases in which emissions trading programs are in effect, it is not sufficient to simply analyze the physical operation of the electric system to determine the impact of wind generation on air emissions. Rather, it also is necessary to review the specific governmental rules regulating the program to determine if emissions will be reduced on an aggregate or system-wide basis (as opposed to a power plant or unit basis). Under some rules, such as the NOx trading rules adopted by many states, emissions can be reduced in the overall trading market as well as at the individual power plant or unit level. However, under other legislative and regulatory frameworks, such as the Federal SO2 trading rules, wind energy generally will not reduce emissions in the overall trading market below the level set by the emissions cap. The determining factor is not whether the pollutant is subject to an emissions cap but how the individual cap and trade rules are designed for the particular pollutant.
EMISSIONS TRADING (CAP AND TRADE) BASICSEmissions trading is a regulatory approach to reduce air pollution through the use of economic incentives. Under an emissions trading program, the regulatory agency sets a maximum limit or cap on the total amount of emissions (in tons) of a particular pollutant (e.g., SO2, NOx). The cap limits emissions from all covered facilities in a specific industry (e.g., electric generation). The program generally requires that the cap will be reduced over a period of years. The regulatory agency implements an emissions trading program by creating and distributing (allocating) a specific number of allowances to regulated entities. An allowance represents an authorization to emit a specific amount of a pollutant (generally measured in tons) during a particular year or season. The total amount of allowances cannot exceed the cap, thereby limiting total emissions. At the end of each year, each regulated entity must demonstrate that it possessed sufficient allowances to cover all emissions of the capped pollutant. If an entity releases emissions (for a particular year) in excess of the allowances initially granted to it by the regulatory agency, it can meet the program requirements by buying additional allowances from entities that polluted less than their allowances would otherwise have permitted. This exchange of allowances is called a trade. In effect, the seller of the allowances is rewarded for reducing its pollution below its number of allowances and the buyer of the allowances must pay a premium for releasing emissions in excess of its allocated
Sulfur Dioxide Emissions
Under the acid rain provisions of the Clean Air Act regulating emissions of SO2, virtually all allowances have been distributed to fossil fuel-fired generating units.25 Moreover, distribution of 24 State of New Jersey, et al., v. Environmental Protection Agency, No. 05-1097, slip op. (D.C. Cir. Feb. 8, 2008). The court found that EPA had violated the requirements of the Clean Air Act by removing electric generating units from the list of sources regulated under Section 112 of the Act without making the required findings. As a result, the court determined that EPA’s Clean Air Mercury Rule must fall. 25 Under Section 404(f) and (g) of the Clean Air Act Amendments of 1990, EPA established a Conservation and Renewable Energy Reserve (CRER) that included 300,000 SO2 allowances. The allowances were set aside from the emission cap of allowances imposed on fossil fuel-fired generators. Allowances could be awarded for energy conservation and renewable energy projects, including wind energy projects, implemented between 1992 and 1999.
13

SO2 allowances to existing plants must be made on a permanent basis. As a result of this legal structure, the addition of wind energy to the grid generally does not result in a reduction of the total amount of SO2 emissions below the level of the emissions cap.26 This occurs for the following reason. Although the wind energy generation reduces the output of individual fossil fuel-fired power plants or units, the owner of the fossil fueled plants still retains the allowances – the authorization to emit a ton of SO2. Therefore, the total air emissions of SO2 will not be reduced because the owner of the allowances will either (1) transfer the allowances to another generating unit under its control; (2) bank the allowances for future use; or (3) sell the allowances in the emissions trading market to another party — one that expects to exceed its emissions limit and requires additional allowances. In other words, the effect of the added wind energy generation under the acid rain program is to make it less expensive for the fossil fuel-fired generator to meet its emission control requirements or to gain additional revenues. Thus, total SO2 emissions generally will not be reduced below the level of the emissions cap.
Nitrogen Oxide Emissions
In comparison, the Clean Air Act and the U.S. Environmental Protection Agency (EPA) have provided state governments with authority to issue rules governing NOx emissions trading that allow wind developers to reduce air emissions. In fact, under the EPA’s Clean Air Interstate Rule (CAIR), nearly half of the 28 states subject to the Rule have issued proposed or final regulations authorizing wind generators to apply for NOx allowances or have stated the intention to do so. (See Appendix D for a map of the states covered by the Clean Air Interstate Rule and Appendix E for a review of the treatment of wind energy under state CAIR regulations). If the wind generator either commits to retire such NOx allowances itself (permanently removing the allowances from the market and preventing their use) or to sell the energy and allowances to an entity (e.g., municipality) that commits to retire such allowances, then total air emissions and the level of the emissions cap will be reduced.27 Under many state rules, the wind generator will have the choice of retiring the NOx allowances distributed to the generator or selling the allowances directly into the NOx emissions trading
The minimum share of allowances allocated to renewable energy was 60,000 allowances. However, as of June 1999, only 6,700 allowances of the total of 300,000 (less than 3% of total NOx allowances in the Reserve) had been allocated to renewable energy projects. Wooley, D., A Guide to the Clean Air Act for the Renewable Energy Community, Issue Brief No. 15, Renewable Energy Policy Project, February, 2000, pp. 18-19. According to the Wooley article cited above, the CRER failed to achieve significant utilization by wind energy developers for several reasons: (1) “[t]he program was designed primarily to achieve early reductions [in emissions] (to occur before the statutory deadlines) and not as a long-term incentive for renewables;” (2) eligibility for allowances was limited to electric utilities, and independent wind energy developers were not eligible for allowances; and (3) even electric utilities were subject to restrictive conditions on ratemaking – conditions that “were increasingly difficult to meet under a restructured [electric utility] industry.” Id., p. 19. 26 Ibid. 27 It is true that an entity can purchase and retire allowances for NOx, SO2, or other pollutants without a related purchase of wind generation. However, doing so is likely to raise allowance costs without the compensating benefit that zero-emissions wind generation provides of reducing emissions that must be controlled by fossil-fuel-fired generators and thereby reducing compliance costs.
14

market. In the latter case, the generator may sell the allowances to obtain additional revenues, thereby helping to encourage additional zero-emissions wind generation.28 However, if such a sale is made, the wind generator will not be able to claim that such generation resulted in reduced NOx emissions.
Greenhouse Gas Emissions
Although some greenhouse gas cap and trade programs have been proposed by state policymakers in certain U.S. regions or in national legislation, there are no cap and trade programs currently in effect in the United States to limit greenhouse gas emissions. Thus, at the present time, all wind energy generation that displaces fossil fuel-fired generation reduces CO2 emissions at the individual power plant or unit level as well as at the aggregate level, thereby reducing total CO2 emissions in the power market. Under any future regional or U.S. cap and trade program, the addition of wind energy to the grid will generally help to meet the emissions cap. However, the policy design of any future regional or U.S. cap and trade program for greenhouse gas emissions will impact whether wind energy projects will reduce overall CO2 emission levels in the future below the level of the general emissions cap. There are a variety of policy options for enabling wind to reduce total emission levels. 29 For example, the model rule adopted by the 10 states involved in the Northeast Regional Greenhouse Gas Initiative, which is scheduled to take effect in 2009, includes an optional section authorizing states to retire allowances on behalf of voluntary renewable energy purchases30 to help ensure a reduction of greenhouse gas emissions. As of October 2007, half of the states involved in the initiative have included this section in their draft regulations or legislation or are considering further legislative action to support this approach.31
28 States and the Environmental Protection Agency have cited all of these benefits for adopting this policy approach. Bluestein, J.; Salerno, L.; Bird, L.; and Vimmerstedt, L., Incorporating Wind Generation in Cap and Trade Programs, NREL Report No. TP-500-40006, July 2006, p. 2. 29 Bird, L.; Holt, E.; Carroll, G., Implications of Carbon Regulation for Green Power Markets, NREL Report No. TP-640-41076, 2007. 30 Regional Greenhouse Gas Initiative, Model Rule, August 15, 2006. 31 Holt, E., Support for Renewable Energy Marketing Claims in State Carbon Policies, Presentation at the 12th Renewable Energy Marketing Conference, October 22, 2007.
15

Other Pollutants Not Subject to Cap and Trade Regulation
Many pollutants that pose serious adverse health and environmental impacts (as summarized in Table 1), such as fine particulate matter, volatile organic compounds (i.e., dioxins), and trace heavy metals, are not currently subject to emissions trading. Emissions of these pollutants are not covered by cap and trade programs. These emissions also may be reduced when fossil fuel generation is backed down by wind generation.
State Air Quality Plans Can Recognize Air Emission Reductions Resulting from Wind Energy EPA has emphasized that “[m]eeting energy demand through clean energy sources can reduce emissions from fossil fueled generators.”32 Under guidance issued in August 2004, the EPA authorized states to include renewable energy purchases as control measures in their state air quality plans (formally known as a State Implementation Plan or SIP) under specified circumstances.33 States generally were required to obtain and retire NOx allowances or to omit a certain fraction of allowances from distribution (thereby lowering the NOx emissions cap at the outset) in order to receive credit in the SIP for the wind energy purchase.34 Since 2004, several states and municipalities have followed this guidance, and they have relied on wind purchase commitments in their SIPs and retiring or withholding a commensurate amount of allowances to demonstrate a reduction in NOx emissions. (See Appendix C for additional information.)
32 U.S. Environmental Protection Agency, EPA Clean Energy-Environment Guide to Action: Policies, Best Practices, and Action Steps for States, February 2006. 33 U.S. Environmental Protection Agency, Guidance on State Implementation Plan (SIP) Credits for Emission Reductions from Electric-sector Energy Efficiency and Renewable Energy Measures, August 2004, pp. 4-7. 34 Id., pp. 17-20.
16

WIND ENERGY PURCHASES IN THE MID-ATLANTIC REGIONIn May 2005, Maryland became the first state in the country to receive EPA approval for emission reduction credit in a SIP based on a renewable energy purchase. This wind energy purchase of more than 30,000 MWh involved a regional buying effort coordinated by Montgomery County, Maryland in conjunction with the Metropolitan Washington Air Quality Committee (MWAQC), A and as of 2004, the wind energy purchase was the largest ever made by a local government entity.B Although the credit for the purchase constituted only 8 tons during the summer ozone season, this purchase established an important national precedent. In June 2007, MWAQC completed an air quality plan for the MD-VA-DC nonattainment area that committed to increase municipal purchases of wind energy fourfold from 2004 levels by 2009. The buyers, including two counties in Maryland, three counties in Virginia, and the Washington Suburban Sanitary Commission, committed to purchase 123 million kWh of renewable energy certificates for wind energy annually. These purchases would reduce NOx emissions approximately 23 tons during the summer ozone season. C
A U.S. Department of Energy, Improving Regional Air Quality with Wind Power: Wind Powering America Fact Sheet Series, October 2004, p. 2. B National Association of Counties, Achievement Award to Montgomery County, Maryland, 2005. C Metropolitan Washington Air Quality Committee, Plan to Improve Air Quality in the Washington, DC-MD-VA Region: State Implementation Plan for the 8-Hour Ozone Standard, May 23, 2007, pp.6-62 to 6-65 and Appendix H- RSG Avoided Emissions Report.
Wind Energy Helps to Meet Emission Caps by Reducing Pollution Control Compliance Costs Even in areas where wind energy does not reduce total air emissions below the level of general emission caps, the increased use of wind energy contributes to efforts to meet such caps by reducing pollution control compliance costs.35 When wind energy is generated, it most often reduces the proportion of fossil fuel-fired generation in the system, thereby reducing average emissions and lowering the costs faced by the owners of fossil fuel-fired facilities in complying with air pollution control requirements. In other words, even in cases in which wind energy does not reduce total emissions because of the design of a particular emissions trading program, the wind development will reduce the overall emission rate per MWh as well as the compliance cost at certain individual power plants or units. These reduced pollution control costs will facilitate compliance with emission reduction goals for greenhouse gases and conventional pollutants. It is noteworthy that in a 2007 analysis of one of the leading Federal GHG emissions trading proposals, the U.S. Energy Information Administration stated that its “analysis suggests that increasing the use of…renewable power [including wind power] is an economical compliance strategy.”36 35 See Schiller, S., National Action Plan for Energy Efficiency: Model Energy Efficiency Program Impact Evaluation Guide, November 2007, p. 3-17. This document sets forth a parallel analysis with respect to energy efficiency. 36 U.S. Energy Information Administration, Energy Market and Economic Impacts of S. 280, the Climate Stewardship and Innovation Act of 2007, July 2007, pp. xiii. 61.
17

Misperceptions about Backup Generation One of the misperceptions about wind power generation is that the air emission reduction benefits are extremely limited because of the need to provide backup fossil fuel generation. Some commentators have asserted that each new wind plant requires an equally large addition of backup generation from a dispatchable power plant, such as a fossil fuel-fired plant. However, wind integration studies contradict this view. The stated misperceptions about wind generation generally result from confusion regarding the difference between “intermittency” and the concept of “reserve requirements” that are necessary to assure the “reliability” of the electric grid. There is no doubt that wind turbines generate power on a variable basis. However, the electric power system is specifically designed to meet changes in demand and generation. With increased experience in integrating wind generation and balancing various sources of electric power over a large power control area, utility grid operators have learned how to reduce variability and to limit reserve additions to modest requirements when wind generation is brought online. This operational experience has been demonstrated most clearly at moderate levels of wind penetration of up to 10% to 20%.37 A May 2006 assessment prepared by the Utility Wind Integration Group (UWIG) emphasizes that the need for additional operating reserves (both spinning and non-spinning reserves) to maintain system reliability will likely be modest for wind plants that are broadly distributed over a geographic area.38 The UWIG conclusion is based on the fact that wind is used “primarily as an energy resource” rather than as a reserve capacity to meet reliability requirements. The reviecites two major recent studies that indicate that the addition of 1,500 MW and 3,300 MW of wind (15% and 10%, respectively, of system peak load) increased reserve requirements by only 8 MW and 36 MW, respectively, to maintain the same level of reliability (under performance standards enforced by the North American Electric Reliability Council).
w
39
Conclusion In summary, one of the important benefits of wind energy is that producing electricity from this source involves zero direct emissions of air pollutants. In contrast, fossil fuel-fired electric generation from coal, oil, or natural gas results in substantial direct emissions of numerous air pollutants that have adverse impacts on public health and the environment. Wind energy contributes to the reduction of emissions of various air pollutants, has played a role in improving regional air quality, and supports efforts to meet emission caps in a cost-effective manner.
37 Wind Plant Integration: Costs, Status, and Issues, IEEE Power & Energy Magazine, November/December 2005, pp. 38-46. See also Holttinen, H., Lemstrom, B. et al, Design and Operation of Power Systems with Large Amounts of Wind Power: State of the Art Report, 2007. The latter report was prepared by an international collaboration of experts within the International Energy Agency Implementing Agreement for Wind Energy and coordinated by the VTT Technical Research Center of Finland. 38 Utility Wind Integration Group (in cooperation with the American Public Power Association, the Edison Electric Institute, and the National Rural Electric Cooperative Association), Utility Wind Integration: State of the Art, May 2006, pp. 2-3. The May 2006 UWIG report was prepared in cooperation with the three major electric utility associations and summarizes the best worldwide information available on wind energy integration into the electric grid. 39 Id, p. 3.
18

Appendices
Appendix A: List of References
General
Bellemare, Bob, “What is a Megawatt?” Utilipoint Issue Alert, June 24, 2003. See http://www.utilipoint.com/ Brown, M.; DeCesaro, J.; Rewey, C.; The Power Industry and Air Quality, National Conference of State Legislatures, July 2005. See http://www.ncsl.org/bookstore/ Clean Air Act, 42 U.S.C. 7401 et seq. Domenici, P.; Steyn, J.; & Lyons, B., A Brighter Tomorrow: Fulfilling the Promise of Nuclear Power (Rowman & Littlefield Publishers, Inc., 2004). Jacobson, D., Increasing the Value and Expanding the Market for Renewable Energy and Energy Efficiency with Clean Air Policies, 37 ELR 10135, Feb. 2007. Maryland Department of Environment, The Basic Science of Air Pollution Transport, July 2005. See http://www.mde.state.us/assets/document/BJH%20-%20Basics%20on%20Ozone%20Transport.ppt Miller, P.J. and Van Atten, C., North American Power Plant Emissions, Commission on Environmental Cooperation in North America, 2005 (Table 1.1 based on 2002 data).
U.S. Environmental Protection Agency, EPA Clean Energy-Environment Guide to Action: Policies, Best Practices, and Action Steps for States. See http://www.epa.gov/cleanenergy/stateandlocal/guidetoaction.htm
Wooley, D., A Guide to the Clean Air Act for the Renewable Energy Community, Issue Brief No. 15, Renewable Energy Policy Project, Feb. 2000. See http://www.repp.org/
Health and Environmental Effects
U.S. Environmental Protection Agency, EPA Air Quality Index: A Guide to Air Quality and Your Health, EPA Publication 454/K-03-002, 2003. See http://airnow.gov/index.cfm?action=aqibroch.index U.S. Environmental Protection Agency, Clean Air Mercury Rule: Basic Information, 2004. See http://www.epa.gov/air/mercuryrule/basic.htm, last updated Oct. 6, 2007.
19

U.S. Environmental Protection Agency, Compilation of Air Pollution Emissions Factors (AP42), Chapter 1.1m 2007. See http://www.epa.gov/ttn/chief/ap42/ch01/final/c01s01.pdf U.S. Environmental Protection Agency, Fact Sheet: Final Rule to Implement the 8-Hour Ozone National Ambient Air Quality Standard-Phase 2, Nov. 2005. See http://www.epa.gov/ozonedesignations/documents/Nov05/factsheet.htm U.S. Environmental Protection Agency, National Ambient Air Quality Standards for Ozone, 72 Fed. Reg. 37818 et seq. (July 11, 2007). U.S. Environmental Protection Agency, Clean Air Markets Division, Reducing Regional Transport of Emissions and Helping States Achieve the PM 2.5 and Ozone NAAQS, May 2005. See http://www.epa.gov/airmarkets/presentations/docs/epri05/epri_cair.ppt#262,2,Slide2 U.S. Environmental Protection Agency, Fact Sheet: Final Clean Air Particle Matter Implementation Rule for Implementation of the 1997 PM 2.5 Standard, March 29, 2007. See http://www.epa.gov/pmdesignations/documents/Mar07/factsheet.htm U.S. Environmental Protection Agency, Green Book, August 2007. See http://www.epa.gov/oar/oaqps/greenbk/map8hrnm.html U.S. Environmental Protection Agency, Green Book, October 2007. See http://www.epa.gov/oar/oaqps/greenbk/mappm25o3.html
Databases and Methodologies for Analysis of Avoided Emissions
Biewald, B.; Using Electric System Operating Margins and Build Margins in the Quantification of Carbon Emission Reductions Attributable to Grid Connected CDM Projects, 2005. See http://www.synapse-energy.com Chambers, A., Diem, A. and Vimmerstedt, L., Comparison of Methods for Estimating the Emissions Impacts of Energy Efficiency and Renewable Energy: Shreveport Louisiana Case Study, 2005. See http://www.nrel.gov/docs/fy05osti/37721.pdf High, C., and Hathaway, K. 2006. Final Report: Estimation of Nitrogen Oxide Avoided Emission Rates Resulting from Renewable Electric Power Generation in the New England, New York, and PJM Interconnection Power Market Areas, June 2006. (Report prepared by Resource Systems Group Inc. for Environmental Resources Trust and Connecticut Smart Power.) See http://www.rsginc.com/energy/publications High, C., and Hathaway, K. 2006. Avoided Emissions of the Redington Mountain Wind Farm, 2006. (Report prepared by Resource Systems Group Inc. for the Independent Energy Producers of Maine and the Conservation Law Foundation and presented as testimony in the Maine Land Use Regulatory Commission Hearing on
20

the Redington Mountain Wind Farm, August 4, 2006.) See http://www.rsginc.com/energy/publications Independent System Operator New England, 2004 New England Marginal Emission Rate Analysis, 2005. See http://www.iso-ne.com/genrtion_resrcs/reports/emission/2004_mea_report.pdf Natural Resources Defense Council, Benchmarking Emissions of the 100 Largest Power Producers in the U.S. for 2004, 2005. Schiller, S. National Action Plan for Energy Efficiency: Model Energy Efficiency Program Impact Evaluation Guide, November 2007. See http://www.epa.gov/cleanenergy/actionplan/resources.htm#resource U.S. Environmental Protection Agency, Climate Leaders Guidance on Purchases of Green Power and Renewable Energy Certificates, Discussion Draft. December 2007, Appendix IIIa., p. 16. See http://www.epa.gov/stateply/documents/greenpower_guidance.pdf and http://www.epa.gov/stateply/resources/option-module.html U.S. Environmental Protection Agency, Emissions & Generation Resource Integrated Database (eGRID). See http://www.epa.gov/cleanenergy/energy-resources/egrid/index.htm U.S. Environmental Protection Agency, Compilation of Air Pollutant Emission Factors (AP42), 2007 Update. See http://www.epa.gov/ttn/chief/efpac/index.html World Resources Institute and World Business Council for Sustainable Development, Guidelines for Quantifying GHG Reductions from Grid-Connected Electricity Projects, 2007. See http://www.wri.org/climate/pubs_description.cfm?pid=4277
Incorporating Wind Generation in Emissions Cap and Trade Programs
Bird, L.; Holt, E.; Carroll, G., Implications of Carbon Regulation for Green Power Markets, NREL Report No. TP-640-41076, 2007. See http://www.nrel.gov/docs/fy07osti/41076.pdf Bluestein, J.; Salerno, L.; Bird, L.; and Vimmerstedt, L., Incorporating Wind Generation in Cap and Trade Programs, NREL Report No. TP-500-40006, July 2006. See http://www.nrel.gov/docs/fy06osti/40006.pdf National Association of Clean Air Agencies, Alternative NOx Allowance Allocation Language for the Clean Air Interstate Rule, August 2005. See http://www.4cleanair.org/PublicationDetails.asp
21

Holt, E., Support for Renewable Energy Marketing Claims in State Carbon Policies, Presentation at the 12th Renewable Energy Marketing Conference, October 22, 2007. See http://www.renewableenergymarketing.net/ Regional Greenhouse Gas Initiative, Model Rule, August 15, 2006. See http://www.rggi.org/modelrule.htm State of New Jersey, et al., v. Environmental Protection Agency, No. 05-1097, slip op. (D.C. Cir. Feb. 8, 2008). U.S. Energy Information Administration, Energy Market and Economic Impacts of S. 280, the Climate Stewardship and Innovation Act of 2007, July 2007, pp. xiii, 61. See http://www.eia.doe.gov/oiaf/servicerept/csia/pdf/sroiaf(2007)04.pdf U.S. Environmental Protection Agency, Finding of Significant Contribution and Rulemaking for Certain States in the Ozone Transport Assessment Group Region for Purposes of Reducing Regional Transport of Ozone (NOx SIP Call), October 1998. U.S. Environmental Protection Agency, Climate Protection Partnerships Division, Office of Atmospheric Programs, Office of Air and Radiation, Draft Report on State Set-Aside Programs for Energy Efficiency and Renewable Energy Projects Under the NOx Budget Trading Program: A Review of Programs in Indiana, Maryland, Massachusetts, Missouri, New Jersey, New York, and Ohio, September 2005. See http://www.epa.gov/cleanenergy/stateandlocal/guidance.htm U.S. Environmental Protection Agency, Final Rule to Reduce Interstate Transport of Fine Particulate Matter and Ozone (Clean Air Interstate Rule), 70 Fed. Reg. 25162 (May 12, 2005). Virginia Clean Air Interstate Rule- NOx Annual Trading Program, 9 VAC 5-140-1420.G.8 (2007). See http://leg1.state.va.us/cgi-bin/legp504.exe?000+reg+9VAC5-140-1420 Virginia Clean Air Interstate Rule – NOx Ozone Season Trading Program, 9 VAC 5-140-2420G.8 (2007). See http://leg1.state.va.us/cgi-bin/legp504.exe?000+reg+9VAC5-140-2420
Emission Reduction Credit in State Implementation Plans
Metropolitan Washington Council of Governments, Plan to Improve Air Quality in the Washington, DC-MD-VA Region: State Implementation Plan for the 1-Hour Ozone Standard, February 19, 2004, pp. 7-77 to 7-80 and Appendix J-71 to J-76. See http://www.mwcog.org/committee/committee/archives.asp?COMMITTEE_ID=14 and scroll down to February 19, 2004, Plan to Improve Air Quality in the Washington, DC-MD-VA Region, pp. 7-77 to 7-80 and Appendix J, pp. J-71 to J-76.
22

Metropolitan Washington Air Quality Committee, Plan to Improve Air Quality in the Washington, DC-MD-VA Region: State Implementation Plan for the 8-Hour Ozone Standard, May 23, 2007, pp.6-62 to 6-65 and Appendix H- RSG Avoided Emissions Report. See http://sharepoint.mwcog.org/airquality/Shared%20Documents/Chapter%206%20Control%20Measures%20Final.pdf National Association of Counties, Achievement Award to Montgomery County, Maryland, 2005. U.S. Department of Energy, Improving Regional Air Quality with Wind Power: Wind Powering America Fact Sheet Series, Oct. 2004, p. 2. See http://www.eere.energy.gov/windandhydro/windpoweringamerica/pdfs/wpa/sips_improving_air_overview.pdf U.S. Environmental Protection Agency, Guidance on State Implementation Plan (SIP) Credits for Emission Reductions from Electric-sector Energy Efficiency and Renewable Energy Measures, Aug. 2004. See http://www.epa.gov/cleanenergy/stateandlocal/guidance.htm U.S. Environmental Protection Agency, Approval and Promulgation of Air Quality Implementation Plans; Maryland and Virginia; Non-Regulatory Voluntary Emission Reduction Program Measures, 70 Fed. Reg. 24987, May 12, 2005.
Wind Integration into Utility Grid Systems
Holttinen, H., Lemstrom, B. et al, Design and Operation of Power Systems with Large Amounts of Wind Power: State of the Art Report, 2007. This report was prepared by an international collaboration of experts within the International Energy Agency Implementing Agreement for Wind Energy and coordinated by the VTT Technical Research Center of Finland. See http://www.vtt.fi/pdf/workingpapers/2007/W82.pdf Interview with Karl Pfirrmann, Interim President and CEO of PJM Interconnection, PJM and Wind, E-Cubed Publication of Penn Future, December 5, 2007. See http://www.pennfuture.org/media_e3_detail.aspx?MediaID=843&Home=Y Pluger, A., Director of Energy Technology, International Energy Agency, Presentation to the Phase II Conference of the American Council on Renewable Energy, November 29, 2007. See http://www.acore.org/pdfs/AntonioPflueger.pdf Smith, C.; Demeo, E.; Smith, S., Integrating Wind Generation into Utility Systems, North American Windpower, Sept. 2006. See http://www.uwig.org/WindIntegration-NAW92006.pdf
23

Utility Wind Integration Group (in cooperation with the American Public Power Association, the Edison Electric Institute, and the National Rural Electric Cooperative Association), Utility Wind Integration: State of the Art, May 2006. See http://www.uwig.org/UWIGIntSummary.pdf Wind Plant Integration: Costs, Status, and Issues, IEEE Power & Energy Magazine, November/December 2005, pp. 38-46.
24

Appendix B: Energy Generation and Air Emissions Terminology40
Terms Used in Measuring Electric Power and Generation
It is difficult to understand issues relating to air emissions without understanding the terms used in measuring electric power and generation. The reader often sees the words “watt” (w), “kilowatt” (kW), or “megawatt” (MW). So what do these terms mean? Each of these terms is a measure of power — the rate at which an appliance consumes electricity or a measure of the rate at which a power plant delivers electricity to the grid. The basic yardstick for measuring electric power is the watt. For example, a 100-watt light bulb will use 100 watts of power when it is turned on. If this light bulb were turned on for 4 hours, it would use a total of 400 watt-hours (Wh) of energy. Thus, watts measure instantaneous power while watt-hours measure the total amount of energy used during a period of time. For electric power plants, two other concepts also are very important. These concepts are capacity and capacity factor (also known as capacity value). Capacity is the maximum power output of the plant. To keep the grid running smoothly, grid operators must have sufficient power plant capacity that can be reliably dispatched to meet total power demand. So what is a kilowatt or a megawatt? A kilowatt is 1,000 watts, and a megawatt is 1 million watts. Both terms are frequently used in the electric power industry when describing electric power consumption. Large modern coal-fired power plants typically produce electrical power at a rate of 1,000 MW, and the rated capacity of a large wind farm is often 100 to 200 MW. The capacity factor is the ratio of a power plant’s average production to its rated capacity. For example, a wind farm with a rated capacity of 100 MW will produce less power than its rated amount because the wind is not blowing at adequate speeds all of the time. As a result of varying wind speeds, a wind farm may only average 30 MW of power production over the course of a year. Thus, its capacity factor is 30% (30 MW of average production divided by 100 MW of rated capacity). Coal plants also do not operate at 100% capacity throughout the year, even though their capacity factor is generally far higher than a typical wind plant. For example, a 1000-MW coal plant may have a capacity factor of 75% because it averages 750 MW of production over the course of the year. The plant will not operate at full capacity for the entire year 40 This discussion relies primarily on the following documents: Bellemare, Bob, “What is a Megawatt?,” Utilipoint Issue Alert, June 24, 2003; Brown, M.; DeCesaro, J.; Rewey, C.; The Power Industry and Air Quality, National Conference on State Legislatures, July 2005; and World Resources Institute and World Business Council for Sustainable Development, Guidelines for Quantifying GHG Reductions from Grid-Connected Electricity Projects, 2007. The discussion also incorporates information from the following document: The President’s Committee on Advisors on Science and Technology, Powerful Partnership: The Federal Role in International Cooperation on Energy Innovation, June 1999.
25

because it will shut down for maintenance from time to time, and it may operate at less than its rated capability when other generation sources (e.g., wind energy) can produce less expensive power.
Terms Used in Measuring Emissions
The emissions rate refers to the amount of emissions produced per megawatt-hour of electricity generated. Generally, emission rates are measured in pounds and tons. Even though emissions are gaseous, a pound of emissions literally weighs one pound. One ton of emissions equals 2,000 pounds. The U.S. Environmental Protection Agency requires owners and operators of most large power plants (and their individual units) to operate continuous emission monitors (CEMs). These monitors measure the amount of specified pollutants (e.g., sulfur dioxide, oxides of nitrogen) in pounds or tons, as appropriate.
26

Appendix C: Air Quality Nonattainment and State Implementation Plans: The Basics Section 110 of the Clean Air Act requires each of the areas in the country that have failed to meet the national air quality standards for certain “criteria” pollutants (see Figure 2) to develop a State Implementation Plan (SIP) outlining actions (control measures) to bring the state into attainment with the air quality standards for each pollutant.41 The Clean Air Act requires the U.S. Environmental Protection Agency (EPA) to compile and evaluate the latest scientific knowledge available to assess the health and welfare effects of criteria pollutants every 5 years and to revise the air quality standards for such pollutants (including ozone and fine particulate matter) in accordance with this evaluation.42 The EPA required the submission of revised SIPs by June 2007 to demonstrate action to meet the agency’s new “8-hour ozone standard.”43 EPA has also mandated that states make further revisions to their SIPs by April 2008 to meet the air quality standard for “fine particulate matter,” also known as PM2.5.44 Moreover, it is expected that EPA will require states to undertake additional actions beginning in 2013 to meet a more stringent ground-level ozone standard. In July 2007, EPA proposed revisions to the national air quality standards for ground-level ozone based on a review of new scientific data.45 EPA’s new proposed standards would tighten the existing standard for ground-level ozone to ensure public health protection and to prevent environmental damage, consistent with the new scientific information. In recent years, EPA has formally recognized that wind energy purchases — combined with necessary action under state emissions trading rules — will qualify for emissions reduction credit in a SIP under specified circumstances. EPA approved the first wind purchase in the nation for such credit in 2005 (see Wind Energy Purchases in the Mid-Atlantic Region textbox in the section titled State Air Quality Plans Can Recognize Air Emission Reductions Resulting from Wind Energy).46
41 42 U.S.C. 7410 et seq. (2007). 42 42 U.S.C. 7409(d)(2007). 43 U.S. Environmental Protection Agency, Fact Sheet: Final Rule to Implement the 8-Hour Ozone National Ambient Air Quality Standard- Phase 2, November, 2005. 44 U.S. Environmental Protection Agency, Fact Sheet: Final Clean Air Particle Matter Implementation Rule for Implementation of the 1997 PM 2.5 Standard, March 29, 2007. 45 72 Fed. Reg. 37818 (July 11, 2007). 46 See 70 Fed. Reg. 24987 (May 12, 2005) for the EPA approval and see Metropolitan Washington Council of Governments, Plan to Improve Air Quality in the Washington, DC-MD-VA Region: State Implementation Plan for the 1-Hour Ozone Standard, February 19, 2004, pp. 7-77 to 7-80 and Appendix J-71 to J-76 for the proposed plan.
27

To obtain approval for an emission reduction credit from a renewable energy source, the EPA requires a state to demonstrate that the emission reductions are:
• Quantifiable: The emission reductions are subject to measurement. • Surplus: Reductions cannot already be included in the state’s baseline emission
inventory. Thus, reductions already required because of a state emissions cap cannot be double-counted, and the emissions cap must be reduced further through the wind developer’s retirement of NOx allowances from future use or other action.
• Enforceable: The state is responsible for ensuring that the reductions credited in the SIP actually occur. The state needs to make a SIP commitment (enforceable by EPA) to monitor and report on the emission reductions resulting from the wind purchase and to remedy any shortfalls from projected emission reductions in a timely manner.
• Permanent: The reductions must be permanent throughout the term of the state air quality plan, unless necessary emission reductions can be secured from other measures later in the term.47
47 U.S. Environmental Protection Agency, Guidance on State Implementation Plan (SIP) Credits for Emission Reduction Measures from Electric-sector Energy Efficiency and Renewable Energy Measures, August 2004, pp. 4-7.
28

Appendix D: Emissions Trading (Cap and Trade) Background The goal of emissions trading is to lower the overall costs to regulated industries and the national economy of reducing air pollution. The idea is that entities that can easily reduce their emissions will do so and will choose to sell their unused emissions allowances, whereas entities that face more expensive pollution control challenges will choose to purchase allowances in lieu of installing costly pollution control equipment. This system is designed to lower the total costs of emissions control to the economy as compared to the traditional air pollution control approach, known as “command and control,” in which all regulated entities must reduce their emissions to specified levels, regardless of the variable costs to individual entities. Emissions trading was first implemented in the United States under Title IV of the Clean Air Act Amendments of 1990 (CAA Amendments).48 These provisions were designed to address the problem of acid rain by reducing emissions of sulfur dioxide (SO2). The United States expanded emissions trading to reduce nitrogen oxide emissions (NOx) — a precursor to ground-level ozone — in the Eastern states in the late 1990s under the so-called NOx SIP Call.49 In 2005, the U.S. EPA issued the Clean Air Interstate Rule (CAIR), which reduced the emissions cap for SO2 previously established by the 1990 CAA Amendments. CAIR also reduced the emissions cap for NOx established under the EPA’s NOx SIP Call. CAIR applies to 28 states in the Eastern half of the country and the District of Columbia, and it is designed to help address non-attainment problems for ozone and fine particulate matter. The first phase of the cap is effective in 2010, and the second phase is effective in 2015. Allowance allocations begin under the CAIR program in 2009.50
48 42 U.S.C. 7651 et seq. (2007). 49 U.S. Environmental Protection Agency, Finding of Significant Contribution and Rulemaking for Certain States in the Ozone Transport Assessment Group Region for Purposes of Reducing Regional Transport of Ozone (NOx SIP Call), October, 1998. 50 70 Fed. Reg. 25162 et seq. (May 12, 2005).
29

Figure 3: States covered by the U.S. EPA Clean Air Interstate Rule.51
51 U.S. Environmental Protection Agency.
30

Appendix E: Allowance Allocation to Wind Energy under the Clean Air Interstate Rule Each state covered by the U.S. Environmental Protection Agency’s (EPA’s) Clean Air Interstate Rule (CAIR) is required to submit a CAIR State Implementation Plan (SIP) indicating how the state will meet the requirements of the EPA CAIR. Otherwise, the state will be subject to the CAIR Federal Implementation Plan (FIP) and the FIP rules. The state CAIR rules contained in the state’s CAIR SIP (or the provisions of the FIP rules) will replace any existing state rule for NOx emissions trading for electric generating units. Under the previous NOx emissions trading rules, most states allocated all NOx allowances (authorization to emit 1 ton of NOx) only to fossil fuel generators.52 However, seven states did set aside a specific percentage of such allowances to provide incentives for renewable energy, including wind energy. These states are Indiana, Maryland, Massachusetts, Missouri, New Jersey, New York, and Ohio.53 Under CAIR, each state has authority to allocate NOx allowances as it chooses,54 and many states have issued regulations that allocate a portion of their allowances to renewable energy generators, including wind energy generators. Table 2 and Table 3 on the next pages summarize the treatment of renewable energy projects in the 28 states (as well as the District of Columbia) covered by the Clean Air Interstate Rule (see Appendix D above for a map of these states). Table 2 highlights the fact that nearly one-half of these states have adopted proposed or final regulations that allocate NOx allowances to renewable energy projects, including wind energy projects.
52 U.S. Environmental Protection Agency, Climate Protection Partnerships Division, Office of Atmospheric Programs, Office of Air and Radiation, Draft Report on State Set-Aside Programs for Energy Efficiency and Renewable Energy Projects Under the NOx Budget Trading Program: A Review of Programs in Indiana, Maryland, Massachusetts, Missouri, New Jersey, New York, and Ohio, September 2005. 53 Ibid. 54 The National Association of Clean Air Agencies (NACAA) issued a publication that listed options that states could choose for allocating allowances to promote clean technologies. NACAA, Alternative Allocation Language for the Clean Air Interstate Rule, August 2005.
31

Table 2: State Allocation of Nitrogen Oxide Allowances to Energy Efficiency and Renewable Energy (EE/RE) Under Clean Air Interstate Rule*
StateA,B
Annual or
Ozone Season
Rule
Type of Allocation to
EE/RE
Percentage of EE/RE Set-Aside
Number of Allowances for EE/RE Phase 1
Number of Allowances for EE/RE Phase 2
Allocation Rate
(lb/MWh) Phase 1
Allocation Rate
(lb/MWh) Phase 2
CT Ozone Set-aside 10% 268 268 1.5 1.25 IL Ozone Set-aside 12% 3684 3479 2.0 2.0 IL Annual Set-aside 12% 9149 7625 2.0 2.0 IN Ozone Set-aside ~1% 1115 C 500C 1.5 1.5 IN Annual Set-aside ~0.5% 545 454 1.5 1.5
MA Ozone Set-aside 10% 791.4 665.6 1.5 1.5 MD Ozone Set-aside 5% 641.7 534.7 1.5 1.5 MD Annual Set-aside 5% 1836 1155 1.5 1.5 MI Ozone Set-aside ~0.7% 200 200 1.0 1.0 MO Annual Set-aside ~0.5% 300 300 1.5 1.5 NJ Ozone Set-aside 5% 333 277 1.5 1.25 NJ Annual Set-aside 5% 634 528 1.5 1.25 NY Ozone Set-aside 10% 2063.2 1719.3 1.5 1.25 NY Annual Set-aside 10% 4561.7 3801.4 1.5 1.25 OH Ozone Set-aside 1% 494.6 494.6 1.5 1.5 PA Both Output-based -- -- -- -- -- VA Ozone Set-aside 1% 160 133 1.5 1.25 VA Annual Set-aside 1% 361 301 1.5 1.25 WI Both Output-based -- -- -- -- --
* Most state allocations covered by this chart apply to renewable energy (including wind energy) and energy efficiency. However, certain states, such as Michigan, limit their set-aside to renewable energy. A Rules are designated by regular font if they have received final approval by the U.S. EPA. Otherwise, the rules are identified in bold type. The information reflects the status as of 11/1/07. The final rules may differ from the proposed rules summarized here. Check state Web sites for updates (see Web links below). B States adopting regulations that do not include an allocation of NOx allowances to renewable energy projects include AL, AR, DE, FL, GA, IA, KY, LA, MN, MS, NC, SC, TN, TX, WV. The District of Columbia will not have a set-aside for its 2009 allocation but is seeking to implement a set-aside by 2010. In addition, Michigan has no set-aside for its annual rule, and Missouri has no set-aside for its ozone season rule. C Indiana's EE/RE allocation set-aside for ozone is 1,115 tons in 2009 and 500 tons in 2010 and thereafter.
32
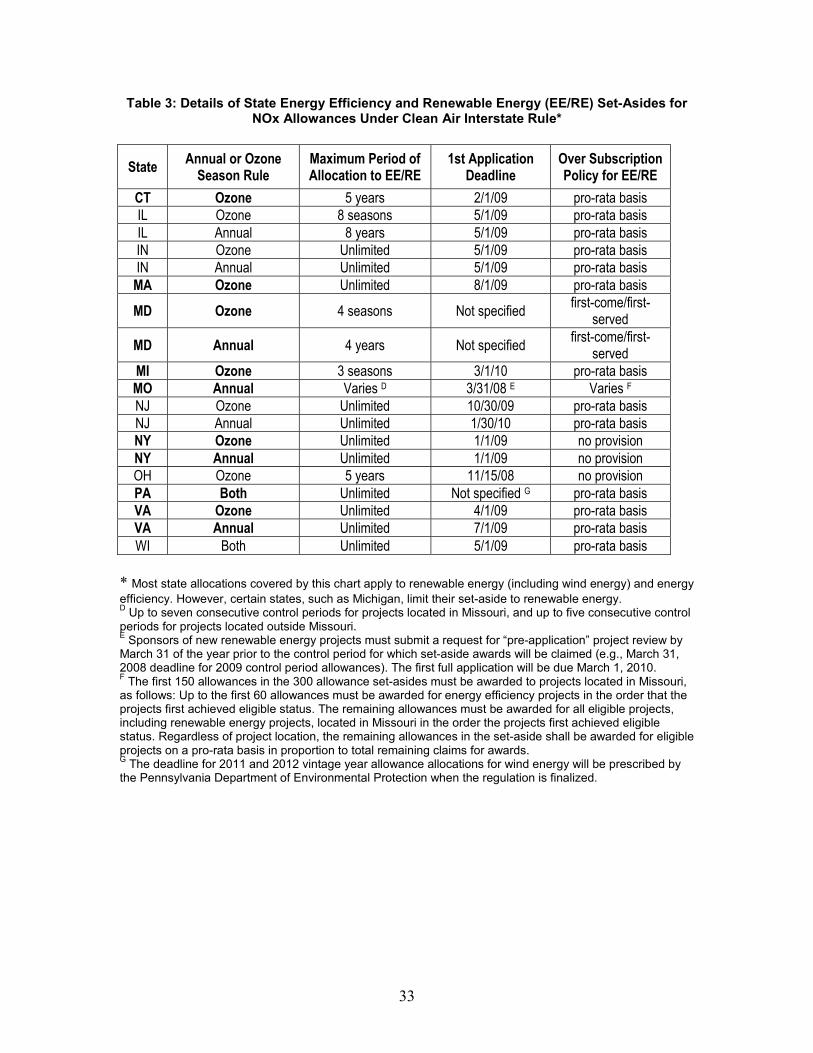
Table 3: Details of State Energy Efficiency and Renewable Energy (EE/RE) Set-Asides for NOx Allowances Under Clean Air Interstate Rule*
State Annual or Ozone Season Rule
Maximum Period of Allocation to EE/RE
1st Application Deadline
Over Subscription Policy for EE/RE
CT Ozone 5 years 2/1/09 pro-rata basis IL Ozone 8 seasons 5/1/09 pro-rata basis IL Annual 8 years 5/1/09 pro-rata basis IN Ozone Unlimited 5/1/09 pro-rata basis IN Annual Unlimited 5/1/09 pro-rata basis
MA Ozone Unlimited 8/1/09 pro-rata basis
MD Ozone 4 seasons Not specified first-come/first-served
MD Annual 4 years Not specified first-come/first-served
MI Ozone 3 seasons 3/1/10 pro-rata basis MO Annual Varies D 3/31/08 E Varies F NJ Ozone Unlimited 10/30/09 pro-rata basis NJ Annual Unlimited 1/30/10 pro-rata basis NY Ozone Unlimited 1/1/09 no provision NY Annual Unlimited 1/1/09 no provision OH Ozone 5 years 11/15/08 no provision PA Both Unlimited Not specified G pro-rata basis VA Ozone Unlimited 4/1/09 pro-rata basis VA Annual Unlimited 7/1/09 pro-rata basis WI Both Unlimited 5/1/09 pro-rata basis
* Most state allocations covered by this chart apply to renewable energy (including wind energy) and energy efficiency. However, certain states, such as Michigan, limit their set-aside to renewable energy. D Up to seven consecutive control periods for projects located in Missouri, and up to five consecutive control periods for projects located outside Missouri. E Sponsors of new renewable energy projects must submit a request for “pre-application” project review by March 31 of the year prior to the control period for which set-aside awards will be claimed (e.g., March 31, 2008 deadline for 2009 control period allowances). The first full application will be due March 1, 2010. F The first 150 allowances in the 300 allowance set-asides must be awarded to projects located in Missouri, as follows: Up to the first 60 allowances must be awarded for energy efficiency projects in the order that the projects first achieved eligible status. The remaining allowances must be awarded for all eligible projects, including renewable energy projects, located in Missouri in the order the projects first achieved eligible status. Regardless of project location, the remaining allowances in the set-aside shall be awarded for eligible projects on a pro-rata basis in proportion to total remaining claims for awards. G The deadline for 2011 and 2012 vintage year allowance allocations for wind energy will be prescribed by the Pennsylvania Department of Environmental Protection when the regulation is finalized.
33

Web Links on State CAIR Regulations and EPA Review Status
U.S. Environmental Protection Agency Review of State CAIR Submissions EPA Web Site: http://www.epa.gov/airmarkets/progsregs/cair/rulemakingactions.html State Web Sites on CAIR Regulatory Development Connecticut: http://www.ct.gov/dep/cwp/view.asp?a=26848&q=331234&depNav_GID=1619 Illinois: http://www.ipcb.state.il.us/SLR/IPCBandIEPAEnvironmentalRegulations-Title35.asp Indiana: http://www.in.gov/idem/programs/air/workgroups/mercury/index.html Massachusetts: http://mass.gov/dep/air/laws/regulati.htm#cair Maryland: http://www.mde.state.md.us/ResearchCenter/laws_regs/propreg_26_11_28_070607.asp Michigan: http://www.michigan.gov/deq/0,1607,7-135-3310-122941--,00.html Missouri: http://dnr.mo.gov/env/apcp/cair_camr/cair_camr.htm New Jersey: http://www.nj.gov/dep/rules/adoptions/2007_0716cair.pdf New York: http://www.dec.ny.gov/regulations/32119.html Ohio: http://www.epa.state.oh.us/dapc/regs/3745-109/3745_109.html Pennsylvania: http://www.dep.state.pa.us/dep/deputate/airwaste/aq/regs/regs.htm Virginia: http://www.deq.virginia.gov/air/regulations/air140.html Wisconsin: http://www.legis.state.wi.us/rsb/code/nr/nr432.pdf
A number of options are available to states that choose to grant NOx allowances to wind energy projects, and state CAIR regulations incorporate different policy design approaches. The elements of the various state regulations that allocate NOx allowances to wind energy projects are summarized in Tables 2 and 3 (above), and the reader can utilize the above complete listing of links to the state Web sites to review the complete regulations text and determine the current status of the state rules. The major design elements that apply to the distribution of NOx allowances to wind energy projects and that are highlighted in the columns in Tables 2 and 3 are explained below:55 • Annual or Seasonal Rule: Under the EPA’s Clean Air Interstate Rule, most states
are required to issue regulations setting two separate caps limiting NOx emissions: (1) the annual rule sets a cap limiting emissions over the course of an entire year, and (2) the seasonal rule sets a cap limiting emissions during the summer ozone season (May 1 to September 30). A more stringent cap is set for the summer season due to the contribution of NOx emissions to dangerous ground-level ozone on hot summer days.
55 These design features are more fully described in a July 2006 report issued by the National Renewable Energy Laboratory. See Bluestein, J.; Salerno, L.; Bird, L.; and Vimmerstedt, L., Incorporating Wind Generation in Cap and Trade Programs, NREL Report No. TP-500-40006, July 2006.
34
A separate annual limit is necessary to control NOx emissions that contribute to the formation of fine particulate matter in the fall, winter, and spring, as well as the summer.
Most states that have issued regulations distributing allowances to renewable energy projects have done so under both the ozone season rule and the annual rule. This two-fold approach is more favorable to wind energy. However, a few states (such as Michigan and Missouri) have only included renewable energy projects under one of the rules (see Table 2).
• Allocation Type: Several alternative approaches are available to states to distribute
allowances to renewable energy projects. The two most common approaches are renewable energy set-asides and direct allocation.
Under a set-aside, the state regulatory agency allocates a percentage of the total emissions allowances to support specific energy technologies.56 Many state set-asides allow renewable energy projects to qualify for allowances only during a limited number of years – thereby eliminating the value of the set-aside after several years.
Most state clean energy set-asides have distributed allowances to both renewable energy and energy efficiency projects. However, some states, such as Michigan, only have distributed allowances from the set-aside to renewable energy projects.
The most common alternative to a set-aside for distributing allowances to wind energy projects is called a direct allocation. Under a direct allocation, the state regulatory agency directly allocates allowances to renewable energy projects based on the quantity of electric generation output (in MWh) provided by wind generation relative to other qualifying renewable energy and energy efficiency sources and qualifying fossil fuel-fired electric generation.
Under a direct allocation program, generating units (and qualifying energy efficiency sources) receive allowances based on their proportion of generation output (or energy savings), as calculated during a baseline period. The benefit of a direct allocation for renewable energy projects is that this approach provides a long-term, stable stream of allowances and simplifies the allocation process.57
• Percentage Allocation: A set-aside does not increase the overall level of the cap.
Instead, it reserves a percentage of the pool of total allowances for specified technologies, such as renewable energy and energy efficiency.58 In Table 2, the column titled Percentage of EE/RE Set-Aside indicates the percent of the total allowances that are contained in the renewable energy set-aside or combined energy efficiency/renewable energy set-aside. This percentage ranges from 0.5% of total
56 Bluestein, J.; Salerno, L.; Bird, L.; and Vimmerstedt, L., Incorporating Wind Generation in Cap and Trade Programs, NREL Report No. TP-500-40006, July 2006, p. 15. 57 Id., p. 25. 58 Id., p. 17.
35

allowances in Missouri to 12% in Illinois. A larger percent allocation is more favorable to wind energy because it lessens the likelihood that the set-aside will be over-subscribed. As a result, a larger percentage increases the certainty that wind energy developers will obtain their expected share of allowances and increases the value of the program to wind energy companies.
• Allocation Rate: Trading programs typically distribute allowances to fossil fuel-fired
generating units based on the heat input (from the combustion process) times an allocation factor or “allocation rate.” The allocation rate is usually the nominal value on which the cap is based.59 For example, the current cap for most states under the NOx SIP Call program is based on emissions of 0.15 lb/MMBtu.60
However, renewable generators cannot use the approach described above because they do not have a combustion process nor any related heat input. Therefore, a common approach used in state CAIR programs is to convert the heat-input-based allocation rate (in lb/MM British Thermal Units) to an output-based rate (based on lb/MWh) and apply the converted allocation rate to the amount of renewable generation.61
The most typical allocation rate applied to renewable energy projects in state CAIR programs is 1.5 lb/MWh of electric generation. This allocation rate is calculated by converting 0.15 lb/MMBtu to 1.5 lb/MWh using a typical fossil fuel-fired plant heat rate of 10,000 Btu/kWh.
Higher allocation rates are more favorable to renewable energy developers than lower rates because they result in the allocation of a greater number of allowances to the renewable energy projects.
• Maximum Allocation Period: States often limit the number of years that a
renewable energy project can receive allowances from the set-aside. By establishing a maximum period of allocation, states ensure that projects are cycled in and out of the program — making room for new projects.62 Depending on the state, a renewable energy project may receive allowances for up to 5 years or more but must re-apply each year.
• First Application Deadline: Each state has established application deadlines for
renewable energy project developers (or other parties) to request allowances under their CAIR program. Allowance allocations for most state CAIR programs begin in 2009, and renewable energy generators generally must submit applications for the seasonal and/or annual program by a specified date during the first year of the program and every year thereafter. Some application deadlines occur in 2010 because of delays in the state rulemaking process.
59 Ibid. 60 Ibid. 61 Ibid. 62 Ibid.
36

37
• Over-Subscription Policy: Set-aside programs distribute a small share of the total allowances to renewable energy generators. This share is often sufficient to cover existing and near-term renewable energy generation, but it may not be sufficient to keep up with longer-term growth. An over-subscription policy is often detailed in the state’s CAIR regulations (specific rules for distributing allowances to renewable energy generators if applications for allowances exceed the amount available in the renewable energy set-aside).
The most frequent approach in state CAIR regulations is to distribute a pro-rata share of the available allowances to renewable energy applicants based on the proportion of their share of allowances to the total amount of allowances in the renewable energy set-aside. Another approach is to distribute allowances on a first-come, first-served basis. The pro-rata distribution approach is the most equitable approach to address over-subscription of the set-aside.
The state agency Web sites listed above provide links to the actual language of the State Clean Air Interstate Rules, and this language should be consulted for current information. The importance of state policies that distribute allowances to the owners and operators of wind energy projects is that the value and/or market share for wind energy is likely to increase when such allowances are granted to wind projects. Market value and/or market share increases because wind generators can participate in a number of emission markets (without purchasing allowances), including the following:
• Selling the renewable energy or a Renewable Energy Certificate (REC) bundled with the NOx allowances to a state or municipality that plans to retire the allowances and receive emissions reduction credit in its State Implementation Plan (SIP credit)
• Selling the allowance directly into the NOx emissions market to receive additional revenue63
• Bundling the NOx allowance with RECs for sale into the voluntary market for “green power”
• Bundling the NOx allowance to meet the REC compliance requirements in a state with a Renewables Portfolio Standard that requires that all “environmental attributes” be included with the REC.64
Of course, these approaches are mutually exclusive. However, the key point is that a wind generator cannot participate in any of these markets unless the state regulations provide authority to allocate NOx allowances to renewable energy generators. If such provisions are not included in the state rules, a wind generator only could participate in these markets if it purchased allowances — a financial obstacle that is unlikely to be overcome.
63 In this case, the generator cannot claim a reduction in NOx emissions. 64 Letter from Elizabeth Salerno, American Wind Energy Association to Kathleen McGinty, Secretary, Pennsylvania Department of the Environment, June 16, 2006.

Appendix F: Avoided Emission Rates
Table 4: Examples of Avoided Emission Rates for Wind Power in Selected U.S. Regions*
AREA NITROGEN OXIDE
(lb/MWh)A
SULFUR DIOXIDE (lb/MWh)
CARBON DIOXIDE (lb/MWh)B
NOTESC
SOURCE
New England 0.54 2.24 1,102 Uses ISO New England Data
ISO New England65
Maine 0.74 2.7 1,210 Based on Data for Power Market
Maine LURC
Testimony66
PJM Power Market
2.05 __ __ Based on Data for Power Market
Resource Systems Group67
Shreveport, LA
2.0 to 4.6 __ __ Comparison of three methodologies
National Renewable Energy
Lab68
Metropolitan Washington, D.C.69
1.7 __ __ Regional Air Quality
Plan
Metropolitan Washington
COG70
65 Independent System Operator New England, 2004 New England Marginal Emission Rate Analysis, 2005. 66 High, C. and Hathaway, K. 2006. Avoided Emissions of the Redington Mountain Wind Farm, 2006. (Report prepared by Resource Systems Group for the Independent Energy Producers of Maine and the Conservation Law Foundation and presented as testimony in the Maine Land Use Regulatory Commission Hearing on the Redington Mountain Wind Farm, August 4, 2006.) 67 High, C. and Hathaway, K. 2006. Final Report: Estimation of Nitrogen Oxide Avoided Emission Rates Resulting from Renewable Electric Power Generation in the New England, New York, and PJM Interconnection Power Market Areas, June 2006. (Report prepared for Environmental Resources Trust and Connecticut Smart Power with funding support from the U.S. Department of Energy.) 68 Chambers, A., Diem, A. and Vimmerstedt, L., Comparison of Methods for Estimating the Emissions Impacts of Energy Efficiency and Renewable Energy: Shreveport Louisiana Case Study, 2005 (National Renewable Energy Laboratory Report NREL T/P710-37721). 69 The analysis is based on the PJM power market area. 70 Metropolitan Washington Air Quality Committee, Plan to Improve Air Quality in the Washington, DC-MD-VA Region: State Implementation Plan for the 8-Hour Ozone Standard, May 23, 2007, pp. 6-62 to 6-65 and Appendix H (Resource Systems Group -RSG Avoided Emissions Report).
38

39
AREA NITROGEN OXIDE
(lb/MWh)A
SULFUR DIOXIDE (lb/MWh)
CARBON DIOXIDE (lb/MWh)B
NOTESC
SOURCE
CA Power Market (CAMX – WECC CA)D
__
__
1,267.74
Based on
eGrid DataE
EPAF
Part of TX Power Market (ERCT – ERCOT All) D
__
__
1,328.91
Based on
eGrid DataE
EPAF
ISO New England Power Market (NEWE-) D
__
__
1,399.17
Based on
eGrid DataE
EPAF
Part of PJM Power Market (RFCE – RFC East) D
__
__
1816.48
Based on
eGrid DataE
EPAF
*See text on Pages 13 to 17 for a discussion of the extent to which avoided emissions at individual fossil fuel-fired generating units may result in overall emission reductions below the level of an emissions cap under an emissions trading (cap and trade) program, and see Page 18 for a discussion of the general benefits of wind energy in helping to meet emission caps. A Avoided emission rates for NOx are average rates for the entire ozone season. Emission rates for SO2 are annual averages. The avoided emission rates for NOx and SO2 are based on available emission rate data for existing units operating at the margin (at the time the study was conducted).
B Emission rates for CO2 are annual averages. These avoided emission rates for CO2 are based on available emission rate data for existing non-baseload units and/or units operating at the margin (at the time the study was conducted). C There are significant differences in the methodologies used in the studies cited. D Abbreviations are for the National Electric Reliability Council (NERC) subregions. Only the U.S. portions of these subregions are included. For maps and regional definitions, refer to www.nerc.com/regional/. The subregions have been selected only as examples. The selection of the geographic boundaries of an area subject to analysis is an important methodological decision in the calculation of the avoided emissions rate. E U.S. Environmental Protection Agency, Climate Leaders Guidance on Purchases of Green Power and Renewable Energy Certificates, Discussion Draft, December 2007, Appendix IIIa., p. 16. The Climate Leaders Program obtained this information from the EPA’s Emissions & Generation Resource Integrated Database (eGRID2006, Version 2.1, April 2007). The eGrid data also includes non-baseload emission rates for nitrogen oxides, sulfur dioxide and mercury. F U.S. Environmental Protection Agency, Climate Leaders Guidance on Purchases of Green Power and Renewable Energy Certificates, December 2007, Appendix IIIa., p. 16.

Table 5: Variation in Fossil Fuel Air Emissions Rates for Major U.S. Electric Power Generating Companies*
Pollutant Lowest and Highest Emission Rate
Sulfur Dioxide 0.002 - 23.4 lb/MWh Nitrogen Oxide 0.18 – 5.5 lb/MWh Carbon Dioxide 862 – 2470 lb/MWh Mercury 0.007 – 0.113 lb/GWh
* Natural Resources Defense Council, Benchmarking Emissions of the 100 Largest Power Producers in the U.S. for 2004, 2005. The data in this report are based on information from EPA’s Acid Rain Emissions Reporting Program, the EPA Toxics Release Inventory, and the Form 920 Reports of the Energy Information Administration. It should be noted that the EPA’s eGrid data is derived, in part, from data reported under EPA’s Acid Rain Emissions Reporting Program. The data in this table reflect average emission rates for the fleet of plants of an entire electric power company. For example, the high end of the range shows the emissions rate for the company with the highest average emission rates across its fleet of plants. However, individual plants may have far higher or lower emission rates.
40

F1146-E(09/2007)
REPORT DOCUMENTATION PAGE Form Approved OMB No. 0704-0188
The public reporting burden for this collection of information is estimated to average 1 hour per response, including the time for reviewing instructions, searching existing data sources, gathering and maintaining the data needed, and completing and reviewing the collection of information. Send comments regarding this burden estimate or any other aspect of this collection of information, including suggestions for reducing the burden, to Department of Defense, Executive Services and Communications Directorate (0704-0188). Respondents should be aware that notwithstanding any other provision of law, no person shall be subject to any penalty for failing to comply with a collection of information if it does not display a currently valid OMB control number. PLEASE DO NOT RETURN YOUR FORM TO THE ABOVE ORGANIZATION. 1. REPORT DATE (DD-MM-YYYY)
February 2008 2. REPORT TYPE
Subcontract report 3. DATES COVERED (From - To)
August 1, 2007 - December 31, 2007 5a. CONTRACT NUMBER
DE-AC36-99-GO10337
5b. GRANT NUMBER
4. TITLE AND SUBTITLE Wind Energy and Air Emission Reduction Benefits: A Primer
5c. PROGRAM ELEMENT NUMBER
5d. PROJECT NUMBER NREL/SR-500-42616
5e. TASK NUMBER WER84001
6. AUTHOR(S) D. Jacobson and C. High
5f. WORK UNIT NUMBER
7. PERFORMING ORGANIZATION NAME(S) AND ADDRESS(ES) DJ Consulting LLC 1703 Fairveiw Ave. McLean, VA 22101
8. PERFORMING ORGANIZATION REPORT NUMBER LAM-7-77553-014
10. SPONSOR/MONITOR'S ACRONYM(S) NREL
9. SPONSORING/MONITORING AGENCY NAME(S) AND ADDRESS(ES) National Renewable Energy Laboratory 1617 Cole Blvd. Golden, CO 80401-3393 11. SPONSORING/MONITORING
AGENCY REPORT NUMBER NREL/SR-500-42616
12. DISTRIBUTION AVAILABILITY STATEMENT National Technical Information Service U.S. Department of Commerce 5285 Port Royal Road Springfield, VA 22161
13. SUPPLEMENTARY NOTES NREL Technical Monitor: L. Bird
14. ABSTRACT (Maximum 200 Words) The purpose of this document is to provide a user-friendly summary of the impact of wind energy development on the air emissions of various pollutants. The core document addresses the key facts relating to the analysis of emission reductions from wind energy development. It is intended for use by a wide variety of parties with an interest in this issue ranging from state environmental officials to renewable energy stakeholders. The appendices provide basic background information for the general reader, as well as detailed information for those seeking a more in-depth discussion of various topics.
15. SUBJECT TERMS wind energy; wind power; emissions; emissions reduction; Clean Air Interstate Rule; air quality; climate change; fossil fuel plants; cap and trade; wind integration
16. SECURITY CLASSIFICATION OF: 19a. NAME OF RESPONSIBLE PERSON a. REPORT
Unclassified b. ABSTRACT Unclassified
c. THIS PAGE Unclassified
17. LIMITATION OF ABSTRACT
UL
18. NUMBER OF PAGES
19b. TELEPHONE NUMBER (Include area code)
Standard Form 298 (Rev. 8/98) Prescribed by ANSI Std. Z39.18

![MASTER SUBCONTRACT Agreement - Swinerton … Subcontract... · Web viewMASTER SUBCONTRACT Agreement THIS MASTER SUBCONTRACT AGREEMENT (“MSA” or “Agreement”) is made this [date]](https://img.pdfslide.net/doc/110x75/5adb1e4d7f8b9ae1768e1acc/master-subcontract-agreement-swinerton-subcontractweb-viewmaster-subcontract.jpg)