Embed Size (px)
Citation preview
Wind Engineering Joint Usage/Research Center
FY2019 Research Result Report
1. Research Aim
The multi-story 3D modular building is a type of structure formed by an assembly of 3D modular units with
preselected building functions. Due to the assembly of a single module unit, the overall performance of the
structure depends on the horizontal and vertical connections among the module units for transferring
internal forces. Because of the independence of modular units with fixed and limited surfaces, the wind-
induced deformation of multi-story 3D modular building structures may be different from that of traditional
structures under strong wind loads[1]. The connection among modules in multi-story modular structures
purely stacked by 3D modules are critical in structural engineering, usually taken as pin-connections , need
to bear tension and shear forces due to bending and shearing deflections of 3D modular buildings. Under a
strong wind load, it is obviously different from traditional building that a modular unit usually has fixed
and limited local surfaces, and the corresponding length scale usually much smaller than that of the length
scale of air, which means that the wind-induced forces among modules are in correlating with close units.
At present, the practice of multi-story 3D modular buildings has taken precedence over theoretical research,
but the current codes still lack an accurate calculation theory and method for wind-induced internal forces
in joint connections considering the time and special relationship of the fluctuating characteristics of wind.
Up to know, limited work can be found for reference.
For this reason, establishing an effective static wind-induced forces estimation method for connection
design among modules in multi-story modular structures purely stacked by 3D modules is a key issue and
a challenges for the new structural buildings.
2. Research Method
This research method is: (1) To get the wind pressure distribution by wind tunnel test with rigid models of
typical multi-story 3D modular building structures; (2) To understand the internal force distribution of
connections among modules in typical multi-story 3D modular building structures by test and numerical
analysis; (3) To establish suitable calculation method of wind-induced internal forces of connections among
modules in multi-story 3D modular structure based on the effective static wind load method .
3. Research Result
3.1 Experimental set-up of wind tunnel tests
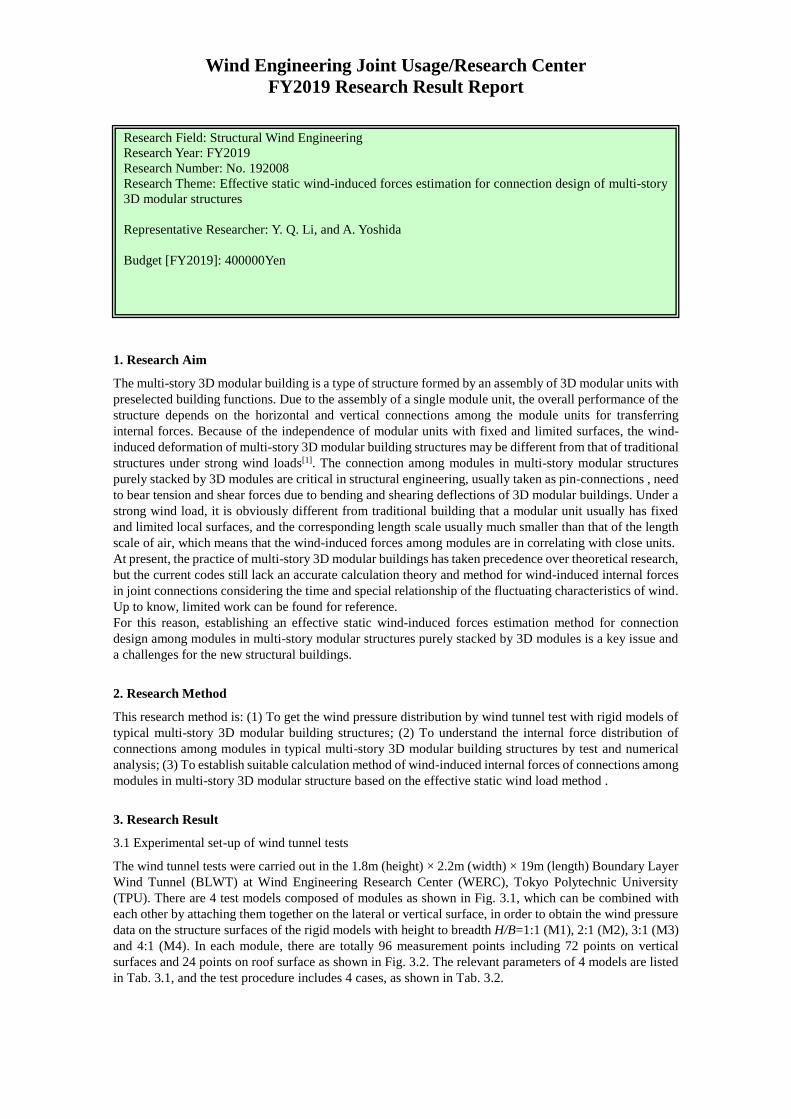
The wind tunnel tests were carried out in the 1.8m (height) × 2.2m (width) × 19m (length) Boundary Layer
Wind Tunnel (BLWT) at Wind Engineering Research Center (WERC), Tokyo Polytechnic University
(TPU). There are 4 test models composed of modules as shown in Fig. 3.1, which can be combined with
each other by attaching them together on the lateral or vertical surface, in order to obtain the wind pressure
data on the structure surfaces of the rigid models with height to breadth H/B=1:1 (M1), 2:1 (M2), 3:1 (M3)
and 4:1 (M4). In each module, there are totally 96 measurement points including 72 points on vertical
surfaces and 24 points on roof surface as shown in Fig. 3.2. The relevant parameters of 4 models are listed
in Tab. 3.1, and the test procedure includes 4 cases, as shown in Tab. 3.2.
Research Field: Structural Wind Engineering
Research Year: FY2019
Research Number: No. 192008
Research Theme: Effective static wind-induced forces estimation for connection design of multi-story
3D modular structures
Representative Researcher: Y. Q. Li, and A. Yoshida
Budget [FY2019]: 400000Yen

Fig. 3.1 Axonometric Diagram of Modules Fig. 3.2 The Measurement Points of Module
Tab. 3.1 Relevant Parameters of 4 Models
Model
No.
Geometric
Scale
Height
(H, mm)
Length
(L, mm)
Breadth
(B, mm) H/B L/B
Number of
Measurement
Points
M1 1/20 300 300 300 1.00 1.00 240
M2 1/20 300 600 150 2.00 4.00 288
M3 1/20 450 300 150 3.00 2.00 240
M4 1/20 600 300 150 4.00 2.00 312
Tab. 3.2 Details of Test Procedure
Case No. Model Construction Modules Aim
1
Composed of 4
modules, form a cube
with 2 storeys
To obtain the data of the rigid
model with H/B = 1:1.
2
Composed of 4
modules, form a
cuboid with 2 storeys
To obtain the data of the rigid
model with H/B = 2:1.
3
Composed of 3
modules, form a
cuboid with 3 storeys
To obtain the data of the rigid
model with H/B = 3:1.
4
Composed of 4
modules, form a
cuboid with 4 storeys
To obtain the data of the rigid
model with H/B = 4:1.
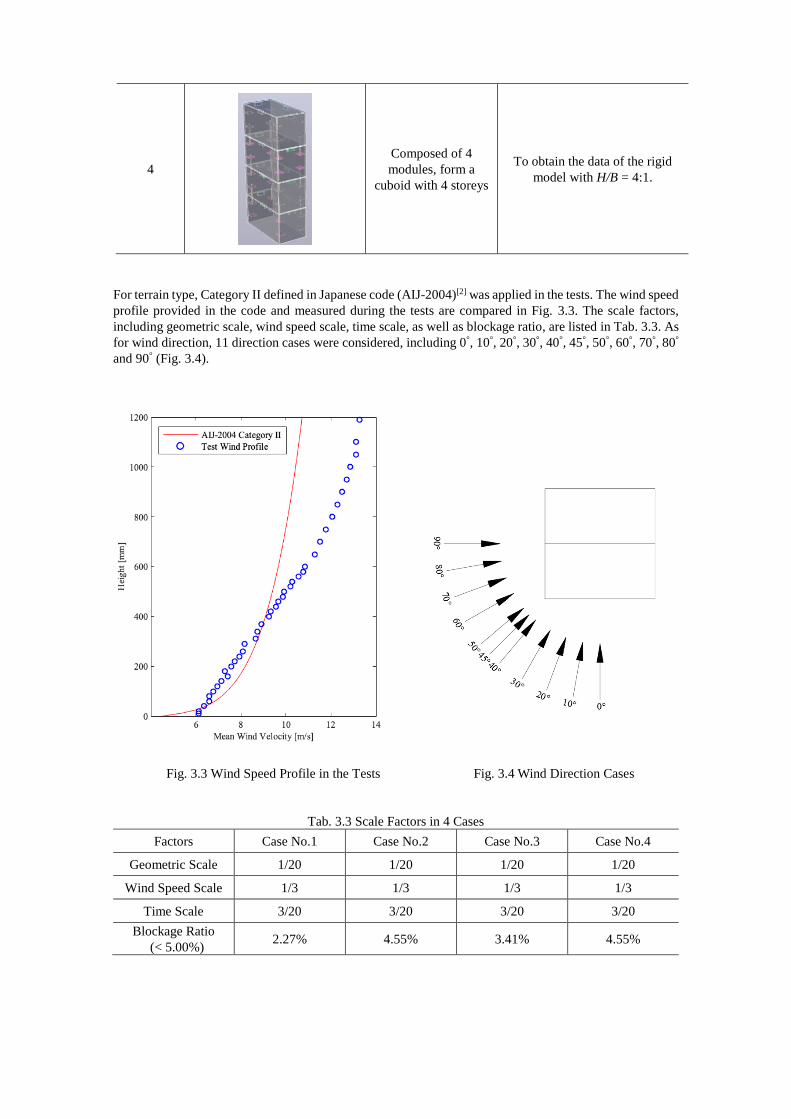
For terrain type, Category II defined in Japanese code (AIJ-2004)[2] was applied in the tests. The wind speed
profile provided in the code and measured during the tests are compared in Fig. 3.3. The scale factors,
including geometric scale, wind speed scale, time scale, as well as blockage ratio, are listed in Tab. 3.3. As
for wind direction, 11 direction cases were considered, including 0°, 10°, 20°, 30°, 40°, 45°, 50°, 60°, 70°, 80°
and 90° (Fig. 3.4).
Fig. 3.3 Wind Speed Profile in the Tests Fig. 3.4 Wind Direction Cases
Tab. 3.3 Scale Factors in 4 Cases
Factors Case No.1 Case No.2 Case No.3 Case No.4
Geometric Scale 1/20 1/20 1/20 1/20
Wind Speed Scale 1/3 1/3 1/3 1/3
Time Scale 3/20 3/20 3/20 3/20
Blockage Ratio
(< 5.00%) 2.27% 4.55% 3.41% 4.55%
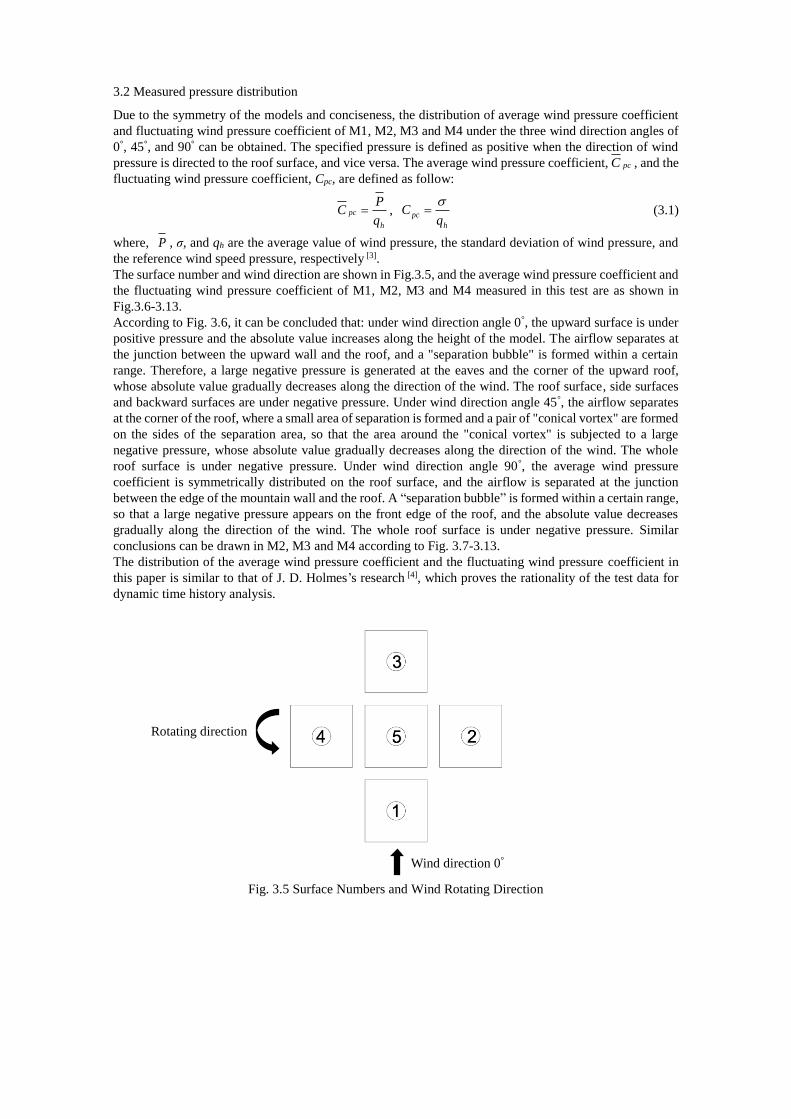
3.2 Measured pressure distribution
Due to the symmetry of the models and conciseness, the distribution of average wind pressure coefficient
and fluctuating wind pressure coefficient of M1, M2, M3 and M4 under the three wind direction angles of
0°, 45°, and 90° can be obtained. The specified pressure is defined as positive when the direction of wind
pressure is directed to the roof surface, and vice versa. The average wind pressure coefficient, pcC , and the
fluctuating wind pressure coefficient, Cpc, are defined as follow:
h
pc
q
PC ,
h
pcq
C
(3.1)
where, P , σ, and qh are the average value of wind pressure, the standard deviation of wind pressure, and
the reference wind speed pressure, respectively [3].
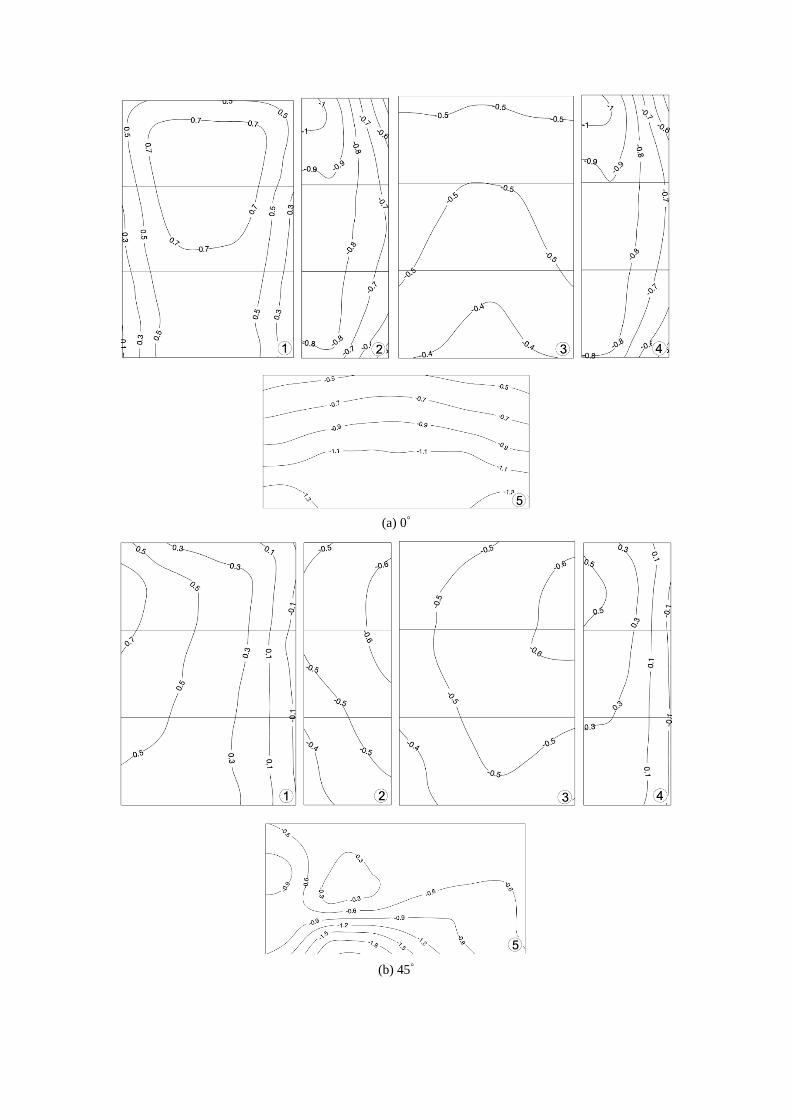
The surface number and wind direction are shown in Fig.3.5, and the average wind pressure coefficient and
the fluctuating wind pressure coefficient of M1, M2, M3 and M4 measured in this test are as shown in
Fig.3.6-3.13.
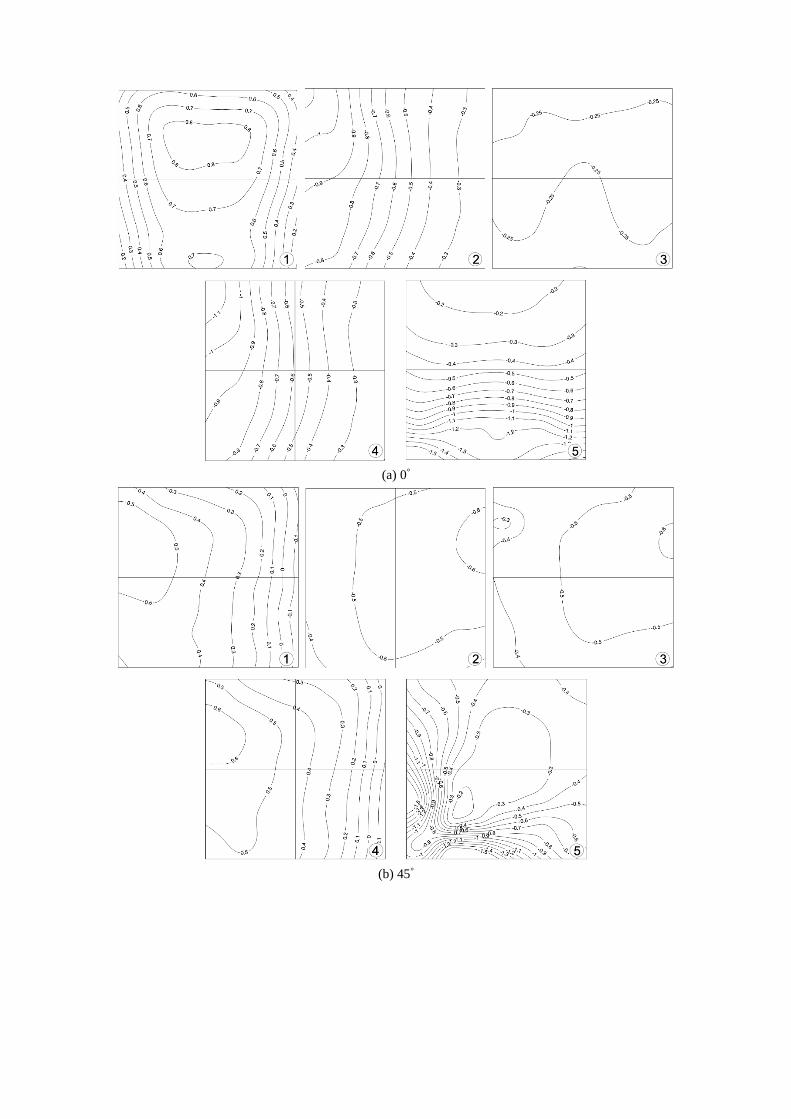
According to Fig. 3.6, it can be concluded that: under wind direction angle 0°, the upward surface is under
positive pressure and the absolute value increases along the height of the model. The airflow separates at
the junction between the upward wall and the roof, and a "separation bubble" is formed within a certain
range. Therefore, a large negative pressure is generated at the eaves and the corner of the upward roof,
whose absolute value gradually decreases along the direction of the wind. The roof surface, side surfaces
and backward surfaces are under negative pressure. Under wind direction angle 45°, the airflow separates
at the corner of the roof, where a small area of separation is formed and a pair of "conical vortex" are formed
on the sides of the separation area, so that the area around the "conical vortex" is subjected to a large
negative pressure, whose absolute value gradually decreases along the direction of the wind. The whole
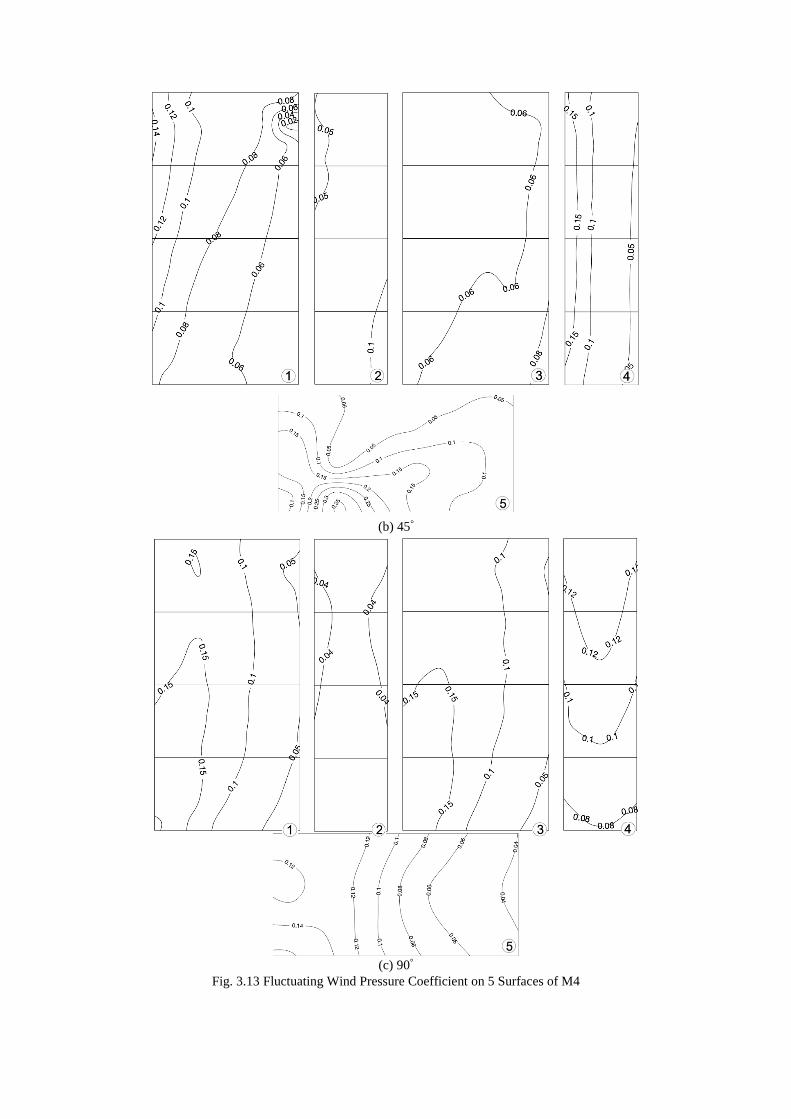
roof surface is under negative pressure. Under wind direction angle 90°, the average wind pressure
coefficient is symmetrically distributed on the roof surface, and the airflow is separated at the junction
between the edge of the mountain wall and the roof. A “separation bubble” is formed within a certain range,
so that a large negative pressure appears on the front edge of the roof, and the absolute value decreases
gradually along the direction of the wind. The whole roof surface is under negative pressure. Similar
conclusions can be drawn in M2, M3 and M4 according to Fig. 3.7-3.13.
The distribution of the average wind pressure coefficient and the fluctuating wind pressure coefficient in
this paper is similar to that of J. D. Holmes’s research [4], which proves the rationality of the test data for
dynamic time history analysis.
Fig. 3.5 Surface Numbers and Wind Rotating Direction
Wind direction 0°
Rotating direction
(a) 0°
(b) 45°

(c) 90°
Fig. 3.6 Average Wind Pressure Coefficient on 5 Surfaces of M1
(a) 0°

(b) 45°
(c) 90°
Fig. 3.7 Average Wind Pressure Coefficient on 5 Surfaces of M2
(a) 0°
(b) 45°

(c) 90°
Fig. 3.8 Average Wind Pressure Coefficient on 5 Surfaces of M3
(a) 0°
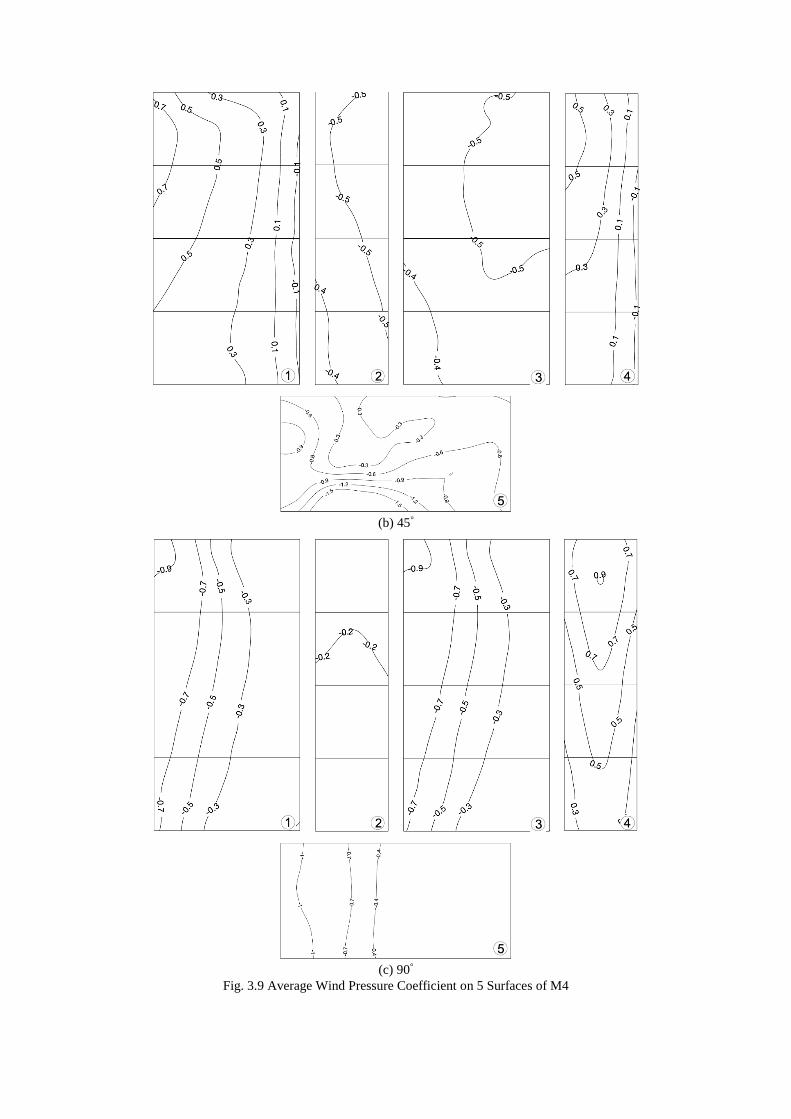
(b) 45°
(c) 90°
Fig. 3.9 Average Wind Pressure Coefficient on 5 Surfaces of M4
(a) 0°
(b) 45°
(c) 90°
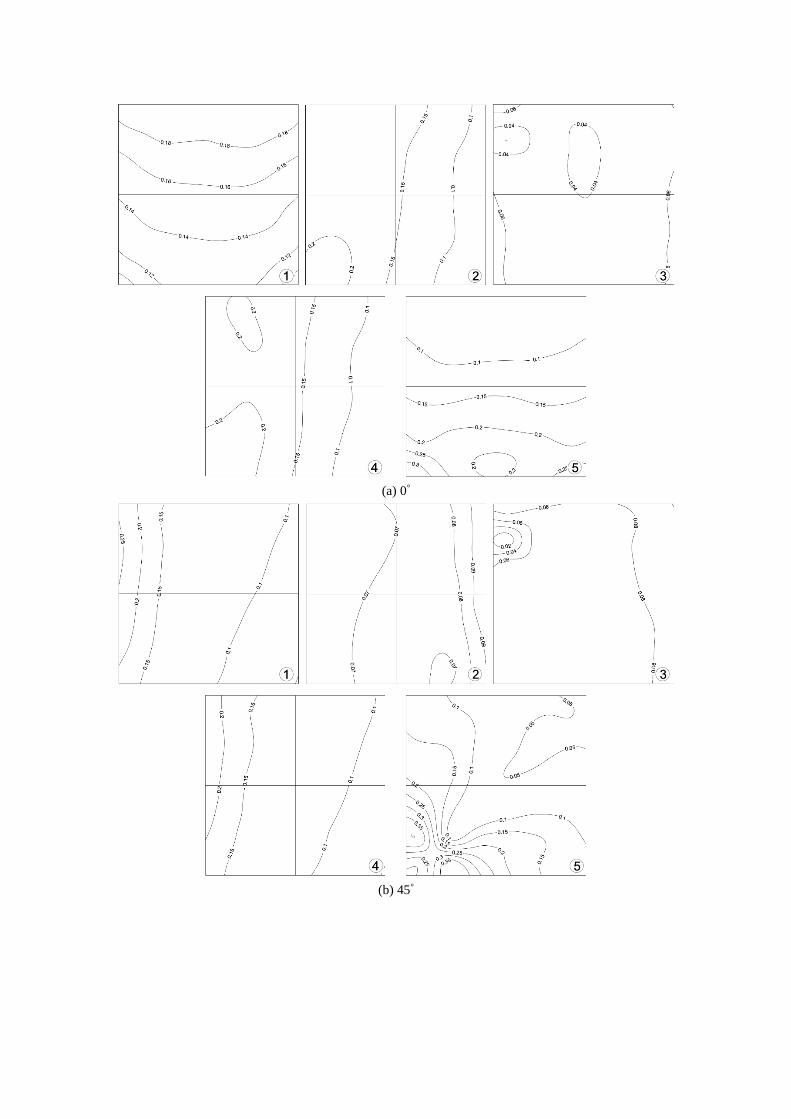
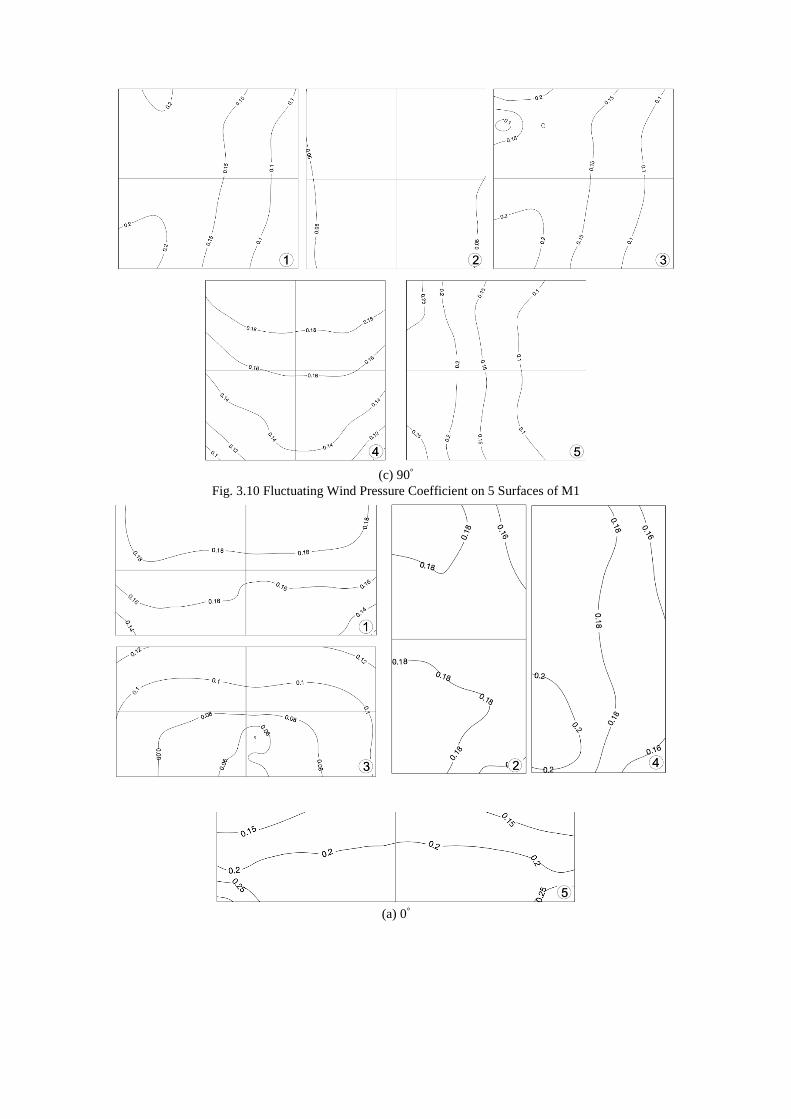
Fig. 3.10 Fluctuating Wind Pressure Coefficient on 5 Surfaces of M1
(a) 0°
(b) 45°
(c) 90°
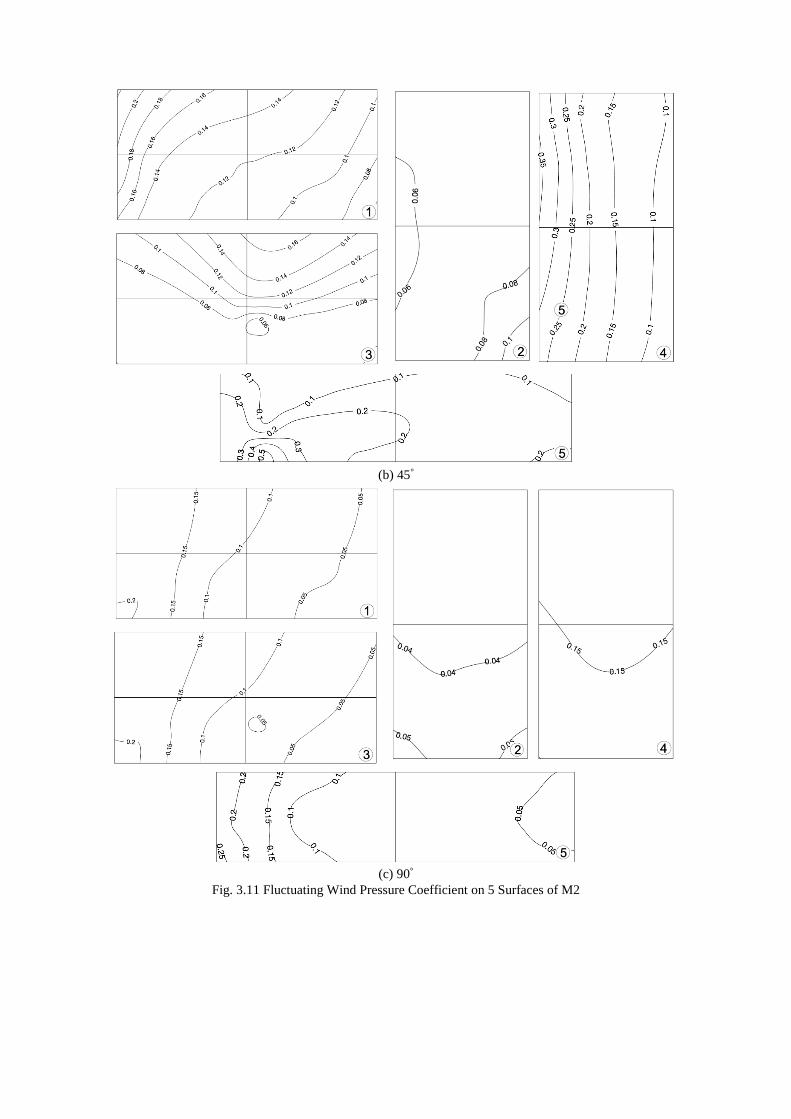
Fig. 3.11 Fluctuating Wind Pressure Coefficient on 5 Surfaces of M2

(a) 0°
(b) 45°
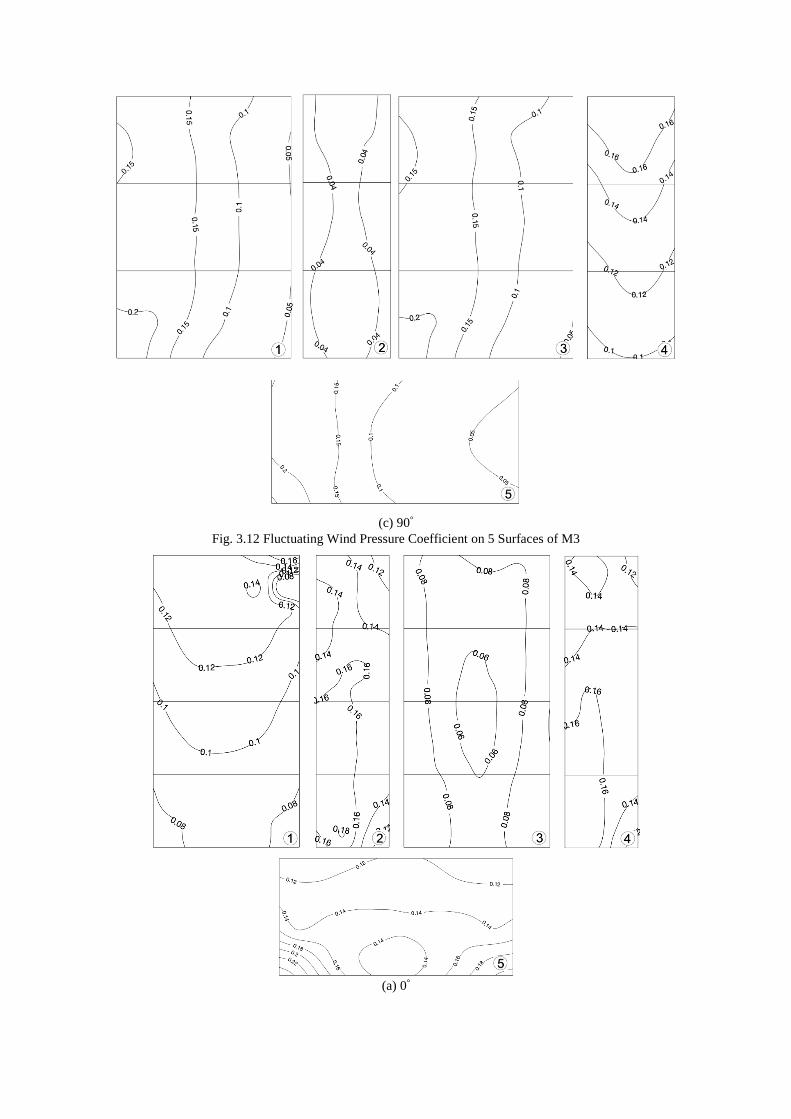
(c) 90°
Fig. 3.12 Fluctuating Wind Pressure Coefficient on 5 Surfaces of M3
(a) 0°
(b) 45°
(c) 90°
Fig. 3.13 Fluctuating Wind Pressure Coefficient on 5 Surfaces of M4
3.3 Finite element analysis
1) Finite element model
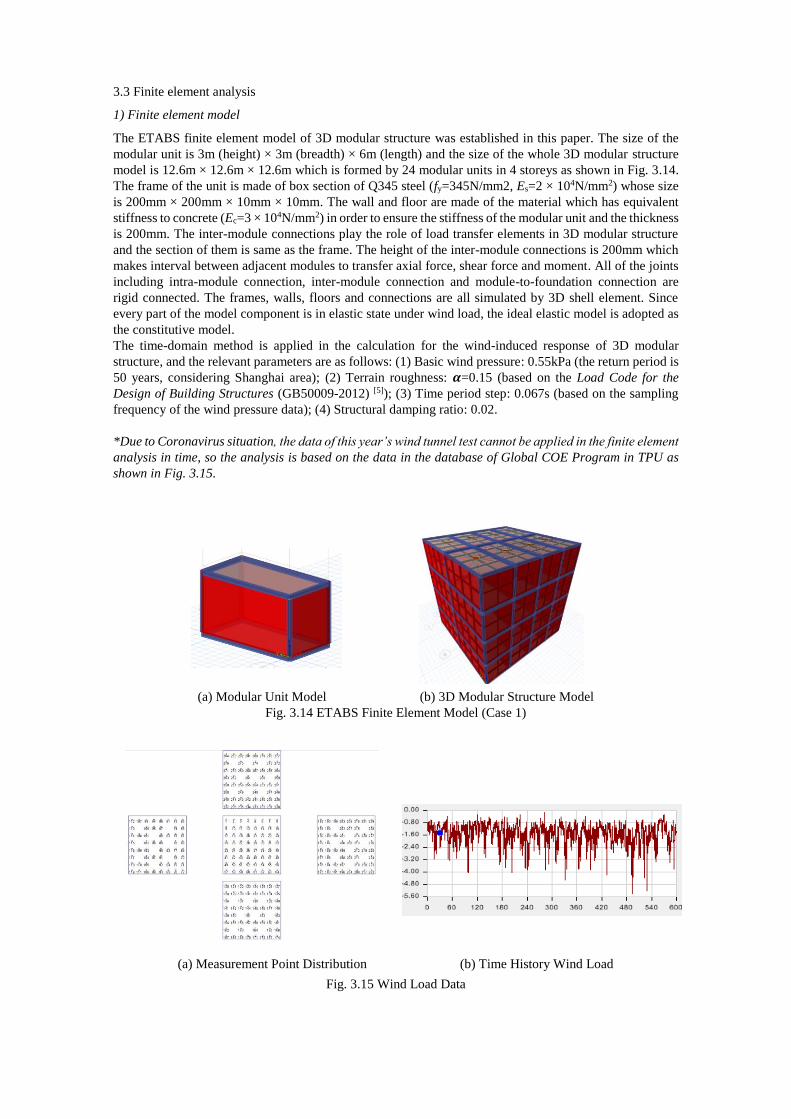
The ETABS finite element model of 3D modular structure was established in this paper. The size of the
modular unit is 3m (height) × 3m (breadth) × 6m (length) and the size of the whole 3D modular structure
model is 12.6m × 12.6m × 12.6m which is formed by 24 modular units in 4 storeys as shown in Fig. 3.14.
The frame of the unit is made of box section of Q345 steel (fy=345N/mm2, Es=2 × 10⁴N/mm2) whose size
is 200mm × 200mm × 10mm × 10mm. The wall and floor are made of the material which has equivalent
stiffness to concrete (Ec=3 × 10⁴N/mm2) in order to ensure the stiffness of the modular unit and the thickness
is 200mm. The inter-module connections play the role of load transfer elements in 3D modular structure
and the section of them is same as the frame. The height of the inter-module connections is 200mm which
makes interval between adjacent modules to transfer axial force, shear force and moment. All of the joints
including intra-module connection, inter-module connection and module-to-foundation connection are
rigid connected. The frames, walls, floors and connections are all simulated by 3D shell element. Since
every part of the model component is in elastic state under wind load, the ideal elastic model is adopted as
the constitutive model.
The time-domain method is applied in the calculation for the wind-induced response of 3D modular
structure, and the relevant parameters are as follows: (1) Basic wind pressure: 0.55kPa (the return period is
50 years, considering Shanghai area); (2) Terrain roughness: 𝜶=0.15 (based on the Load Code for the
Design of Building Structures (GB50009-2012) [5]); (3) Time period step: 0.067s (based on the sampling
frequency of the wind pressure data); (4) Structural damping ratio: 0.02.
*Due to Coronavirus situation, the data of this year’s wind tunnel test cannot be applied in the finite element
analysis in time, so the analysis is based on the data in the database of Global COE Program in TPU as
shown in Fig. 3.15.
(a) Modular Unit Model (b) 3D Modular Structure Model
Fig. 3.14 ETABS Finite Element Model (Case 1)
(a) Measurement Point Distribution (b) Time History Wind Load
Fig. 3.15 Wind Load Data
2) Analysis method
The wind-induced internal forces in connections Y is a stochastic process, compare the results of time
history analysis and code-based analysis. The internal force is evaluated as follows:
YY Y gs= + (3.2)
where, Y is the internal force, including axial force, shear force and moment. is average internal force. g
is the gust factor, which can calculate the confidence ratio. is the standard deviation.
3) Analysis result
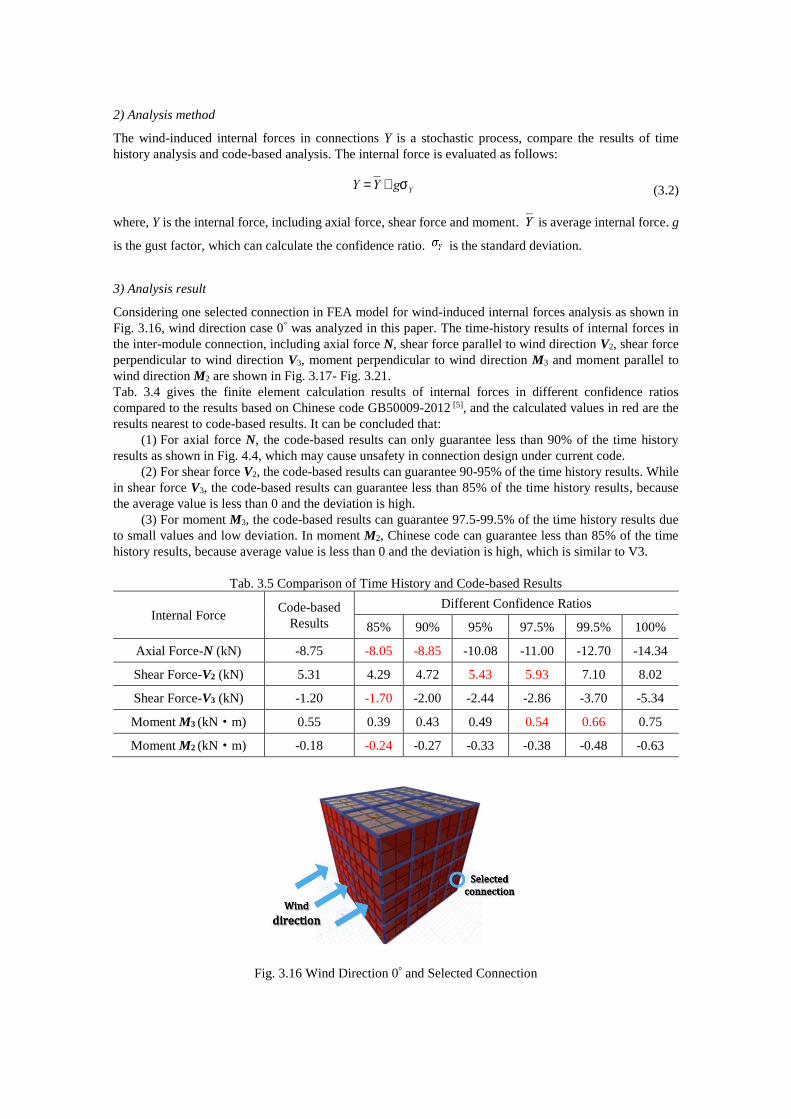
Considering one selected connection in FEA model for wind-induced internal forces analysis as shown in
Fig. 3.16, wind direction case 0° was analyzed in this paper. The time-history results of internal forces in
the inter-module connection, including axial force N, shear force parallel to wind direction V2, shear force
perpendicular to wind direction V3, moment perpendicular to wind direction M3 and moment parallel to
wind direction M2 are shown in Fig. 3.17- Fig. 3.21.
Tab. 3.4 gives the finite element calculation results of internal forces in different confidence ratios
compared to the results based on Chinese code GB50009-2012 [5], and the calculated values in red are the
results nearest to code-based results. It can be concluded that:
(1) For axial force N, the code-based results can only guarantee less than 90% of the time history
results as shown in Fig. 4.4, which may cause unsafety in connection design under current code.
(2) For shear force V2, the code-based results can guarantee 90-95% of the time history results. While
in shear force V3, the code-based results can guarantee less than 85% of the time history results, because
the average value is less than 0 and the deviation is high.
(3) For moment M3, the code-based results can guarantee 97.5-99.5% of the time history results due
to small values and low deviation. In moment M2, Chinese code can guarantee less than 85% of the time
history results, because average value is less than 0 and the deviation is high, which is similar to V3.
Tab. 3.5 Comparison of Time History and Code-based Results
Internal Force Code-based
Results
Different Confidence Ratios
85% 90% 95% 97.5% 99.5% 100%
Axial Force-N (kN) -8.75 -8.05 -8.85 -10.08 -11.00 -12.70 -14.34
Shear Force-V2 (kN) 5.31 4.29 4.72 5.43 5.93 7.10 8.02
Shear Force-V3 (kN) -1.20 -1.70 -2.00 -2.44 -2.86 -3.70 -5.34
Moment M3 (kN·m) 0.55 0.39 0.43 0.49 0.54 0.66 0.75
Moment M2 (kN·m) -0.18 -0.24 -0.27 -0.33 -0.38 -0.48 -0.63
Fig. 3.16 Wind Direction 0° and Selected Connection
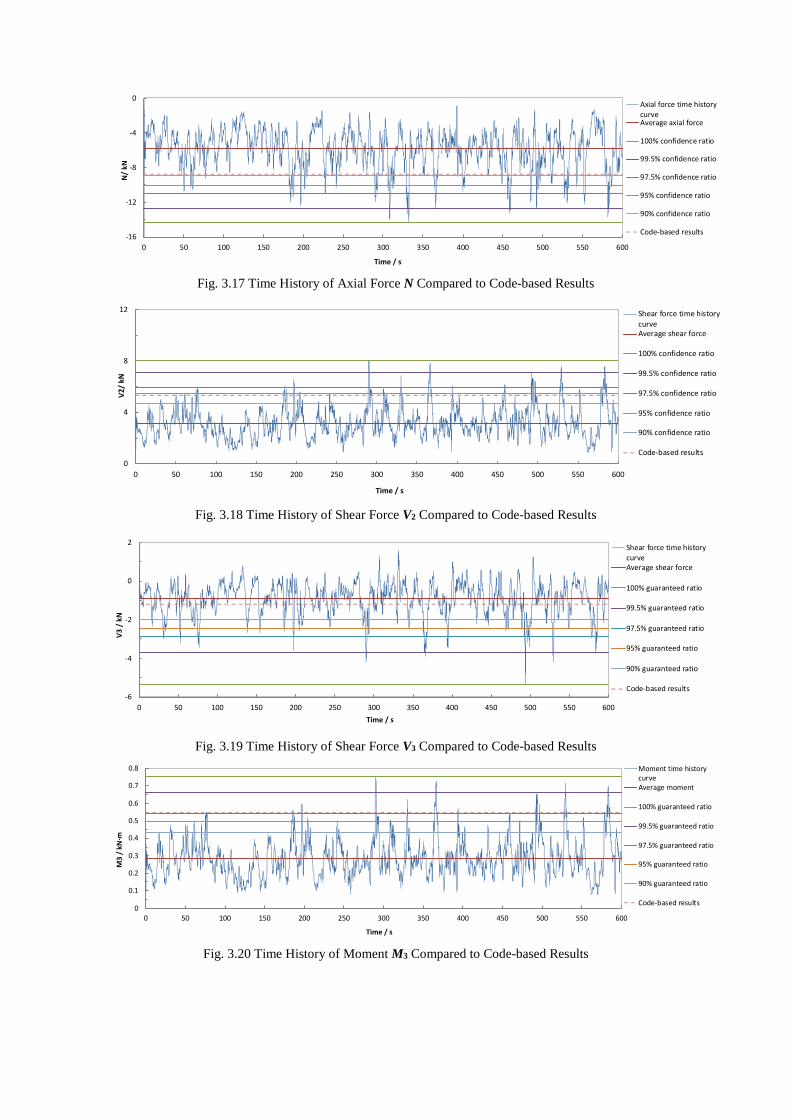
Fig. 3.17 Time History of Axial Force N Compared to Code-based Results
Fig. 3.18 Time History of Shear Force V2 Compared to Code-based Results
Fig. 3.19 Time History of Shear Force V3 Compared to Code-based Results
Fig. 3.20 Time History of Moment M3 Compared to Code-based Results
-16
-12
-8
-4
0
0 50 100 150 200 250 300 350 400 450 500 550 600
N/
kN
Time / s
Axial force time historycurveAverage axial force
100% confidence ratio
99.5% confidence ratio
97.5% confidence ratio
95% confidence ratio
90% confidence ratio
Code-based results
0
4
8
12
0 50 100 150 200 250 300 350 400 450 500 550 600
V2
/ kN
Time / s
Shear force time history
curveAverage shear force
100% confidence ratio
99.5% confidence ratio
97.5% confidence ratio
95% confidence ratio
90% confidence ratio
Code-based results
-6
-4
-2
0
2
0 50 100 150 200 250 300 350 400 450 500 550 600
V3
/ k
N
Time / s
Shear force time history
curveAverage shear force
100% guaranteed ratio
99.5% guaranteed ratio
97.5% guaranteed ratio
95% guaranteed ratio
90% guaranteed ratio
Code-based results
0
0.1
0.2
0.3
0.4
0.5
0.6
0.7
0.8
0 50 100 150 200 250 300 350 400 450 500 550 600
M3
/ k
N·m
Time / s
Moment time historycurveAverage moment
100% guaranteed ratio
99.5% guaranteed ratio
97.5% guaranteed ratio
95% guaranteed ratio
90% guaranteed ratio
Code-based results
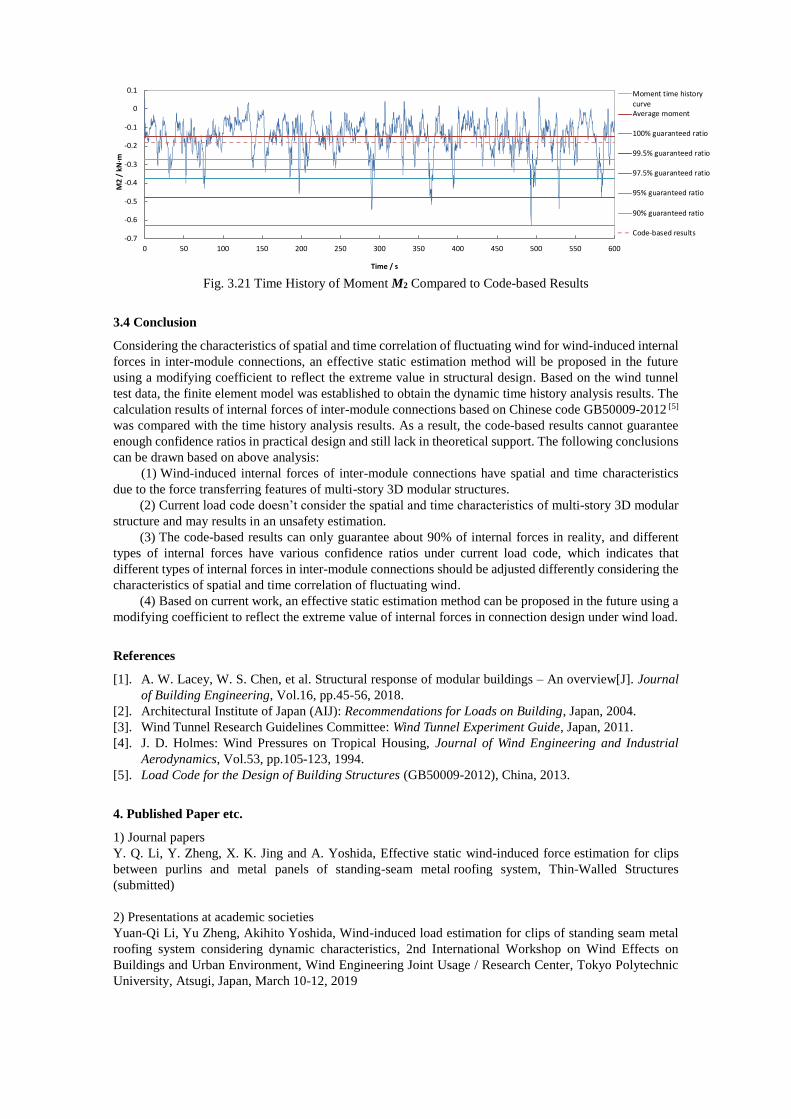
Fig. 3.21 Time History of Moment M2 Compared to Code-based Results
3.4 Conclusion
Considering the characteristics of spatial and time correlation of fluctuating wind for wind-induced internal
forces in inter-module connections, an effective static estimation method will be proposed in the future
using a modifying coefficient to reflect the extreme value in structural design. Based on the wind tunnel
test data, the finite element model was established to obtain the dynamic time history analysis results. The
calculation results of internal forces of inter-module connections based on Chinese code GB50009-2012 [5]
was compared with the time history analysis results. As a result, the code-based results cannot guarantee
enough confidence ratios in practical design and still lack in theoretical support. The following conclusions
can be drawn based on above analysis:
(1) Wind-induced internal forces of inter-module connections have spatial and time characteristics
due to the force transferring features of multi-story 3D modular structures.
(2) Current load code doesn’t consider the spatial and time characteristics of multi-story 3D modular
structure and may results in an unsafety estimation.
(3) The code-based results can only guarantee about 90% of internal forces in reality, and different
types of internal forces have various confidence ratios under current load code, which indicates that
different types of internal forces in inter-module connections should be adjusted differently considering the
characteristics of spatial and time correlation of fluctuating wind.
(4) Based on current work, an effective static estimation method can be proposed in the future using a
modifying coefficient to reflect the extreme value of internal forces in connection design under wind load.
References
[1]. A. W. Lacey, W. S. Chen, et al. Structural response of modular buildings – An overview[J]. Journal
of Building Engineering, Vol.16, pp.45-56, 2018.
[2]. Architectural Institute of Japan (AIJ): Recommendations for Loads on Building, Japan, 2004.
[3]. Wind Tunnel Research Guidelines Committee: Wind Tunnel Experiment Guide, Japan, 2011.
[4]. J. D. Holmes: Wind Pressures on Tropical Housing, Journal of Wind Engineering and Industrial
Aerodynamics, Vol.53, pp.105-123, 1994.
[5]. Load Code for the Design of Building Structures (GB50009-2012), China, 2013.
4. Published Paper etc.
1) Journal papers
Y. Q. Li, Y. Zheng, X. K. Jing and A. Yoshida, Effective static wind-induced force estimation for clips
between purlins and metal panels of standing-seam metal roofing system, Thin-Walled Structures
(submitted)
2) Presentations at academic societies
Yuan-Qi Li, Yu Zheng, Akihito Yoshida, Wind-induced load estimation for clips of standing seam metal
roofing system considering dynamic characteristics, 2nd International Workshop on Wind Effects on
Buildings and Urban Environment, Wind Engineering Joint Usage / Research Center, Tokyo Polytechnic
University, Atsugi, Japan, March 10-12, 2019
-0.7
-0.6
-0.5
-0.4
-0.3
-0.2
-0.1
0
0.1
0 50 100 150 200 250 300 350 400 450 500 550 600
M2
/ k
N·m
Time / s
Moment time history
curveAverage moment
100% guaranteed ratio
99.5% guaranteed ratio
97.5% guaranteed ratio
95% guaranteed ratio
90% guaranteed ratio
Code-based results
5. Research Group
1) Representative Researcher
YuanQi Li
XueKuan Fan
2) Collaborate Researchers
Akihito Yoshida
6. Abstract (half page)
Effective Static Wind-induced forces Estimation for Connection Design
of Multi-story 3D Modular Structures
Y. Q. Li1, X. K. Fan2 and A. Yoshida3
1Professor, Department of Structural Engineering, Tongji University, Shanghai, China,
[email protected] 2Graduate Student, Department of Structural Engineering, Tongji University, Shanghai, China,
[email protected] 3Professor, Wind Engineering Research Center, Tokyo Polytechnic University, Atsugi, Japan,
Keywords: Wind-induced internal force estimation, Inter-module connection, Multi-story 3D modular
structure, Spatial and time correlationship
Abstract
This project mainly focuses on an effective static estimation method for wind-induced internal forces in
inter-module connections of multi-story 3D modular structures considering the dynamic characteristics of
wind and structure. Firstly, simultaneous wind pressure distribution was measured by rigid modular models
mainly considering height-to-breadth ratio in the BLWT of Tokyo Polytechnic University, Japan, for
obtaining a test database for the following research. Then, finite element modeling and numerical analysis
for typical multi-story 3D modular structures was conducted to obtain the time-history internal forces of
inter-module connections for further comparison analysis. The internal forces of inter-module connections
were calculated based on current Chinese code, and compared to the finite element results based on different
confidence ratios. Finally, an effective static estimation method can be proposed in the future using an
equivalent modifying coefficient to reflect the extreme value of internal forces in connection design under
wind load for multi-story 3D modular structures based above comparison analysis.