Embed Size (px)
Citation preview
K. B. KATSAROS ET AL.
F
Wind Fields from SAR: Could They Improve OurUnderstanding of Storm Dynamics?
Kristina B. Katsaros, Paris W. Vachon, Peter G. Black, Peter P. Dodge, and Eric W. Uhlhorn
our hurricane images obtained by Radarsat were examined. Strong variations inbackscatter from the surface in and around convective cells associated with rain cellsand rain bands were observed, coupled with increased backscatter in regions of highwind outflow. Long linear features of 3 to 6 km were also noted in three of the fourhurricanes, probably due to secondary circulations in the atmospheric boundary layer(roll vortices). They occurred between convective rain bands, where the descendingmotion could produce a well-defined boundary layer. Although the origins andmechanisms producing the features are still not clear, the high-resolution wide swathcoverage modes of synthetic aperture radar provide new insights and present importantquestions for further research. (Keywords: Hurricanes, Roll vortices, SAR winds,Surface features.)
INTRODUCTIONSynthetic aperture radars (SARs) are regularly flown
on satellites, e.g., European Remote Sensing (ERS),Japanese Environmental Resources Satellite, and Ra-darsat, and several more are in the planning stages.Radarsat can be operated in several modes with wideenough swaths to make the data interesting for stormresearch.1 Our goal is to determine what we can learnabout tropical storms from SAR data.
During the 1998 hurricane season, four Radarsatimages were captured, one each from hurricanes Bon-nie, Danielle, Georges, and Mitch. Table 1 shows thehurricane dates and times, and the radar modes andtheir associated swath widths used to study them. Twoswath widths were used. For ScanSAR wide B, theresolution is 100 m, with a swath of about 450 km; for
86 JO
wide 1, the resolution is about 30 m with a swath ofabout 180 km. All four images were obtained duringdescending passes.
Radarsat operates in C band and therefore penetratesmost rain without much attenuation, but not the intenseconvection of a hurricane. It is operated in horizontalpolarization for both transmit and receive. The Scan-SAR modes are not well calibrated, and all Radarsatmodes have occasional problems with analog-to-digitalconverter saturation. Conversion of the backscatterstrength to wind speed is a challenge2 and was not at-tempted for the discussion here. The four hurricaneimages show many intriguing features for which we offersome interpretations based on previous work and avail-able supporting measurements from other platforms.
HNS HOPKINS APL TECHNICAL DIGEST, VOLUME 21, NUMBER 1 (2000)
Table 1. Radarsat SAR hurricane images from 1998.
Hurricane Date/time (UT) Mode Scale (km)
Bonnie 27 Aug/1107 ScanSAR wide B 457 � 943Danielle 31 Aug/1048 ScanSAR wide B 430 � 900Georges 26 Sep/1135 Wide 1 182 � 330Mitch 27 Sep/1133 Wide 1 184 � 322
Note: All passes are descending.
•
R
oef
B
iW(ti“bthmt
B2asr
BACKGROUNDThe SAR returns depend on the roughness of the sea
surface. To the extent that the returns depend on thesurface wind stress, one can interpret the backscatter interms of the corresponding wind speed at a particularheight. Calibration of the SAR in terms of wind speedis, however, dependent on the calibration of the radaritself, control of the image processing, and knowledgeof the wind direction from ancillary sources. In the caseof a tropical cyclone, the overall circulation pattern is,of course, known, which makes it useful for calibratingSAR wind algorithms (e.g., Ref. 2). Radar return isaffected by other features as well, such as raindropsimpinging on the ocean surface and generating rough-ness that dampens the wind-generated capillary wavesand attenuation by rain along the propagation paththrough the atmosphere. The Radarsat SAR operatesat C band (5.6 GHz or 5.6 cm), which is relativelyinsensitive to normal rainfall but not to the heavy rainof a hurricane.
The 180- or 450-km width of Radarsat images allowsa reasonably large portion of a hurricane to be viewedat once, but a random sampling would seldom catch astorm, and regular sampling would have many missesdue to the rarity of hurricanes. Thus, obtaining Radar-sat wind fields in hurricanes during the Atlantic hur-ricane season requires some level of serendipity or theopportunity for immediate decision making.
Combining the Radarsat images with other informa-tion is essential for interpretation. However, because ofthe nature of these extreme events and the success ofmodern warning systems, ships alter their course toavoid storms, and many buoy wind sensors lose poweror are simply destroyed before yielding significant highwind data. For interpretation, we rely on the followingdata sources for our cases:
• Research and reconnaissance aircraft missions by theHurricane Research Division (HRD) of the AtlanticOceanographic and Meteorological Laboratory pro-vided airborne scatterometer and radiometer dataand flight-level wind data (at about 1600 m). Duringthe 1998 hurricane season, HRD operated Global
JOHNS HOPKINS APL TECHNICAL DIGEST, VOLUME 21, NUMBER 1 (2000)
WIND FIELDS FROM SAR
Positioning System (GPS) dropsondes,3
which provided wind profiles down to thesea surface from which surface wind fieldscould be validated.4
• For Bonnie and Georges, observed near land-fall by Radarsat, we had coverage by theWSR-88D ground-based radars fromMorehead City, North Carolina, and KeyWest, Florida, respectively. They revealedthe location of rain bands and rain cells and,in the Doppler mode, gave values for theradial wind speed at the scan level (of the
order of 1 km). These next-generation ra-dars (NEXRAD) operate in continuous precipitationmode during hurricane passage, and therefore provide“base scan” images every 6 min, coincident in time towithin a few minutes of the SAR images.We have also employed visible and infrared satelliteobservations by the National Oceanic and Atmo-spheric Administration (NOAA) Geostationary Or-biting Environmental Satellite, the Advanced VeryHigh Resolution Radiometer (AVHRR) polar-orbiting NOAA satellite for sea surface temperature,rain and cloud information from the Special SensorMicrowave Imager (SSM/I) on Defense Meteorologi-cal Satellite Program polar-orbiting satellites, and theradar and microwave radiometer on the TropicalRainfall Measuring Mission (TRMM).
ESULTSIn the following sections, we illustrate the usefulness
f SAR images in diagnosing mesoscale structures inach of the four hurricanes as revealed by this new toolor hurricane study.
onnieFigure 1a shows a portion of a SAR image matched
n scale with an almost coincident NEXRAD image.e see three distinct features of Bonnie’s surface layer:
1) the dark bands characteristic of the leading edge ofwo segments of a mainly stratiform outer rain bandndicated by A and B and referred to5 as the hurricaneprincipal rain band”; (2) the alternating dark andright patches representing the convective nature ofhe outer band (from C to C�) referred to as the “pre-urricane squall line”; and (3) banded structures seenainly southwest of the stratiform principal band and
he outer convective band.The image shows that the stratiform bands A and
lie primarily over the cooler shelf water (26.5–8.5°C) inshore from the north wall of the Gulf Streams derived from an AVHRR image from JHU/APL (nothown). The outer convective band, C–C�, lies prima-ily over the Gulf Stream seaward of the north wall and,
87
K. B. KATSAROS ET AL.
BB
DD ��
AA
CC
DD
(a)
CC ��
Morehead CityMorehead City
Cape Hatteras
dBZ
(b)
51484441383431282421181411
BB
DD ��
AA
CC
DD CC ��
Morehead CityMorehead City
m/s
–1
–11
–21
(c)
Morehead City
CC ��
AA
BB
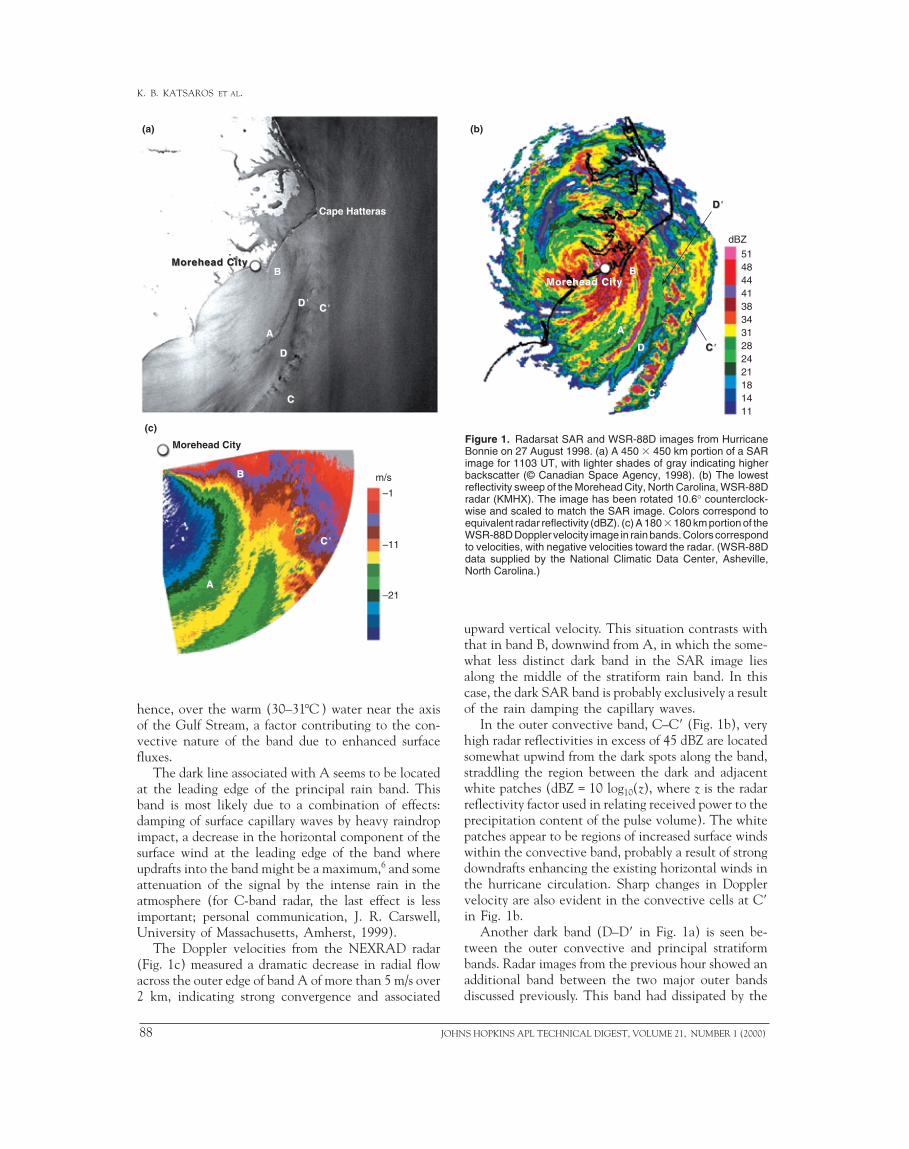
Figure 1. Radarsat SAR and WSR-88D images from HurricaneBonnie on 27 August 1998. (a) A 450 � 450 km portion of a SARimage for 1103 UT, with lighter shades of gray indicating higherbackscatter (© Canadian Space Agency, 1998). (b) The lowestreflectivity sweep of the Morehead City, North Carolina, WSR-88Dradar (KMHX). The image has been rotated 10.6° counterclock-wise and scaled to match the SAR image. Colors correspond toequivalent radar reflectivity (dBZ). (c) A 180 � 180 km portion of theWSR-88D Doppler velocity image in rain bands. Colors correspondto velocities, with negative velocities toward the radar. (WSR-88Ddata supplied by the National Climatic Data Center, Asheville,North Carolina.)
upward vertical velocity. This situation contrasts withthat in band B, downwind from A, in which the some-
hence, over the warm (30–31°C ) water near the axisof the Gulf Stream, a factor contributing to the con-vective nature of the band due to enhanced surfacefluxes.
The dark line associated with A seems to be locatedat the leading edge of the principal rain band. Thisband is most likely due to a combination of effects:damping of surface capillary waves by heavy raindropimpact, a decrease in the horizontal component of thesurface wind at the leading edge of the band whereupdrafts into the band might be a maximum,6 and someattenuation of the signal by the intense rain in theatmosphere (for C-band radar, the last effect is lessimportant; personal communication, J. R. Carswell,University of Massachusetts, Amherst, 1999).
The Doppler velocities from the NEXRAD radar(Fig. 1c) measured a dramatic decrease in radial flowacross the outer edge of band A of more than 5 m/s over2 km, indicating strong convergence and associated
88 JOH
what less distinct dark band in the SAR image liesalong the middle of the stratiform rain band. In thiscase, the dark SAR band is probably exclusively a resultof the rain damping the capillary waves.
In the outer convective band, C–C� (Fig. 1b), veryhigh radar reflectivities in excess of 45 dBZ are locatedsomewhat upwind from the dark spots along the band,straddling the region between the dark and adjacentwhite patches (dBZ = 10 log10(z), where z is the radarreflectivity factor used in relating received power to theprecipitation content of the pulse volume). The whitepatches appear to be regions of increased surface windswithin the convective band, probably a result of strongdowndrafts enhancing the existing horizontal winds inthe hurricane circulation. Sharp changes in Dopplervelocity are also evident in the convective cells at C�in Fig. 1b.
Another dark band (D–D� in Fig. 1a) is seen be-tween the outer convective and principal stratiformbands. Radar images from the previous hour showed anadditional band between the two major outer bandsdiscussed previously. This band had dissipated by the
NS HOPKINS APL TECHNICAL DIGEST, VOLUME 21, NUMBER 1 (2000)
time of the SAR overpass. However, it appears that thesignature from this rain band had persisted as a coher-ent dark surface feature for the ensuing 0.5 to 1.0 h.This “hysteresis” effect was noted in the SAR imagesanalyzed by Atlas and Black7 for thunderstorm cells ina quiescent background wind field.
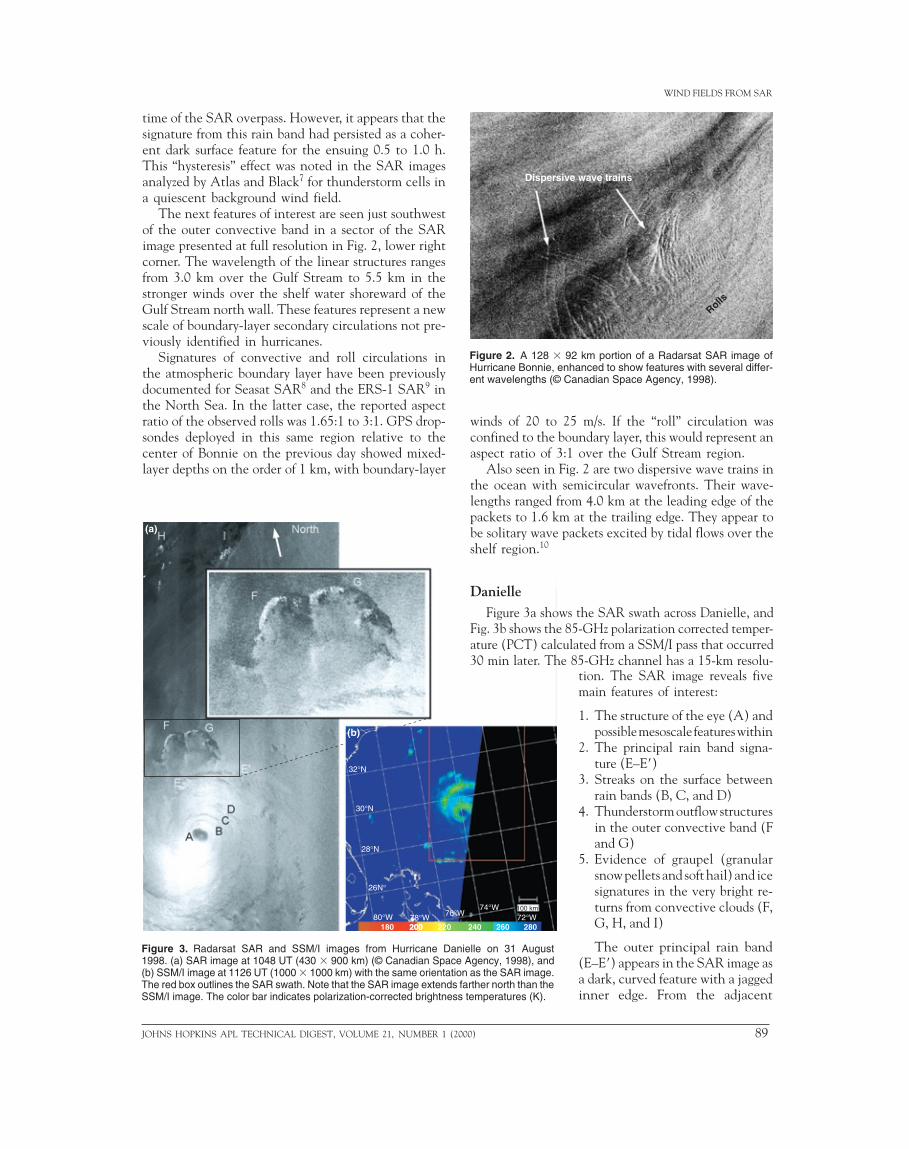
The next features of interest are seen just southwestof the outer convective band in a sector of the SARimage presented at full resolution in Fig. 2, lower rightcorner. The wavelength of the linear structures rangesfrom 3.0 km over the Gulf Stream to 5.5 km in thestronger winds over the shelf water shoreward of theGulf Stream north wall. These features represent a newscale of boundary-layer secondary circulations not pre-viously identified in hurricanes.
Signatures of convective and roll circulations inthe atmospheric boundary layer have been previouslydocumented for Seasat SAR8 and the ERS-1 SAR9 inthe North Sea. In the latter case, the reported aspectratio of the observed rolls was 1.65:1 to 3:1. GPS drop-sondes deployed in this same region relative to thecenter of Bonnie on the previous day showed mixed-layer depths on the order of 1 km, with boundary-layer
100 km
180 200200 220 240 260 280
32°N
30°N
28°N
26N°
80°W 78°W 76°W74°W
72°W
(a)
(b)
lengths ranged frompackets to 1.6 km be solitary wave pashelf region.10
DanielleFigure 3a shows
Fig. 3b shows the 85ature (PCT) calcul30 min later. The 8
Figure 3. Radarsat SAR and SSM/I images from Hurricane Danielle on 31 August1998. (a) SAR image at 1048 UT (430 � 900 km) (© Canadian Space Agency, 1998), and(b) SSM/I image at 1126 UT (1000 � 1000 km) with the same orientation as the SAR image.The red box outlines the SAR swath. Note that the SAR image extends farther north than theSSM/I image. The color bar indicates polarization-corrected brightness temperatures (K).
JOHNS HOPKINS APL TECHNICAL DIGEST, VOLUME 21, NUMBER 1 (2
WIND FIELDS FROM SAR
winds of 20 to 25 m/s. If the “roll” circulation wasconfined to the boundary layer, this would represent anaspect ratio of 3:1 over the Gulf Stream region.
Also seen in Fig. 2 are two dispersive wave trains inthe ocean with semicircular wavefronts. Their wave-
4.0 km at the leading edge of theat the trailing edge. They appear tockets excited by tidal flows over the
the SAR swath across Danielle, and-GHz polarization corrected temper-
ated from a SSM/I pass that occurred5-GHz channel has a 15-km resolu-
Figure 2. A 128 � 92 km portion of a Radarsat SAR image ofHurricane Bonnie, enhanced to show features with several differ-ent wavelengths (© Canadian Space Agency, 1998).
tion. The SAR image reveals fivemain features of interest:
Dispersive wave trains
Rolls
000)
1. The structure of the eye (A) andpossible mesoscale features within
2. The principal rain band signa-ture (E–E�)
3. Streaks on the surface betweenrain bands (B, C, and D)
4. Thunderstorm outflow structuresin the outer convective band (Fand G)
5. Evidence of graupel (granularsnow pellets and soft hail) and icesignatures in the very bright re-turns from convective clouds (F,G, H, and I)
The outer principal rain band(E–E�) appears in the SAR image asa dark, curved feature with a jaggedinner edge. From the adjacent
89
K. B. KATSAROS ET AL.
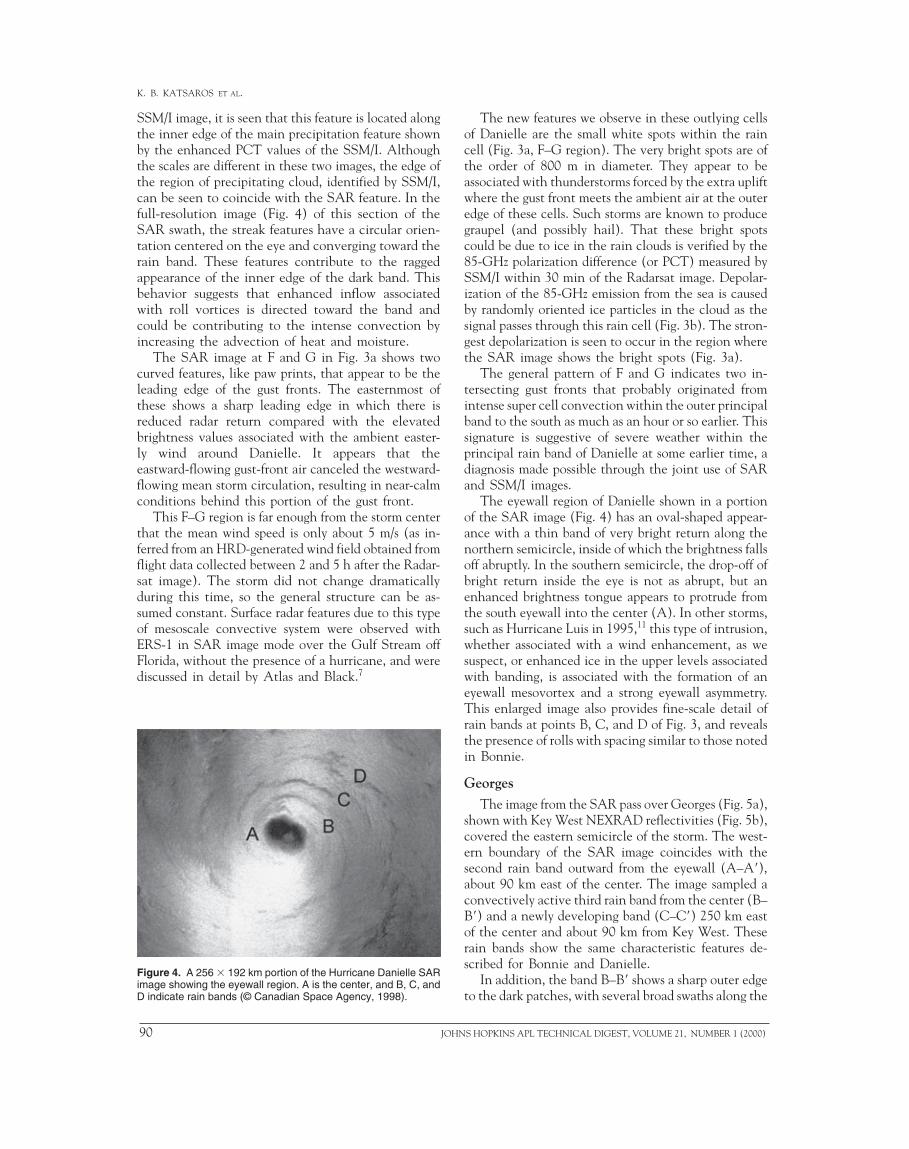
SSM/I image, it is seen that this feature is located alongthe inner edge of the main precipitation feature shownby the enhanced PCT values of the SSM/I. Althoughthe scales are different in these two images, the edge ofthe region of precipitating cloud, identified by SSM/I,can be seen to coincide with the SAR feature. In thefull-resolution image (Fig. 4) of this section of theSAR swath, the streak features have a circular orien-tation centered on the eye and converging toward therain band. These features contribute to the raggedappearance of the inner edge of the dark band. Thisbehavior suggests that enhanced inflow associatedwith roll vortices is directed toward the band andcould be contributing to the intense convection byincreasing the advection of heat and moisture.
The SAR image at F and G in Fig. 3a shows twocurved features, like paw prints, that appear to be theleading edge of the gust fronts. The easternmost ofthese shows a sharp leading edge in which there isreduced radar return compared with the elevatedbrightness values associated with the ambient easter-ly wind around Danielle. It appears that theeastward-flowing gust-front air canceled the westward-flowing mean storm circulation, resulting in near-calmconditions behind this portion of the gust front.
This F–G region is far enough from the storm centerthat the mean wind speed is only about 5 m/s (as in-ferred from an HRD-generated wind field obtained fromflight data collected between 2 and 5 h after the Radar-sat image). The storm did not change dramaticallyduring this time, so the general structure can be as-sumed constant. Surface radar features due to this typeof mesoscale convective system were observed withERS-1 in SAR image mode over the Gulf Stream offFlorida, without the presence of a hurricane, and werediscussed in detail by Atlas and Black.7
Figure 4. A 256 � 192 km portion of the Hurricane Danielle SARimage showing the eyewall region. A is the center, and B, C, andD indicate rain bands (© Canadian Space Agency, 1998).
90 JOH
The new features we observe in these outlying cellsof Danielle are the small white spots within the raincell (Fig. 3a, F–G region). The very bright spots are ofthe order of 800 m in diameter. They appear to beassociated with thunderstorms forced by the extra upliftwhere the gust front meets the ambient air at the outeredge of these cells. Such storms are known to producegraupel (and possibly hail). That these bright spotscould be due to ice in the rain clouds is verified by the85-GHz polarization difference (or PCT) measured bySSM/I within 30 min of the Radarsat image. Depolar-ization of the 85-GHz emission from the sea is causedby randomly oriented ice particles in the cloud as thesignal passes through this rain cell (Fig. 3b). The stron-gest depolarization is seen to occur in the region wherethe SAR image shows the bright spots (Fig. 3a).
The general pattern of F and G indicates two in-tersecting gust fronts that probably originated fromintense super cell convection within the outer principalband to the south as much as an hour or so earlier. Thissignature is suggestive of severe weather within theprincipal rain band of Danielle at some earlier time, adiagnosis made possible through the joint use of SARand SSM/I images.
The eyewall region of Danielle shown in a portionof the SAR image (Fig. 4) has an oval-shaped appear-ance with a thin band of very bright return along thenorthern semicircle, inside of which the brightness fallsoff abruptly. In the southern semicircle, the drop-off ofbright return inside the eye is not as abrupt, but anenhanced brightness tongue appears to protrude fromthe south eyewall into the center (A). In other storms,such as Hurricane Luis in 1995,11 this type of intrusion,whether associated with a wind enhancement, as wesuspect, or enhanced ice in the upper levels associatedwith banding, is associated with the formation of aneyewall mesovortex and a strong eyewall asymmetry.This enlarged image also provides fine-scale detail ofrain bands at points B, C, and D of Fig. 3, and revealsthe presence of rolls with spacing similar to those notedin Bonnie.
GeorgesThe image from the SAR pass over Georges (Fig. 5a),
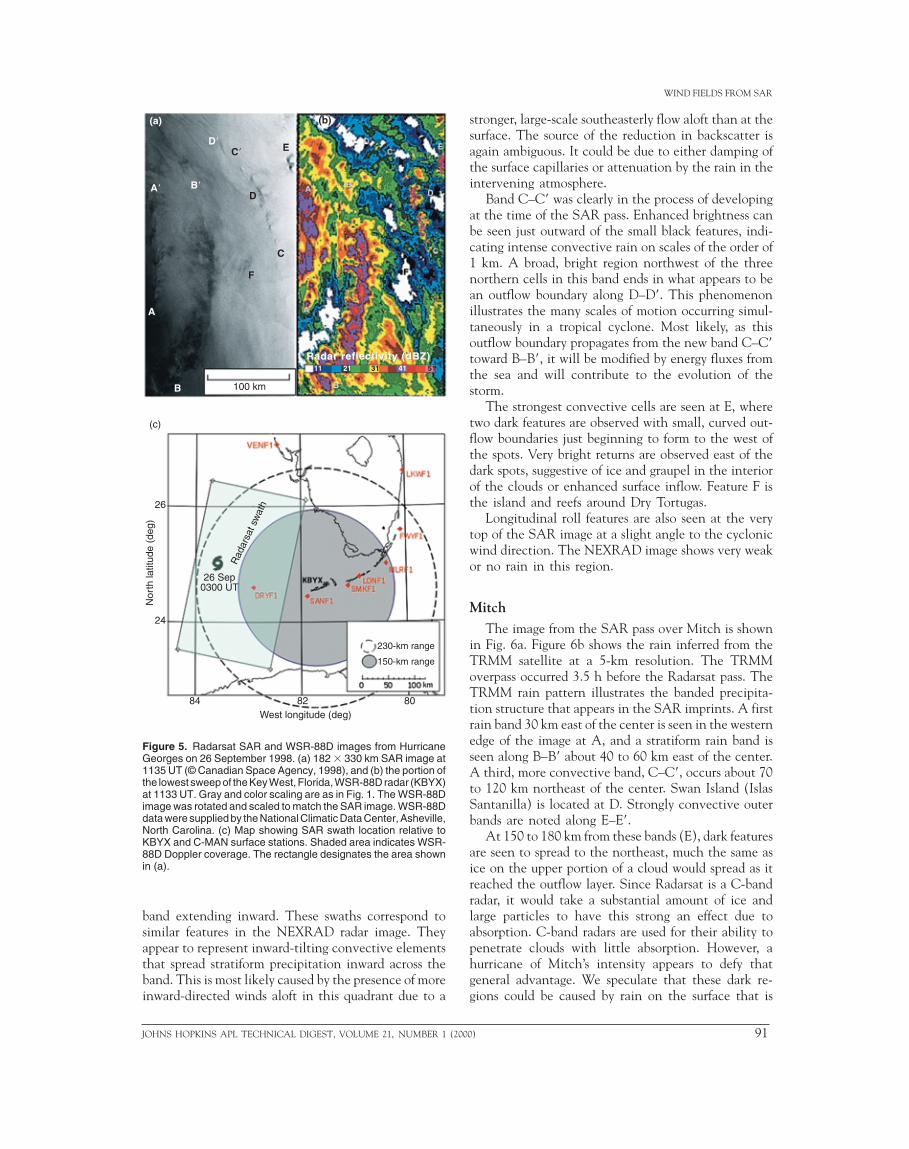
shown with Key West NEXRAD reflectivities (Fig. 5b),covered the eastern semicircle of the storm. The west-ern boundary of the SAR image coincides with thesecond rain band outward from the eyewall (A–A�),about 90 km east of the center. The image sampled aconvectively active third rain band from the center (B–B�) and a newly developing band (C–C�) 250 km eastof the center and about 90 km from Key West. Theserain bands show the same characteristic features de-scribed for Bonnie and Danielle.
In addition, the band B–B� shows a sharp outer edgeto the dark patches, with several broad swaths along the
NS HOPKINS APL TECHNICAL DIGEST, VOLUME 21, NUMBER 1 (2000)
WIND FIELDS FROM SAR
band extending inward. These swaths correspond tosimilar features in the NEXRAD radar image. Theyappear to represent inward-tilting convective elementsthat spread stratiform precipitation inward across theband. This is most likely caused by the presence of moreinward-directed winds aloft in this quadrant due to a
Figure 5. Radarsat SAR and WSR-88D images from HurricaneGeorges on 26 September 1998. (a) 182 � 330 km SAR image at1135 UT (© Canadian Space Agency, 1998), and (b) the portion ofthe lowest sweep of the Key West, Florida, WSR-88D radar (KBYX)at 1133 UT. Gray and color scaling are as in Fig. 1. The WSR-88Dimage was rotated and scaled to match the SAR image. WSR-88Ddata were supplied by the National Climatic Data Center, Asheville,North Carolina. (c) Map showing SAR swath location relative toKBYX and C-MAN surface stations. Shaded area indicates WSR-88D Doppler coverage. The rectangle designates the area shownin (a).
Radar reflectivity (dBZ)Radar reflectivity (dBZ)
(a) (b)
(c)
100 km
A� B�
D�C� E
D
C
F
A
B
26 Sep0300 UT
Rad
arsa
t sw
ath
11 21 31 5141
26
24
84 82 80West longitude (deg)
Nor
th la
titud
e (d
eg)
230-km range
150-km range
JOHNS HOPKINS APL TECHNICAL DIGEST, VOLUME 21, NUMBER 1 (2
stronger, large-scale southeasterly flow aloft than at thesurface. The source of the reduction in backscatter isagain ambiguous. It could be due to either damping ofthe surface capillaries or attenuation by the rain in theintervening atmosphere.
Band C–C� was clearly in the process of developingat the time of the SAR pass. Enhanced brightness canbe seen just outward of the small black features, indi-cating intense convective rain on scales of the order of1 km. A broad, bright region northwest of the threenorthern cells in this band ends in what appears to bean outflow boundary along D–D�. This phenomenonillustrates the many scales of motion occurring simul-taneously in a tropical cyclone. Most likely, as thisoutflow boundary propagates from the new band C–C�toward B–B�, it will be modified by energy fluxes fromthe sea and will contribute to the evolution of thestorm.
The strongest convective cells are seen at E, wheretwo dark features are observed with small, curved out-flow boundaries just beginning to form to the west ofthe spots. Very bright returns are observed east of thedark spots, suggestive of ice and graupel in the interiorof the clouds or enhanced surface inflow. Feature F isthe island and reefs around Dry Tortugas.
Longitudinal roll features are also seen at the verytop of the SAR image at a slight angle to the cyclonicwind direction. The NEXRAD image shows very weakor no rain in this region.
MitchThe image from the SAR pass over Mitch is shown
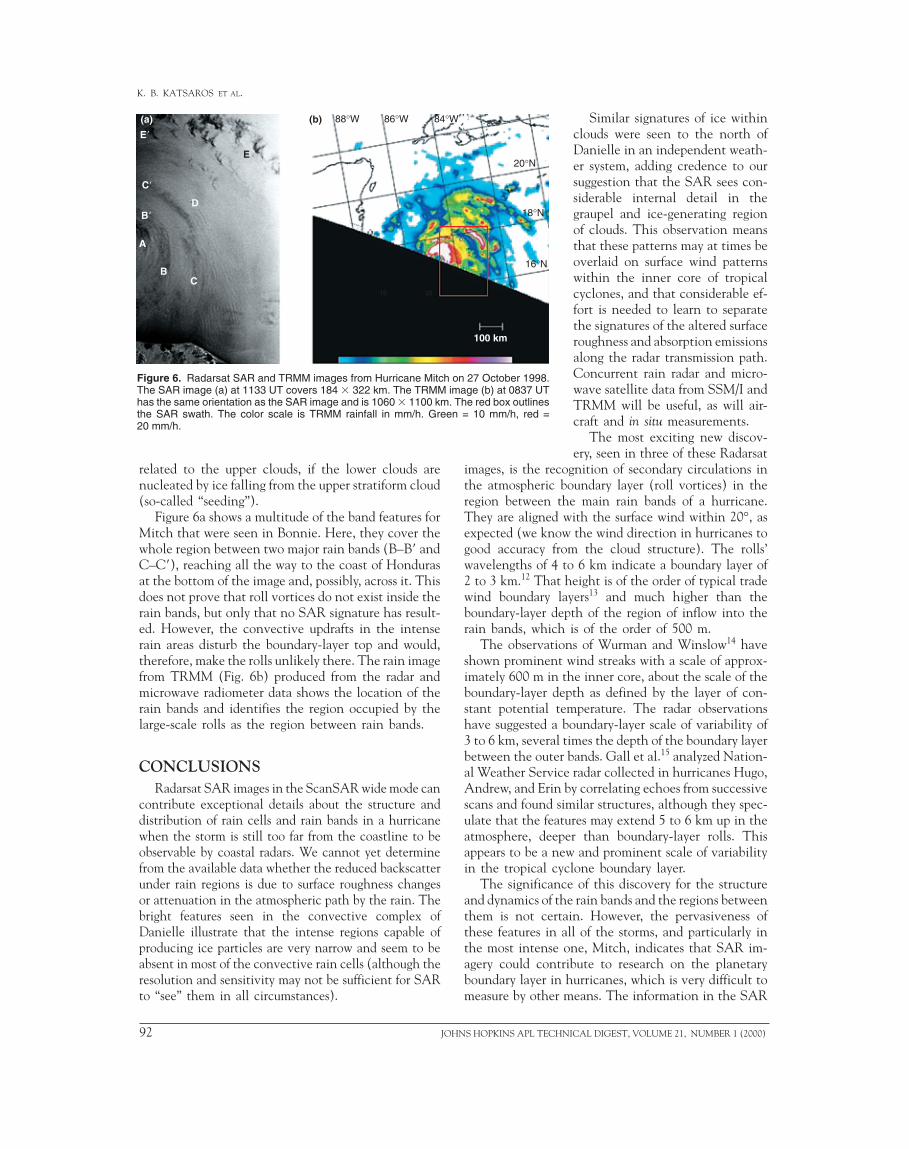
in Fig. 6a. Figure 6b shows the rain inferred from theTRMM satellite at a 5-km resolution. The TRMMoverpass occurred 3.5 h before the Radarsat pass. TheTRMM rain pattern illustrates the banded precipita-tion structure that appears in the SAR imprints. A firstrain band 30 km east of the center is seen in the westernedge of the image at A, and a stratiform rain band isseen along B–B� about 40 to 60 km east of the center.A third, more convective band, C–C�, occurs about 70to 120 km northeast of the center. Swan Island (IslasSantanilla) is located at D. Strongly convective outerbands are noted along E–E�.
At 150 to 180 km from these bands (E), dark featuresare seen to spread to the northeast, much the same asice on the upper portion of a cloud would spread as itreached the outflow layer. Since Radarsat is a C-bandradar, it would take a substantial amount of ice andlarge particles to have this strong an effect due toabsorption. C-band radars are used for their ability topenetrate clouds with little absorption. However, ahurricane of Mitch’s intensity appears to defy thatgeneral advantage. We speculate that these dark re-gions could be caused by rain on the surface that is
000) 91
K. B. KATSAROS ET AL.
Figure 6. Radarsat SAR and TRMM images from Hurricane Mitch on 27 October 1998.The SAR image (a) at 1133 UT covers 184 � 322 km. The TRMM image (b) at 0837 UThas the same orientation as the SAR image and is 1060 � 1100 km. The red box outlinesthe SAR swath. The color scale is TRMM rainfall in mm/h. Green = 10 mm/h, red =20 mm/h.
E�
C�
A
B�
BC
D
E
100 km
88°W 86°W 84°W
20°N
18°N
16°N
10 20
(a) (b)
related to the upper clouds, if the lower clouds arenucleated by ice falling from the upper stratiform cloud(so-called “seeding”).
Figure 6a shows a multitude of the band features forMitch that were seen in Bonnie. Here, they cover thewhole region between two major rain bands (B–B� andC–C�), reaching all the way to the coast of Hondurasat the bottom of the image and, possibly, across it. Thisdoes not prove that roll vortices do not exist inside therain bands, but only that no SAR signature has result-ed. However, the convective updrafts in the intenserain areas disturb the boundary-layer top and would,therefore, make the rolls unlikely there. The rain imagefrom TRMM (Fig. 6b) produced from the radar andmicrowave radiometer data shows the location of therain bands and identifies the region occupied by thelarge-scale rolls as the region between rain bands.
CONCLUSIONSRadarsat SAR images in the ScanSAR wide mode can
contribute exceptional details about the structure anddistribution of rain cells and rain bands in a hurricanewhen the storm is still too far from the coastline to beobservable by coastal radars. We cannot yet determinefrom the available data whether the reduced backscatterunder rain regions is due to surface roughness changesor attenuation in the atmospheric path by the rain. Thebright features seen in the convective complex ofDanielle illustrate that the intense regions capable ofproducing ice particles are very narrow and seem to beabsent in most of the convective rain cells (although theresolution and sensitivity may not be sufficient for SARto “see” them in all circumstances).
92 JOHNS HOPKINS APL TECH
Similar signatures of ice withinclouds were seen to the north ofDanielle in an independent weath-er system, adding credence to oursuggestion that the SAR sees con-siderable internal detail in thegraupel and ice-generating regionof clouds. This observation meansthat these patterns may at times beoverlaid on surface wind patternswithin the inner core of tropicalcyclones, and that considerable ef-fort is needed to learn to separatethe signatures of the altered surfaceroughness and absorption emissionsalong the radar transmission path.Concurrent rain radar and micro-wave satellite data from SSM/I andTRMM will be useful, as will air-craft and in situ measurements.
The most exciting new discov-ery, seen in three of these Radarsat
images, is the recognition of secondary circulations inthe atmospheric boundary layer (roll vortices) in theregion between the main rain bands of a hurricane.They are aligned with the surface wind within 20°, asexpected (we know the wind direction in hurricanes togood accuracy from the cloud structure). The rolls’wavelengths of 4 to 6 km indicate a boundary layer of2 to 3 km.12 That height is of the order of typical tradewind boundary layers13 and much higher than theboundary-layer depth of the region of inflow into therain bands, which is of the order of 500 m.
The observations of Wurman and Winslow14 haveshown prominent wind streaks with a scale of approx-imately 600 m in the inner core, about the scale of theboundary-layer depth as defined by the layer of con-stant potential temperature. The radar observationshave suggested a boundary-layer scale of variability of3 to 6 km, several times the depth of the boundary layerbetween the outer bands. Gall et al.15 analyzed Nation-al Weather Service radar collected in hurricanes Hugo,Andrew, and Erin by correlating echoes from successivescans and found similar structures, although they spec-ulate that the features may extend 5 to 6 km up in theatmosphere, deeper than boundary-layer rolls. Thisappears to be a new and prominent scale of variabilityin the tropical cyclone boundary layer.
The significance of this discovery for the structureand dynamics of the rain bands and the regions betweenthem is not certain. However, the pervasiveness ofthese features in all of the storms, and particularly inthe most intense one, Mitch, indicates that SAR im-agery could contribute to research on the planetaryboundary layer in hurricanes, which is very difficult tomeasure by other means. The information in the SAR
NICAL DIGEST, VOLUME 21, NUMBER 1 (2000)
WIND FIELDS FROM SAR
images could be assimilated into mesoscale numericalmodels, together with the rain radar and flight data, toproduce a more complete description of a storm.
These results may also have profound implicationsfor estimates of momentum and sensible and latent heatfluxes to and from the sea, respectively, in tropicalcyclones, since roll vortices are known to enhancethese fluxes by 10 to 20%. We suggest that roll vortexfeatures be further documented by additional SAR datacollected in future tropical cyclones coincident withlow-level aircraft measurements of turbulence, verticalvelocity, and Doppler radar, together with airbornescatterometer observations of the surface winds andscanning radar altimeter observations of the surfacewaves.
REFERENCES1Vachon, P. W., and Olsen, R. B., “Radarsat: Which Mode Should I Use?”Backscatter 9, 14–20 (1998).
2Vachon, P. W., Katsaros, K., Black, P., and Dodge, P., “Radarsat SyntheticAperture Radar Measurements of Some 1998 Hurricanes,” in Proc. IEEE 1999Int. Geoscience and Remote Sensing Symp. (IGARSS ’99), Hamburg, Germany,pp. 1631–1633 (1999).
3Burpee, R. W., Franklin, J. L., Lord, S., Tuleya, R., and Aberson, S. D., “TheImpact of Omega Dropwindsondes on Operational Hurricane Track ForecastModels,” Bull. Am. Meteorol. Soc. 77, 925–933 (1996).
4Powell, M. D., Houston, S. H., Amat, L. R., and Morisseau-Leroy, N., “TheHRD Real-Time Hurricane Wind Analysis System,” J. Wind Eng. Indust.Dyn. 77/78, 53–64 (1998).
5Willoughby, H. E., Clos, J. A., and Shoreibah, M. G., “Concentric Eye Walls,Secondary Wind Maxima, and the Evolution of the Hurricane Vortex,” J.Atmos. Sci. 39, 395–411 (1982).
6Powell, M. D., “Boundary Layer Structure and Dynamics in Outer HurricaneRain Bands. Part I: Mesoscale Rainfall and Kinematic Structure,” Mon. Wea.Rev. 118, 891–917 (1990).
7Atlas, D., and Black, P. G., “The Evolution of Convective Storms from TheirFootprints on the Sea as Viewed by Synthetic Aperture Radar from Space,”Bull. Am. Meteorol. Soc. 75, 1183–1190 (1994).
8Thompson, T. W., Liu, W. T., and Weissman, D. E., “Synthetic ApertureRadar Observation of Ocean Roughness from Rolls in an Unstable MarineBoundary Layer,” Geophys. Res. Lett. 10, 1172–1175 (1983).
9Alpers, W., and Brümmer, B., “Atmospheric Boundary Layer Rolls Observedby the Synthetic Aperture Radar Aboard the ERS-1 Satellite,” J. Geophys.Res. 99, 12,613–12,621 (1994).
JOHNS HOPKINS APL TECHNICAL DIGEST, VOLUME 21, NUMBER 1 (
10Apel, J., “Observations of Oceanic Internal and Surface Waves for the EarthResources Technology Satellite,” J. Geophys. Res. 80, 865–881 (1975).
11Hasler, A. F., Palaniappan, K., Kambhammetu, C., Black, P., Uhlhorn, E.,and Chesters, D., “High-Resolution Wind Fields Within the Inner Core andEye of a Mature Tropical Cyclone from GOES 1-Min Images,” Bull. Am. Met.Soc. 79, 2483–2496 (1998).
12Brown, R. A., “Seven-Day Flow Model for the Planetary Boundary Layer,” J.Atmos. Sci. 27, 742–757 (1970).
13LeMone, M. A., “The Structure and Dynamics of Horizontal Roll Vortices inthe Planetary Boundary Layer,” J. Atmos. Sci. 20, 1077–1091 (1973).
14Wurman, J., and Winslow, J., “Intense Sub-Kilometer-Scale Boundary LayerRolls Observed in Hurricane Fran,” Science 280, 555–557 (1998).
15Gall, R., Tuttle, J., and Hildebrand, P., “Small-Scale Spiral Bands Observedin Hurricanes Andrew, Hugo, and Erin,” Mon. Wea. Rev. 126, 1749–1766(1998).
ACKNOWLEDGMENTS: Julie Cranton and John Wolfe (Canada Center forRemote Sensing) contributed to the acquisition and processing of the Radarsatdata; the WSR-88D radar data for hurricanes Bonnie and Georges were collectedby the Morehead City, North Carolina, and Key West, Florida, Weather ServiceForecast Offices and were supplied by the National Climatic Data Center inAsheville, North Carolina. Supporting information from the SSM/I and TRMMwas taken from the Web site of Jeffrey Hawkins and co-workers of the NavalResearch Laboratory at http://www.nrl.navy.mil/index.htm. We thank Robert Bealof APL and William Pichel and Pablo Clemente-Colón of NESDIS for helpfuldiscussions. We also thank Gail Derr for her able production of the manuscript.
THE AUTHORS
KRISTINA B. KATSAROS is with the Atlantic Oceano-graphic and Meteorological Laboratory, Miami, FL. Her e-mailaddress is [email protected].
PARIS W. VACHON is with the Canada Center forRemote Sensing, Ottawa, Ontario. His e-mail address [email protected].
PETER G. BLACK is with the Atlantic Oceanographic andMeteorological Laboratory, Miami, FL. His e-mail address [email protected].
PETER P. DODGE is with the Atlantic Oceanographic andMeteorological Laboratory, Miami, FL. His e-mail address [email protected].
ERIC W. UHLHORN is with the Atlantic Oceanographic andMeteorological Laboratory, Miami, FL. His e-mail address [email protected].
2000) 93


![SAR Wind Measurements for Wind Climatology: Application to …breeze.colorado.edu/ftp/RSWE/Frank_Monaldo.pdf · 2012. 6. 11. · Coastal and Marine Applications of SAR [19]. Figure](https://img.pdfslide.net/doc/110x75/61108e93d695b745a67f3bc5/sar-wind-measurements-for-wind-climatology-application-to-2012-6-11-coastal.jpg)