Embed Size (px)
Citation preview
InternationalConference on Fast Sea Transportation FAST’2005, June 2005, St.Petersburg, Russia
WIND HEELING MOMENTS ON MULTIHULL VESSELS Barry Deakin and Alexander M. Wright
Wolfson Unit MTIA University of Southampton, SO17 1BJ, UK
ABSTRACT
An experimental study has been conducted to evaluate the conventional method of estimating the upright and heeled wind heeling moment on multihull vessels. Static wind tunnel tests were conducted on various hull forms and geometric bodies, as well as dynamic gust tests on four multihulls. Revised formulae were derived, and have been submitted to the IMO for consideration during the revision of the HSC Code.
INTRODUCTION The UK Maritime and Coastguard Agency (MCA) commissioned the Wolfson Unit to conduct a study to evaluate the conventional method of estimating the wind heeling moments on multihull vessels. Previous experimental work by the Wolfson Unit indicated that for some craft, particularly those with a large plan area in relation to their profile area, the heeling moment coefficient might be somewhat greater than assumed in the Code. Wind tunnel tests had been conducted on models of a number of catamaran forms but only one on a passenger ferry representative of high speed craft. A search was conducted for other relevant experimental data. It was followed with wind tunnel tests on models of catamaran ferries in a number of configurations, and on rectangular blocks, upright and heeled. This resulted in the development of revised formulae for the estimation of wind heeling moments, and their variation with heel angle. An assumption inherent in the application of the 2000 HSC Code to multihulls is that the dynamic effects of gusts are negligible. To evaluate the validity of this, a gust test facility was constructed within a large wind tunnel, enabling models floating freely in a water tank to be subjected to controlled gusts. The study has resulted in submissions for consideration by the IMO, regarding possible revision of the HSC Code. The full report to the MCA is available from their web site: www.mcga.gov.uk
1. CURRENT HSC CODE The 2000 HSC Code incorporates the following formula:
9800ΔPAZHL1 =
Where: HL1 is the heeling lever (m) P is the wind pressure (N/m2)
A is the projected lateral, or profile, area above the waterline (m2) Z is the vertical distance from the centre of A to half the draught (m)
∆ is the displacement (tonnes) For intact vessels, the wind pressure is defined as: P = 500(Vw/26)2 where Vw is the wind speed (m/s) corresponding to the worst intended service conditions. A gust wind heeling lever (HL2) of 1.5 times HL1 is assumed. A reduced pressure is used in the assessment when damaged, the constant 500 being reduced to 120. This represents a reduction to half the wind speed. The heeling lever due to steady wind and gusting, HL2, should not induce a heeling angle of greater than 10° when the vessel is intact. Unlike the weather criterion used for monohulls, no explicit considerations of dynamic effects are applied. The wind heeling lever for the damaged case (HL3) should not induce an angle of heel more than 15°, including the angle of equilibrium due to damage. The only consideration of dynamic effects and reserve righting moment is when the vessel is rolling in waves, and the minimum residual area must be maintained. It is implied by the text of the Code that this GZ area criterion is intended to provide a margin against wave induced moments rather than to address the balance of heeling energy in the gust against the righting energy of the vessel. For the stability criteria, there are five basic assumptions inherent in the method: 1. The constants in these formulae imply a heeling
moment coefficient of 1.2.
2. The moment remains constant at all heel angles. 3. A gust is considered to contain 1.5 times more
energy than the steady wind. 4. When struck by a gust the response of the vessel
is as for a static equilibrium case. 5. A minimum area under the GZ curve is required
to prevent capsize in wind and waves 2. PUBLISHED DATA The data gathered as a result of the literature search represent a variety of ship types, and geometric blocks. Figure 1 shows the spread of proportions collated. Length and beam are the overall values. Height is the mean height above the waterline, derived from: Height = Profile Area/Length.
0 1 2 3 4 5 6 70
2
4
6
8
10
Published sh ip model dataPublished rectangular block dataShip model data from this studyRectangular block data from this studyTypica l range of multihull HSC
Beam/Mean Height Ratio
Leng
th/B
eam
Rat
io
Figure 1 Published data in terms of vessel proportion
Only one of the existing models represented a vessel with direct relevance to this study. This was a catamaran ferry that was selected for testing as part of a previous HSC stability research study conducted for the Department of Transport by Vosper Thorneycroft in 1988. [Refs 1 and 2] The tests were conducted, for two superstructure configurations, by the Wolfson Unit. Two other catamaran forms were tested by the Wolfson Unit, a sidewall hovercraft [Ref 3], and a sailing catamaran [Ref 4]. The latter was tested in a number of configurations without the rig, but the L/B ratio is significantly lower than that typical of HSC. The work on sailing catamarans resulted in development of a revised formula for estimating their heeling moments, using the plan area of the hulls and deck, combined with the profile area of the rig.
Heeling moment data were found for a number of conventional ferries and other vessels of similar proportions [Refs 1, 6 and 7]. In terms of the proportions of the above-water part of the hull and the superstructure they do not differ significantly from typical high speed monohull ferries. Data were found for other vessel types, ranging from LPG carriers to fishing vessels, but were not considered appropriate for inclusion in this study. Blendermann [Ref 1] conducted tests on blocks of constant cross section with varying length, and of constant plan with varying height. 2.1. Other Aerodynamic Data Richards et al [Ref. 8], present pressures measured on the faces of a cube resting on the ground. With the wind normal to one face, the pressure on the windward face is positive, peaking near the top of the face. At the sharp corner there is a change of pressure with a negative pressure, or suction, over the upper face, peaking near the leading edge. Over the leeward face is a, roughly uniform, small negative pressure. It is apparent that the heeling moment is generated by a combination of the pressure difference between the windward and leeward faces, and the lift due to the negative pressure on the upper face. Because the peak suction on the upper face is near the leading edge, the resultant force will be further from the centreline on a wider block. With wind at an angle to the face, the peak suction on the upper face is increased. 3. STATIC HEELING MOMENT TESTS 3.1. Test Technique
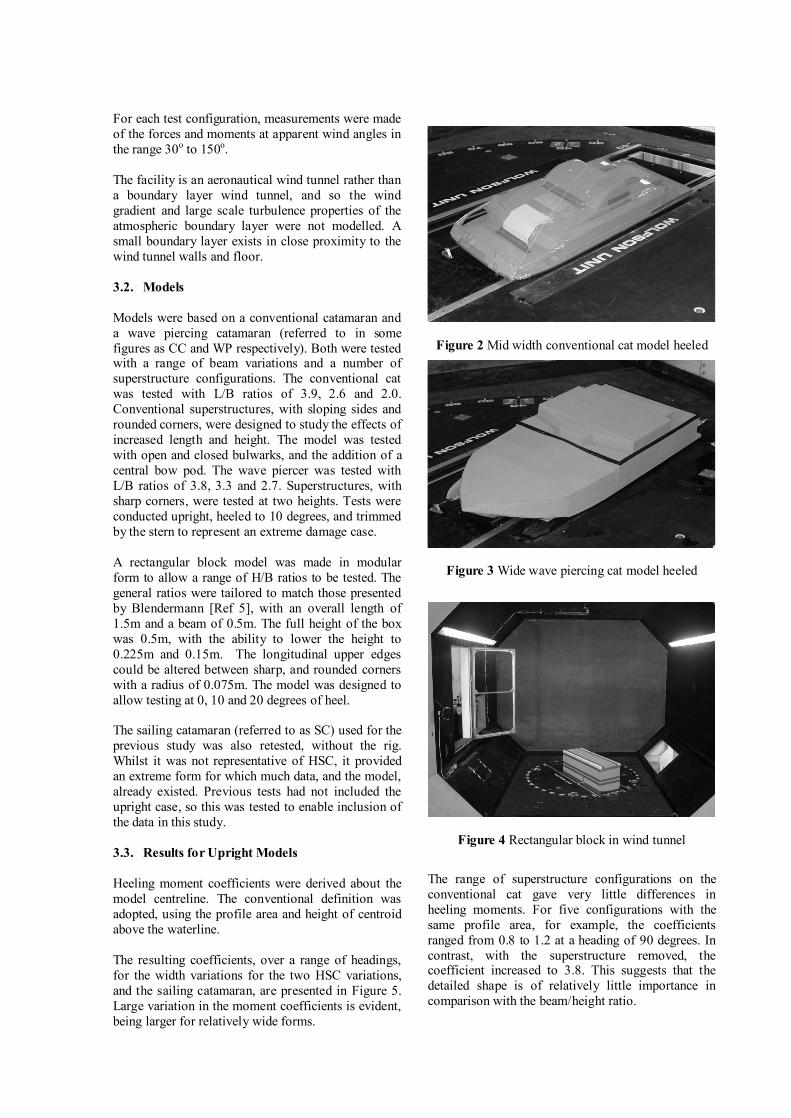
Tests were conducted at the University of Southampton in the low speed section of the No.1 Wind Tunnel, which has dimensions 4.6 metres wide by 3.7 metres high. The model was mounted on a six component dynamometer located beneath a turntable. The model was suspended from the dynamometer in a tank of water, fitted into the turntable, which provided a seal between the model and the turntable and permitted the measurement of the model forces independent of the turntable. The test system was designed for monohull vessels and the relatively wide beam of the catamarans precluded the possibility of both hulls fitting within the water tank. The starboard hull of the model was connected to the dynamometer using a horizontal rod on the hull centreline at the bow, and a transverse bar near the stern. The full depth of the hull was modelled and immersed to the required waterline in the water tank. The port hull was cut off just above the waterline so that it was held over the solid part of the turntable with a small air gap.
For each test configuration, measurements were made of the forces and moments at apparent wind angles in the range 30o to 150o. The facility is an aeronautical wind tunnel rather than a boundary layer wind tunnel, and so the wind gradient and large scale turbulence properties of the atmospheric boundary layer were not modelled. A small boundary layer exists in close proximity to the wind tunnel walls and floor. 3.2. Models Models were based on a conventional catamaran and a wave piercing catamaran (referred to in some figures as CC and WP respectively). Both were tested with a range of beam variations and a number of superstructure configurations. The conventional cat was tested with L/B ratios of 3.9, 2.6 and 2.0. Conventional superstructures, with sloping sides and rounded corners, were designed to study the effects of increased length and height. The model was tested with open and closed bulwarks, and the addition of a central bow pod. The wave piercer was tested with L/B ratios of 3.8, 3.3 and 2.7. Superstructures, with sharp corners, were tested at two heights. Tests were conducted upright, heeled to 10 degrees, and trimmed by the stern to represent an extreme damage case. A rectangular block model was made in modular form to allow a range of H/B ratios to be tested. The general ratios were tailored to match those presented by Blendermann [Ref 5], with an overall length of 1.5m and a beam of 0.5m. The full height of the box was 0.5m, with the ability to lower the height to 0.225m and 0.15m. The longitudinal upper edges could be altered between sharp, and rounded corners with a radius of 0.075m. The model was designed to allow testing at 0, 10 and 20 degrees of heel. The sailing catamaran (referred to as SC) used for the previous study was also retested, without the rig. Whilst it was not representative of HSC, it provided an extreme form for which much data, and the model, already existed. Previous tests had not included the upright case, so this was tested to enable inclusion of the data in this study. 3.3. Results for Upright Models
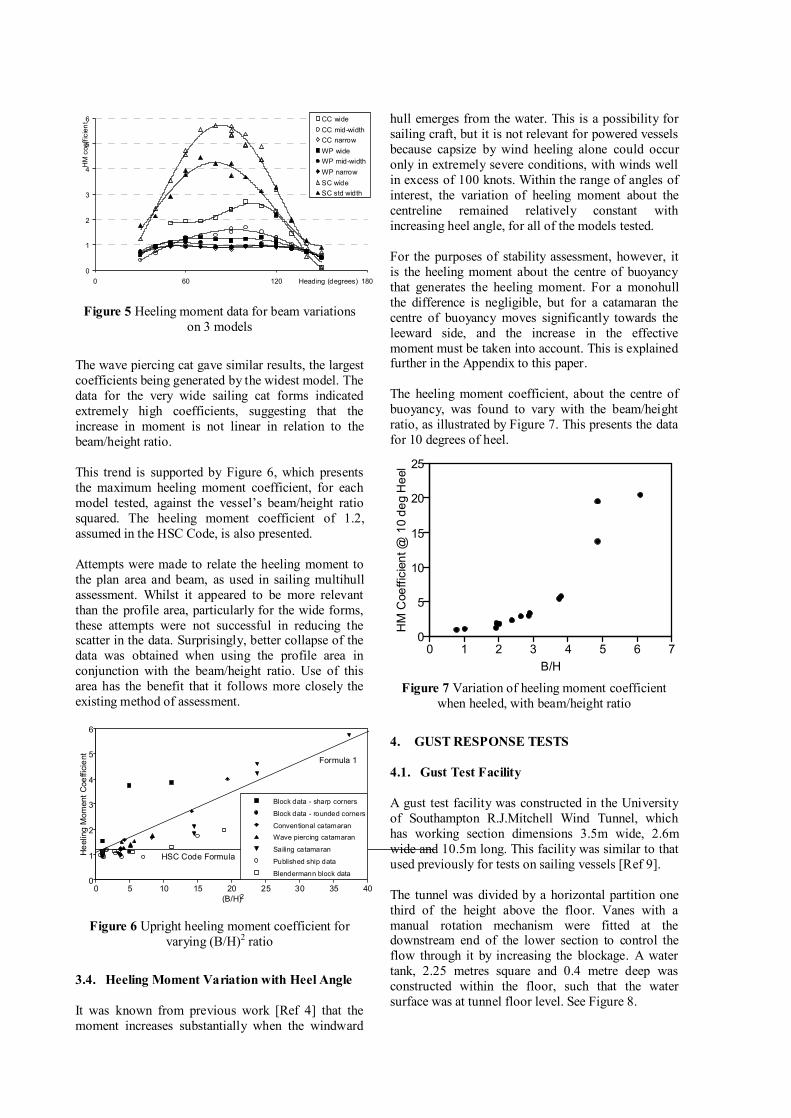
Heeling moment coefficients were derived about the model centreline. The conventional definition was adopted, using the profile area and height of centroid above the waterline. The resulting coefficients, over a range of headings, for the width variations for the two HSC variations, and the sailing catamaran, are presented in Figure 5. Large variation in the moment coefficients is evident, being larger for relatively wide forms.
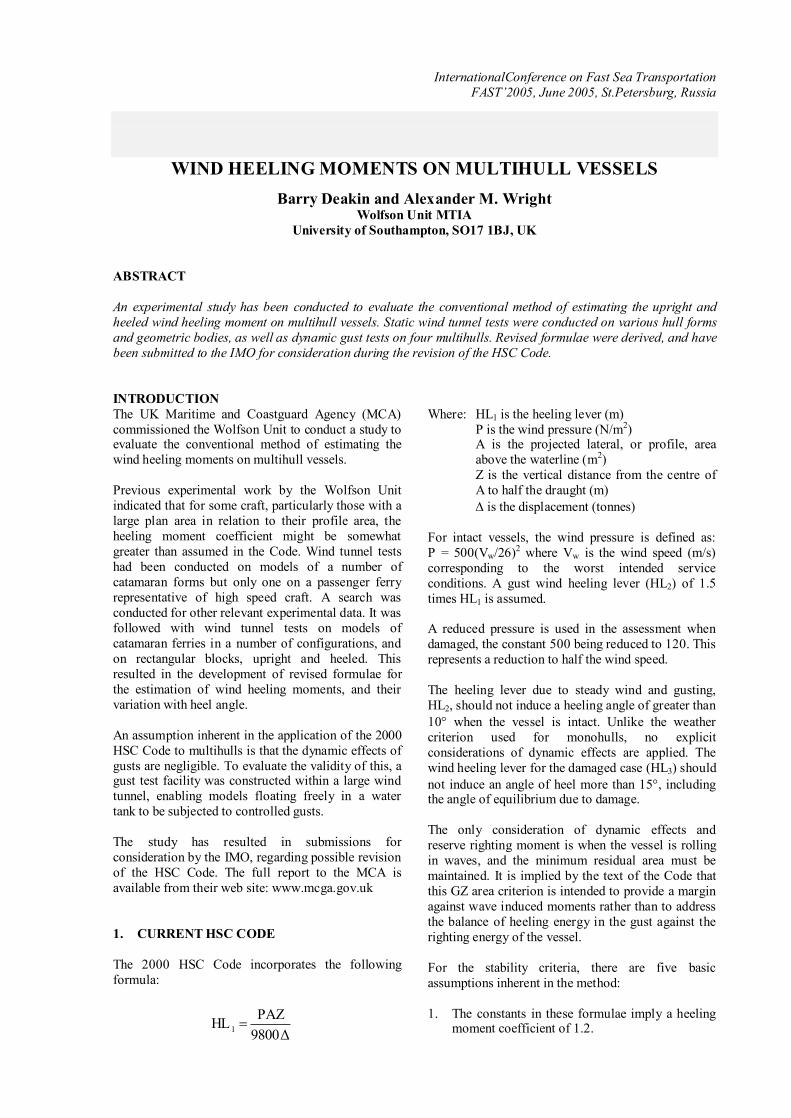
Figure 2 Mid width conventional cat model heeled
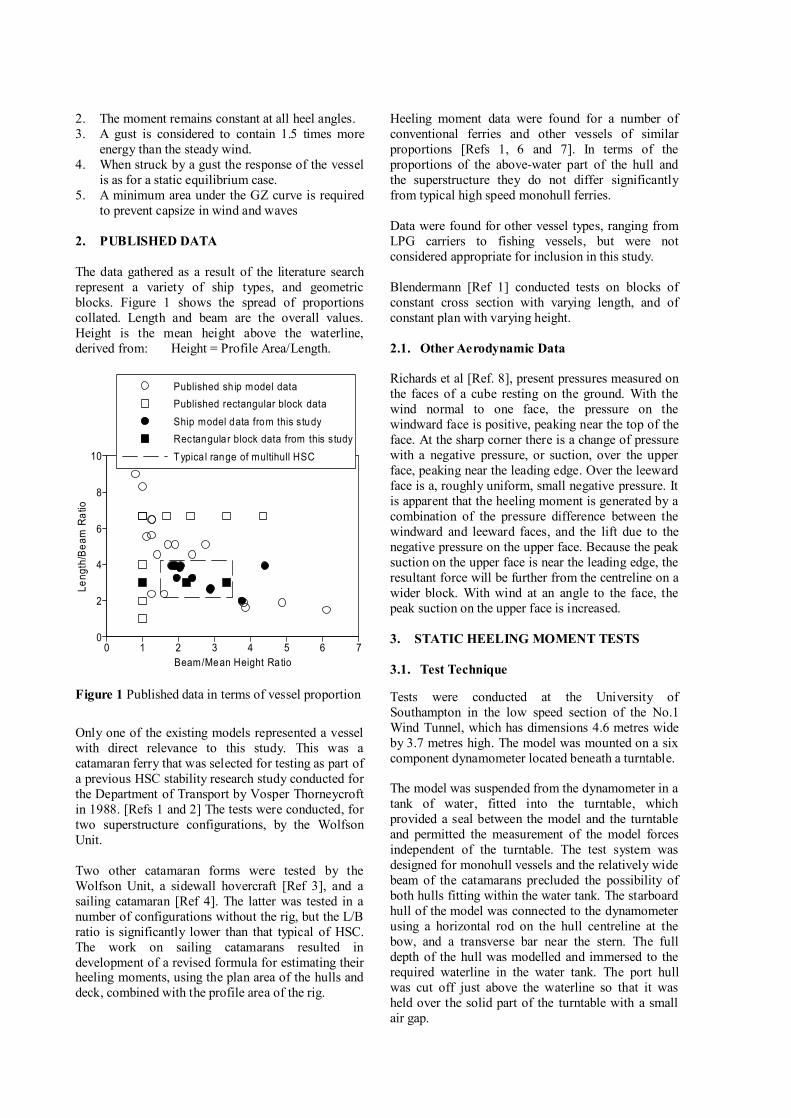
Figure 3 Wide wave piercing cat model heeled
Figure 4 Rectangular block in wind tunnel
The range of superstructure configurations on the conventional cat gave very little differences in heeling moments. For five configurations with the same profile area, for example, the coefficients ranged from 0.8 to 1.2 at a heading of 90 degrees. In contrast, with the superstructure removed, the coefficient increased to 3.8. This suggests that the detailed shape is of relatively little importance in comparison with the beam/height ratio.
0
1
2
3
4
5
6
0 60 120 180Heading (degrees)
HM
coe
ffici
ent CC wide
CC mid-widthCC narrowWP wideWP mid-widthWP narrowSC wideSC std width
Figure 5 Heeling moment data for beam variations on 3 models
The wave piercing cat gave similar results, the largest coefficients being generated by the widest model. The data for the very wide sailing cat forms indicated extremely high coefficients, suggesting that the increase in moment is not linear in relation to the beam/height ratio. This trend is supported by Figure 6, which presents the maximum heeling moment coefficient, for each model tested, against the vessel’s beam/height ratio squared. The heeling moment coefficient of 1.2, assumed in the HSC Code, is also presented. Attempts were made to relate the heeling moment to the plan area and beam, as used in sailing multihull assessment. Whilst it appeared to be more relevant than the profile area, particularly for the wide forms, these attempts were not successful in reducing the scatter in the data. Surprisingly, better collapse of the data was obtained when using the profile area in conjunction with the beam/height ratio. Use of this area has the benefit that it follows more closely the existing method of assessment.
0 5 10 15 20 25 30 35 400
1
2
3
4
5
6
Block data - sharp corners
Block data - rounded corners
Conventional catamaranWave piercing catamaran
Sailing catamaran
Published ship data
Blendermann block data
2
Formula 1
HSC Code Formula
(B/H)
Hee
ling
Mom
ent C
oeffi
cien
t
Figure 6 Upright heeling moment coefficient for varying (B/H)2 ratio
3.4. Heeling Moment Variation with Heel Angle It was known from previous work [Ref 4] that the moment increases substantially when the windward
hull emerges from the water. This is a possibility for sailing craft, but it is not relevant for powered vessels because capsize by wind heeling alone could occur only in extremely severe conditions, with winds well in excess of 100 knots. Within the range of angles of interest, the variation of heeling moment about the centreline remained relatively constant with increasing heel angle, for all of the models tested. For the purposes of stability assessment, however, it is the heeling moment about the centre of buoyancy that generates the heeling moment. For a monohull the difference is negligible, but for a catamaran the centre of buoyancy moves significantly towards the leeward side, and the increase in the effective moment must be taken into account. This is explained further in the Appendix to this paper. The heeling moment coefficient, about the centre of buoyancy, was found to vary with the beam/height ratio, as illustrated by Figure 7. This presents the data for 10 degrees of heel.
0 1 2 3 4 5 6 70
5
10
15
20
25
B/H
HM
Coe
ffici
ent @
10
deg
Hee
l
Figure 7 Variation of heeling moment coefficient
when heeled, with beam/height ratio
4. GUST RESPONSE TESTS 4.1. Gust Test Facility A gust test facility was constructed in the University of Southampton R.J.Mitchell Wind Tunnel, which has working section dimensions 3.5m wide, 2.6m wide and 10.5m long. This facility was similar to that used previously for tests on sailing vessels [Ref 9]. The tunnel was divided by a horizontal partition one third of the height above the floor. Vanes with a manual rotation mechanism were fitted at the downstream end of the lower section to control the flow through it by increasing the blockage. A water tank, 2.25 metres square and 0.4 metre deep was constructed within the floor, such that the water surface was at tunnel floor level. See Figure 8.

Because these tests involved the dynamic response of floating models, Froude scaling was used throughout, with models ballasted to a known displacement and centre of gravity. The wind speed was measured over the water tank, and the model was fitted with a roll gyro to record heel angle. A video record was made of the tests, using cameras upwind and to one side of the tank. The model was initially moored by a bridle system until the wind speed was constant, after which the bridle was released and the model was able to move in all six degrees of freedom. By moving the attachment point of the bridle vertically on the model, the model could be induced to have an initial heel to windward if desired. In some cases the models tended to move ahead or astern in the wind, and needed to be restrained. Wires were fixed longitudinally at water level in the tank, just aft of the stern and forward of the bow of the model, with the model tethered to a small ring that was free to travel along each wire. This restricted fore and aft movement without restraint in sway or roll. Nominal wind speeds of 12m/s and 15m/s were used. At full scale these speeds represented severe conditions, in the region of 54m/s (105 knots) and above, but were used in order to obtain heel angles that could be measured with sufficient accuracy. 4.2. Models The conventional cat used for the static tests was remodelled at 1:20 scale. The superstructure was built with an extra ‘block’ to enable increase of the profile area. No appendages were fitted. A photograph of the model with the basic superstructure is presented in Figure 8. The wave piercing cat was remodelled at 1:40 scale. Again, an extra deck of superstructure was built, to investigate the influence of altering the H/B ratio. No appendages were fitted. 4.3. Results In total, 100 tests were conducted with varying models, wind speed, gust factor and duration. Figure 9 presents a typical time history of the wind pressure and the heel angle. If there is a dynamic response to a gust, the roll time history will be characterised by a period when it is at the equilibrium heel angle in the initial wind prior to the gust, then a peak at the maximum roll angle, followed by a period in which the model settles at the equilibrium heel angle in the gust wind speed. In practice the constraints of tank size limited these periods, and the roll motion affected interpretation of
the equilibrium angles, as illustrated by the example shown in Figure 9. Figure 10 shows the ratio of the maximum angle to the equilibrium angle of heel, against the equilibrium angle, from the most reliable tests. The ratio approaches 1.0 at large angles, indicating that there is little or no dynamic response. This indicates a high level of damping, because the righting energy required to oppose that imparted by the gust is substantially less than the gust energy. A non-damped system would require a 100% energy balance and result in a large ratio. For very small angles the ratio is between 1 and 2, suggesting that damping is less, as might be expected when roll velocities are small.
Figure 8 Conventional catamaran during gust test
Figure 9 Time history of gust test for the conventional catamaran with extra superstructure
0 5 10 15 20 250.0
0.5
1.0
1.5
2.0
Vessel initally heeled to windward
Steady heel angle
Peak
ang
le/ S
tead
y an
gle
Figure 10 Ratio of maximum angle to steady heel
angle against steady heel angle for gust tests
0 1 2 3 4 5 6 7 8 9 100
4
8
12
16
20
0 5 10 15 20 25 30 35 40 45
0
80
160
240
320
400pressure
heel
Ves
sel r
elea
sed
from
brid
le
Ves
sel h
it do
wnw
ind
side
of t
ank
Time (s)
Hee
l ang
le(d
egre
es) a
nd w
ind
pres
sure
(mm
of w
ater
)
Full scale time (s)F
ull s
cale
win
d pr
essu
re (m
m o
f wat
er)
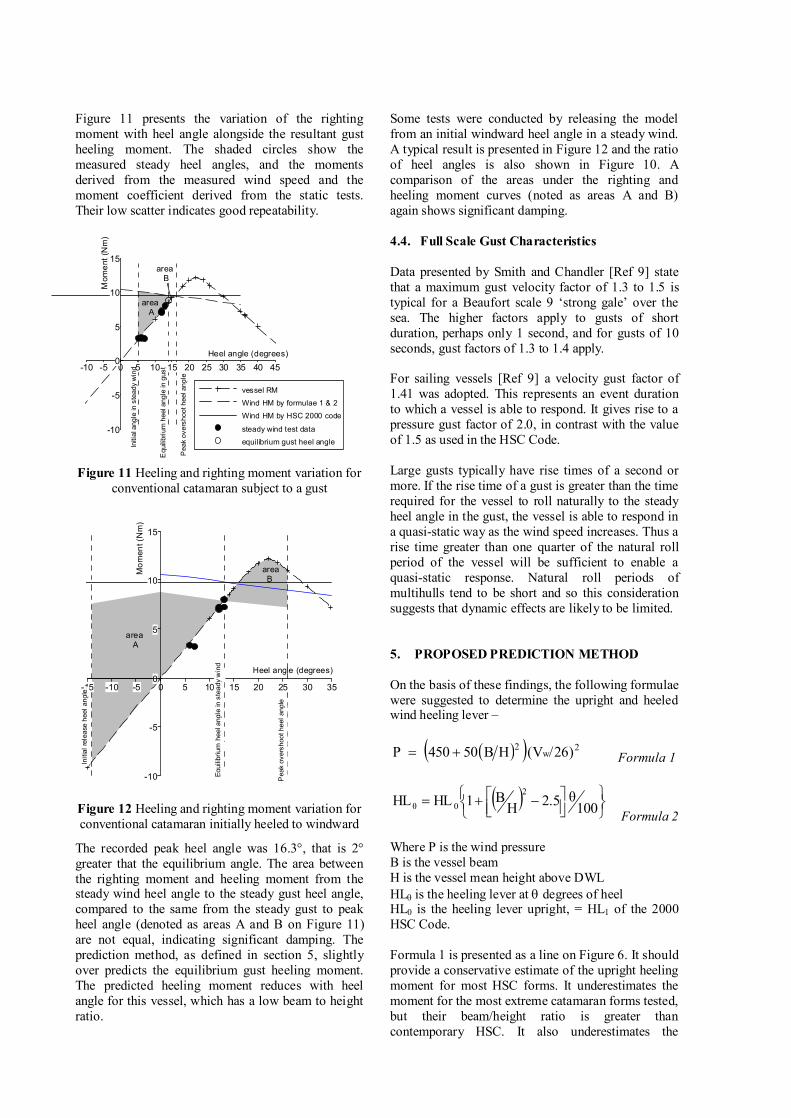
Figure 11 presents the variation of the righting moment with heel angle alongside the resultant gust heeling moment. The shaded circles show the measured steady heel angles, and the moments derived from the measured wind speed and the moment coefficient derived from the static tests. Their low scatter indicates good repeatability.
-10 -5 0 5 10 15 20 25 30 35 40 45
-10
-5
0
5
10
15
vessel RM
Wind HM by formulae 1 & 2
Wind HM by HSC 2000 code
steady wind test data
equilibrium gust heel angle
Pea
k ov
ersh
oot h
eel a
ngle
Equ
ilibriu
m h
eel a
ngle
in g
ust
Initi
al a
ngle
in s
tead
y w
ind
area A
area B
Heel angle (degrees)
Mom
ent (
Nm
)
Figure 11 Heeling and righting moment variation for
conventional catamaran subject to a gust
-15 -10 -5 0 5 10 15 20 25 30 35
-10
-5
0
5
10
15
Pea
k ov
ersh
oot h
eel a
ngle
Initi
al re
leas
e he
el a
ngle
Equi
libriu
m h
eel a
ngle
in s
tead
y w
ind
area A
area B
Heel angle (degrees)
Mom
ent (
Nm
)
Figure 12 Heeling and righting moment variation for conventional catamaran initially heeled to windward
The recorded peak heel angle was 16.3°, that is 2° greater that the equilibrium angle. The area between the righting moment and heeling moment from the steady wind heel angle to the steady gust heel angle, compared to the same from the steady gust to peak heel angle (denoted as areas A and B on Figure 11) are not equal, indicating significant damping. The prediction method, as defined in section 5, slightly over predicts the equilibrium gust heeling moment. The predicted heeling moment reduces with heel angle for this vessel, which has a low beam to height ratio.
Some tests were conducted by releasing the model from an initial windward heel angle in a steady wind. A typical result is presented in Figure 12 and the ratio of heel angles is also shown in Figure 10. A comparison of the areas under the righting and heeling moment curves (noted as areas A and B) again shows significant damping. 4.4. Full Scale Gust Characteristics Data presented by Smith and Chandler [Ref 9] state that a maximum gust velocity factor of 1.3 to 1.5 is typical for a Beaufort scale 9 ‘strong gale’ over the sea. The higher factors apply to gusts of short duration, perhaps only 1 second, and for gusts of 10 seconds, gust factors of 1.3 to 1.4 apply. For sailing vessels [Ref 9] a velocity gust factor of 1.41 was adopted. This represents an event duration to which a vessel is able to respond. It gives rise to a pressure gust factor of 2.0, in contrast with the value of 1.5 as used in the HSC Code. Large gusts typically have rise times of a second or more. If the rise time of a gust is greater than the time required for the vessel to roll naturally to the steady heel angle in the gust, the vessel is able to respond in a quasi-static way as the wind speed increases. Thus a rise time greater than one quarter of the natural roll period of the vessel will be sufficient to enable a quasi-static response. Natural roll periods of multihulls tend to be short and so this consideration suggests that dynamic effects are likely to be limited. 5. PROPOSED PREDICTION METHOD On the basis of these findings, the following formulae were suggested to determine the upright and heeled wind heeling lever –
( )( ) 2w
2 )26/(VHB50450 P += Formula 1
( )
−+= 100
θ2.5HB1HLHL
2
0θ Formula 2
Where P is the wind pressure B is the vessel beam H is the vessel mean height above DWL HLθ is the heeling lever at θ degrees of heel HL0 is the heeling lever upright, = HL1 of the 2000 HSC Code. Formula 1 is presented as a line on Figure 6. It should provide a conservative estimate of the upright heeling moment for most HSC forms. It underestimates the moment for the most extreme catamaran forms tested, but their beam/height ratio is greater than contemporary HSC. It also underestimates the
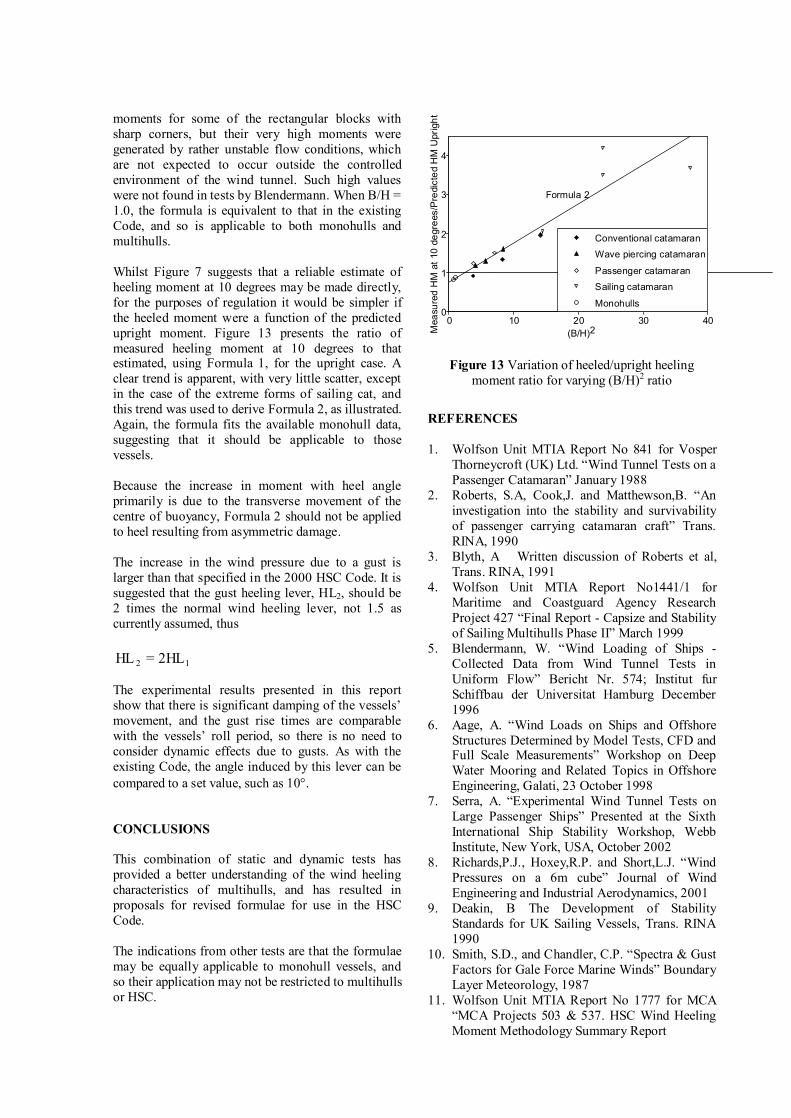
moments for some of the rectangular blocks with sharp corners, but their very high moments were generated by rather unstable flow conditions, which are not expected to occur outside the controlled environment of the wind tunnel. Such high values were not found in tests by Blendermann. When B/H = 1.0, the formula is equivalent to that in the existing Code, and so is applicable to both monohulls and multihulls. Whilst Figure 7 suggests that a reliable estimate of heeling moment at 10 degrees may be made directly, for the purposes of regulation it would be simpler if the heeled moment were a function of the predicted upright moment. Figure 13 presents the ratio of measured heeling moment at 10 degrees to that estimated, using Formula 1, for the upright case. A clear trend is apparent, with very little scatter, except in the case of the extreme forms of sailing cat, and this trend was used to derive Formula 2, as illustrated. Again, the formula fits the available monohull data, suggesting that it should be applicable to those vessels. Because the increase in moment with heel angle primarily is due to the transverse movement of the centre of buoyancy, Formula 2 should not be applied to heel resulting from asymmetric damage. The increase in the wind pressure due to a gust is larger than that specified in the 2000 HSC Code. It is suggested that the gust heeling lever, HL2, should be 2 times the normal wind heeling lever, not 1.5 as currently assumed, thus
12 HL2=HL The experimental results presented in this report show that there is significant damping of the vessels’ movement, and the gust rise times are comparable with the vessels’ roll period, so there is no need to consider dynamic effects due to gusts. As with the existing Code, the angle induced by this lever can be compared to a set value, such as 10°. CONCLUSIONS This combination of static and dynamic tests has provided a better understanding of the wind heeling characteristics of multihulls, and has resulted in proposals for revised formulae for use in the HSC Code. The indications from other tests are that the formulae may be equally applicable to monohull vessels, and so their application may not be restricted to multihulls or HSC.
0 10 20 30 400
1
2
3
4
Conventional catamaran
Wave piercing catamaran
Passenger catamaran
Sailing catamaran
Monohulls
2
Formula 2
(B/H)Mea
sure
d H
M a
t 10
degr
ees/
Pre
dict
ed H
M U
prig
ht
Figure 13 Variation of heeled/upright heeling moment ratio for varying (B/H)2 ratio
REFERENCES 1. Wolfson Unit MTIA Report No 841 for Vosper
Thorneycroft (UK) Ltd. “Wind Tunnel Tests on a Passenger Catamaran” January 1988
2. Roberts, S.A, Cook,J. and Matthewson,B. “An investigation into the stability and survivability of passenger carrying catamaran craft” Trans. RINA, 1990
3. Blyth, A Written discussion of Roberts et al, Trans. RINA, 1991
4. Wolfson Unit MTIA Report No1441/1 for Maritime and Coastguard Agency Research Project 427 “Final Report - Capsize and Stability of Sailing Multihulls Phase II” March 1999
5. Blendermann, W. “Wind Loading of Ships - Collected Data from Wind Tunnel Tests in Uniform Flow” Bericht Nr. 574; Institut fur Schiffbau der Universitat Hamburg December 1996
6. Aage, A. “Wind Loads on Ships and Offshore Structures Determined by Model Tests, CFD and Full Scale Measurements” Workshop on Deep Water Mooring and Related Topics in Offshore Engineering, Galati, 23 October 1998
7. Serra, A. “Experimental Wind Tunnel Tests on Large Passenger Ships” Presented at the Sixth International Ship Stability Workshop, Webb Institute, New York, USA, October 2002
8. Richards,P.J., Hoxey,R.P. and Short,L.J. “Wind Pressures on a 6m cube” Journal of Wind Engineering and Industrial Aerodynamics, 2001
9. Deakin, B The Development of Stability Standards for UK Sailing Vessels, Trans. RINA 1990
10. Smith, S.D., and Chandler, C.P. “Spectra & Gust Factors for Gale Force Marine Winds” Boundary Layer Meteorology, 1987
11. Wolfson Unit MTIA Report No 1777 for MCA “MCA Projects 503 & 537. HSC Wind Heeling Moment Methodology Summary Report
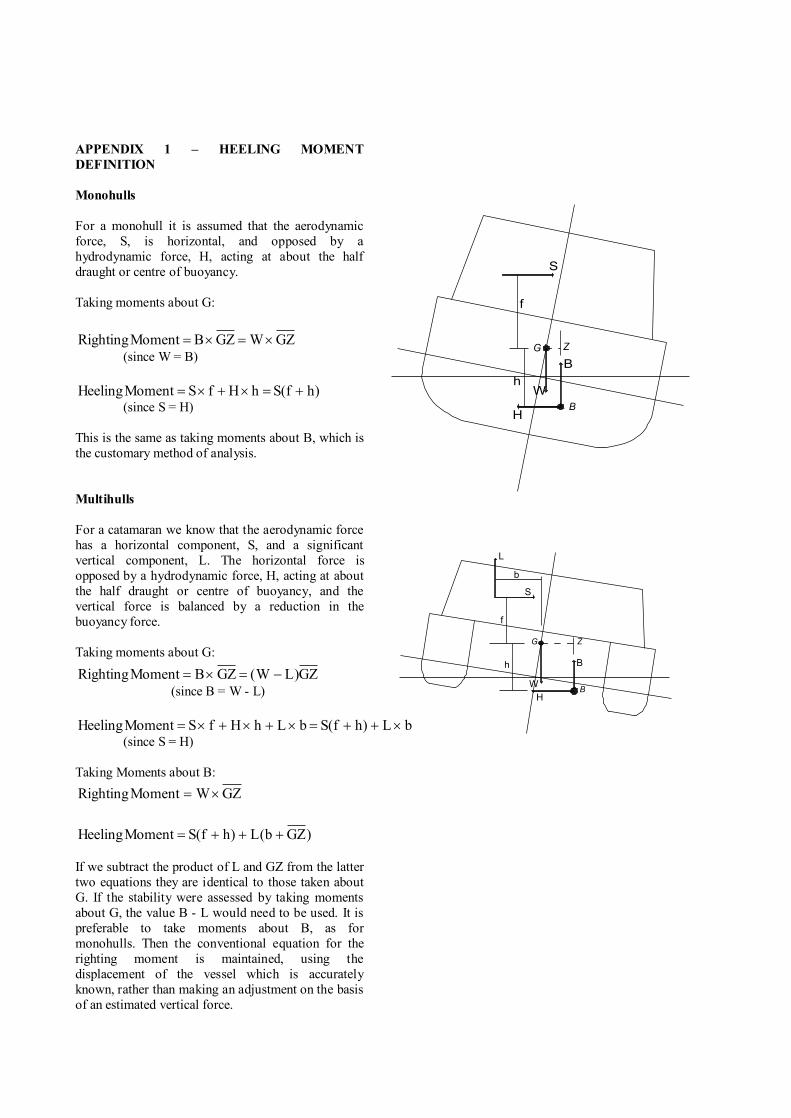
APPENDIX 1 – HEELING MOMENT DEFINITION Monohulls For a monohull it is assumed that the aerodynamic force, S, is horizontal, and opposed by a hydrodynamic force, H, acting at about the half draught or centre of buoyancy. Taking moments about G:
GZWGZBMomentRighting ×=×= (since W = B)
)hf(ShHfSMomentHeeling +=×+×= (since S = H) This is the same as taking moments about B, which is the customary method of analysis. Multihulls For a catamaran we know that the aerodynamic force has a horizontal component, S, and a significant vertical component, L. The horizontal force is opposed by a hydrodynamic force, H, acting at about the half draught or centre of buoyancy, and the vertical force is balanced by a reduction in the buoyancy force. Taking moments about G:
GZ)LW(GZBMomentRighting −=×= (since B = W - L)
bL)hf(SbLhHfSMomentHeeling ×++=×+×+×= (since S = H) Taking Moments about B:
)GZb(L)hf(SMomentHeeling +++= If we subtract the product of L and GZ from the latter two equations they are identical to those taken about G. If the stability were assessed by taking moments about G, the value B - L would need to be used. It is preferable to take moments about B, as for monohulls. Then the conventional equation for the righting moment is maintained, using the displacement of the vessel which is accurately known, rather than making an adjustment on the basis of an estimated vertical force.
B
G
H
Z
hB
W
S
f
B
G
H
Z
h B
W
S
f
L
b
GZWMomentRighting ×=