Embed Size (px)
Citation preview
Wind Integration and Grid Reliability Impacts
Charlton I. Clark Technology Manager, Renewable Systems Interconnection
Wind and Water Power Program Office of Energy Efficiency and Renewable Energy U. S. Department of Energy
NERC RICCI Task Force-July 17, 2009
Outline
• Overview of wind integration studies– Past studies– Western Wind and Solar Integration Study
(WWSIS)– Eastern Wind Integration and Transmission
Study (EWITS)• Initial reliability results

Past/Ongoing Utility Integration Studies
•Multiple integration studies conducted for various utilities•Previous studies evaluated a single utility control area•Primary focus related to integration costs to the host utility

Current Large Scale Integration Studies
• Integration study footprints expanding– WWSIS =>
WestConnect Footprint
– EWITS => Eastern Interconnection (except FRCC)

WWSIS Overview
• Goal – To understand the costs and operating
impacts due to the variability and uncertainty of wind, PV and concentrating solar power (CSP) on the WestConnect grid
– Not the cost of wind or solar generation• Scope of study
– Operations, not transmission study– Study year – 2017 to line up with
WECC studies– Simulate load and climate of 2004,
2005, 2006 forecast to 2017
5

WWSIS Scenario Overview
• Baseline – no new renewables• In-Area – each transmission area meets its target from sources
within that area– 30% wind, 5% solar in footprint (20% wind, 3% solar in the rest of WECC)– 20% wind, 3% solar (10% wind, 1% solar rest of WECC)– 10% wind, 1% solar (10% wind, 1% solar rest of WECC)
• Mega Project – concentrated projects in best resource areas• Local Priority – Balance of best resource and in-area sites• Plus other scenarios yet to be determined (high solar, high
capacity value, high geographic diversity)Solar is 70% CSP and 30% distributed PV. CSP has 6 hours of thermal storage. Penetrations
are by energy.
6
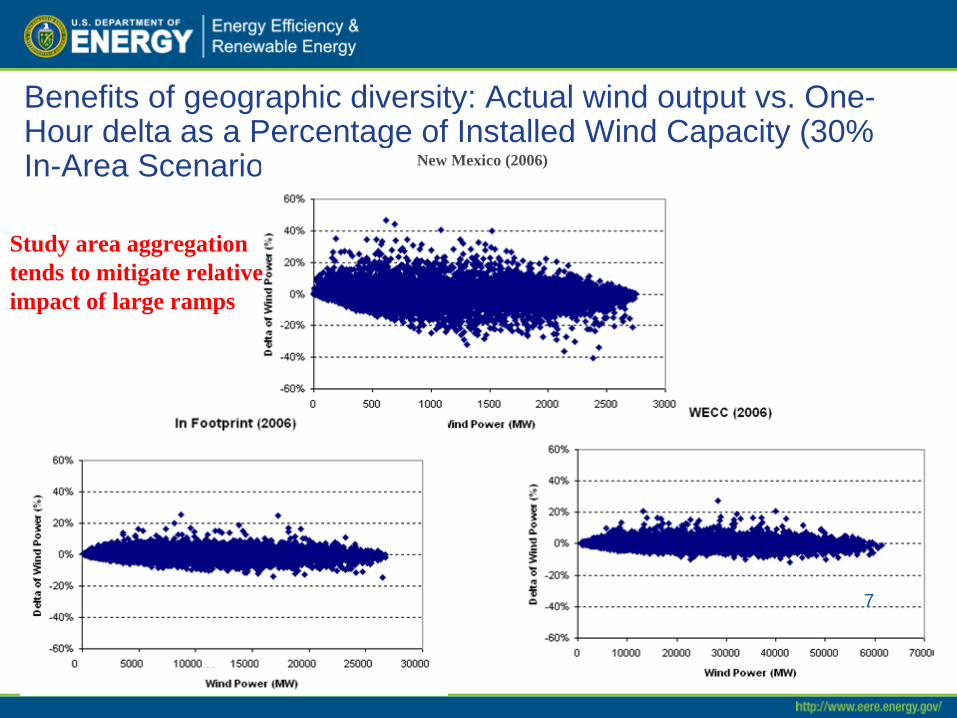
Benefits of geographic diversity: Actual wind output vs. One- Hour delta as a Percentage of Installed Wind Capacity (30% In-Area Scenario) New Mexico (2006)
Study area aggregation tends to mitigate relative impact of large ramps
7
-8000
-6000
-4000
-2000
0
2000
4000
6000
8000
-5000 -4000 -3000 -2000 -1000 0 1000 2000 3000 4000 5000
Load Delta (MW)
Win
d De
lta (M
W) (
30%
Sce
nario
)
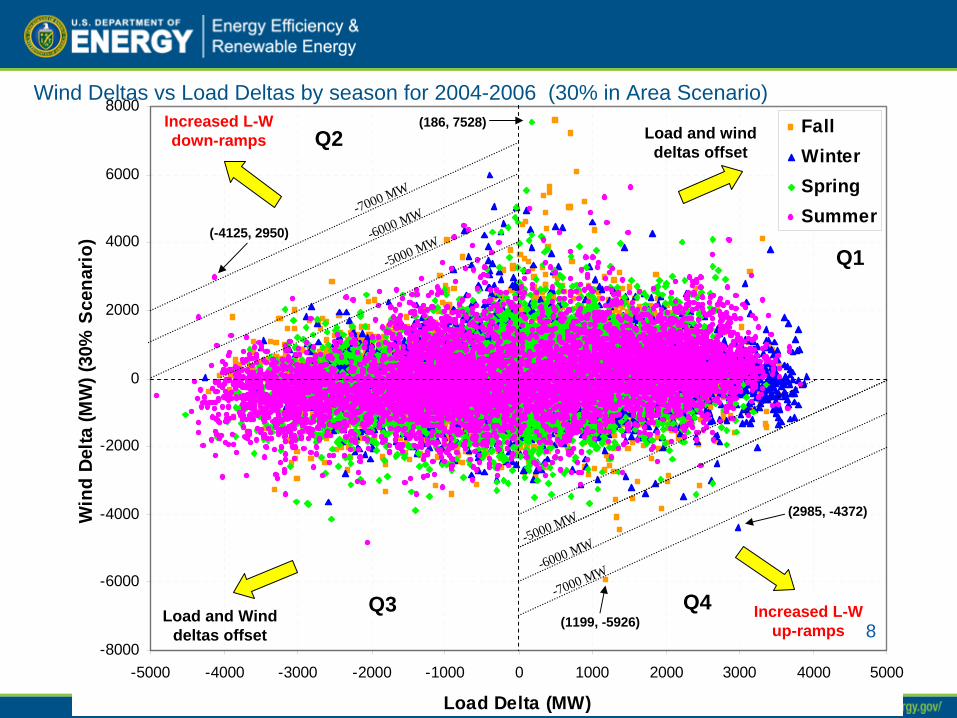
FallWinterSpringSummer
Wind Deltas vs Load Deltas by season for 2004-2006 (30% in Area Scenario)
(1199, -5926)
(-4125, 2950)
Increased L-W up-ramps
Increased L-W down-ramps Load and wind
deltas offset
Load and Wind deltas offset
Q1
Q2
Q4Q3
(2985, -4372)
-7000 MW
-6000 MW
-5000 MW
-5000 MW
-6000 MW
-7000 MW
(186, 7528)
8

Summary Statistics (hourly variability)
9

Summary Stats - ten-minute variability
10

Study Area Total Load, Wind and Solar Variation Over Month of April (30% in Area Scenario)
Substantial increase in net load variability driven largely by wind variation
-5000
0
5000
10000
15000
20000
25000
30000
35000
1-Apr 8-Apr 15-Apr 22-Apr 29-Apr
Day
MW
Ld(Base)
Wd(30%)
PV(30%)
CSP(30%)
L-W-S(30%)
Minimum net load: –2887 MWInstantaneous penetration: 112%
11
Study Area Total Load, Wind and Solar Variation Over Month of April (30% in Area Scenario)
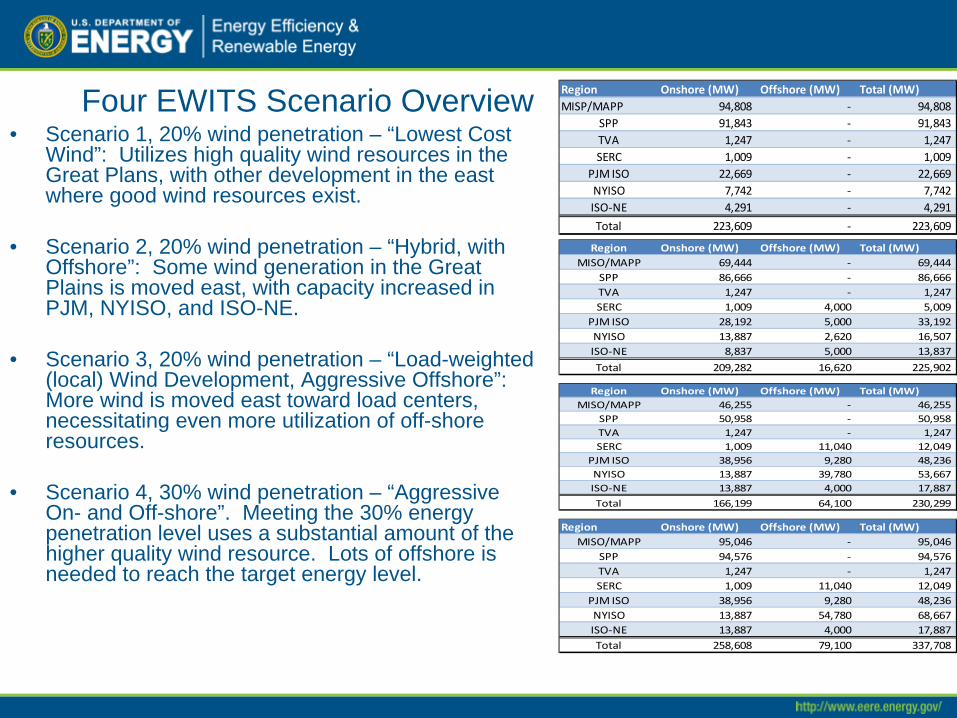
Four EWITS Scenario Overview• Scenario 1, 20% wind penetration – “Lowest Cost
Wind”: Utilizes high quality wind resources in the Great Plans, with other development in the east where good wind resources exist.
• Scenario 2, 20% wind penetration – “Hybrid, with Offshore”: Some wind generation in the Great Plains is moved east, with capacity increased in PJM, NYISO, and ISO-NE.
• Scenario 3, 20% wind penetration – “Load-weighted (local) Wind Development, Aggressive Offshore”: More wind is moved east toward load centers, necessitating even more utilization of off-shore resources.
• Scenario 4, 30% wind penetration – “Aggressive On- and Off-shore”. Meeting the 30% energy penetration level uses a substantial amount of the higher quality wind resource. Lots of offshore is needed to reach the target energy level.
Region Onshore (MW) Offshore (MW) Total (MW)MISP/MAPP 94,808 ‐ 94,808
SPP 91,843 ‐ 91,843 TVA 1,247 ‐ 1,247 SERC 1,009 ‐ 1,009
PJM ISO 22,669 ‐ 22,669 NYISO 7,742 ‐ 7,742 ISO‐NE 4,291 ‐ 4,291
Total 223,609 ‐ 223,609
Region Onshore (MW) Offshore (MW) Total (MW)MISO/MAPP 69,444 ‐ 69,444
SPP 86,666 ‐ 86,666 TVA 1,247 ‐ 1,247 SERC 1,009 4,000 5,009
PJM ISO 28,192 5,000 33,192 NYISO 13,887 2,620 16,507 ISO‐NE 8,837 5,000 13,837
Total 209,282 16,620 225,902
Region Onshore (MW) Offshore (MW) Total (MW)MISO/MAPP 46,255 ‐ 46,255
SPP 50,958 ‐ 50,958 TVA 1,247 ‐ 1,247 SERC 1,009 11,040 12,049
PJM ISO 38,956 9,280 48,236 NYISO 13,887 39,780 53,667 ISO‐NE 13,887 4,000 17,887
Total 166,199 64,100 230,299
Region Onshore (MW) Offshore (MW) Total (MW)MISO/MAPP 95,046 ‐ 95,046
SPP 94,576 ‐ 94,576 TVA 1,247 ‐ 1,247 SERC 1,009 11,040 12,049
PJM ISO 38,956 9,280 48,236 NYISO 13,887 54,780 68,667 ISO‐NE 13,887 4,000 17,887 Total 258,608 79,100 337,708
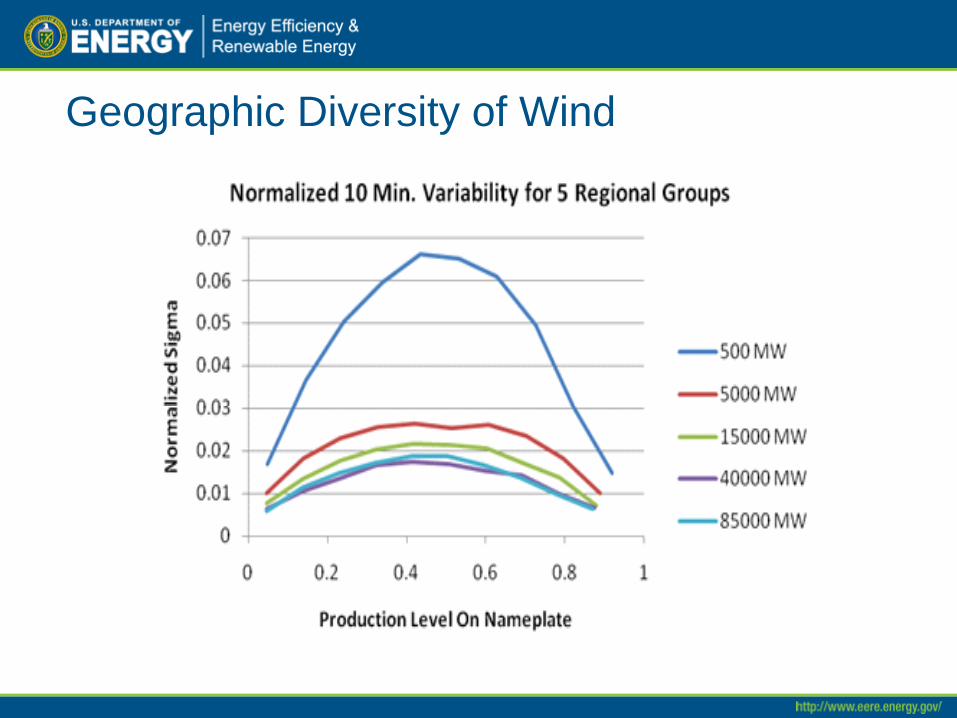
Geographic Diversity of Wind
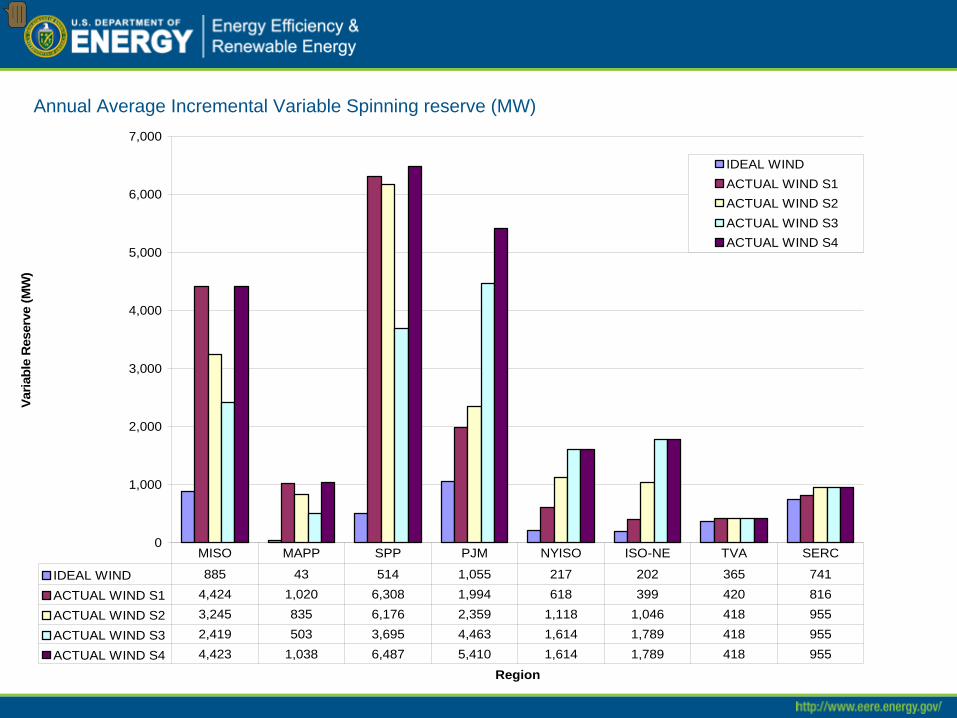
Annual Average Incremental Variable Spinning reserve (MW)
0
1,000
2,000
3,000
4,000
5,000
6,000
7,000
Region
Varia
ble
Res
erve
(MW
)
IDEAL WINDACTUAL WIND S1ACTUAL WIND S2ACTUAL WIND S3ACTUAL WIND S4
IDEAL WIND 885 43 514 1,055 217 202 365 741
ACTUAL WIND S1 4,424 1,020 6,308 1,994 618 399 420 816
ACTUAL WIND S2 3,245 835 6,176 2,359 1,118 1,046 418 955
ACTUAL WIND S3 2,419 503 3,695 4,463 1,614 1,789 418 955
ACTUAL WIND S4 4,423 1,038 6,487 5,410 1,614 1,789 418 955
MISO MAPP SPP PJM NYISO ISO-NE TVA SERC

Questions??
• http://wind.nrel.gov/public/WWIS/• http://wind.nrel.gov/public/EWITS/