Embed Size (px)
Citation preview
White Paper for the Wind Load Test and Calculation of the Base Station Antenna April, 2019 Page 1 of 17
White Paper
Wind Load Test and Calculation of the
Base Station Antenna
Issued date April 23, 2019
Version V1.0

White Paper for the Wind Load Test and Calculation of the Base Station Antenna April, 2019 Page 2 of 17
Contents
Abstract
Wind Load Calculation Methods
P-BASTA New Standard and Antenna Wind Tunnel Test
Definition of Huawei Antenna Wind Load
Antenna Wind Load Engineering Application
Appendix
White Paper for the Wind Load Test and Calculation of the Base Station Antenna April, 2019 Page 3 of 17
Abstract
Wind load is an important parameter for
designing base station antenna structure,
including the tower and supporting structures. It
directly affects the reliability of the antenna
application and the safety of the tower.
In recent years, with the rapid development of
MIMO, antennas are becoming increasingly
integrated and the antenna size is constantly
increasing, leading to more concerns for the
impact of antenna wind load on the tower. The
evaluation on tower safety and economic
efficiency requires greater antenna wind load
calculation accuracy.
Since 2017, the standardization organization
NGMN-P-BASTA has established a base station
antenna wind load working group. This working
group has organized several workshops with
multiple antenna manufacturers and carriers to
normalize wind load standards and wind load
calculation methods in the antenna industry. The
standardized method of calculating the base
station antenna wind load has been released in
the P-BASTA V11.1 standard. Huawei develops
the antenna wind load specifications according to
the latest P-BASTA standard. This document
describes the wind load test and calculation
methods of Huawei base station antennas.
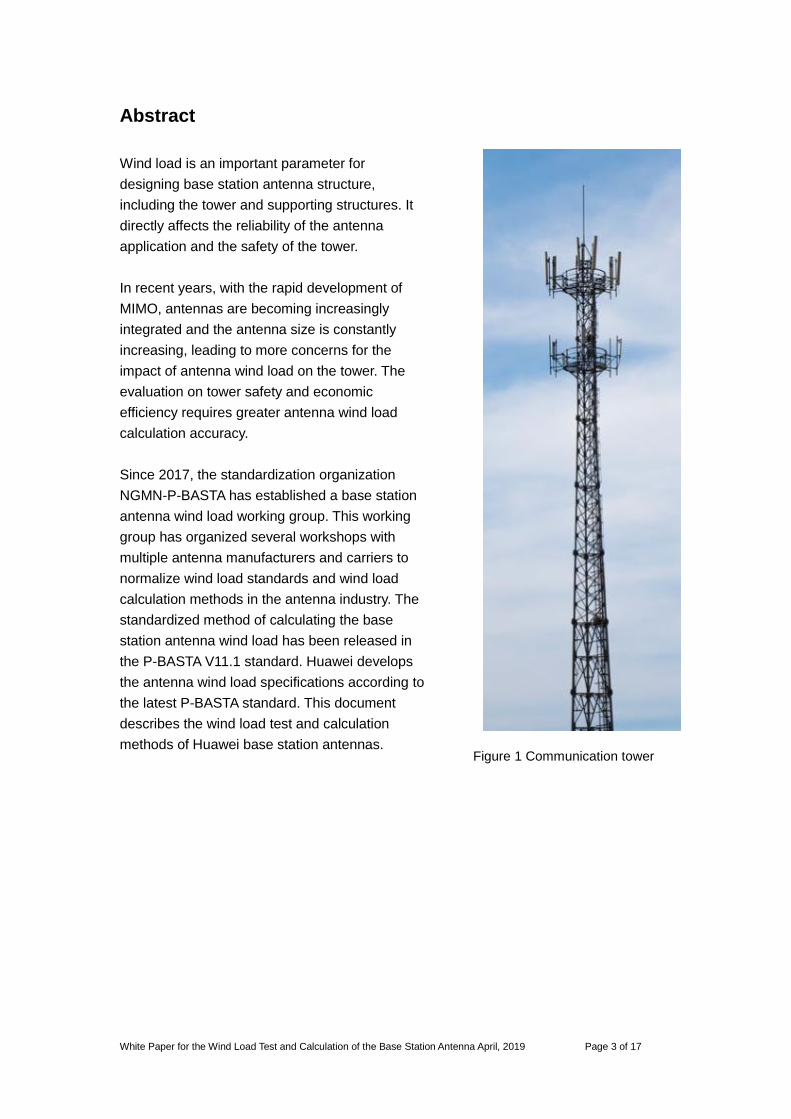
Figure 1 Communication tower
White Paper for the Wind Load Test and Calculation of the Base Station Antenna April, 2019 Page 4 of 17
Wind Load Calculation Methods
According to Section 5.10 in NGMN-P-BASTA
Recommendation on Base Station Antenna
Standards V9.6, the wind load can be obtained in
the following ways:
1. Based on the released standards
2. Through computational fluid dynamics (CFD)
simulation
3. Through wind tunnel testing
1. Standardized Calculation
In this mode, the wind load is calculated using
the formula provided by the released wind load
standards.
The wind load is calculated using the following
formula:
𝐹𝑤 = 𝐶𝑑 ∗ 𝑞𝑣 ∗ 𝐴
Where,
𝐹𝑤:wind load (N)
𝐶𝑑:drag coefficient
𝑞𝑣:wind pressure (Pa)
A:windward projection area (m2)
The wind pressure is subject to the air density
and wind speed. Its calculation formula is as
follows:
𝑞𝑣 =1
2∗ 𝜌 ∗ 𝑣2
Where,
Air density (kg/m3)
𝑣: Wind speed (m/s)
The drag coefficient Cd is calculated using
different methods in various wind load standards.
The calculation of antenna wind load usually
complies with the European standard EN1991-1-
4 and North American standard TIA-222-G.
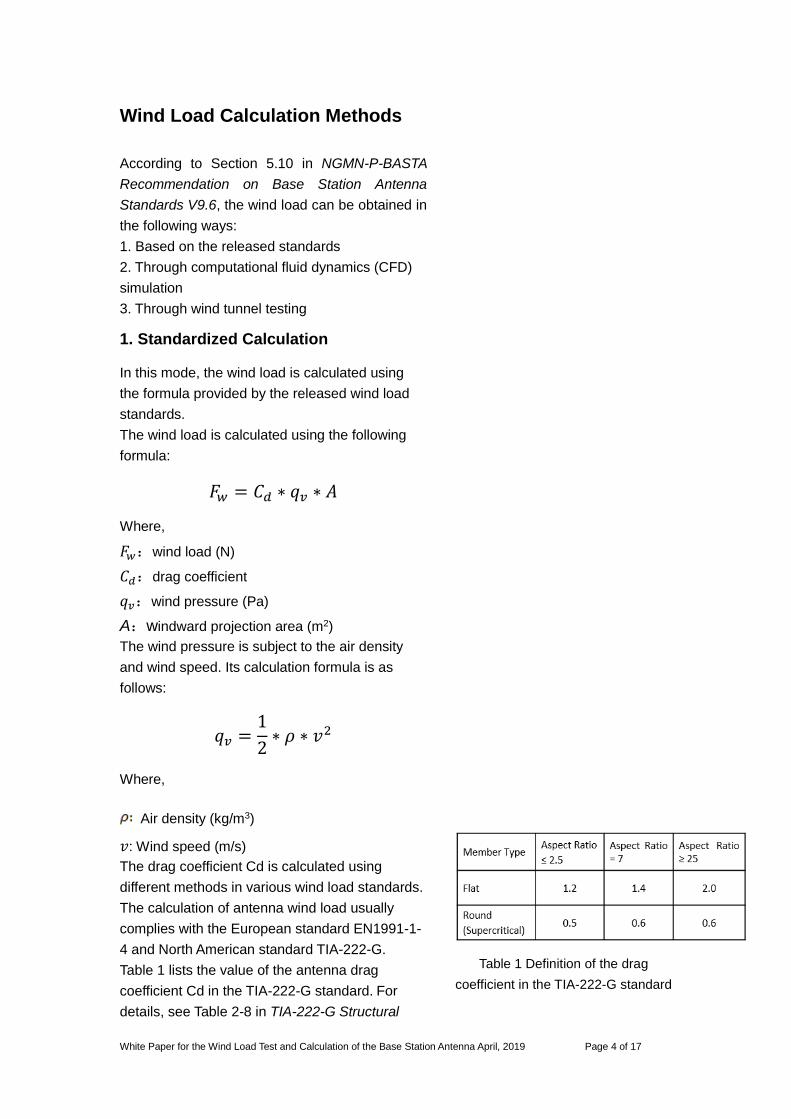
Table 1 lists the value of the antenna drag
coefficient Cd in the TIA-222-G standard. For
details, see Table 2-8 in TIA-222-G Structural
Table 1 Definition of the drag
coefficient in the TIA-222-G standard
White Paper for the Wind Load Test and Calculation of the Base Station Antenna April, 2019 Page 5 of 17
Standard for Antenna Supporting Structures and
Antennas.
In the TIA standard, the antenna is regarded as
an auxiliary part, and only the drag coefficients of
panel and circular antennas are defined.
However, the shape of an antenna section is
generally between a panel and a circle.
Therefore, it is difficult to accurately calculate the
antenna wind load using this standard.
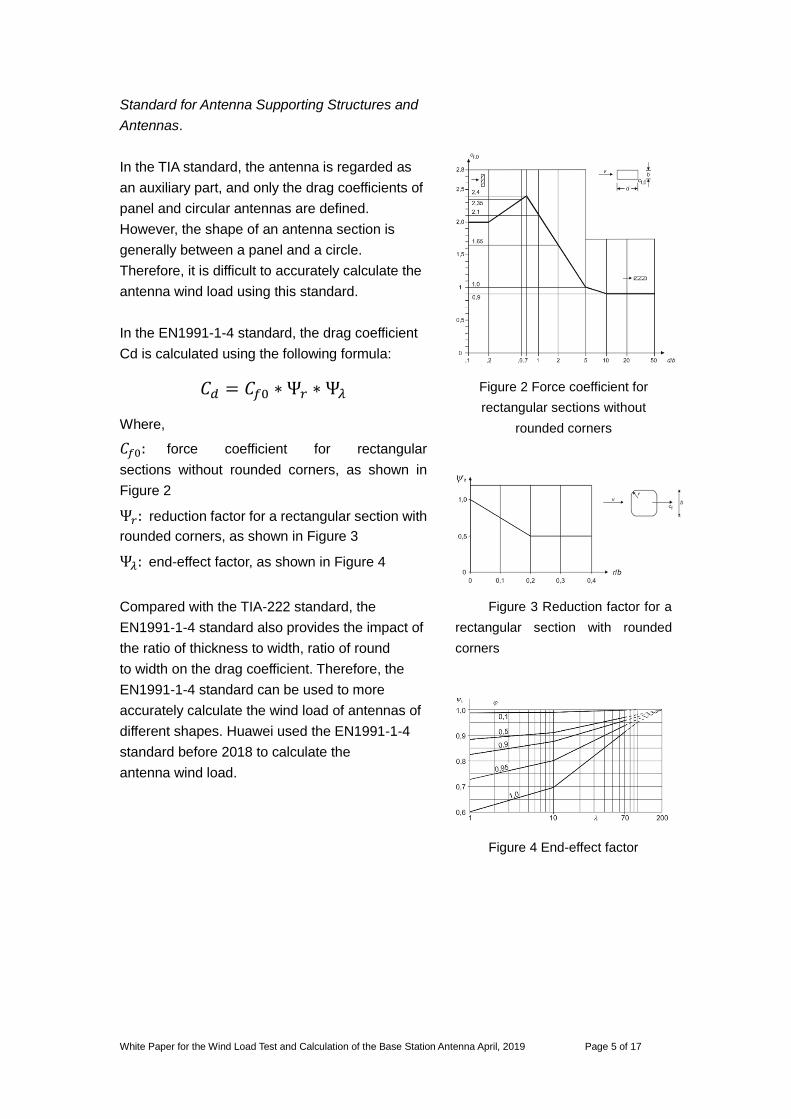
In the EN1991-1-4 standard, the drag coefficient
Cd is calculated using the following formula:
𝐶𝑑 = 𝐶𝑓0 ∗ Ψ𝑟 ∗ Ψ𝜆
Where,
𝐶𝑓0: force coefficient for rectangular
sections without rounded corners, as shown in
Figure 2
Ψ𝑟: reduction factor for a rectangular section with
rounded corners, as shown in Figure 3
Ψ𝜆: end-effect factor, as shown in Figure 4
Compared with the TIA-222 standard, the
EN1991-1-4 standard also provides the impact of
the ratio of thickness to width, ratio of round
to width on the drag coefficient. Therefore, the
EN1991-1-4 standard can be used to more
accurately calculate the wind load of antennas of
different shapes. Huawei used the EN1991-1-4
standard before 2018 to calculate the
antenna wind load.
Figure 2 Force coefficient for
rectangular sections without
rounded corners
Figure 3 Reduction factor for a
rectangular section with rounded
corners
Figure 4 End-effect factor

White Paper for the Wind Load Test and Calculation of the Base Station Antenna April, 2019 Page 6 of 17
2. CFD Simulation
With the rapid development of computer
technology, CFD has developed rapidly, and has
become an important means of product
development with experimental fluid mechanics.
It provides a faster and more economical method
for product design. However, due to the
complexity of the fluid, simulation is not enough
to calculate the wind load, and a large number
of wind tunnel tests are also required. Figure 5
shows the antenna wind load simulation.
3. Wind Tunnel Testing
Among wind load measurement tests, the wind
tunnel test simulates the environment most
similar to the actual natural environment of the
product and therefore is the most accurate test
method.
The wind tunnel test is widely used to measure
the wind load and perform various aerodynamics
studies in airplane, automobile, building, and
other fields (see Figure 6). The test provides
strong support for reducing wind load and
improving wind load prevention performance. In
the antenna industry, wind tunnel tests are also
used to obtain antenna wind load.
Figure 5 Simulation of antenna wind
load
Figure 6 Wind tunnel test in
industrial applications
White Paper for the Wind Load Test and Calculation of the Base Station Antenna April, 2019 Page 7 of 17
P-BASTA Standard and Antenna
Wind Tunnel Test
Before 2018, the P-BASTA V9.6 standard allows
antenna manufacturers to use the preceding
three methods to calculate and claim
antenna wind load. However, different antenna
manufacturers may adopt different methods, and
the obtained wind load results are different even
for the same antenna. Therefore, a unified
antenna wind load calculation method becomes
very necessary.
From 2017 to 2018, the P-BASTA organized a
dedicated antenna wind load working group and
made great efforts to solve this problem.
Currently, the method of obtaining antenna wind
load through wind tunnel testing has been
recognized by most manufacturers and carriers.
Compared with the standardized calculation and
CFD simulation, the wind tunnel test provides an
environment that is closer to the actual scenario
to obtain the wind load.
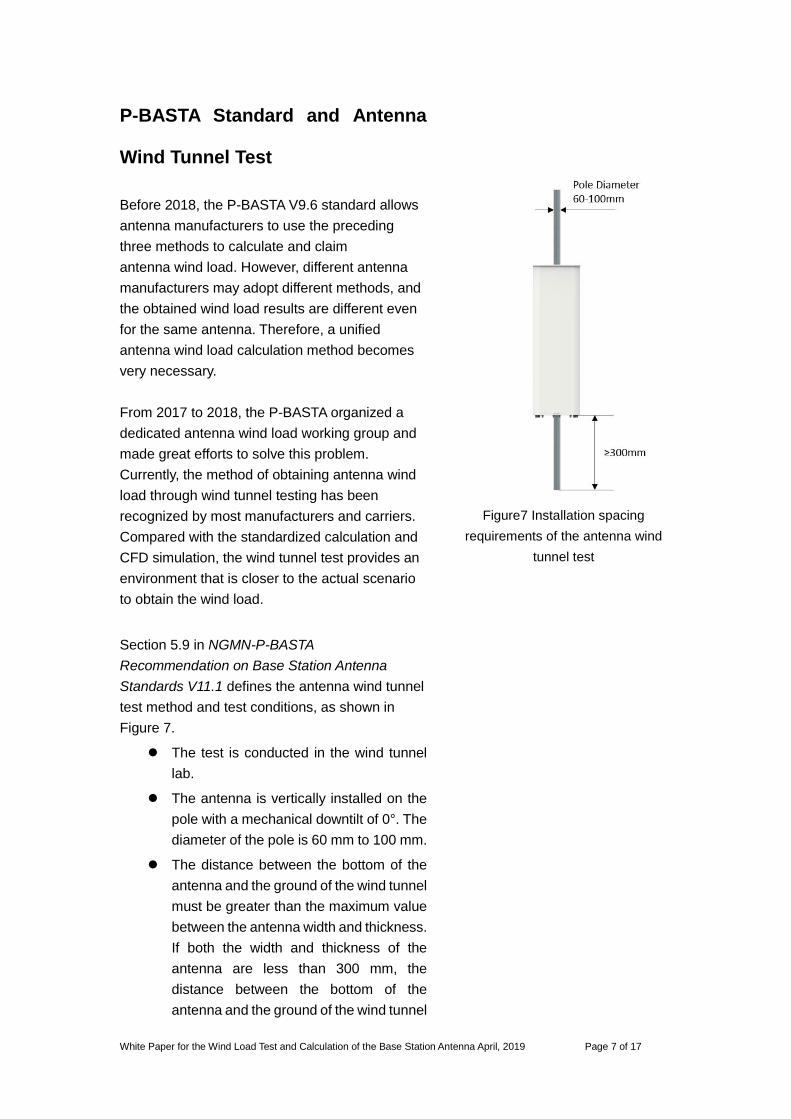
Section 5.9 in NGMN-P-BASTA
Recommendation on Base Station Antenna
Standards V11.1 defines the antenna wind tunnel
test method and test conditions, as shown in
Figure 7.
The test is conducted in the wind tunnel
lab.
The antenna is vertically installed on the
pole with a mechanical downtilt of 0°. The
diameter of the pole is 60 mm to 100 mm.
The distance between the bottom of the
antenna and the ground of the wind tunnel
must be greater than the maximum value
between the antenna width and thickness.
If both the width and thickness of the
antenna are less than 300 mm, the
distance between the bottom of the
antenna and the ground of the wind tunnel
Figure7 Installation spacing
requirements of the antenna wind
tunnel test
White Paper for the Wind Load Test and Calculation of the Base Station Antenna April, 2019 Page 8 of 17
must be greater than or equal to 300 mm.
The test wind speed is 150 km/h. If
resonance occurs, the wind speed can be
reduced. The wind load corresponding to
the wind speed of 150 km/h can be
obtained through interpolation calculation.
Wind load calculation:
Test the wind load of the antenna mounted on a
pole in the wind tunnel environment, including the
front-side and lateral-side wind load. When
calculating the wind load on the front side of the
antenna, subtract the wind load of the part of the
pole protruding from the antenna. When
calculating the wind load on the lateral side of the
antenna, subtract the wind load of the entire pole
from the total wind load.
The drag coefficient of the antenna with the
corresponding length can be calculated based on
the wind load measured through the wind tunnel
test. The drag coefficient and wind load of
antennas with different lengths can be calculated
by multiplying the drag coefficient by the end-
effect factor. The end-effect factor can be
obtained from the EN1991-1-4/TIA-222 standard.
Definition of Huawei Antenna Wind
load
Huawei antenna wind load complies with the P-
BASTA V11.1 standard. The wind tunnel test data
is used as the basis for wind load calculation.
White Paper for the Wind Load Test and Calculation of the Base Station Antenna April, 2019 Page 9 of 17
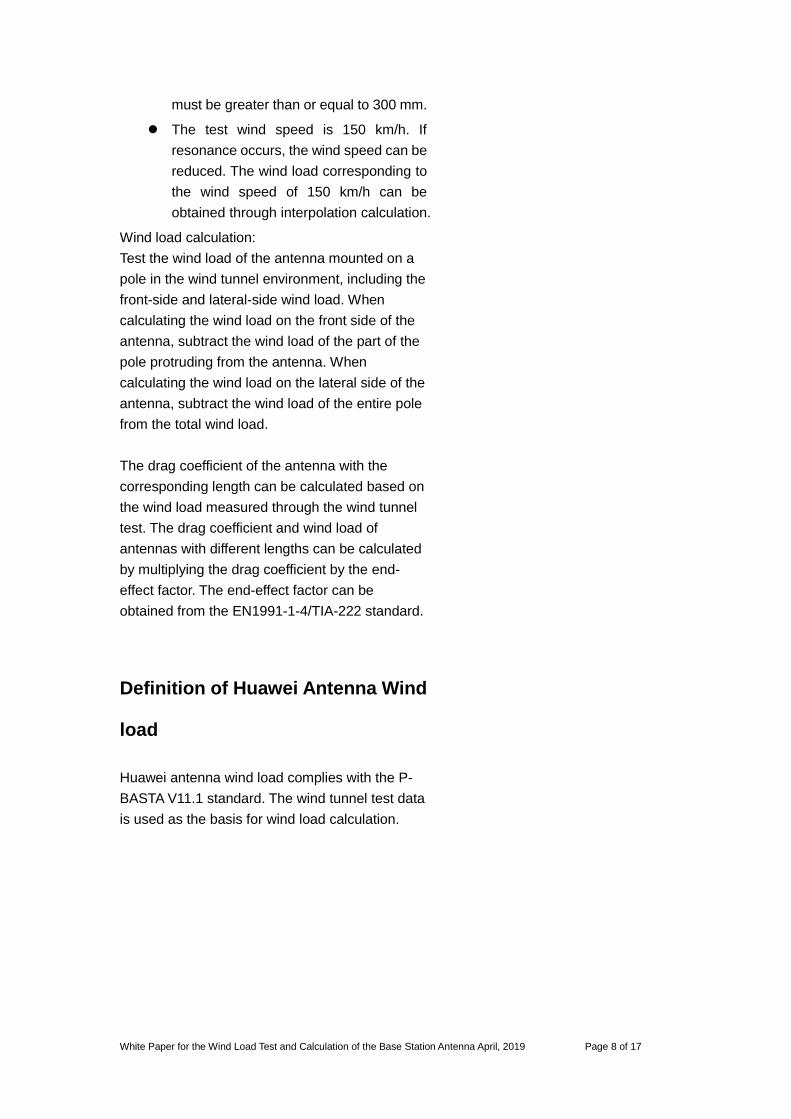
Wind Tunnel Test
The wind tunnel test of Huawei antennas is
completed in the wind tunnel lab of Central South
University (see Figure 8). The antenna is installed
on a pole. The distance between the antenna
bottom and the wind tunnel ground is greater
than 300 mm. The test wind speed is 150 km/h.
The pole can rotate freely with the wind tunnel
rotating tray in the 0–360° range. Because the
antenna adopts a symmetric structure, the test
angle is 0–180°. Perform a test and record data
every 5°/10°, as shown in the following figure.
Measure the wind load of the antenna and pole
through the wind tunnel test.
In any angle of the antenna rotation, the pole that
exceeds the antenna length is not shielded and
the wind load can be subtracted. Therefore,
the wind load and drag coefficient of the wind
tunnel test cover only the pole with the same
length as the antenna against the rear of the
antenna.
The drag coefficient of the wind tunnel test is
calculated using the following formula:
𝐶𝑑 =𝐹𝑤
12 ∗ 𝜌 ∗ 𝑉2 ∗ 𝐴𝐴𝑛𝑡𝑒𝑛𝑛𝑎
In the wind tunnel test, antennas with different
profiles are selected. The test results show that
the drag coefficient of the antenna varies
sharply with the profiles.
Figure 8 Antenna wind tunnel test in
Central South University
White Paper for the Wind Load Test and Calculation of the Base Station Antenna April, 2019 Page 10 of 17
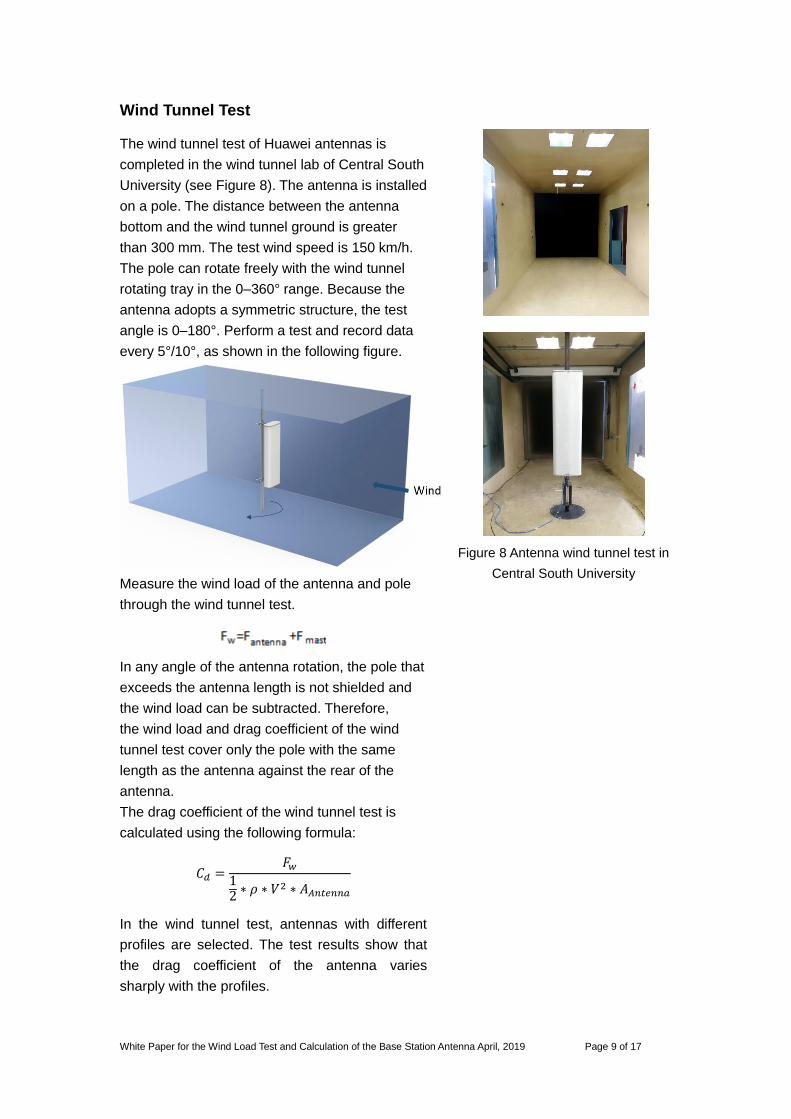
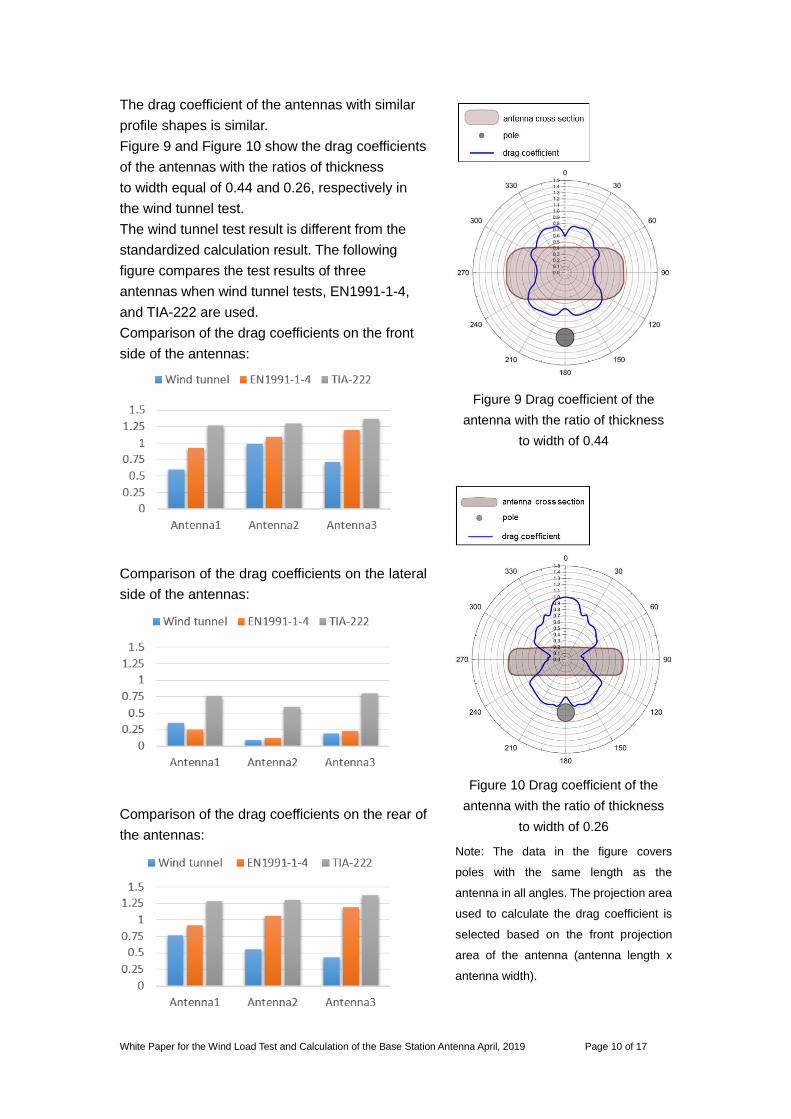
The drag coefficient of the antennas with similar
profile shapes is similar.
Figure 9 and Figure 10 show the drag coefficients
of the antennas with the ratios of thickness
to width equal of 0.44 and 0.26, respectively in
the wind tunnel test.
The wind tunnel test result is different from the
standardized calculation result. The following
figure compares the test results of three
antennas when wind tunnel tests, EN1991-1-4,
and TIA-222 are used.
Comparison of the drag coefficients on the front
side of the antennas:
Comparison of the drag coefficients on the lateral
side of the antennas:
Comparison of the drag coefficients on the rear of
the antennas:
Figure 9 Drag coefficient of the
antenna with the ratio of thickness
to width of 0.44
Figure 10 Drag coefficient of the
antenna with the ratio of thickness
to width of 0.26
Note: The data in the figure covers
poles with the same length as the
antenna in all angles. The projection area
used to calculate the drag coefficient is
selected based on the front projection
area of the antenna (antenna length x
antenna width).
White Paper for the Wind Load Test and Calculation of the Base Station Antenna April, 2019 Page 11 of 17
Wind load Calculation and Datasheet
Claimed Value
The Huawei antenna product datasheet provides
the front-side, lateral-side, and maximum wind
load values at the wind speed of 150 km/h.
The front and lateral are defined and calculated
based on APPENDIX F in NGMN-P-BASTA
Recommendation on Base Station Antenna
Standards V11.1. The maximum value is closely
related to the installation scenario. Huawei
defines the maximum value based on the specific
environment of the wind tunnel test.
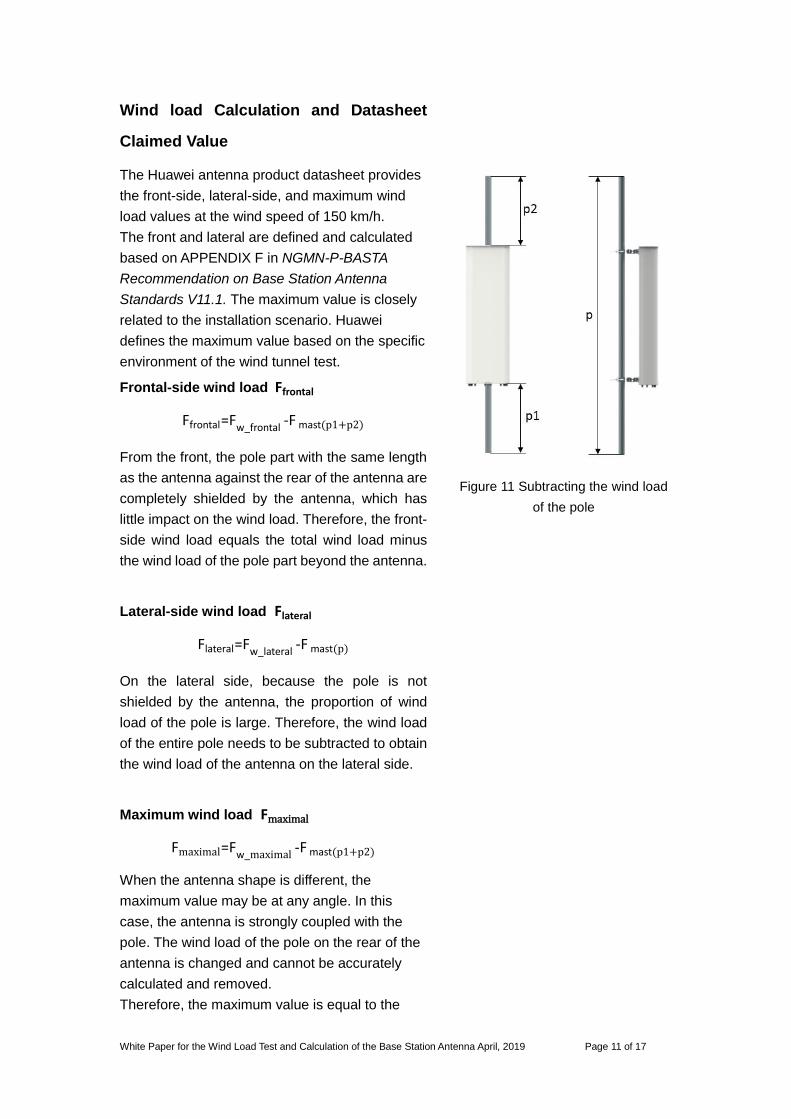
Frontal-side wind load Ffrontal
Ffrontal=Fw_frontal -F mast(p1+p2)
From the front, the pole part with the same length
as the antenna against the rear of the antenna are
completely shielded by the antenna, which has
little impact on the wind load. Therefore, the front-
side wind load equals the total wind load minus
the wind load of the pole part beyond the antenna.
Lateral-side wind load Flateral
Flateral=Fw_lateral -F mast(p)
On the lateral side, because the pole is not
shielded by the antenna, the proportion of wind
load of the pole is large. Therefore, the wind load
of the entire pole needs to be subtracted to obtain
the wind load of the antenna on the lateral side.
Maximum wind load Fmaximal
Fmaximal=Fw_maximal -F mast(p1+p2)
When the antenna shape is different, the
maximum value may be at any angle. In this
case, the antenna is strongly coupled with the
pole. The wind load of the pole on the rear of the
antenna is changed and cannot be accurately
calculated and removed.
Therefore, the maximum value is equal to the
Figure 11 Subtracting the wind load
of the pole
White Paper for the Wind Load Test and Calculation of the Base Station Antenna April, 2019 Page 12 of 17
maximum value of the wind tunnel test minus
the wind load of the pole part beyond the
antenna.
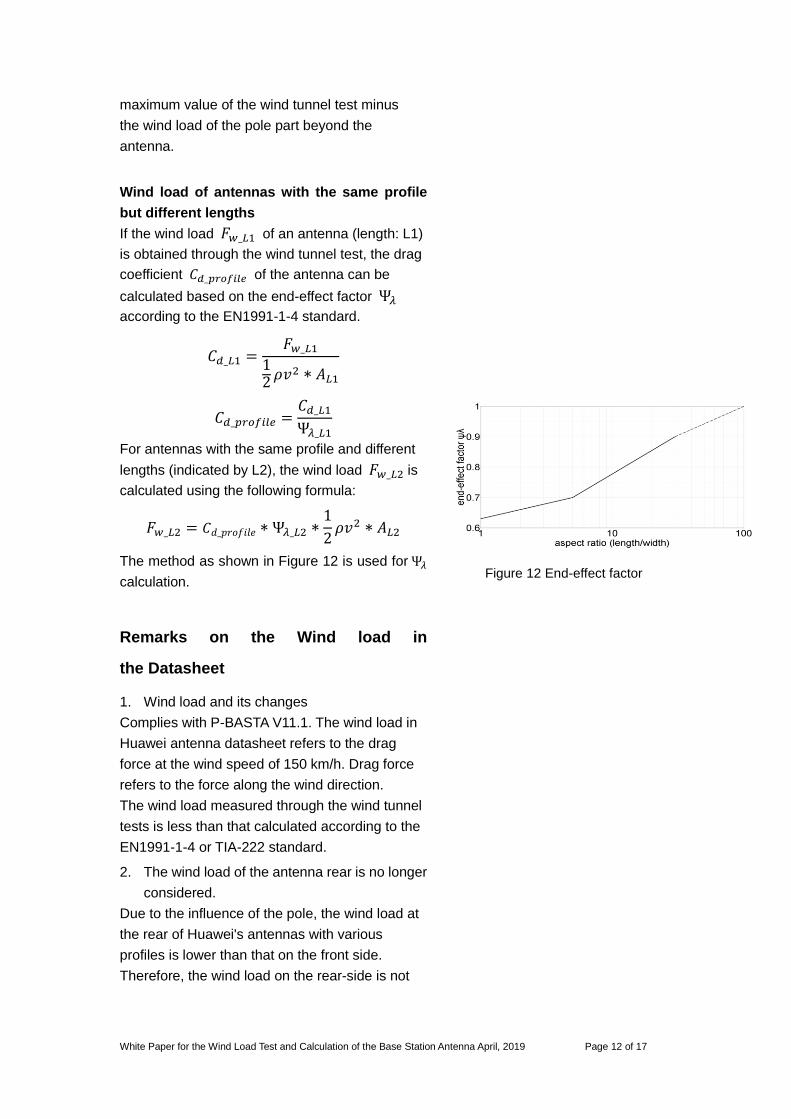
Wind load of antennas with the same profile
but different lengths
If the wind load 𝐹𝑤_𝐿1 of an antenna (length: L1)
is obtained through the wind tunnel test, the drag
coefficient 𝐶𝑑_𝑝𝑟𝑜𝑓𝑖𝑙𝑒 of the antenna can be
calculated based on the end-effect factor Ψ𝜆
according to the EN1991-1-4 standard.
𝐶𝑑_𝐿1 =𝐹𝑤_𝐿1
12 𝜌𝑣2 ∗ 𝐴𝐿1
𝐶𝑑_𝑝𝑟𝑜𝑓𝑖𝑙𝑒 =𝐶𝑑_𝐿1
Ψ𝜆_𝐿1
For antennas with the same profile and different
lengths (indicated by L2), the wind load 𝐹𝑤_𝐿2 is
calculated using the following formula:
𝐹𝑤_𝐿2 = 𝐶𝑑_𝑝𝑟𝑜𝑓𝑖𝑙𝑒 ∗ Ψ𝜆_𝐿2 ∗1
2𝜌𝑣2 ∗ 𝐴𝐿2
The method as shown in Figure 12 is used for Ψ𝜆
calculation.
Remarks on the Wind load in
the Datasheet
1. Wind load and its changes
Complies with P-BASTA V11.1. The wind load in
Huawei antenna datasheet refers to the drag
force at the wind speed of 150 km/h. Drag force
refers to the force along the wind direction.
The wind load measured through the wind tunnel
tests is less than that calculated according to the
EN1991-1-4 or TIA-222 standard.
2. The wind load of the antenna rear is no longer
considered.
Due to the influence of the pole, the wind load at
the rear of Huawei's antennas with various
profiles is lower than that on the front side.
Therefore, the wind load on the rear-side is not
Figure 12 End-effect factor
White Paper for the Wind Load Test and Calculation of the Base Station Antenna April, 2019 Page 13 of 17
reflected. If necessary, the load can be evaluated
based on the load of the front side. The P-BASTA
V11.1 standard also cancels the rear-side value.
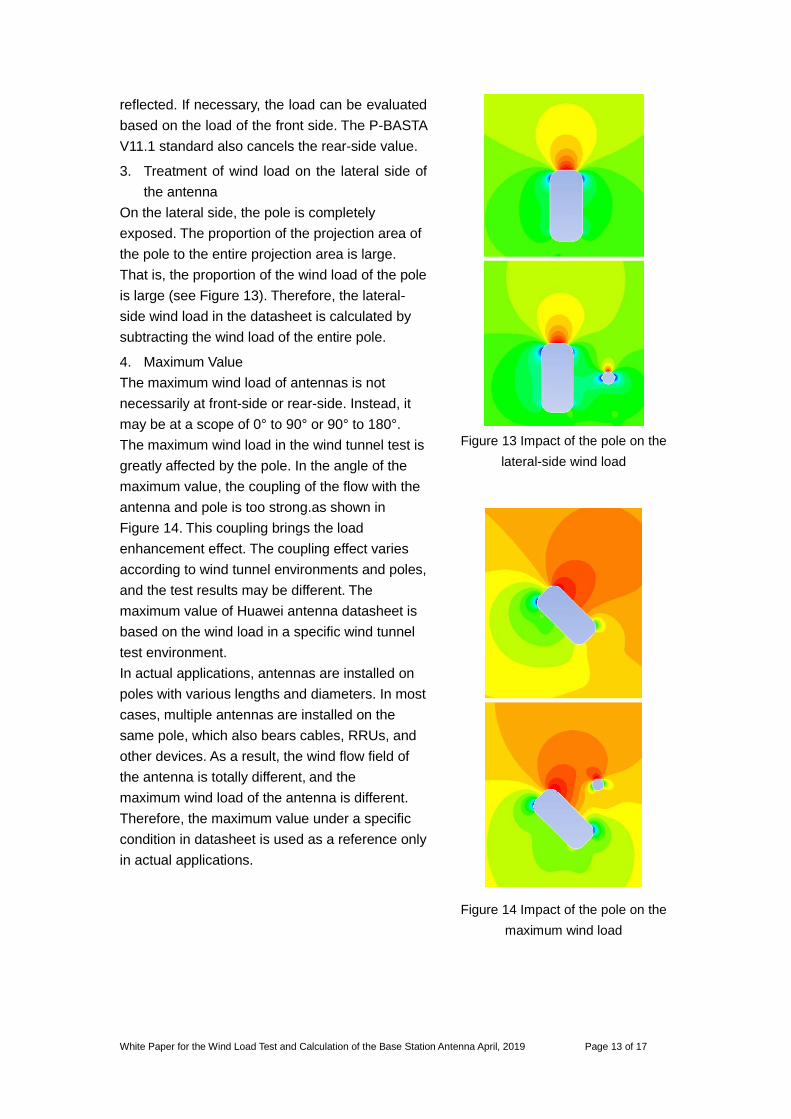
3. Treatment of wind load on the lateral side of
the antenna
On the lateral side, the pole is completely
exposed. The proportion of the projection area of
the pole to the entire projection area is large.
That is, the proportion of the wind load of the pole
is large (see Figure 13). Therefore, the lateral-
side wind load in the datasheet is calculated by
subtracting the wind load of the entire pole.
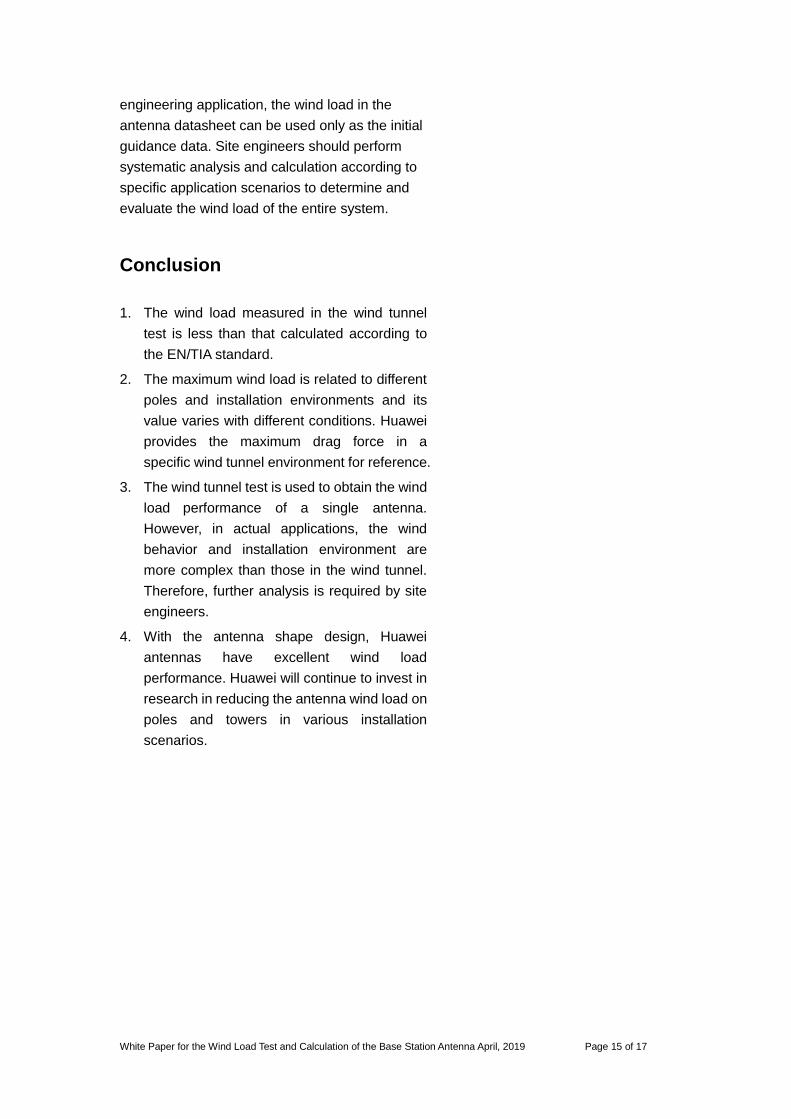
4. Maximum Value
The maximum wind load of antennas is not
necessarily at front-side or rear-side. Instead, it
may be at a scope of 0° to 90° or 90° to 180°.
The maximum wind load in the wind tunnel test is
greatly affected by the pole. In the angle of the
maximum value, the coupling of the flow with the
antenna and pole is too strong.as shown in
Figure 14. This coupling brings the load
enhancement effect. The coupling effect varies
according to wind tunnel environments and poles,
and the test results may be different. The
maximum value of Huawei antenna datasheet is
based on the wind load in a specific wind tunnel
test environment.
In actual applications, antennas are installed on
poles with various lengths and diameters. In most
cases, multiple antennas are installed on the
same pole, which also bears cables, RRUs, and
other devices. As a result, the wind flow field of
the antenna is totally different, and the
maximum wind load of the antenna is different.
Therefore, the maximum value under a specific
condition in datasheet is used as a reference only
in actual applications.
Figure 13 Impact of the pole on the
lateral-side wind load
Figure 14 Impact of the pole on the
maximum wind load

White Paper for the Wind Load Test and Calculation of the Base Station Antenna April, 2019 Page 14 of 17
Design and Research of Reduced Wind
load of Huawei Antennas
Huawei has made great efforts in reducing
antenna wind load design, made in-depth
research on antenna size and modeling design,
and applied these achievements to the radome
structure design. Due to these achievements,
Huawei antennas are characterized in low wind
load. However, research on wind load changes in
different installation and testing environments is
not enough.
In the coming 5G era, antenna applications and
installation scenarios will be more complex.
Huawei will continue to study the coupling effect of
antennas, installation scenarios, and poles, and
participate in the P-BASTA organization to
improve and formulate more comprehensive and
practical engineering standards.
Antenna Wind Load Engineering
Application
The wind load in the antenna datasheet is
measured per antenna at the specified wind
speed of 150 km/h. In actual conditions,
antennas are installed in various environments.
For example, multiple antennas are installed on a
pole, or an RRU or a combiner is installed, which
affects the wind load of the antennas.
In addition, the wind load in the datasheet is
measured and calculated at the stable wind
speed. In the actual natural environment,
the wind is random and pulsating, and its
behavior is complex. In different geographical
locations, heights, and surrounding
environments, the performance of the wind is
also different. The vibration of the tower or pole
also generates a dynamic coupling effect.
Therefore, site engineers need to further
calculate the wind load according to the local
tower engineering specifications. Therefore, in
White Paper for the Wind Load Test and Calculation of the Base Station Antenna April, 2019 Page 15 of 17
engineering application, the wind load in the
antenna datasheet can be used only as the initial
guidance data. Site engineers should perform
systematic analysis and calculation according to
specific application scenarios to determine and
evaluate the wind load of the entire system.
Conclusion
1. The wind load measured in the wind tunnel
test is less than that calculated according to
the EN/TIA standard.
2. The maximum wind load is related to different
poles and installation environments and its
value varies with different conditions. Huawei
provides the maximum drag force in a
specific wind tunnel environment for reference.
3. The wind tunnel test is used to obtain the wind
load performance of a single antenna.
However, in actual applications, the wind
behavior and installation environment are
more complex than those in the wind tunnel.
Therefore, further analysis is required by site
engineers.
4. With the antenna shape design, Huawei
antennas have excellent wind load
performance. Huawei will continue to invest in
research in reducing the antenna wind load on
poles and towers in various installation
scenarios.
White Paper for the Wind Load Test and Calculation of the Base Station Antenna April, 2019 Page 16 of 17
Appendix
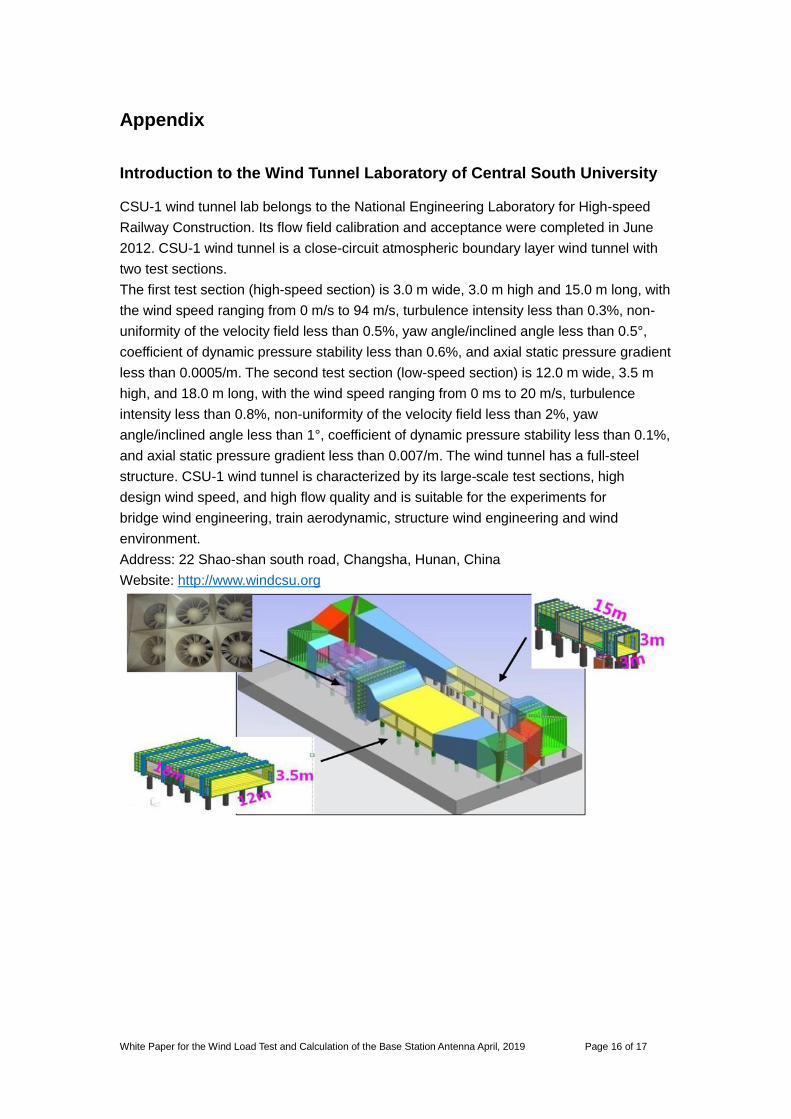
Introduction to the Wind Tunnel Laboratory of Central South University
CSU-1 wind tunnel lab belongs to the National Engineering Laboratory for High-speed
Railway Construction. Its flow field calibration and acceptance were completed in June
2012. CSU-1 wind tunnel is a close-circuit atmospheric boundary layer wind tunnel with
two test sections.
The first test section (high-speed section) is 3.0 m wide, 3.0 m high and 15.0 m long, with
the wind speed ranging from 0 m/s to 94 m/s, turbulence intensity less than 0.3%, non-
uniformity of the velocity field less than 0.5%, yaw angle/inclined angle less than 0.5°,
coefficient of dynamic pressure stability less than 0.6%, and axial static pressure gradient
less than 0.0005/m. The second test section (low-speed section) is 12.0 m wide, 3.5 m
high, and 18.0 m long, with the wind speed ranging from 0 ms to 20 m/s, turbulence
intensity less than 0.8%, non-uniformity of the velocity field less than 2%, yaw
angle/inclined angle less than 1°, coefficient of dynamic pressure stability less than 0.1%,
and axial static pressure gradient less than 0.007/m. The wind tunnel has a full-steel
structure. CSU-1 wind tunnel is characterized by its large-scale test sections, high
design wind speed, and high flow quality and is suitable for the experiments for
bridge wind engineering, train aerodynamic, structure wind engineering and wind
environment.
Address: 22 Shao-shan south road, Changsha, Hunan, China
Website: http://www.windcsu.org
White Paper for the Wind Load Test and Calculation of the Base Station Antenna April, 2019 Page 17 of 17
References
1. NGMN-P-BASTA Recommendation on Base Station Antenna Standards V11.1,
March-2019
2. NGMN-P-BASTA Recommendation on Base Station Antenna Standards V9.6,
January-2013
3. EN1991-1-4:2005 Eurocode 1: Actions on structures - Part 1-4: General actions -
Wind actions. April 2005
4. TIA-222-G Structural Standard for Antenna Supporting Structures and Antennas,
August 2005