Embed Size (px)
Citation preview

FINAL REPORT
U.S. Department of Energy
Grant DE-EE-002512
Wind Resources on Tribal Land
Iowa Tribe of Oklahoma
Michelle Holiday and Associates
3/27/2015
Iowa Tribe of Oklahoma
2
Table of Contents
1 Executive Summary ........................................................................................................ 3 2 Background .................................................................................................................... 4 2.1 Project Objectives ....................................................................................................... 5 2.2 Tasks to Be Performed................................................................................................. 6 3. Wind Farm Design ......................................................................................................... 7 3.1 Wind Measurements ................................................................................................... 9 3.2 Estimation of Long-Term Mean Speed ......................................................................... 9 3.3 Estimation of Long-Term Mean Wind .......................................................................... 9 3.4 Assessment Resources ................................................................................................ 12 3.5 Assessment Constants ................................................................................................. 12 3.6 Wind - Utility Revenue Grade System Cost Avoidance Contract ................................... 13 3.7 Wind - Net Metering Contract .................................................................................... 13 3.8 Electricity Consumption and Load ............................................................................... 14 3.9 Central Rural Electric Cooperative ............................................................................... 15 3.10 NEPA, FAA, Biological & Environmental Studies ......................................................... 18 4 Next Steps ...................................................................................................................... 20 5 Key Findings ................................................................................................................... 20 6 Conclusions and Recommendations ............................................................................... 21 Attachments and Appendices ............................................................................................ 22
Appendix 1. Energy Production Summary .................................................................... Appendix 2. Energy Assessment and Energy Efficiency Reports .................................... Appendix 3. Final Narrative SF-425 Wind Study Report ............................................... Appendix 4. Commercial Energy Analysis, .................................................................... Appendix 5. DOE Iowa Tribe of Oklahoma Energy Program Review .............................
Iowa Tribe of Oklahoma
3
Wind Resource on Tribal Land Project
1 Executive Summary
The Iowa Tribe of Oklahoma has ambitious goals of energy self- sufficiency. The overall objective of the Wind Resource on Tribal Land grant was to conduct a wind resource assessment in order to quantify the wind resource potential available on the Iowa Tribe’s land. A successful wind resource assessment for the Iowa Tribe would provide the data needed to implement a viable and effective commercial wind energy project which would allow the Tribe to be energy independent and offer an additional revenue stream.
The scope of the grant was to determine the feasibility of a utility scale wind energy project on Tribal Lands. Under a Department of Energy (DOE) grant (DE-EE-002512), AWS Truepower was retained by BKJ Solutions Inc. to perform detailed studies to develop methodology and compare the economics of commercial renewable generation procurement options and distributed generation. These studies compare the economic viability of stand-alone and utility grade wind and solar power generation systems when compared to the Tribe’s connected meter loads as documented by Central Rural Electric Cooperative (CREC).
The wind studies evaluate procurement options in three test sites. Wind resource data collection began on site 1 in November 2011 at a single 60-meter measurement mast (designated Mast 0149) located near Fallis, Oklahoma. A SoDAR unit was also installed at the site which was being used to extrapolate the data collected from the MET tower. After monitoring the wind at the MET site for approximately 9 months and conducting correlations with long-term data, it was determined that the wind resource in the area was not likely to be sufficient for a utility-scale wind project.
A new area for a proposed project site was identified using a wind resource map that was created to identify areas in the vicinity with higher wind speeds. This map was overlayed on tribal parcels to determine if the projected wind speeds at parcels associated with the tribal parcels could potentially support a utility scale wind project. The new area was located approximately 20 miles north-northeast of the MET mast in Fallis. The conclusions drawn as a result of the study determined that site 2 was not economically viable for utility grade wind generation.
During the course of determining feasibility for utility scale wind on Tribal lands, the Tribe became interested in exploring whether small wind could help the Tribe not only reduce third party utility costs, but also help to build a sustainable model for the future. As information was collected and analyzed for the utility feasibility project, additional information was collected and analysis was performed to determine self-generation.
The project was extended to evaluate the Iowa Tribal Complex as a small wind distribution generation option. Research from the National Renewable Energy Laboratory for the DOE maps

Iowa Tribe of Oklahoma
4
the Oklahoma annual wind power at 50-m height, which conclusively shows the tribal complex has poor to marginal wind resource potential.
2 Background
The Iowa Tribe of Oklahoma is a federally recognized Indian Tribe eligible for the special programs and services provided by the United States to Indian Tribes. In 1883, an Iowa reservation was created in Indian Territory (Oklahoma) in parts of what is now Lincoln, Logan, Oklahoma and Payne Counties, and encompasses an area of approximately 1250 square miles. Of the 39 Tribes that are located in Oklahoma, the Iowa Tribe is one the smallest with an enrollment membership of 818 (March 2015). The Tribe was organized under a Tribal constitution drafted pursuant to the Thomas-Rogers Oklahoma Indian Welfare Act of 1936. The Tribal constitution empowers a five member elected Business Committee with the authority to act on behalf of the Tribe including the right to engage in any business that will further the economic and social development of the Tribe.
Beginning in 2001 the Iowa Tribe of Oklahoma has pursued a goal of energy independence by developing the means to generate energy on Tribal land from a clean self-sustainable source. Significant project milestones to date:
During 2001-2002, the Iowa Tribe participated in a wind-monitoring program, the Native American Anemometer Loan Program, which was administered by the U.S. Department of Energy – National Renewable Energy Laboratory (NREL).
From 2004-2007, the Iowa Tribe developed, and adopted by form resolution, a comprehensive Integrated Resource Management Plan (IRMP) to provide management direction for the use and/or protection of natural and cultural resources within Iowa Indian Country. Goals and objectives for the development of Wind Energy are addressed in the IRMP.
During 2008, the Iowa Tribe hired staff to oversee the Wind Energy Project.
From August 2008 through 2009, an extensive, and ultimately successful, search for high qualified Technical Consultant was conducted.
From August 2008 through 2009, detailed project objectives, action steps and preliminary budgets were developed to achieve the long term goal of a commercially wind energy farm to offset the Tribe’s electrical loads and sell the excess power back into the grid to provide the much-needed renewable energy source to local utilities and neighboring communities.
Iowa Tribe of Oklahoma
5
2.1 Project Objectives
The goals of the project are specified as follows:
Objective 1: Identify and address technical issues concerning wind energy development.
Identify issues related to land access and sitings of wind turbines, including installation of assessment equipment, permits, and other considerations specific to Tribal lands.
Identify electrical interconnection and transmission requirements, constraints, and opportunities.
Identify issues related to generation of electricity with intermittent wind resources and integration into the electricity supply system.
Address plans for overcoming wind resource barriers.
Objective 2: Conduct an in-depth feasibility study of wind energy to evaluate the actual value of wind turbine generated energy for the Iowa Tribe and Community.
The Iowa Tribe needs to install a 60-meter tower along with supporting SoDAR unit in order to further evaluate the wind resources a heights equivalent to a wind generator that is suitable for the Tribe’s power needs.
An analysis of the solar potential resources available will also be studied via a pryanometer attached to the MET tower.
Perform a preliminary economic (cost) assessment for wind turbines that would be sited on Tribal lands based on wind data and wind turbine performance data.
Examine and collect information for a hybrid wind turbine/diesel backup system to supply electricity to the Tribal Complex and community. A hybrid wind turbine/diesel back-up system could be engineered to supply the majority of the electrical needs of the Iowa Tribal complex using the available wind resources.
Objective 3: Identify and address environmental issues concerning wind energy development and educate stakeholders about the challenges of implementation.
Identify and address issues related to noise, visibility, and avian issues.
Conduct an environmental assessment in preparation for a wind turbine. o Establish methods for assessing potential environmental impact. o Identify resources and natural resources impacted by wind turbine development.
Develop recommendations concerning how noise, visibility and avian considerations should be addressed and incorporated into any potential wind energy development in Iowa Indian Country.
Increase awareness of wind power technologies and their costs, benefits, and challenges.
Conduct studies of the wind resources in the Tribal jurisdictional boundary. The MET Tower in conjunction with the SoDAR unit will allow the Tribe to develop expertise and experience with mobile equipment that will assist in locating other potential wind sites

Iowa Tribe of Oklahoma
6
on Tribal land and/or assist other Indian Tribe in the development of their wind resources.
The actual accomplishments of the project were in line with the projected goals concerning the development of a commercial scale Tribal utility. A business structure was created and in-depth feasibility studies of wind energy were conducted to evaluate the actual cost-benefit of wind as a sustainable energy development model.
The feasibility and development of a commercial wind farm proved to be not feasible, therefore the project goals hinged to commercial wind generation were shifted toward the analysis of a local cooperative to explore small wind development and solar as an alternate source of generation. Additional studies were conducted and proved these options as not feasible.
2.2 Tasks To Be Performed
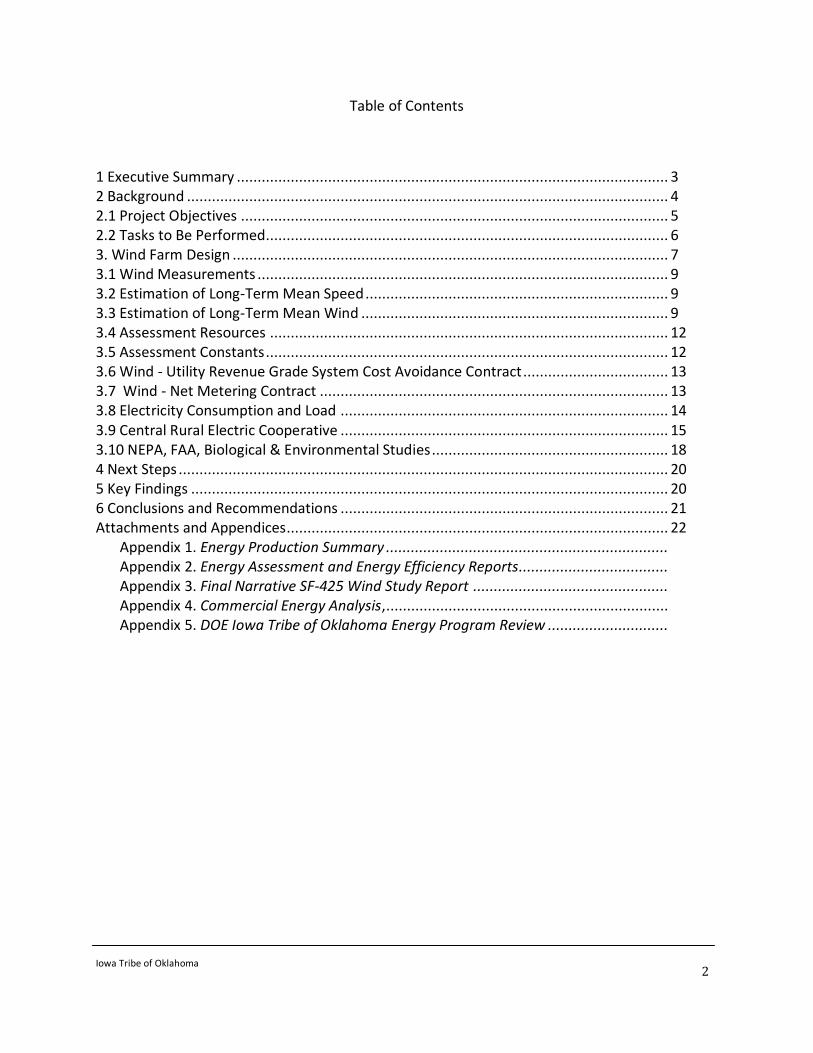
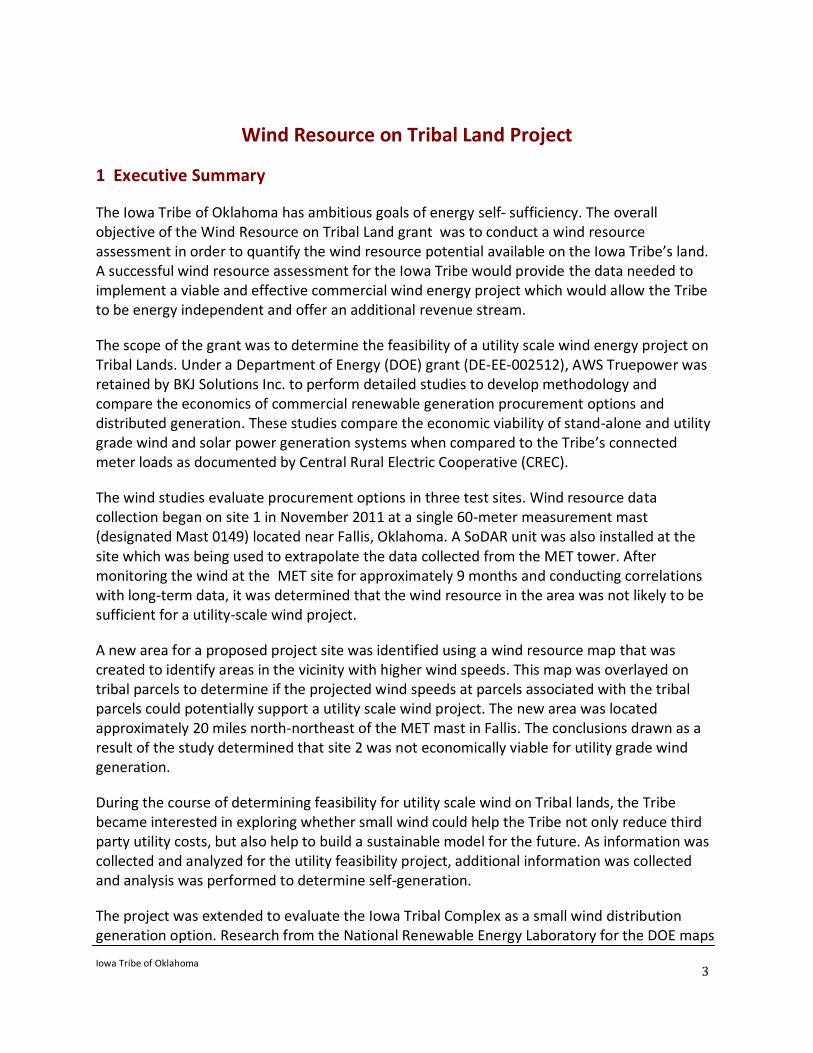
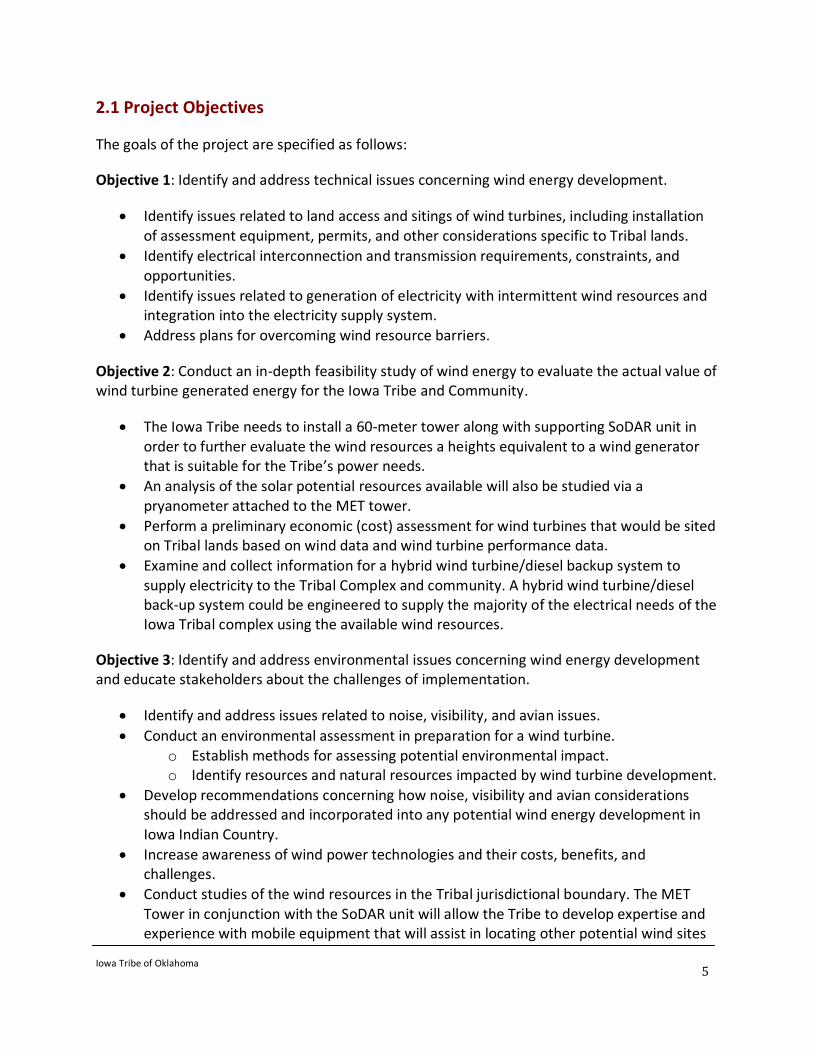
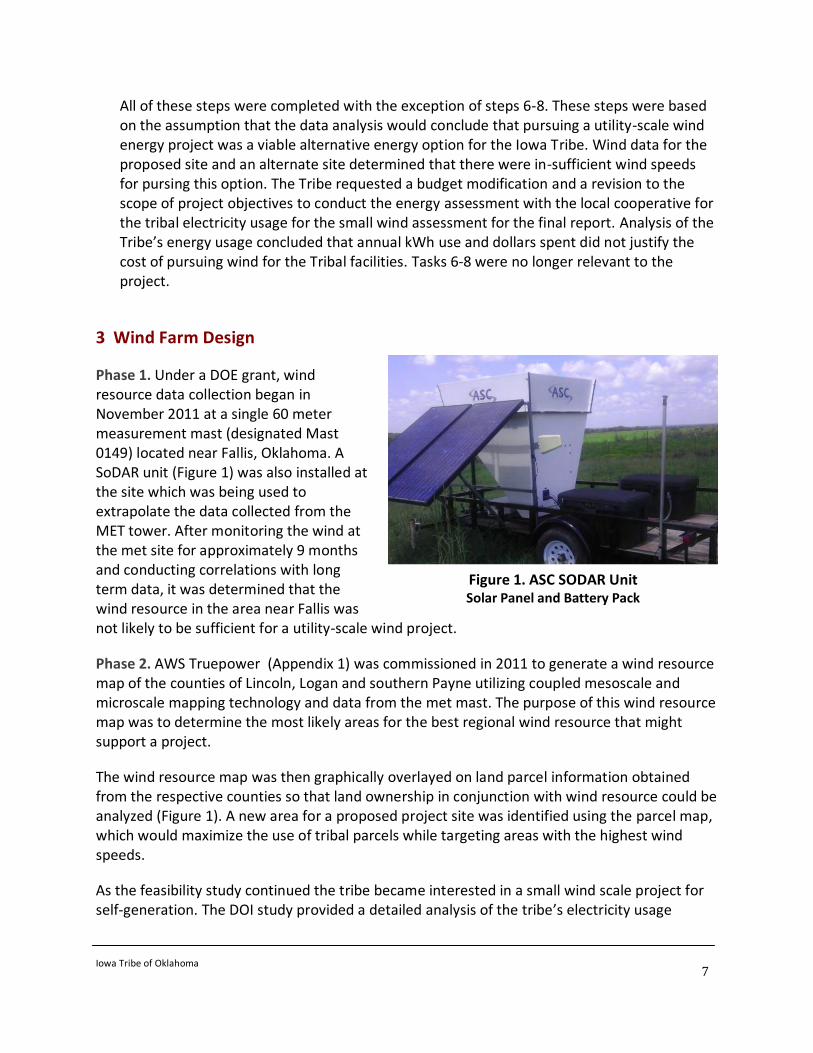
This project revolves around the permitting, purchasing and erection of a 60-meter tower with the wind sensors and data logger and SoDAR unit in order to collect wind speed data for 12 months. The collected data, once analyzed and quantified, will provide an 8760-hour indication of the potential for wind energy at any given hour during the year. With this data, power curves can be constructed, which will allow the Iowa Tribe to effectively develop business plan and wind energy strategy. Purchasing the anemometer and SoDAR unit conducting the wind resource assessment are essential for the realization of the tribal long-term energy vision. Without the anemometer and SoDAR unit, and the wind resource assessment, the Iowa Tribe will not be able to capitalize on this unique investment opportunity.
The actions steps to complete these tasks are as follows: 1. Conduct a wind resource assessment: micrositing of MET mast, purchase, install, and
manage wind data collection at up to 200 meters with a 60 meter anemometer and SoDAR unit.
2. Collect data for a 12-month period, 8,760 hours. 3. Data collection, data verification and certification; such verification procedures are
required for negotiation of power purchase agreements and as collateral for financing. Data will be verified on a weekly basis by a certified meteorologist.
4. Data analysis to determine the feasibility of constructing a commercial scale wind energy project to offset local and distributed electrical loads and sell the excel power back into the grid.
5. Economic assessment for wind turbines that would be sited on tribal lands based on wind data and wind turbine performance data.
6. Environmental assessment for cultural resources, natural resources and avian considerations that may be impacted by wind turbines’ noise and visibility. Work cooperatively with the Iowa Tribe’s Office of Environmental Services (OES) to obtain all necessary FAA and environmental permits and approvals.
7. Completion of business plan and model ready for submission to potential lenders. 8. Obtain letters of intent from local utilities for the sale of excess energy.
Iowa Tribe of Oklahoma
7
Figure 1. ASC SODAR Unit Solar Panel and Battery Pack
All of these steps were completed with the exception of steps 6-8. These steps were based on the assumption that the data analysis would conclude that pursuing a utility-scale wind energy project was a viable alternative energy option for the Iowa Tribe. Wind data for the proposed site and an alternate site determined that there were in-sufficient wind speeds for pursing this option. The Tribe requested a budget modification and a revision to the scope of project objectives to conduct the energy assessment with the local cooperative for the tribal electricity usage for the small wind assessment for the final report. Analysis of the Tribe’s energy usage concluded that annual kWh use and dollars spent did not justify the cost of pursuing wind for the Tribal facilities. Tasks 6-8 were no longer relevant to the project.
3 Wind Farm Design
Phase 1. Under a DOE grant, wind resource data collection began in November 2011 at a single 60 meter measurement mast (designated Mast 0149) located near Fallis, Oklahoma. A SoDAR unit (Figure 1) was also installed at the site which was being used to extrapolate the data collected from the MET tower. After monitoring the wind at the met site for approximately 9 months and conducting correlations with long term data, it was determined that the wind resource in the area near Fallis was not likely to be sufficient for a utility-scale wind project.
Phase 2. AWS Truepower (Appendix 1) was commissioned in 2011 to generate a wind resource map of the counties of Lincoln, Logan and southern Payne utilizing coupled mesoscale and microscale mapping technology and data from the met mast. The purpose of this wind resource map was to determine the most likely areas for the best regional wind resource that might support a project.
The wind resource map was then graphically overlayed on land parcel information obtained from the respective counties so that land ownership in conjunction with wind resource could be analyzed (Figure 1). A new area for a proposed project site was identified using the parcel map, which would maximize the use of tribal parcels while targeting areas with the highest wind speeds.
As the feasibility study continued the tribe became interested in a small wind scale project for self-generation. The DOI study provided a detailed analysis of the tribe’s electricity usage
Iowa Tribe of Oklahoma
8
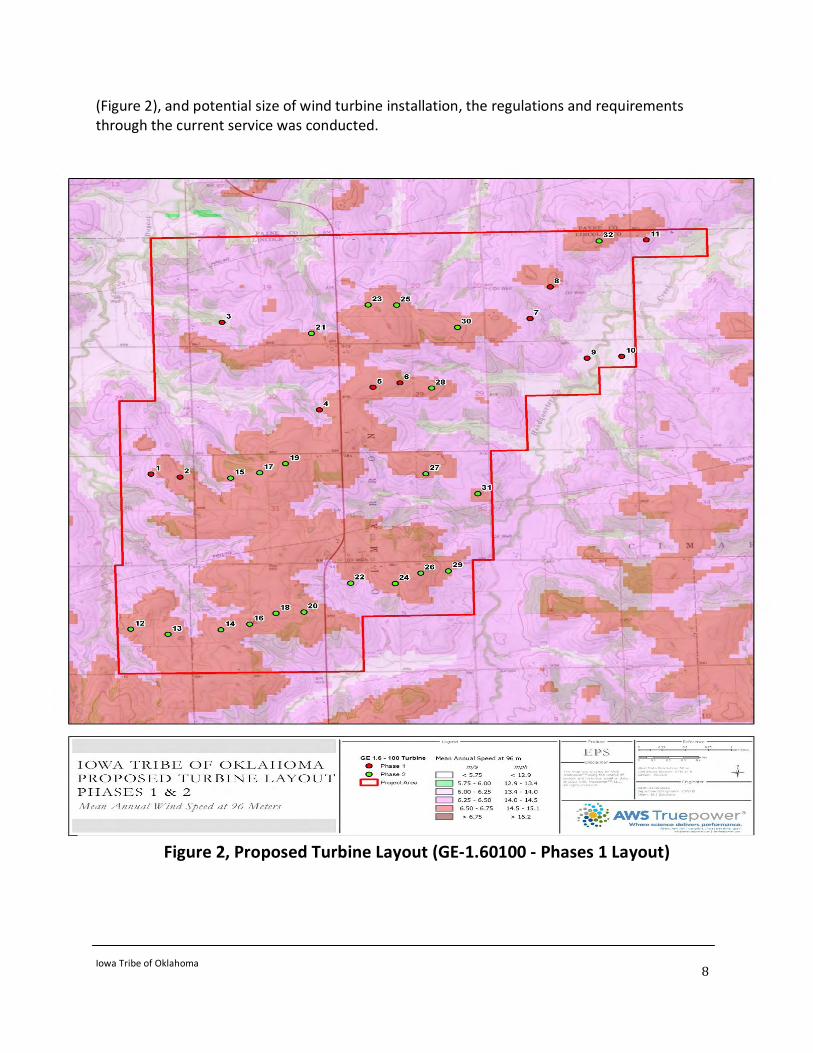
(Figure 2), and potential size of wind turbine installation, the regulations and requirements through the current service was conducted.
Figure 2, Proposed Turbine Layout (GE-1.60100 - Phases 1 Layout)
Iowa Tribe of Oklahoma
9
The ground elevation at the location where the MET mast was installed is notably lower than the project site, and additionally the MET mast was located within a draw, which would have lower wind speeds. AWS Truepower was retained by BKJ Solutions Inc. to evaluate the long-term wind resource and energy production potential of the proposed project site (Appendix 1).
In order to determine the feasibility of a wind project at the proposed location, the Tribe commissioned environmental consultant Ecology and Environment (E&E) to perform a critical issues analysis (CIA) (Appendix 2) to determine potential project constraints . The most prominent environmental issue identified within the CIA was the potential impact to avian species. Although potential for impacts to avian species exists, no critical issues were identified that would have prevented construction of a wind energy facility within the area reviewed in the CIA.
During the course of the feasibility study, the Tribe became increasingly interested in looking at their own electricity consumption patterns and determining if a small wind turbine distributed generation could be feasible to serve for their own electric loads. Although there was opportunity, it was concluded that small wind was not necessarily the ideal technology for the Tribe for self-generation. Studies were also conducted to determine feasibility for long-term solar resource at the Mast 1049 location. Analysis deemed solar not commercially viable based on the energy assessment performed by Smart Energy Source, LLC (Appendix 2).
3.1 Wind Measurements
Wind monitoring at the Iowa Tribe project began in November 2011 with the installation of a single monitoring mast, designated Mast 0149. The proposed project area is located approximately 20-25 km to the northeast of the Mast 0149 Fallis location. The Iowa Tribe provided the data to AWS Truepower. Each data file contained 10-minute average wind speed, direction, and temperature records, along with their standard deviations.
3.2 Estimation of Long-Term Mean Wind Speed
AWS Truepower obtained historical wind speed data from several nearby potential reference stations operated by the National Weather Service (NWS) and assessed them for suitability as long-term references. In addition to these data sources, they also assessed data from the AWS Truepower WindTrends55 database. Their findings are listed below:

Iowa Tribe of Oklahoma
10
Energy Assessment Findings
Key Findings
1 The wind resource in the vicinity of the installed met mast near Fallis is not rigorous enough to support a project.
2 The wind resource in the new proposed project area is a class III, low wind resource. The wind resource is in the outer bounds of feasibility and the economics will be driven largely by the achievable power price for the project.
3 A high degree of uncertainty regarding the wind resource exists at the proposed site and additional on-site information should be obtained to verify the projections in the report.
Solas Energy Consulting US Inc. was retained by BKJ Solutions Inc., a tribal company of the Iowa Tribe of Oklahoma, to provide project management services and oversee the project feasibility study for the Iowa Tribe Wind Project. The technical project feasibility was conducted by a variety of consultants coordinated by Solas Energy Consulting US Inc. Each of those consultants was tasked with a specific technical area, and Solas worked with those consultants to develop cost assumptions for the project.
The cost for the full development of this project, in either the 20 MW or the 50 MW scenario, is
expected to be high. The typical project developer is willing to take a risk on the development
capital for the project if the project looks fairly feasible. The development costs are considered
'at-risk' capital, and the developer takes a project fee during the sale of the project from a third
party to take a satisfactory rate of return on that development risk capital.
A development budget was developed for this project in both the 20 MW and the 50 MW scenarios. The development budget includes the costs likely to be required to get the project ready for sale, and includes additional wind monitoring, land acquisition, interconnection queue studies, project permitting, preliminary engineering, legal, and consulting fees. The development budget was estimated to be as follows:
Estimations
Task 20 MW 50MW Land Work1 $ 260,000 $ 572,000 Meteorology2 $ 286,000 $ 416,000 Interconnection3 $ 175,000 $ 175,000 Permitting4 $ 440,000 $ 625,000
.

Iowa Tribe of Oklahoma
11
Engineering5 $ 240,000 $ 240,000 Legal Fees6 $ 500,000 $ 750,000 Consulting7 $ 120,000 $ 120,000
Total $2,021,000 $2,989,000
Reports were compiled for the Iowa Tribe by Smart Energy Source LLC (SES) certified energy professionals, Stillwater, Oklahoma. Information was provided to SES by the Iowa Tribe in regard to the Iowa Tribe Wind Project Report prepared by AWS Truepower for Johnson Controls dated March 27, 2013 and the Wind Study Report for the Iowa Tribe of Oklahoma Wind Project provided to the Bureau of Indian Affairs by Solas Energy Consulting U.S. Inc., dated June 26, 2013 (Appendix 3). This information was used to continue the analysis of the Tribe’s electricity consumption and load and determine the economic viability of stand-alone and utility grade wind and solar power generation systems. The Tribe’s connected meter loads as documented by Central Rural Electric Cooperative (Table 1, pg. 15) required a further energy assessment.
The objective of this report is to define the viability of alternative energy systems in relationship to the Iowa Tribe of Oklahoma’s historical electrical usage of individual meters and the aggregated load of all meters on the Central Rural Electric Cooperative’s electrical distribution grid.
Figure 3. Oklahoma Annual Wind Power at 50m-height
Interpretation
Research from the National Renewable Energy Laboratory for the Department of Energy maps
the Oklahoma annual wind power at 50-m height, which conclusively shows the Iowa Tribal
Iowa Tribe of Oklahoma
12
Complex has poor to marginal wind resource potential.
3.4 Assessment Resources
Facility and electric meter data for proposed project sites 1 and 2 was used to identify actual
aggregated load for contiguous and non-contiguous electrical meters located on Central Rural
Electric Cooperative’s distribution grid to provide base load, peak and operational electrical
use. Wind and solar characteristics used in the report were supplied in the two alternative
energy wind and solar data projects reports.
3.5 Assessment Constants
Current load profiles for the metered locations served by Central Rural Electric Cooperative’s
distribution system, January 2013 through December 2013.
Cost per watt for installed wind and solar systems are $3 per watt. The prices of solar systems
are typically less expensive (per unit) for larger systems than smaller systems (economy of
scale).
Typical residential cost for electrical generation by wind is $4 per watt produced/installed –
this cost is typically in the $5 to $6 range, based on research analysis of average cost across the
United States.
Typical, utility grade cost for electric generation by wind is $3 per watt. (large scale)
Typical residential cost for electrical generation by solar is $4 per watt produced/installed –
this cost is typically in the $7 to $9 range based on research analysis of the average cost across
the United States.
Typical utility grade cost for electrical generation by solar is $3 per watt. (large scale)
Capacity factor for wind is 37.4 percent (capacity factor is the difference from time of actual
use compared to full production) based on referenced report findings.
Capacity factor for solar is 94 percent – First year (capacity factor is the difference from time
of actual use compared to full production) based on referenced report findings.
The estimated cost of interconnection engineering study (KAMO Power), $50,000.
The estimated cost of interconnection substation (KAMO Power), $2,000,000.
The estimated cost of transmission line per mile (KAMO Power), $350,000. Potentially, more costs could be associated with infrastructure upgrades depending on the results of the Interconnection Engineering Study. The estimated avoided cost of power is $0.02 per kWh.
Iowa Tribe of Oklahoma
13
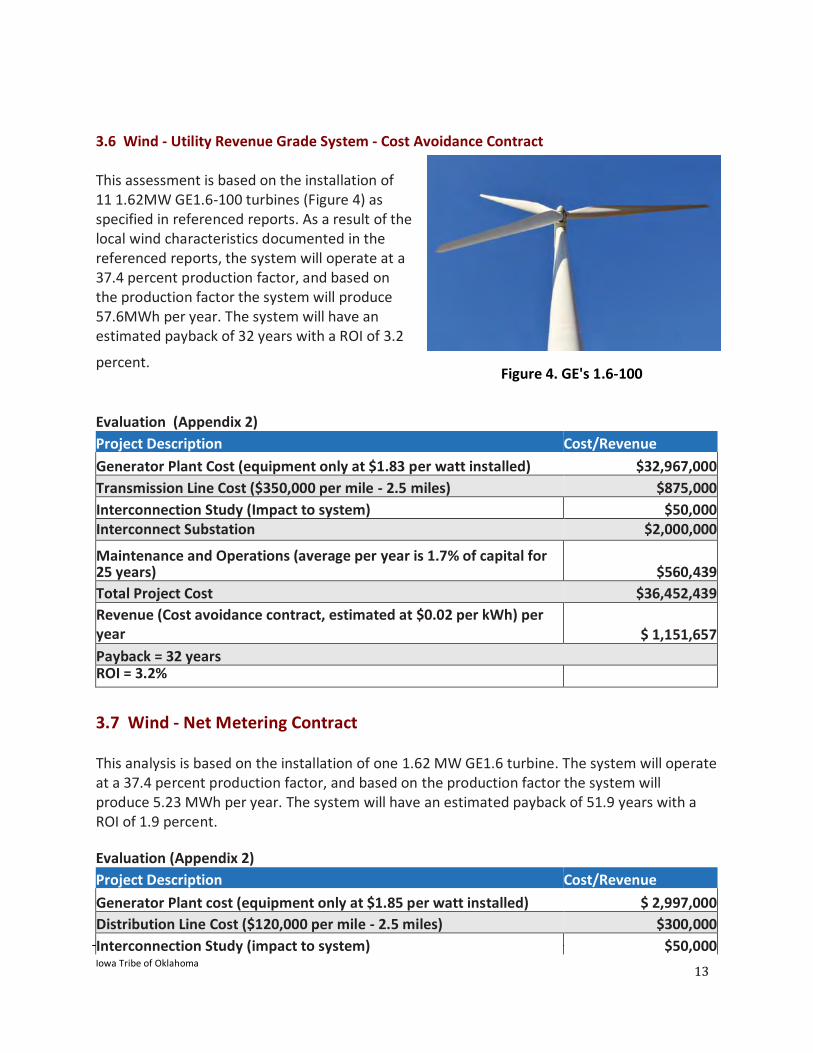
Figure 4. GE's 1.6-100 turbine
3.6 Wind - Utility Revenue Grade System - Cost Avoidance Contract This assessment is based on the installation of 11 1.62MW GE1.6-100 turbines (Figure 4) as specified in referenced reports. As a result of the local wind characteristics documented in the referenced reports, the system will operate at a 37.4 percent production factor, and based on the production factor the system will produce 57.6MWh per year. The system will have an estimated payback of 32 years with a ROI of 3.2
percent.
Evaluation (Appendix 2)
Project Description Cost/Revenue
Generator Plant Cost (equipment only at $1.83 per watt installed) $32,967,000
Transmission Line Cost ($350,000 per mile - 2.5 miles) $875,000
Interconnection Study (Impact to system) $50,000 Interconnect Substation $2,000,000
Maintenance and Operations (average per year is 1.7% of capital for 25 years) $560,439
Total Project Cost $36,452,439
Revenue (Cost avoidance contract, estimated at $0.02 per kWh) per year $ 1,151,657
Payback = 32 years ROI = 3.2%
3.7 Wind - Net Metering Contract
This analysis is based on the installation of one 1.62 MW GE1.6 turbine. The system will operate at a 37.4 percent production factor, and based on the production factor the system will produce 5.23 MWh per year. The system will have an estimated payback of 51.9 years with a ROI of 1.9 percent.
Evaluation (Appendix 2)
Project Description Cost/Revenue
Generator Plant cost (equipment only at $1.85 per watt installed) $ 2,997,000
Distribution Line Cost ($120,000 per mile - 2.5 miles) $300,000
Interconnection Study (impact to system) $50,000

Iowa Tribe of Oklahoma
14
Interconnection Substation $2,000,000
Maintenance and Operations (average per year is 4.7% of capital for 25 years) $50,949
Total Project Cost $5,397,949
Net Metering cost reduction contract
Payback = 51.9 years ROI = 1.9%
The cost to add a high voltage transmission line for the utility grade system ($875,000) or a
distribution line ($300,000) for a distributive generation option are cost prohibitive for the Iowa
Tribe. Combined with the additional infrastructure costs for a substation and the
interconnection study cost, the project is not economically viable. The CREC’s distributed
generation tariff for net metering for electricity generated under 100 kW,on the surface may
seem advantageous, however, the power generated by the Iowa Tribe fed back to the electric
grid isn’t significant enough when you compare the payback over 30 to 50 years.
3.7 Electricity Consumption and Load
The first step toward understanding whether renewable energy was a suitable option for the tribe was determining the Tribe's current energy usage. Both the profile of usage (seasonal
Distribution line from sub-station to Tribal Complex
Figure 5. CREC infrastructure in comparison to Iowa Tribe facilities.
Iowa Tribal Complex
Iowa Tribe of Oklahoma
15
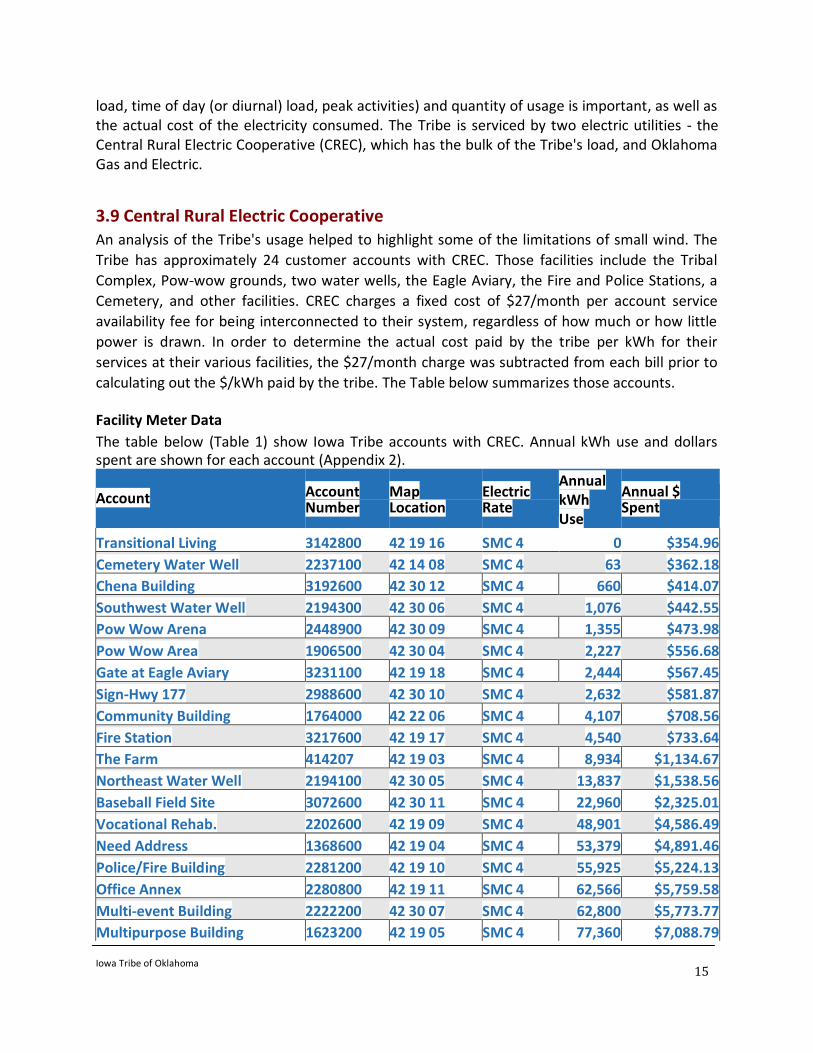
load, time of day (or diurnal) load, peak activities) and quantity of usage is important, as well as the actual cost of the electricity consumed. The Tribe is serviced by two electric utilities - the Central Rural Electric Cooperative (CREC), which has the bulk of the Tribe's load, and Oklahoma Gas and Electric.
3.9 Central Rural Electric Cooperative An analysis of the Tribe's usage helped to highlight some of the limitations of small wind. The
Tribe has approximately 24 customer accounts with CREC. Those facilities include the Tribal
Complex, Pow-wow grounds, two water wells, the Eagle Aviary, the Fire and Police Stations, a
Cemetery, and other facilities. CREC charges a fixed cost of $27/month per account service
availability fee for being interconnected to their system, regardless of how much or how little
power is drawn. In order to determine the actual cost paid by the tribe per kWh for their
services at their various facilities, the $27/month charge was subtracted from each bill prior to
calculating out the $/kWh paid by the tribe. The Table below summarizes those accounts.
Facility Meter Data
The table below (Table 1) show Iowa Tribe accounts with CREC. Annual kWh use and dollars spent are shown for each account (Appendix 2).
Account Account Map Electric Annual kWh Use
Annual $ Number Location Rate Spent
Transitional Living 3142800 42 19 16 SMC 4 0 $354.96
Cemetery Water Well 2237100 42 14 08 SMC 4 63 $362.18
Chena Building 3192600 42 30 12 SMC 4 660 $414.07
Southwest Water Well 2194300 42 30 06 SMC 4 1,076 $442.55
Pow Wow Arena 2448900 42 30 09 SMC 4 1,355 $473.98
Pow Wow Area 1906500 42 30 04 SMC 4 2,227 $556.68
Gate at Eagle Aviary 3231100 42 19 18 SMC 4 2,444 $567.45
Sign-Hwy 177 2988600 42 30 10 SMC 4 2,632 $581.87
Community Building 1764000 42 22 06 SMC 4 4,107 $708.56
Fire Station 3217600 42 19 17 SMC 4 4,540 $733.64
The Farm 414207 42 19 03 SMC 4 8,934 $1,134.67
Northeast Water Well 2194100 42 30 05 SMC 4 13,837 $1,538.56
Baseball Field Site 3072600 42 30 11 SMC 4 22,960 $2,325.01
Vocational Rehab. 2202600 42 19 09 SMC 4 48,901 $4,586.49
Need Address 1368600 42 19 04 SMC 4 53,379 $4,891.46
Police/Fire Building 2281200 42 19 10 SMC 4 55,925 $5,224.13
Office Annex 2280800 42 19 11 SMC 4 62,566 $5,759.58
Multi-event Building 2222200 42 30 07 SMC 4 62,800 $5,773.77
Multipurpose Building 1623200 42 19 05 SMC 4 77,360 $7,088.79

Iowa Tribe of Oklahoma
16
Eagle Aviary 2617100 42 19 15 SMC 4 79,120 $7,085.02
Youth Shelter 1777000 42 19 06 SMC 4 86,564 $7,842.92
White Cloud 1912100 42 19 08 SMC 4 135,520 $12,148.90
Child Development Center 2427701 42 19 13 SMC 4 138,840 $12,267.97
Totals 865,810 $82,863.21
Table 1. Iowa Tribal Enterprises Accounts Facility Meter Data
As illustrated in the Table above, the annual kWh use and dollars spent does not justify the
cost of pursuing small wind for the Tribal facilities, even taking into account the two highest
loads of the White Cloud and Child Development Center.
Phase 3. The Tribe was spending in excess of $90,000 a year in electric utility bills. A feasibility study for utility scale wind on Tribal lands sparked a strong interest in exploring whether small wind could help the Tribe not only reduce third party utility costs, but also help to build a sustainable development model for the future. As information was being collected and analyzed for the utility feasibility project, additional information was collected and analysis was performed to determine the feasibility of self-generation.
The project was extended to evaluate the Iowa Tribal Complex as a small wind distribution generation option. Research from the National Renewable Energy Laboratory for the DOE maps the Oklahoma annual wind power at 50-m height, which conclusively shows the tribal complex has poor to marginal wind resource potential.
Iowa Tribe of Oklahoma
17
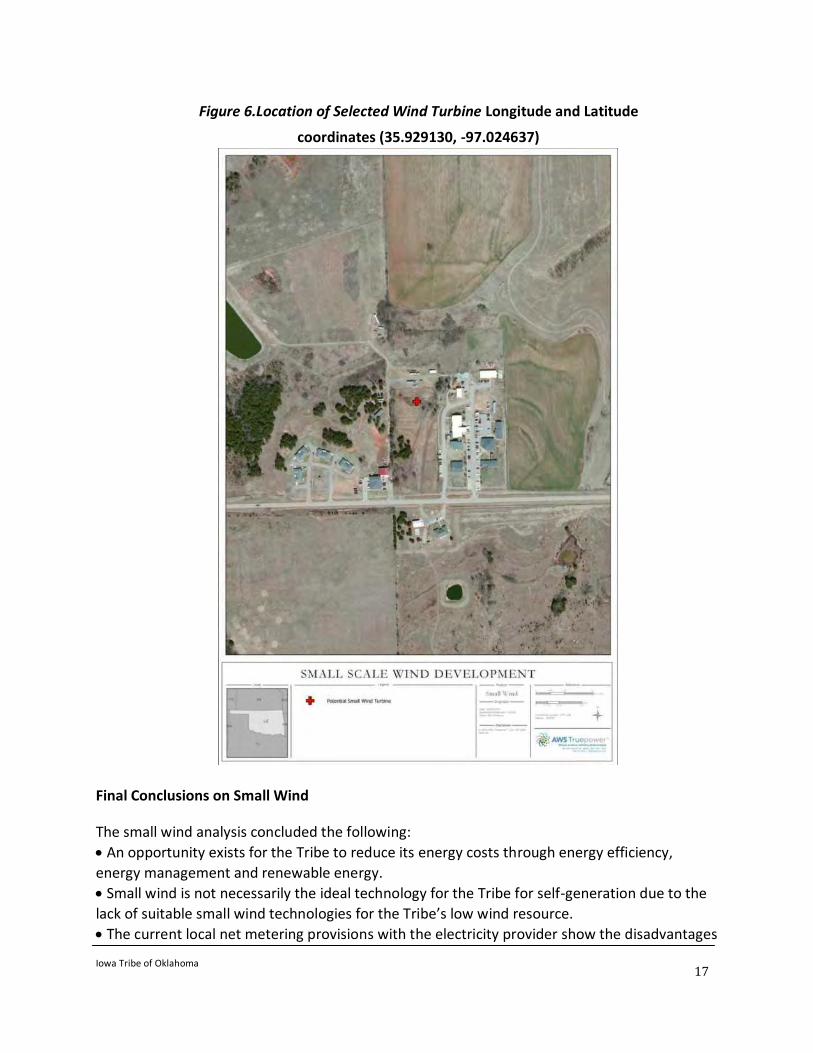
Final Conclusions on Small Wind
The small wind analysis concluded the following:
An opportunity exists for the Tribe to reduce its energy costs through energy efficiency,
energy management and renewable energy.
Small wind is not necessarily the ideal technology for the Tribe for self-generation due to the
lack of suitable small wind technologies for the Tribe’s low wind resource.
The current local net metering provisions with the electricity provider show the disadvantages
Figure 6.Location of Selected Wind Turbine Longitude and Latitude
coordinates (35.929130, -97.024637)

Iowa Tribe of Oklahoma
18
of wind generation with their policies for monthly energy generation true-ups, as well as
limitations on size of small wind turbines allowed.
3.11 NEPA, FAA, Biological and Environmental Studies
In order to determine the feasibility of a wind project at the proposed location, the Iowa Tribe commissioned environmental consultant Ecology and Environment, Inc. (E&E) to perform a critical issues analysis (CIA (Appendix 2)). The scope of the CIA was to perform a detailed desktop review of the region to analyze potential project constraints that need to be factored into the siting and final development plan for the wind project. This CIA reviewed multiple issues including:
Threatened and endangered species
Bird and Bat Species
Wetlands/Water Resources
Geology/Soils
Historic Sites/Cultural Resources
Public Lands and Land Use
Federal Aviation Administration (FAA) Airport Locations
The CIA also included a permitting matrix outlining required permits or approvals, the responsible agency, the requirements and the expected time frame. The most prominent environmental issue identified within the CIA was the potential impact to avian species. This includes species protected by the Endangered Species Act, Migratory Bird Treaty Act, and Bald and Golden Eagle Protection Act. Although potential for impacts to avian species exists, no critical issues were identified that should prevent construction of a wind energy facility within the area reviewed in the CIA.
4 Lessons Learned
Since 2001 the Iowa Tribe has had a long term vision of energy self-sufficiency with a focus on economic development and resource development. This vision aligns with the Tribe’s environmental philosophy of taking what you need from the Earth without impacting the ability of future generations to meet there needs. In other words, sustainability. Utilizing BJK Solutions, Inc., an Iowa Tribe company, to assist with their energy planning, the Tribal leadership has continued their commitment to the energy plan. As a small tribe, however, there are issues which occasionally impede the ability to perform assignments in a timely and effective manner.
There are strengths and opportunities for smaller tribes, however, the repetitive themes of lack of in-house technical knowledge and limited human and financial resources are formable challenges. Three areas which contributed to delays for the completion of tasks under the grant’s objectives are identified below.
Tribal Capacity- Being able to maintain and grow capacity is a constant challenge, especially for knowledge retention. During the length of the grant, beginning in 2010, the Tribe has developed remarkable skills in executing contracts and project management. They have also made significant

Iowa Tribe of Oklahoma
19
technological advancements for sharing information, storing data, and developing electronic files for access, which are essential tools for effective grant management.
The ongoing monitoring and oversight of grant activities with multiple consultants can be a significant task. The Tribe acknowledges that hiring the right employees with strong project management and business experience is key to working on complex and technical energy grants. There will always be unexpected circumstances that arise, but having a strong business plan that accounts for uncertainties that might impact a project is something the Tribal administration continues to put into place.
Technical and Operational
Lack of technical or operational experience put too much dependency on the consultants, in some cases leaving the Tribe one-step removed from the day-to-day operations of the project. Hiring an experienced energy manager midway through the project brought to the attention of the Tribe that this leadership role was imperative in addressing the Tribe’s energy needs and future grant projects. Without technical oversight, equipment at the first site was compromised and vandalized impacting the data collection for wind speed analysis. Although the wind feasibility assessment and other analysis determined wind not economically feasible, the integrity of the completed work tasks strengthens the final conclusions with verification of the actual data sets that were completed despite the setbacks.
Not having a fundamental understanding of energy matters and relying on the assumptions of consultants was another issue that brought about change in how the Tribe moves forward. Tasks that might have been overlooked or issues left unresolved were not due to negligence but in many cases not knowing the right questions to ask. Staff is now encouraged to take advantage of the DOE’s webinars, online database, and technical staff to help review reports. These are ways to increase industry and technical knowledge within the Tribe as they move toward a sustainable energy future.
Human Resources
Personnel issues impacted the grant on several levels. The project manager and other employees left their employment with the Tribe causing gaps in knowledge transfer and the overall understanding of assignments and expectations within the Tribal government. Add to this, working with multiple consultants. The lack of an integrated approach with multiple stakeholders caused unforeseen delays and project setbacks. For example, it was the Tribe’s responsibility and not the consultants’ to make sure the environmental assessment and procedures were compliant with the government agency’s guidelines for installing and uninstalling the MET towers and SoDAR units on the Tribe’s land. Without a project lead and internal team to address all aspects of the grant, tasks such as these were put at risk due to a lack of understanding of the job at hand. The hiring of energy consultant Michelle Holiday allowed the Tribe to move forward in a much more seamless effort.
It should be noted that Michelle Holiday has an extensive professional background in energy and is a strong advocate for Tribal economic development and energy sustainability. As an enrolled member of the Iowa Tribe of Oklahoma, she brings not only her expertise in energy to the Wind Resource on Tribal Land project but her inherent understanding of Tribal relations. Under her leadership the Tribe was able to fulfill the requirements of the grant and invest in a sustainable energy future.

Iowa Tribe of Oklahoma
20
5 Next Steps
Sustainability
The Wind Resource on Tribal Land project was an ambitious task in analyzing the Tribe’s
existing energy policies and determining how they can be improved. The project has also
provided direct information that will make an immediate and lasting difference in the way the
Tribe uses energy helping them to build a sustainable energy future.
Energy Sustainability is the concept that energy can be provided and consumed without
impacting the ability of future generations to meet their needs. Renewable energy is one
avenue to sustainability; however, energy efficiency is also an effective method and oftentimes
faster and lower costs than implementing renewable energy. Integrating Tribal renewable
energy generation is an exciting and interesting way to reduce the Tribe’s carbon footprint and
move toward sustainability from an electricity perspective and a cultural standpoint. Native
American communities, and Native Peoples of the world, have relied upon continuous natural
cycles throughout their history on the Earth. Shifting to renewable energy sources and energy
efficiency has environmental, cultural, and economic motivations that the Tribe has and carries
forward.
The first step on the ladder to energy sustainability is understanding the Tribe’s energy usage and identifying areas of waste and opportunities for shedding load or cutting usage without impacting normal business, such as replacing light bulbs, aging appliances, windows, etc. with more energy efficient options, and applying load shifting where possible. When normal operations have been optimized, then alternatives need to be examined where small investments can create long term energy savings, such as looking at processes and systems, and re-designing systems toward sustainability.
6 Key Findings
Given the existing renewable energy costs compared to the existing conventional power
system, there are opportunities for renewable energy to provide net value to the Iowa
Tribe of Oklahoma.
Analysis of wind speed data concluded that wind resources in the proposed project sites
were not likely to be sufficient for a utility-scale wind project.
Small wind does not appear to be an attractive option at this time due to the inefficient
load of the Tribal complex proposed for the small wind site.
In discussions with the Iowa Tribe, it was indicated that the Tribe does not have the
financial liquidity or the desire to act as the developer on this project or to front these
funds for the development of the project.
Iowa Tribe of Oklahoma
21
As a result of the project the Iowa Tribe of Oklahoma is motivated to analyze their
existing energy polices and individual energy use to determine how they can be
improved to help build a sustainable energy future.
7 Conclusions and Recommendations
7.1 Conclusions
The overall objective of the Wind Resource on Tribal land project was to conduct a wind resource assessment in order to quantify the wind resource potential available on the Iowa Tribe’s land. Wind resource assessment data determined that there was insufficient wind speed for a utility-scale wind project on Tribal land.
Further wind speed assessments were conducted to determine the feasibility of small wind for the Tribal complex. The analysis shows that the load did not warrant the cost of self-generation when compared to the annual kWh use and dollars spent with the local utility provider.
There are still reasons to pursue renewable energy but the Tribe is determined at this time to focus its efforts on their long term vision of energy efficiency.
7.2 Recommendations
1. Develop an Energy policy that addresses energy conservation objectives, technology upgrades and initiatives.
2. Create an Energy Team consisting of an experienced energy manager to continue exploring alternative energy options and to deploy renewable energy technology where possible.
3. Develop comprehensive energy initiatives and disseminate information to Tribal members encouraging them to reduce their energy usage and help build a sustainable energy future for the Iowa Tribe of Oklahoma.
4. Meet with CREC representatives to review energy efficiency report’s recommendations.
5. Consider applying for a U.S. Department of Energy grant for the implementation of renewable energy and energy efficiency technologies on tribal lands for the implementation of energy efficiency technologies to reduce energy provided by CREC.

Iowa Tribe of Oklahoma
22
Attachments and Appendices – List of Reports
Appendix 1. Energy Production Summary, AWS TruePower, March 2013 Energy and solar assessments and analysis for proposed wind and solar project
Appendix 2. Energy Assessment and Energy Efficiency Reports, Smart Energy Source, LLC
Appendix 3. Final Narrative SF-425 Wind Study Report (Submitted to Bureau of Indian
Affairs), Solas Energy Consulting US Inc., June 2013 Includes Ecology and Environment (E&E) critical issues analysis
Appendix 4. Commercial Energy Analysis, Smart Energy Source LLC, August 2014
Information comparing economic viability of stand-alone and utility grade wind and solar power generation systems when compared to Iowa Tribe of Oklahoma’s connected meter loads as documented by local utility
Appendix 5. DOE Iowa Tribe of Oklahoma Energy Program Review, Michelle Holiday, Power Point Presentation, March 2014
CONFIDENTIALITY NOTICE: This document is intended only for the use of the individual or entity to which it is addressed and may contain confidential information which is privileged by law. If you are not the intended recipient, you are hereby notified that any disclosure, copying, distribution, or the taking of any action in reliance on the contents of this information is strictly prohibited. If you have received this transmission in error, please notify the sender immediately and destroy these documents.
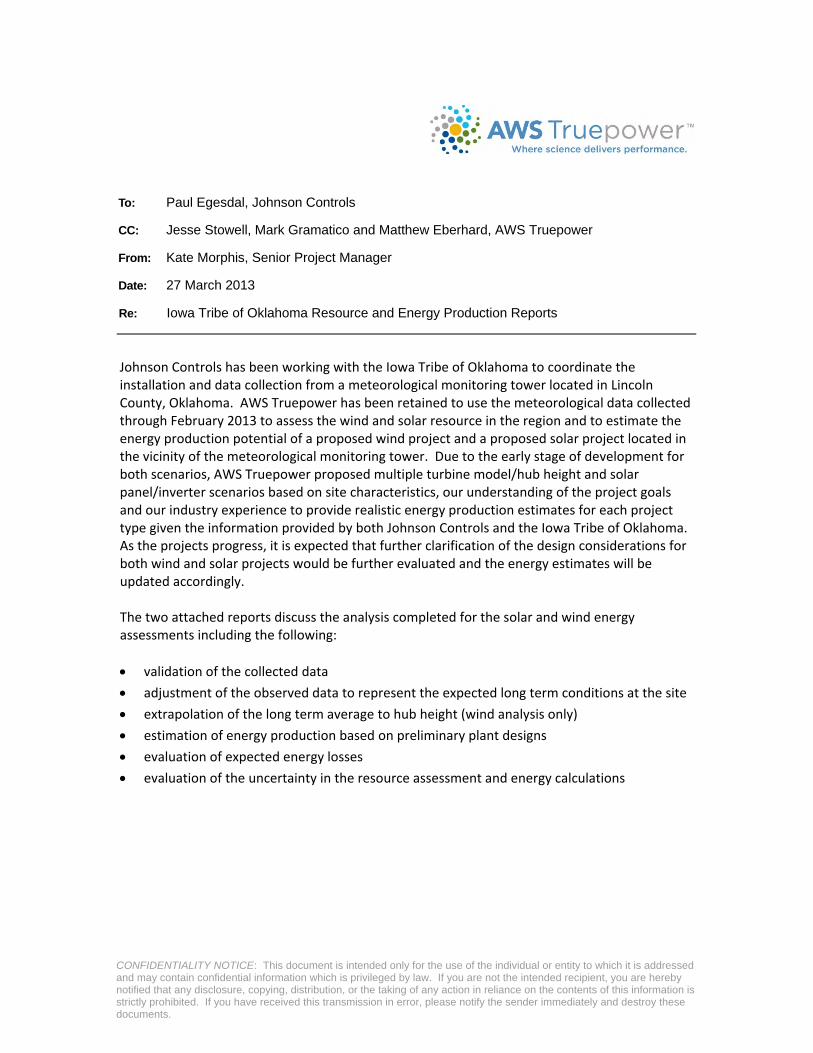
To: Paul Egesdal, Johnson Controls
CC: Jesse Stowell, Mark Gramatico and Matthew Eberhard, AWS Truepower
From: Kate Morphis, Senior Project Manager
Date: 27 March 2013
Re: Iowa Tribe of Oklahoma Resource and Energy Production Reports
Johnson�Controls�has�been�working�with�the�Iowa�Tribe�of�Oklahoma�to�coordinate�the�installation�and�data�collection�from�a�meteorological�monitoring�tower�located�in�Lincoln�County,�Oklahoma.��AWS�Truepower�has�been�retained�to�use�the�meteorological�data�collected�through�February�2013�to�assess�the�wind�and�solar�resource�in�the�region�and�to�estimate�the�energy�production�potential�of�a�proposed�wind�project�and�a�proposed�solar�project�located�in�the�vicinity�of�the�meteorological�monitoring�tower.��Due�to�the�early�stage�of�development�for�both�scenarios,�AWS�Truepower�proposed�multiple�turbine�model/hub�height�and�solar�panel/inverter�scenarios�based�on�site�characteristics,�our�understanding�of�the�project�goals�and�our�industry�experience�to�provide�realistic�energy�production�estimates�for�each�project�type�given�the�information�provided�by�both�Johnson�Controls�and�the�Iowa�Tribe�of�Oklahoma.��As�the�projects�progress,�it�is�expected�that�further�clarification�of�the�design�considerations�for�both�wind�and�solar�projects�would�be�further�evaluated�and�the�energy�estimates�will�be�updated�accordingly.��The�two�attached�reports�discuss�the�analysis�completed�for�the�solar�and�wind�energy�assessments�including�the�following:��x validation�of�the�collected�data�x adjustment�of�the�observed�data�to�represent�the�expected�long�term�conditions�at�the�site�x extrapolation�of�the�long�term�average�to�hub�height�(wind�analysis�only)�x estimation�of�energy�production�based�on�preliminary�plant�designs�x evaluation�of�expected�energy�losses�x evaluation�of�the�uncertainty�in�the�resource�assessment�and�energy�calculations�
��
463�NEW�KARNER�ROAD�|�ALBANY,�NY�12205�awstruepower.com�|�[email protected]��
�
�
�
�
�
�
�
�
�
�
�
�
�
�
�
�
�
�
�
�
�
�
�
�
�
�
� �
CLASSIFICATION
CONFIDENTIAL�
LINCOLN�AND�PAYNE�COUNTIES,�OKLAHOMA
FOR�THE�IOWA�TRIBE�OF�OKLAHOMAWIND�PROJECT
�
ENERGY�PRODUCTION�SUMMARY MARCH�27,�2013�
PREPARED�FOR�JOHNSON�CONTROLS�
Calibrated� Assessment� of� the�Wind� Resource� and� Energy�Production�Using�the�SiteWind�System�
� Page�ii
�
� � �
Energy�Production�Summary�
Iowa�Tribe�of�Oklahoma,�Johnson�Controls,�March�27,�2013
DISCLAIMER�
Acceptance�of�this�document�by�the�client� is�on�the�basis�that�AWS�Truepower� is�not� in�any�way�to�be�held� responsible� for� the�application�or�use�made�of� the� findings�and� that� such� responsibility� remains�with�the�client.�
�
KEY�TO�DOCUMENT�CLASSIFICATION�
STRICTLY�CONFIDENTIAL� For�recipients�only�
CONFIDENTIAL� May�be�shared�within�client’s�organization�
AWS�TRUEPOWER�ONLY� Not�to�be�distributed�outside�AWS�Truepower�
CLIENT’S�DISCRETION� Distribution�at�the�client’s�discretion�
FOR�PUBLIC�RELEASE� No�restriction�
�
�
�
DOCUMENT�CONTRIBUTORS�
AUTHOR� SUPPORTING�AUTHOR(S)� REVIEWER(S)�
Matthew�Eberhard�Senior�Meteorologist�
David�Stimple�Senior�Modeling�Specialist�
Mike�Markus�Chief�Meteorologist�
�
�
DOCUMENT�HISTORY�
ISSUE� DATE� SUMMARY�
A� 27�March�2013� Initial�Report�
�
� �

� Page�iii
�
� � �
Energy�Production�Summary�
Iowa�Tribe�of�Oklahoma,�Johnson�Controls,�March�27,�2013
TABLE�OF�CONTENTS��1.��Introduction� 1�
2.��Wind�Measurements� 1�
3.��Estimation�of�LongͲTerm�Mean�Wind�Speed� 2�
4.��Estimation�of�LongͲTerm�Energy�Production� 2�
5.��Uncertainty�Estimate� 5�
6.��Summary� 5�
Appendix�–�Alternate�Energy�Production�Scenarios� 11�
�
�
�
� Page�1
�
� � �Iowa�Tribe�of�Oklahoma,�Johnson�Controls,�March�27,�2013
Energy�Production�Summary�
1.��INTRODUCTION�
AWS�Truepower,�LLC,�was� retained�by� Johnson�Controls� to�evaluate� the� longͲterm�wind� resource�and�energy�production�potential�of� the�proposed� Iowa�Tribe�of�Oklahoma�Wind�Project,� located� in�northͲcentral�Oklahoma,�about�50�km�to�the�northeast�of�Oklahoma�City,�and�110�km�westͲsouthwest�of�Tulsa.�This�report�presents�the�results�of�our�analysis�and�briefly�describes�the�methods�used�to�develop�the�wind�resource�and�energy�estimates.�
2.��WIND�MEASUREMENTS�
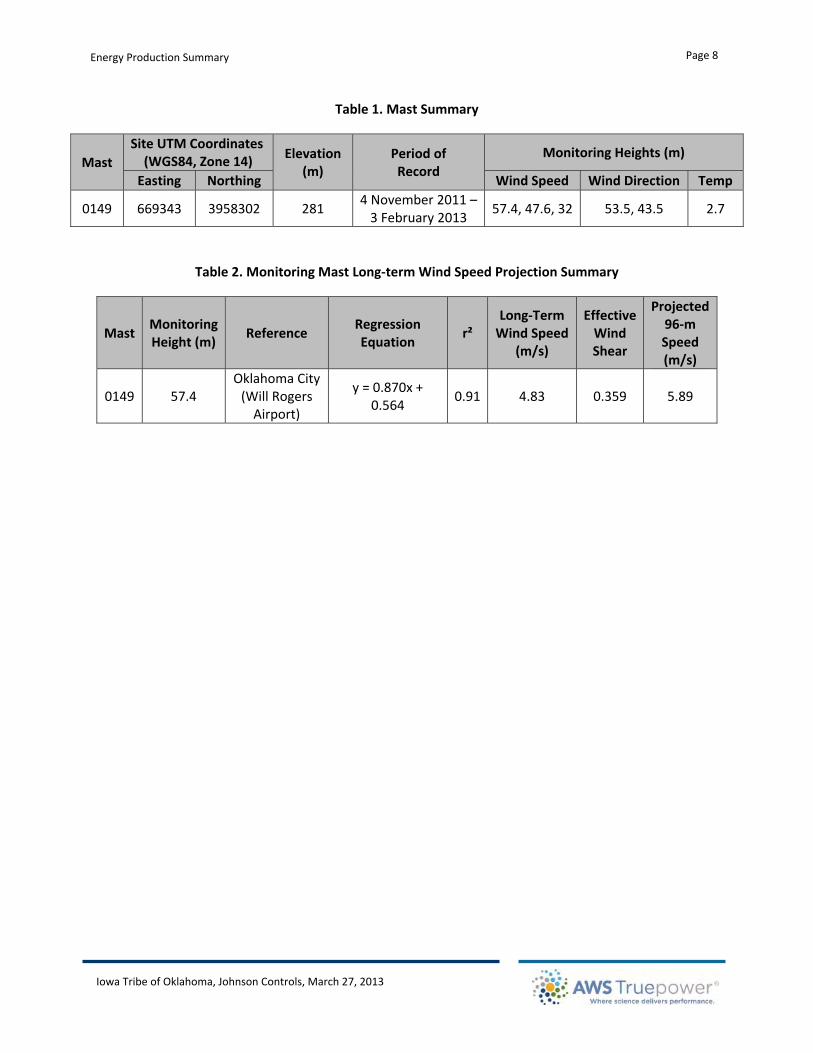
Wind�monitoring�at�the�Iowa�Tribe�of�Oklahoma�project�began�in�November�2011�with�the�installation�of�a�single�monitoring�mast,�designated�Mast�0149.��The�mast�remains�in�operation.�Table�1�presents�basic�information�about�the�mast�including�its�geographic�coordinates,�elevation,�period�of�record,�and�sensor�heights.� It� should�be�noted� that� the�proposed�project�area� is� located�approximately�20Ͳ25�km� to� the�northeast�of� the�Mast�0149� location.� � Johnson�Controls�provided� the�data� to�AWS�Truepower� in� their�raw�binary� format� via� email.� Each�data� file� contained� 10Ͳminute� average�wind� speed,� direction,� and�temperature�records,�along�with�their�standard�deviations.�
The�observed�mean�wind�speed�at�Mast�0149� is�4.94�m/s� (57.4�m).�The�annualized�mean�wind�speed,�which�takes� into�account�repeated�months� in�the�data�record�and�weights�each�calendar�month�by� its�number�of�days,�was�4.93�m/s.�The�observed�wind�shear�exponent,�which�represents�the�rate�of�wind�speed� increase� with� height� above� ground� according� to� the� power� law,� was� 0.503.� The� shear� was�calculated�from�the�mean�wind�speeds�at�the�highest�and�lowest�monitoring�levels�based�on�concurrent�valid� records�at�both�heights.�Only�wind� speeds�greater� than�4�m/s,� the� range�of� interest� for�energy�production,�were�used�in�the�calculation.�
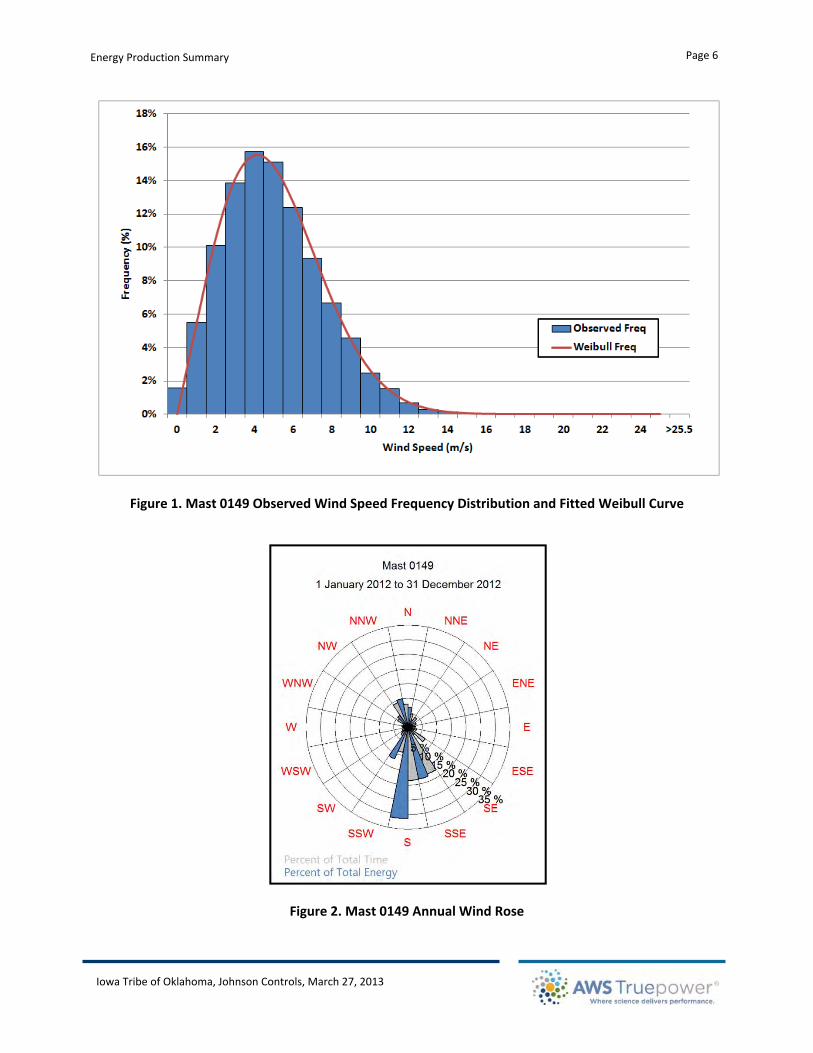
The�Weibull� function� is� an� analytical� curve� that� describes� the�wind� speed� frequency� distribution,� or�number�of�observations�in�specific�wind�speed�ranges.�Its�two�adjustable�parameters�allow�a�reasonably�good�fit�to�a�wide�range�of�actual�distributions.�A�is�a�scale�parameter�related�to�the�mean�wind�speed�while�k�controls�the�width�of�the�distribution.�Values�of�k�typically�range�from�1�to�3.5,�the�higher�values�indicating� a� narrower� distribution.� The� observed� k� value�was� 2.09� (57.4�m)� at�Mast� 0149,�which� is�indicative�of�a�somewhat�variable�wind�resource�with� few�high�wind�events.�Figure�1�contains�a�chart�showing�the�observed�frequency�distribution�and�the�fitted�Weibull�curve�for�Mast�0149.�
The�directional�distribution�of�the�wind�resource�is�an�important�factor�to�consider�when�designing�the�wind� project� to�minimize� the�wake� interference� between� turbines.� � An� annual�wind� frequency� and�energy�distribution�by�direction�plot�(wind�rose)�for�the�onsite�mast� is�presented� in�Figure�2.�The�wind�rose�indicates�that�the�prevailing�wind�direction�is�south.���
� Page�2
�
� � �Iowa�Tribe�of�Oklahoma,�Johnson�Controls,�March�27,�2013
Energy�Production�Summary�
3.��ESTIMATION�OF�LONGͲTERM�MEAN�WIND�SPEED�
We�obtained�historical�wind�speed�data� from�several�nearby�potential�reference�stations�operated�by�the� National�Weather� Service� (NWS)� and� assessed� them� for� suitability� as� longͲterm� references.� In�addition�to�these�data�sources,�we�also�assessed�data�from�our�windTrends1�database.��
Linear� regression�equations�were�established�using�concurrent�daily�mean�wind� speeds�at�Mast�0149�and� each� potential� reference� source.� Following� reviews� of� the� correlations� and� the� time� series� of�reference� station� annual�mean� speeds,�we� selected� the�Oklahoma� City� (Will� Rogers�Airport)� surface�station�to�estimate�the�longͲterm�annual�mean�speed�at�Mast�0149.�Substitution�of�the�annualized�mean�wind�speed�at�the�reference�station�into�the�regression�equation� listed�in�Table�2�yields�a�57.4Ͳm�longͲterm�mean�wind�speed�of�4.83�m/s�at�Mast�0149.��
Extrapolation�of�this� longͲterm�mean�wind�speed�using�phased�reductions�to�the�observed�wind�shear�exponent�as�a�function�of�height�yields�a�mean�wind�speed�of�5.89�m/s�at�the�96Ͳm�hub�height.�It�should�be� noted� that� significant� uncertainty� is� present� in� this� extrapolation� process� in� recognition� of� the�characteristics�observed�at� this� tower�and� the�substantial�elevation�difference�between�mast� top�and�hub�height.��A�summary�of�the�climate�adjustments�and�extrapolation�is�included�in�Table�2.�
4.��ESTIMATION�OF�LONGͲTERM�ENERGY�PRODUCTION�
The�energy�production�of�the�proposed�Iowa�Tribe�of�Oklahoma�Wind�Project�was�estimated�using�the�openWind®� software.� openWind� was� developed� by� AWS� Truepower� as� an� aid� for� the� design,�optimization,� and� assessment� of� wind� power� projects.2� The� primary� input� is� a� wind� resource� grid�generated� by� a� numerical�wind� flow�model,� in� this� case� the� SiteWind®� system.�Other� inputs� include�elements� of� the� project� design� such� as� the� turbine� locations,� hub� height,� power� curve,� and� thrust�coefficients,� as� well� as� the� mast� data.� The� SiteWind� system� and� openWind� software� and� their�applications�in�this�project�are�briefly�described�below.�
The�SiteWind�System�Numerical�wind�flow�models�are�used�to�calculate�the�wind�resource�variation�across�a�project�area�due�to� changes� in� terrain�and� surface� roughness.�AWS�Truepower�has�developed� the�SiteWind� system� to�perform� these�calculations.�SiteWind�employs�both�mesoscale�and�microscale�models� to�simulate� the�wind�climate�over�a�wide�range�of�scales.�The�mesoscale�model�assesses�regional�climate�conditions�and�simulates� complex� meteorological� phenomena� such� as� katabatic� (downslope)� mountain� winds,�channeling�through�mountain�passes,�lake�and�sea�breezes,� lowͲlevel�jets,�and�temperature� inversions.�The� microscale� model� accounts� for� the� localized� influences� of� topography� and� surface� roughness�changes�and�produces�a�detailed�wind�resource�map�and�grid.�As�a�final�step,�the�predicted�speed�and�direction�are�adjusted�with�onͲsite�data�from�masts�within�the�project�area.�This�method�has�been�found�to�be�more�accurate�on�the�whole�than�microscale�wind�flow�models�on�their�own.3�
������������������������������������������������������������1�windTrends�a�simulated�hourly� time�series�created�by�AWS�Truepower�using�an�atmospheric�model.� It� is�similar� to� reanalysis�data,�but� is�computed�at�a�finer�spatial�resolution�(20�km)�and�relies�on�a�fixed�set�of�rawinsonde�observational�data.�The�model�output�can�be�interpolated�to�the�exact�location�of�a�meteorological�mast.�For�this�analysis,�the�model�output�was�interpolated�to�the�location�of�Mast�0149.�
2�openWind�–�Theoretical�Basis�and�Validation,�Version�1.3,�AWS�Truewind,�LLC,�April�2010.�
3�Beaucage,�Philippe�and�Brower,�Michael�C,�Wind�Flow�Model�Performance�–�Do�More�Sophisticated�Models�Produce�More�Accurate�Wind�Resource�Estimates?,�6�February�2012��
� Page�3
�
� � �Iowa�Tribe�of�Oklahoma,�Johnson�Controls,�March�27,�2013
Energy�Production�Summary�
The�mesoscale�model�used�for�this�analysis�was�the�Mesoscale�Atmospheric�Simulation�System�(MASS4),�a� nonͲhydrostatic�weather�model� used� in� commercial� and� research� applications.�MASS�was� run� in� a�series� of� nested� grids,�with� the� innermost� grid� having� a� spatial� resolution� of� 1.2� km.�Using� regional�weather�data,�MASS�simulated�historical�weather�conditions� for�a� representative�sample�of�days.�The�MASS�output�was�then�coupled�to�WindMap�–�a�massͲconserving�model�–�which�was�run�on�a�grid�scale�of�50�m.5�Finally,�the�output�of�WindMap�was�adjusted�to�the�wind�speed�and�direction�distribution�at�Mast� 0149.� This� last� step�was� performed�within� openWind,� as� described� below.� The� resulting�wind�resource�map�is�shown�in�Figure�3.�
openWind��Once�the�wind�resource�model�has�been�run,�the�resource�grid�file�is�imported�into�openWind�to�define�the�wind�resource�for�the�project�area.�The�Weibull�parameters� in�the�file�are�converted�to�directional�speedͲup� ratios� relating� the� wind� speed� at� each� grid� point� to� the� speed� at� a� reference� mast.� By�associating�the�model�data�to�a�wind�speed�histogram�file�for�the�reference�mast,�the�program�is�able�to�adjust�the�modeled�speed�distribution�to�the�true�speed�distribution�observed�at�a�point.�This�method�usually� produces� a�more� accurate� estimate� of� the� energy� production� than� relying� on� the�modeled�distributions�alone.�
A�number�of�reference�masts�can�be�used�to�reduce�errors�in�the�predicted�spatial�variation�of�the�wind�resource�across�the�project�area.�Conventionally,�the�project�area�is�broken�up�into�subͲregions,�each�of�which� is�associated�with�a�different�mast�using�the�distanceͲweighted� interpolation�between�masts,�as�previously�described.�This�avoids�discontinuities�in�wind�speeds�across�the�boundaries�of�areas�assigned�to�different�masts�and�produces�a�more�realistic�picture�of� the�spatial�variation�of� the�wind�resource.�Within�openWind,�the�adjusted�wind�resource�grid�is�divided�into�subͲregions�associated�with�different�masts� to�capture�variations� in� the�observed�speed� frequency�distribution,�although� the�corresponding�impact�on�energy�production�estimates�is�usually�relatively�small.�
AWS�Truepower�uses� the�openWind�Deep�Array�Wake�Model� (DAWM)� to� calculate�wake� losses.�This�model� actually� contains� two� separate� wake�models� operating� independently.� The� first� is� the� Eddy�Viscosity�model,�which� is�based�on� the� thinͲshearͲlayer�approximation�of� the�NavierͲStokes�equations�assuming�axisymmetric�wakes�of�Gaussian�crossͲsectional�form,�as�originally�postulated�by�Ainslie.6�The�model� equations� ensure� that� momentum� and� mass� conservation� are� observed� simultaneously.� As�inputs,�the�wake�model�requires�the�ambient�turbulence� intensity�at�hub�height,�which� influences�the�initial� wake� deficit� behind� each� turbine� and� the� rate� of� wake� dissipation;� the� speed� and� direction�frequency�distribution,�based�on�a�wind� resource�grid�and�associated�mast� files;� the� locations�of� the�turbines;�and�the�turbine�thrust�coefficient�curves.�Validation�of�the�openWind�Eddy�Viscosity�model�is�described�elsewhere.2�
In� response� to�evidence� that� conventional�wake�models� like� the�Eddy�Viscosity�model�underestimate�wake� losses� in� deep� (multiͲrow)� arrays� of� wind� turbines,� especially� offshore,� AWS� Truepower�implemented� a� second�model� designed� to� handle� such� situations.� This�model� is� loosely� based� on� a�
������������������������������������������������������������4�Developed� for�NASA,� the�US�Air�Force,�and�commercial�and� research�applications,�MASS� is� similar� to�and�has�been�verified�against�other�mesoscale�weather�models�such�as�MM5�and�WRF.�For�further�information,�see�http://www.meso.com/mass.html.��
5�WindMap,�developed�by�AWS�Truepower,�is�a�massͲconserving�model�that�adjusts�an�initial�wind�field,�here�supplied�by�MASS,�in�response�to�local� variations� in� topography� and� surface� roughness.� See,� e.g.,� Michael� Brower,� “Validation� of� the� WindMap� Model,”� Proceedings� of�WindPower�1999,�American�Wind�Energy�Association,�June�1999.�
6�Ainslie,�J.F.,�1988,�Calculating�the�flowfield�in�the�wake�of�wind�turbines.”�Journal�of�Wind�Engineering�and�Industrial�Aerodynamics,�27.�Pages�213Ͳ224.�

� Page�4
�
� � �Iowa�Tribe�of�Oklahoma,�Johnson�Controls,�March�27,�2013
Energy�Production�Summary�
theory�developed�by�Frandsen,7�who�postulated�that�the�effect�of�a�deep�array�of�wind�turbines�on�the�atmosphere� could� be� represented� as� a� region� of� increased� surface� drag,� represented� by� a� surface�roughness� length.�Where� the� wind� first� impinges� on� the� array,� an� internal� boundary� layer� (IBL)� is�created,�within�which�the�wind�profile�is�determined�by�the�array�roughness�rather�than�by�the�ambient�roughness.�This�IBL�grows�with�downwind�distance,�and�once�its�height�exceeds�the�turbine�hub�height,�the�hubͲheight�speed�impinging�upon�turbines�farther�downwind�is�progressively�reduced.�According�to�the�Frandsen�theory,�the�effective�array�roughness�is�in�the�range�of�1�m�to�3�m,�or�typical�of�a�forest,�for�midͲrange�speeds�and�typical�turbine�spacings.�AWS�Truepower�modified�the�Frandsen�model�to�treat�each�turbine�as�an�isolated�island�of�roughness,�a�necessary�change�to�permit�rapid�modifications�to�the�turbine� layout� for� array� optimization.� In� addition,� the� IBL� created� by� each� turbine� is� assumed� to� be�centered�on�the�turbine’s�hub�height.��
In�combining�the�two�models,�the�DAWM�implicitly�defines�“shallow”�and�“deep”�zones�within�a�turbine�array.�In�the�shallow�zone,�the�direct�wake�effects�of�individual�turbines�dominate,�and�the�unmodified�Eddy�Viscosity�(EV)�model� is�used�to�calculate�wake�deficits;� in�the�deep�zone,�the�deepͲarray�effect� is�more�prominent,�and�thus,�the�roughness�model�is�employed.��The�DAWM�has�been�validated�at�several�offshore�and�onshore�projects.8�
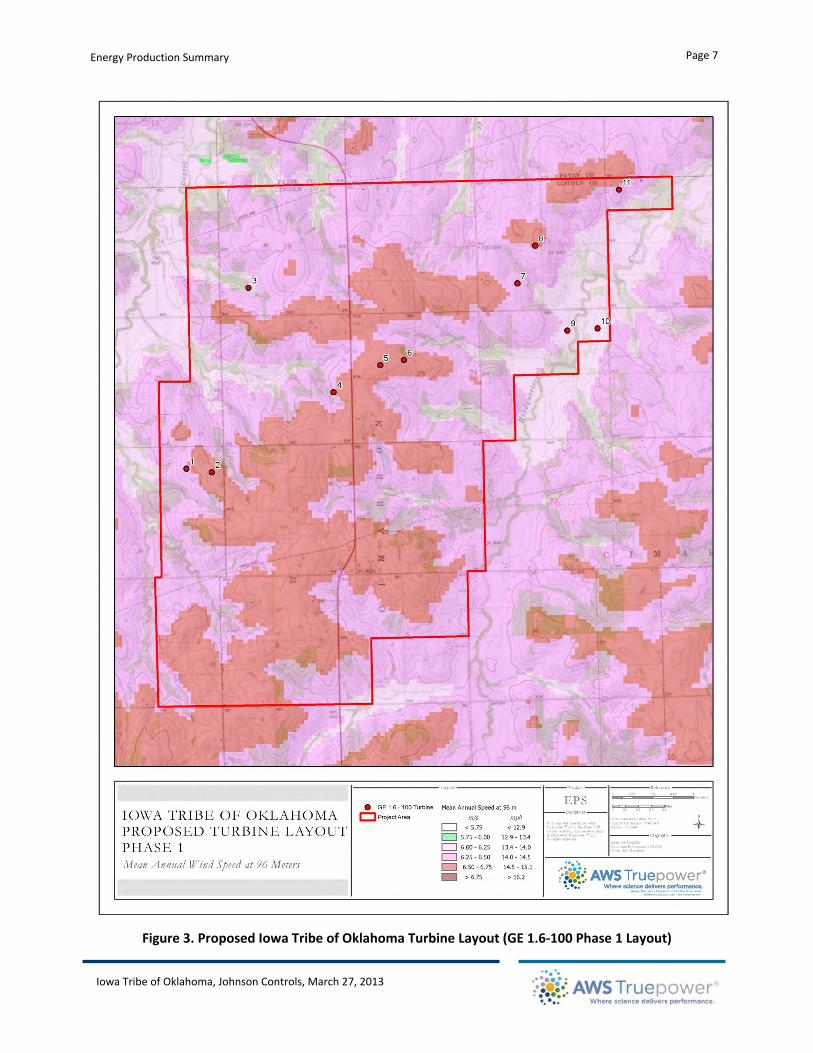
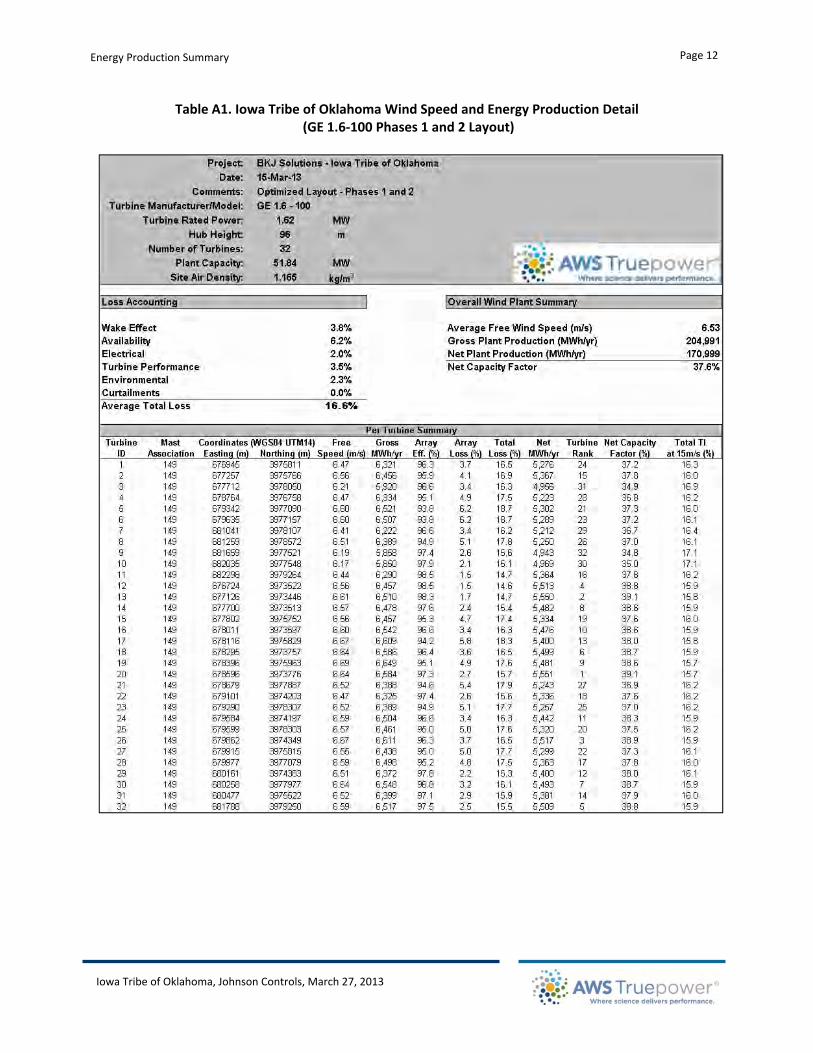
Results�The�energy�production�was� simulated� for� two�different� turbine�models:� the�GE�1.6Ͳ100�and� Siemens�SWTͲ2.3Ͳ113.� � For� each�proposed� turbine�model,�we� also�produced� two� separate� energy�production�simulations� reflecting�different�plant� sizes,� referred� to�as�Phases�1�and�2.� �Results� for� the�GE�1.6Ͳ100�turbine�model� (Phase�1� layout)�are�presented� in� the�body�of� this� report,�while� the� remaining�energy�production�scenarios�are�presented�in�the�Appendix.��
�The�GE�1.6Ͳ100�turbine�features�a�100Ͳm�rotor�diameter�and�a�96Ͳm�hub�height.�The�Phase�1�turbine�layout,�which�was�developed�by�AWS�Truepower�based�on� information�provided�by� the� Iowa�Tribe�of�Oklahoma� through� BKJ� Solutions� and� standard� assumptions,� is� shown� on� the�wind� resource�map� in�Figure�3.�Each�turbine� in�the� layout�was�associated�with�the�wind�speed�and�direction�distribution�file�from�Mast�0149.�
The�average�air�density�was�calculated�from�the�wind�speed�and�temperature�data�from�Mast�0149�and�adjusted�to�the�mean�elevation�of�the�turbines�using�a�standard�atmospheric�lapse�rate.�The�result�was�1.166�kg/m3.��
Plant� losses� aside� from� turbine�wake� losses�were� estimated� from�AWS� Truepower’s� experience�with�other� projects� and� an� analysis� of� siteͲspecific� data.9� The�wake� loss�was� estimated� by� the� openWind�program� to�be�1.7%.� Including�combined�plant� losses� totaling�13.4%,� the� total� loss� is�estimated� to�be�14.9%.�
The�gross�and�net�annual�energy�production�estimates� for� the�project�are�68.7�GWh�and�58.4�GWh,�respectively.�The�net� capacity� factor� is�predicted� to�be�37.4%,�and� the�estimated�arrayͲaverage� freeͲ
������������������������������������������������������������7� Sten� Tronæs� Frandsen,� Turbulence� and� turbulenceͲgenerated� structural� loading� in�wind� turbine� clusters,� RisøͲRͲ1188(EN),� Risø�National�Laboratory�(January�2007).�
8�Brower,�Michael�C.�and�Robinson,�Nicholas�M.,�“The�openWind�Deep�Array�Wake�Model�–�Development�and�Validation”,�May�2012.�
9�Dan�Bernadett,�et�al.,�2012�Backcast�Study:�A�Review�and�Calibration�of�AWS�Truepower’s�Energy�Estimation�Methods,�AWS�Truepower�May�2012.�
� Page�5
�
� � �Iowa�Tribe�of�Oklahoma,�Johnson�Controls,�March�27,�2013
Energy�Production�Summary�
stream�wind� speed�at�hub�height� is�6.42�m/s.�A�summary�of� the�estimated�average� freeͲstream�wind�speed�and�gross�and�net�energy�production�for�each�turbine�is�presented�in�Table�3.�
5.��UNCERTAINTY�ESTIMATE�
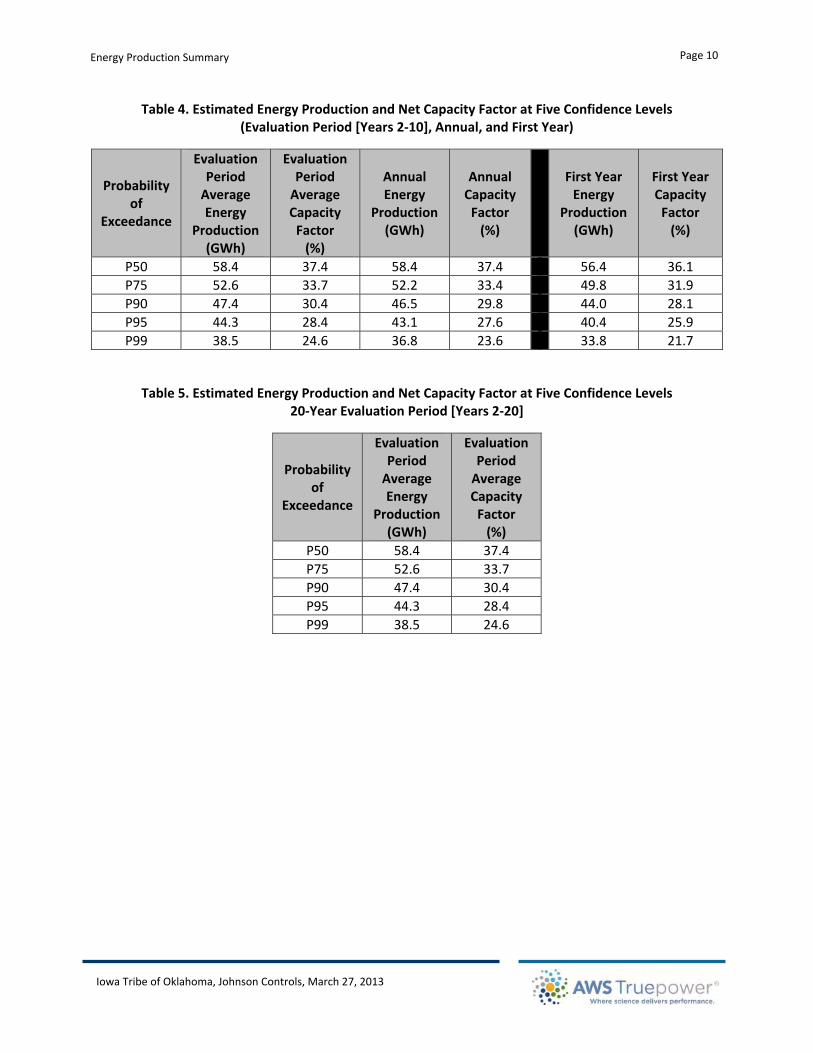
The�values�presented� in� this� section�apply� to� the�GE�1.6Ͳ100�Phase�1� layout;� it� should�be�noted� that�small�variances�in�these�estimates�occur�for�each�of�the�remaining�project�scenarios.��The�uncertainty�in�the�projected� longͲterm�hub�height�wind�speed�across�the�project� is�estimated� to�be�8.0%.�This�value�incorporates� the� uncertainties� associated�with� field� verification,� the� onsite�measurements,� the�wind�shear� extrapolation,� the� historical� climate� adjustment,� the� evaluation� period,� and� the� wind� flow�modeling.� The� sensitivity� of� the� project� output� to� changes� in� wind� speed� was� determined� to� be�approximately� 14.2%� for� the� given� 8.0%� uncertainty� in�mean�wind� speed.� The� uncertainties� in�wind�speed�frequency�distribution�and�plant�losses�were�combined�with�the�previous�total�to�yield�an�overall�energy� production� uncertainty� of� 14.7%,� or� 8.6�GWh/yr.� Table� 4� presents� the� estimated� net� annual�energy� production� and� capacity� factor� at� five� confidence� levels� assuming� a� 9Ͳyear�mature� operation�evaluation�period� and� the� same� for� the� first� year� and� for� any� single� year� thereafter.� � The� same� five�confidence� level� values� assuming� a� 20Ͳyear� total� (19Ͳyear�mature� operation)� evaluation� period� are�contained� in�Table�5.�The� same�values�are�presented� in� the�Appendix� for� the� three�additional�energy�production�scenarios.���
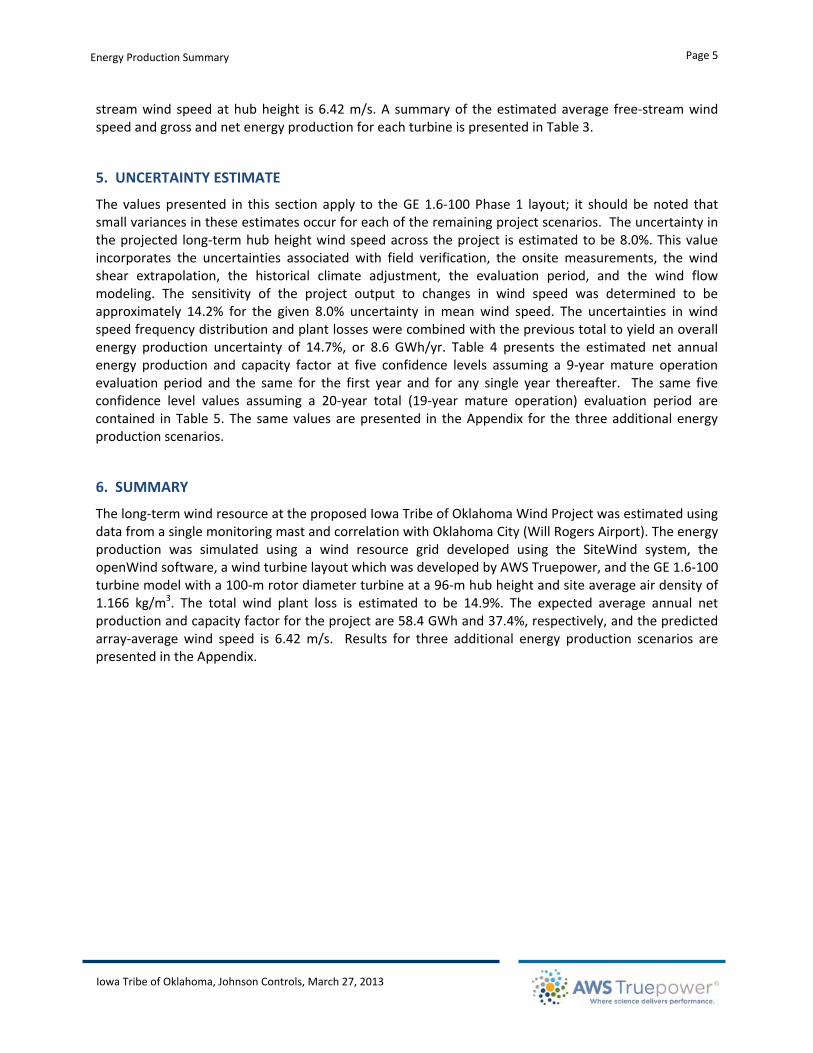
6.��SUMMARY�
The�longͲterm�wind�resource�at�the�proposed�Iowa�Tribe�of�Oklahoma�Wind�Project�was�estimated�using�data�from�a�single�monitoring�mast�and�correlation�with�Oklahoma�City�(Will�Rogers�Airport).�The�energy�production� was� simulated� using� a� wind� resource� grid� developed� using� the� SiteWind� system,� the�openWind�software,�a�wind�turbine�layout�which�was�developed�by�AWS�Truepower,�and�the�GE�1.6Ͳ100�turbine�model�with�a�100Ͳm�rotor�diameter�turbine�at�a�96Ͳm�hub�height�and�site�average�air�density�of�1.166� kg/m3.� The� total�wind� plant� loss� is� estimated� to� be� 14.9%.� The� expected� average� annual� net�production�and�capacity�factor�for�the�project�are�58.4�GWh�and�37.4%,�respectively,�and�the�predicted�arrayͲaverage�wind� speed� is� 6.42�m/s.� �Results� for� three� additional� energy� production� scenarios� are�presented�in�the�Appendix.� �
� Page�6
�
� � �Iowa�Tribe�of�Oklahoma,�Johnson�Controls,�March�27,�2013
Energy�Production�Summary�
��
Figure�1.�Mast�0149�Observed�Wind�Speed�Frequency�Distribution�and�Fitted�Weibull�Curve���
��
Figure�2.�Mast�0149�Annual�Wind�Rose�� �
� Page�7
�
� � �Iowa�Tribe�of�Oklahoma,�Johnson�Controls,�March�27,�2013
Energy�Production�Summary�
��
Figure�3.�Proposed�Iowa�Tribe�of�Oklahoma�Turbine�Layout�(GE�1.6Ͳ100�Phase�1�Layout)�
� Page�8
�
� � �Iowa�Tribe�of�Oklahoma,�Johnson�Controls,�March�27,�2013
Energy�Production�Summary�
Table�1.�Mast�Summary�
Mast�Site�UTM�Coordinates�(WGS84,�Zone�14)� Elevation�
(m)�Period�of�Record�
Monitoring�Heights�(m)�
Easting� Northing� Wind�Speed� Wind�Direction� Temp�
0149� 669343� 3958302� 281� 4�November�2011�–�3�February�2013� 57.4,�47.6,�32� 53.5,�43.5� 2.7�
��
Table�2.�Monitoring�Mast�LongͲterm�Wind�Speed�Projection�Summary�
Mast� Monitoring�Height�(m)� Reference� Regression�
Equation� r²�LongͲTerm�Wind�Speed�
(m/s)�
Effective�Wind�Shear�
Projected�96Ͳm�Speed�(m/s)�
0149� 57.4�Oklahoma�City�(Will�Rogers�Airport)�
y�=�0.870x�+�0.564� 0.91 4.83� 0.359� 5.89�
���
�
�
�
�
�
�
�
�
�
�
�
�
�
�

� Page�9
�
� � �Iowa�Tribe�of�Oklahoma,�Johnson�Controls,�March�27,�2013
Energy�Production�Summary�
Table�3.�Iowa�Tribe�of�Oklahoma�Wind�Speed�and�Energy�Production�Detail��(GE�1.6Ͳ100�Phase�1�Layout)�
�
�
� �
� Page�10
�
� � �Iowa�Tribe�of�Oklahoma,�Johnson�Controls,�March�27,�2013
Energy�Production�Summary�
Table�4.�Estimated�Energy�Production�and�Net�Capacity�Factor�at�Five�Confidence�Levels�(Evaluation�Period�[Years�2Ͳ10],�Annual,�and�First�Year)�
Probability�of��
Exceedance�
Evaluation�Period�Average�Energy�
Production�(GWh)�
Evaluation�Period�Average�Capacity�Factor�(%)�
Annual�Energy�
Production�(GWh)�
Annual�Capacity�Factor�(%)�
�
First�Year�Energy�
Production�(GWh)�
First�Year�Capacity�Factor�(%)�
P50� 58.4� 37.4� 58.4� 37.4� � 56.4� 36.1�P75� 52.6� 33.7� 52.2� 33.4� � 49.8� 31.9�P90� 47.4� 30.4� 46.5� 29.8� � 44.0� 28.1�P95� 44.3� 28.4� 43.1� 27.6� � 40.4� 25.9�P99� 38.5� 24.6� 36.8� 23.6� � 33.8� 21.7�
�
Table�5.�Estimated�Energy�Production�and�Net�Capacity�Factor�at�Five�Confidence�Levels�20ͲYear�Evaluation�Period�[Years�2Ͳ20]�
Probability�of��
Exceedance�
Evaluation�Period�Average�Energy�
Production�(GWh)�
Evaluation�Period�Average�Capacity�Factor�(%)�
P50� 58.4� 37.4�P75� 52.6� 33.7�P90� 47.4� 30.4�P95� 44.3� 28.4�P99� 38.5� 24.6�
��
�
�
�
�
�
�
�
�
� Page�11
�
� � �Iowa�Tribe�of�Oklahoma,�Johnson�Controls,�March�27,�2013
Energy�Production�Summary�
�
�
�
�
�
�
�
�
�
�
APPENDIX�–�ALTERNATE�ENERGY�PRODUCTION�SCENARIOS�
� �
� Page�12
�
� � �Iowa�Tribe�of�Oklahoma,�Johnson�Controls,�March�27,�2013
Energy�Production�Summary�
Table�A1.�Iowa�Tribe�of�Oklahoma�Wind�Speed�and�Energy�Production�Detail��(GE�1.6Ͳ100�Phases�1�and�2�Layout)�
�
�
�
�
�
�

� Page�13
�
� � �Iowa�Tribe�of�Oklahoma,�Johnson�Controls,�March�27,�2013
Energy�Production�Summary�
�
Figure�A1.�Proposed�Iowa�Tribe�of�Oklahoma�Turbine�Layout�(GE�1.6Ͳ100�Phases�1�and�2�Layout)�
� Page�14
�
� � �Iowa�Tribe�of�Oklahoma,�Johnson�Controls,�March�27,�2013
Energy�Production�Summary�
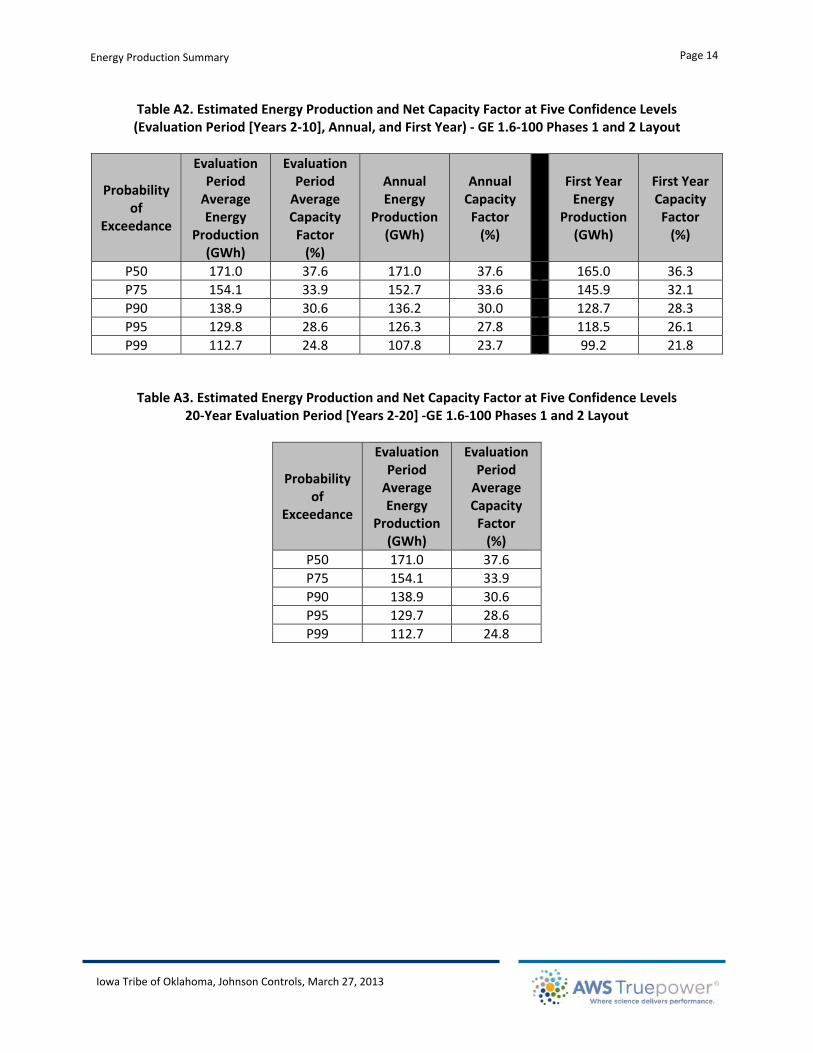
Table�A2.�Estimated�Energy�Production�and�Net�Capacity�Factor�at�Five�Confidence�Levels�(Evaluation�Period�[Years�2Ͳ10],�Annual,�and�First�Year)�Ͳ�GE�1.6Ͳ100�Phases�1�and�2�Layout�
�
Probability�of��
Exceedance�
Evaluation�Period�Average�Energy�
Production�(GWh)�
Evaluation�Period�Average�Capacity�Factor�(%)�
Annual�Energy�
Production�(GWh)�
Annual�Capacity�Factor�(%)�
�
First�Year�Energy�
Production�(GWh)�
First�Year�Capacity�Factor�(%)�
P50� 171.0� 37.6� 171.0� 37.6� � 165.0� 36.3�P75� 154.1� 33.9� 152.7� 33.6� � 145.9� 32.1�P90� 138.9� 30.6� 136.2� 30.0� � 128.7� 28.3�P95� 129.8� 28.6� 126.3� 27.8� � 118.5� 26.1�P99� 112.7� 24.8� 107.8� 23.7� � 99.2� 21.8�
�
Table�A3.�Estimated�Energy�Production�and�Net�Capacity�Factor�at�Five�Confidence�Levels�20ͲYear�Evaluation�Period�[Years�2Ͳ20]�ͲGE�1.6Ͳ100�Phases�1�and�2�Layout�
�
Probability�of��
Exceedance�
Evaluation�Period�Average�Energy�
Production�(GWh)�
Evaluation�Period�Average�Capacity�Factor�(%)�
P50� 171.0� 37.6�P75� 154.1� 33.9�P90� 138.9� 30.6�P95� 129.7� 28.6�P99� 112.7� 24.8�
�� �
� Page�15
�
� � �Iowa�Tribe�of�Oklahoma,�Johnson�Controls,�March�27,�2013
Energy�Production�Summary�
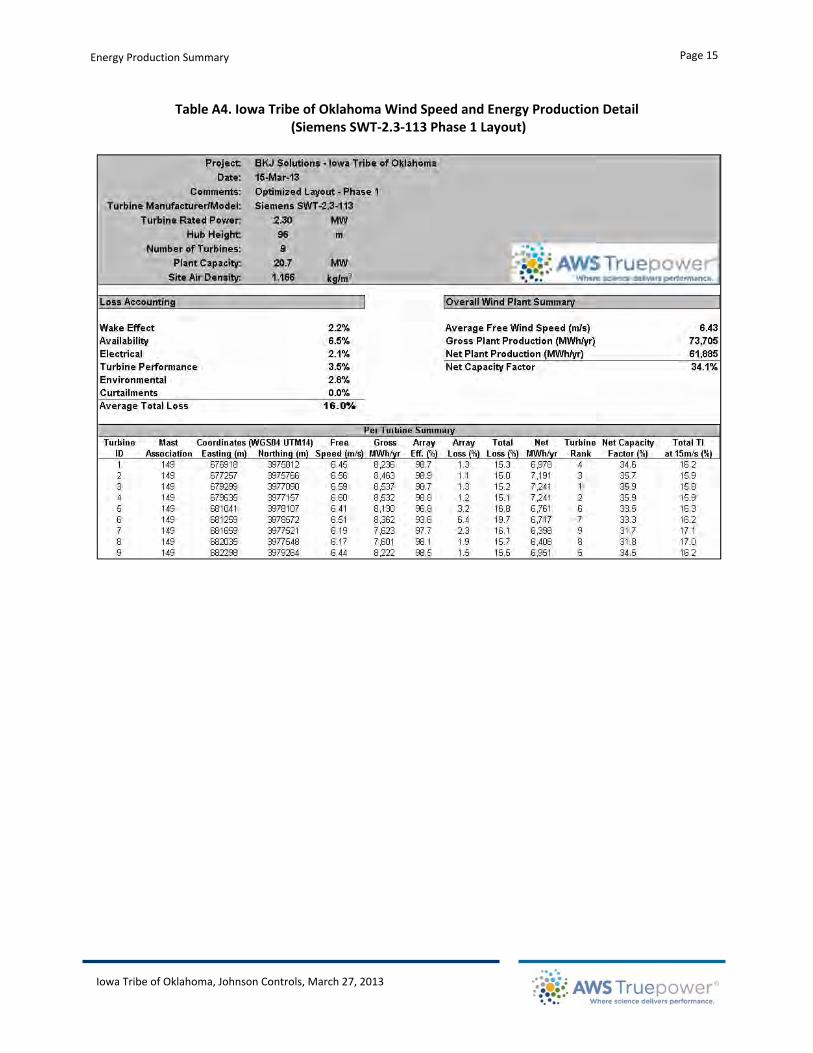
Table�A4.�Iowa�Tribe�of�Oklahoma�Wind�Speed�and�Energy�Production�Detail��(Siemens�SWTͲ2.3Ͳ113�Phase�1�Layout)�
�
�
�
�
�
�
� Page�16
�
� � �Iowa�Tribe�of�Oklahoma,�Johnson�Controls,�March�27,�2013
Energy�Production�Summary�
�
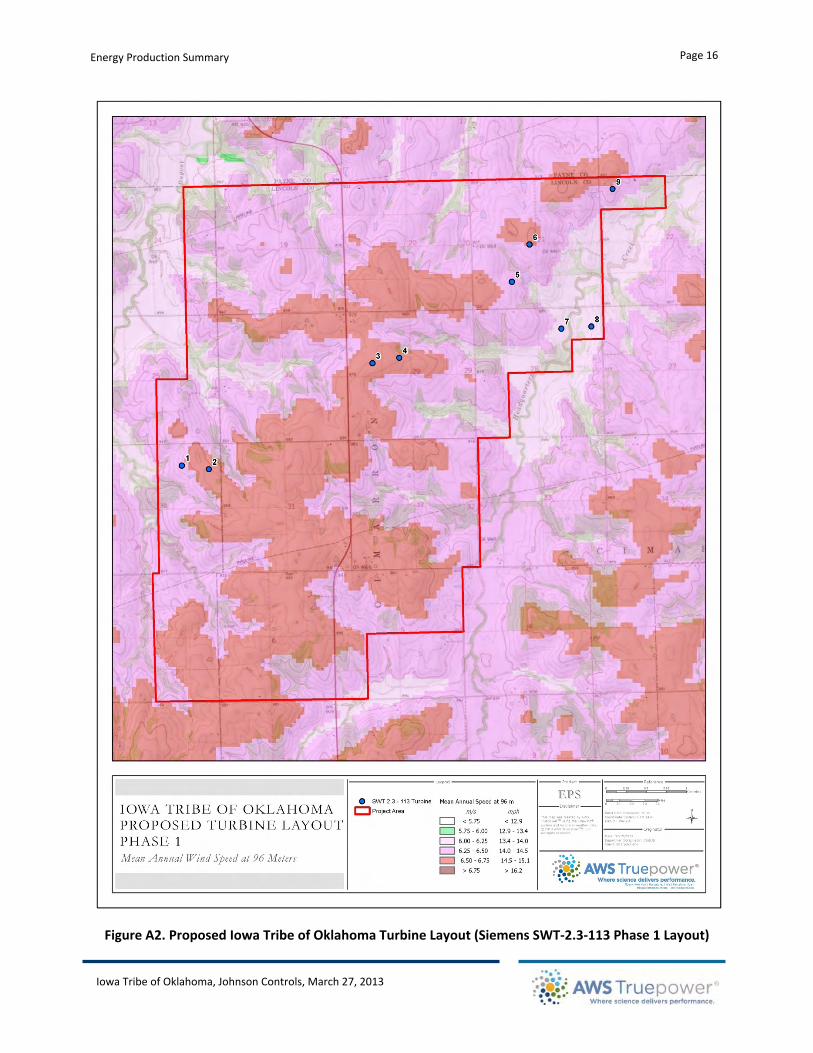
Figure�A2.�Proposed�Iowa�Tribe�of�Oklahoma�Turbine�Layout�(Siemens�SWTͲ2.3Ͳ113�Phase�1�Layout)�

� Page�17
�
� � �Iowa�Tribe�of�Oklahoma,�Johnson�Controls,�March�27,�2013
Energy�Production�Summary�
Table�A5.�Estimated�Energy�Production�and�Net�Capacity�Factor�at�Five�Confidence�Levels�(Evaluation�Period�[Years�2Ͳ10],�Annual,�and�First�Year)�–�Siemens�SWTͲ2.3Ͳ113�Phase�1�Layout�
�
Probability�of��
Exceedance�
Evaluation�Period�Average�Energy�
Production�(GWh)�
Evaluation�Period�Average�Capacity�Factor�(%)�
Annual�Energy�
Production�(GWh)�
Annual�Capacity�Factor�(%)�
�
First�Year�Energy�
Production�(GWh)�
First�Year�Capacity�Factor�(%)�
P50� 61.9� 34.1� 61.9� 34.1� � 59.7� 32.9�P75� 55.3� 30.5� 54.7� 30.2� � 52.3� 28.8�P90� 49.3� 27.2� 48.3� 26.6� � 45.7� 25.2�P95� 45.8� 25.2� 44.5� 24.5� � 41.7� 23.0�P99� 39.1� 21.6� 37.2� 20.5� � 34.3� 18.9�
�
Table�A6.�Estimated�Energy�Production�and�Net�Capacity�Factor�at�Five�Confidence�Levels�20ͲYear�Evaluation�Period�[Years�2Ͳ20]�–Siemens�SWTͲ2.3Ͳ113�Phase�1�Layout�
�
Probability�of��
Exceedance�
Evaluation�Period�Average�Energy�
Production�(GWh)�
Evaluation�Period�Average�Capacity�Factor�(%)�
P50� 61.9� 34.1�P75� 55.3� 30.5�P90� 49.3� 27.2�P95� 45.8� 25.2�P99� 39.1� 21.5�
�� �
� Page�18
�
� � �Iowa�Tribe�of�Oklahoma,�Johnson�Controls,�March�27,�2013
Energy�Production�Summary�
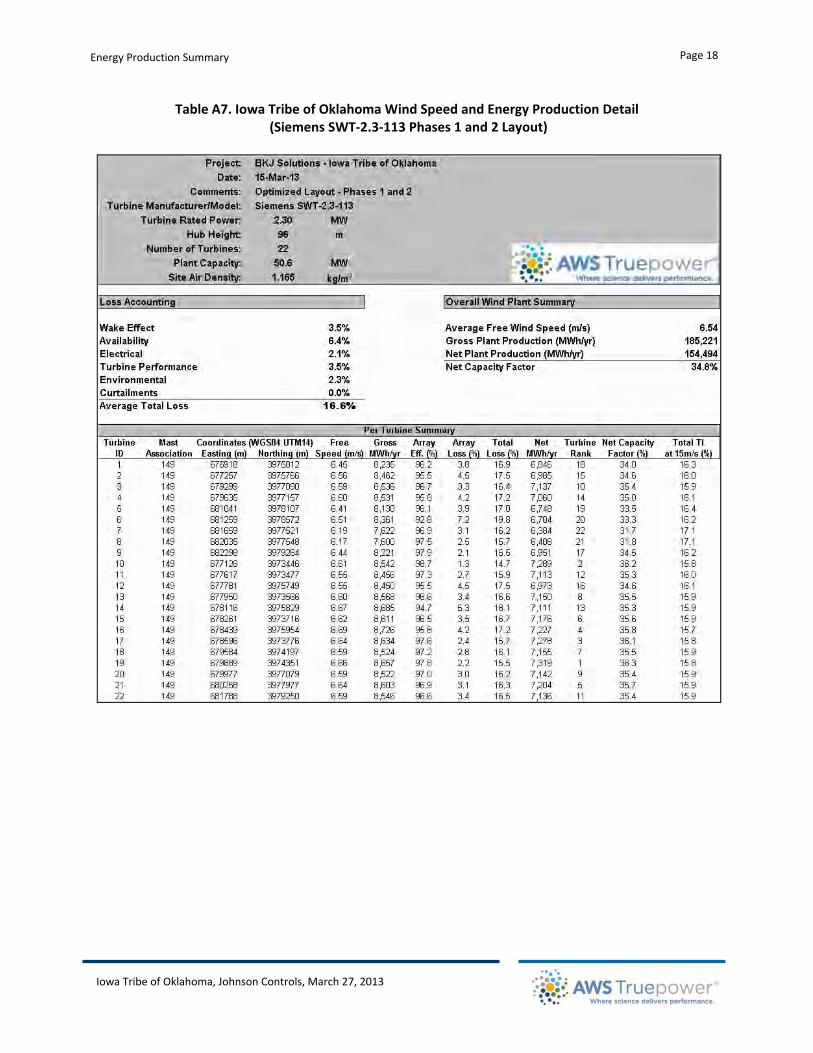
Table�A7.�Iowa�Tribe�of�Oklahoma�Wind�Speed�and�Energy�Production�Detail��(Siemens�SWTͲ2.3Ͳ113�Phases�1�and�2�Layout)�
�
�
�
�
�
�
� Page�19
�
� � �Iowa�Tribe�of�Oklahoma,�Johnson�Controls,�March�27,�2013
Energy�Production�Summary�
�
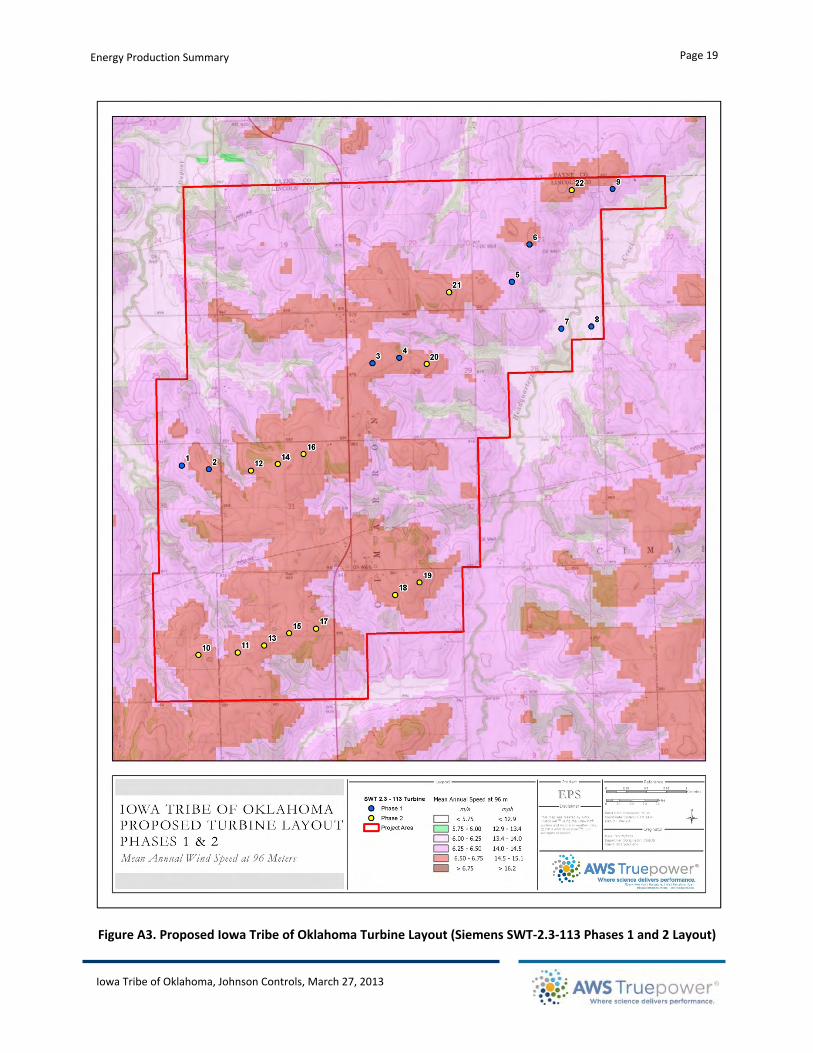
Figure�A3.�Proposed�Iowa�Tribe�of�Oklahoma�Turbine�Layout�(Siemens�SWTͲ2.3Ͳ113�Phases�1�and�2�Layout)�

� Page�20
�
� � �Iowa�Tribe�of�Oklahoma,�Johnson�Controls,�March�27,�2013
Energy�Production�Summary�
Table�A8.�Estimated�Energy�Production�and�Net�Capacity�Factor�at�Five�Confidence�Levels�(Evaluation�Period�[Years�2Ͳ10],�Annual,�and�First�Year)�–�Siemens�SWTͲ2.3Ͳ113�Phases�1�and�2�Layout�
�
Probability�of��
Exceedance�
Evaluation�Period�Average�Energy�
Production�(GWh)�
Evaluation�Period�Average�Capacity�Factor�(%)�
Annual�Energy�
Production�(GWh)�
Annual�Capacity�Factor�(%)�
�
First�Year�Energy�
Production�(GWh)�
First�Year�Capacity�Factor�(%)�
P50� 154.5� 34.8� 154.5� 34.8� � 149.1� 33.6�P75� 138.0� 31.1� 136.7� 30.8� � 130.7� 29.5�P90� 123.1� 27.8� 120.6� 27.2� � 114.1� 25.7�P95� 114.2� 25.7� 111.0� 25.0� � 104.2� 23.5�P99� 97.5� 22.0� 93.0� 21.0� � 85.6� 19.3�
�
Table�A9.�Estimated�Energy�Production�and�Net�Capacity�Factor�at�Five�Confidence�Levels�20ͲYear�Evaluation�Period�[Years�2Ͳ20]�–Siemens�SWTͲ2.3Ͳ113�Phases�1�and�2�Layout�
�
Probability�of��
Exceedance�
Evaluation�Period�Average�Energy�
Production�(GWh)�
Evaluation�Period�Average�Capacity�Factor�(%)�
P50� 154.5� 34.8�P75� 138.0� 31.1�P90� 123.1� 27.8�P95� 114.2� 25.7�P99� 97.5� 22.0�
��
�
�
�
�463�NEW�KARNER�ROAD�|�ALBANY,�NY�12205�awstruepower.com�|�[email protected]�
�
�
�
�
�
�
�
�
�
�
�
�
�
�
�
�
�
�
�
�
�
�
�
�
�
�
� �
CLASSIFICATION
CONFIDENTIAL�
FOR�THE�IOWA�TRIBE�OF�OKLAHOMA�SOLAR�PROJECTLINCOLN�COUNTY,�OKLAHOMA�
�
PRELIMINARY�SOLAR�RESOURCE�AND�ENERGY�ASSESSMENT��
MARCH�27,�2013�
PREPARED�FOR�JOHNSON�CONTROLS�
REVIEW�STANDARDSTANDARD�
� ����������������������������������������������������������������������������������������������������������������������������������������������������������������Page�2���
�
Preliminary�Solar�Resource�and�Energy�Assessment�with�Uncertainty�
Iowa�Tribe�of�Oklahoma�Solar�Project�Site,�Johnson�Controls,�March�27,�2013��
�
DISCLAIMER�
Acceptance�of�this�document�by�the�client� is�on�the�basis�that�AWS�Truepower� is�not� in�any�way�to�be�held� responsible� for� the�application�or�use�made�of� the� findings�and� that� such� responsibility� remains�with�the�client.�
�
�
KEY�TO�DOCUMENT�CLASSIFICATION�
Strictly�Confidential� For�recipients�only�Confidential� May�be�shared�within�client’s�organization�Client’s�Discretion� Distribution�at�the�client’s�discretion�For�Public�Release� No�restriction�
�
KEY�TO�REVIEW�STANDARD�
Standard� Standard�review�level�Senior�Staff� Reviewed�by�senior�staff�Due�Diligence� Highest�level�of�scrutiny���
�
�
DOCUMENT�CONTRIBUTORS�
Author� Reviewer
Christopher�Thuman�Senior�Meteorologist�
Mark�Grammatico�Project�Manager
�
�
DOCUMENT�HISTORY�
Issue� Date� Summary�
A� 27�March�2013� Initial�Report�
� �
� ����������������������������������������������������������������������������������������������������������������������������������������������������������������Page�3���
�
Preliminary�Solar�Resource�and�Energy�Assessment�with�Uncertainty�
Iowa�Tribe�of�Oklahoma�Solar�Project�Site,�Johnson�Controls,�March�27,�2013��
TABLE�OF�CONTENTS�1.� Introduction�.........................................................................................................................................�4�
2.� Site�Description�....................................................................................................................................�4�
3.� Solar�and�Meteorological�Measurements�............................................................................................�4�
4.� Solar�and�Meteorological�Resource�Characteristics�.............................................................................�5�
5.� Reference�Data�Sources�.......................................................................................................................�5�
6.� Estimation�of�LongͲTerm�Solar�Resource�.............................................................................................�6�
7.� Development�of�Typical�Meteorological�Year�Data�Set�.......................................................................�7�
8.� Preliminary�Energy�Assessment�...........................................................................................................�8�
9.� Uncertainty�Analysis�...........................................................................................................................�12�
10.� Summary�........................................................................................................................................�15�
Appendix�A�–�Reference�Data�Sources�........................................................................................................�19�
�
� �
� ����������������������������������������������������������������������������������������������������������������������������������������������������������������Page�4���
�
Preliminary�Solar�Resource�and�Energy�Assessment�with�Uncertainty�
Iowa�Tribe�of�Oklahoma�Solar�Project�Site,�Johnson�Controls,�March�27,�2013��
1. INTRODUCTION�AWS� Truepower,� LLC� (AWS� Truepower)�was� retained�by� Johnson�Controls� to� estimate� the� longͲterm�solar� resource� and� preliminary� energy� production� of� the� Iowa� Tribe� of� Oklahoma� photovoltaic� (PV)�project�site,�located�in�central�Oklahoma.�The�project,�which�has�a�rated�DC/AC�capacity�of�22.3/20�MW,�was�modeled� using� 79,662� Yingli� YL280PͲ35b� polycrystalline� solar�modules� and� 40�Advanced� Energy�Solaron�500�kW� inverters.�Using� reliable�nearby�measured�and�modeled� reference�data�sources,�AWS�Truepower�estimated�the� longͲterm�solar�resource�and�developed�a�typical�meteorological�year�(TMY)�data�set� that� represents� the�expected�meteorological�conditions�at� the�project�site.�This�data�set�was�then� used,� along�with� standard� plant� specifications� and� losses� assumed� by�AWS� Truepower,� and� an�energy�simulation�program,�to�estimate�the�longͲterm�energy�production�potential�of�the�plant.�Through�this�process,�several�areas�of�uncertainty�were�identified�and�quantified�in�order�to�estimate�the�energy�production�at�several�confidence�intervals.���For�comparison�purposes,�estimated�energy�output�considering�Jinko�JKM300MͲ72�and�FirstSolar�FSͲ380�modules�is�also�provided.����
2. SITE�DESCRIPTION�The�Iowa�Tribe�of�Oklahoma�solar�project�site�is�located�approximately�110�km�westͲsouthwest�of�Tulsa,�Oklahoma�and�approximately�50�km�northeast�of�Oklahoma�City,�Oklahoma.�Its�location�is�indicated�on�the� regional�map� in� Figure� 1.� The� project� site,� at� a�mean� site� elevation� of� approximately� 281�m,� is�located� amongst� hilly� terrain� east� of�Highway� 35� and� north� of�Highway� 44.� Land� cover� immediately�surrounding� the� project� area� consists� of� grass� fields� and� scattered� forest,� with� residential� and�agricultural�development�nearby.�Basic�information�about�the�project�site�is�provided�in�Table�1.�
�Table�1.�Description�of�the�Iowa�Tribe�of�Oklahoma�Solar�Project�Site��
Site�ID�
Site�Coordinates�WGS84�Zone�14N�
County� Elevation�(m)�
Nearby�Town� Environmental�
Latitude� Longitude�
Iowa�Tribe�of�Oklahoma�Solar�Project�
35.75418� Ͳ97.12698� Lincoln� 281� Chandler,�Oklahoma�
Grass�fields�and�scattered�forest,�residential�and�
agricultural�development�nearby�
3. SOLAR�AND�METEOROLOGICAL�MEASUREMENTS�Solar� and�wind�monitoring� at� the� project� began� in�November� 2011�with� the� installation� of� a� single�monitoring�mast,�designated�Mast�0149.�The�mast�remains�in�operation,�and�its�location�is�indicated�in�Figure�1.�TUV�SUD�America� installed� the�mast,�while� Johnson�Controls�has�been� responsible� for�data�collection.�Since�AWS�Truepower�did�not�perform�a�site�visit,�we�relied�on� information�about�the�mast�provided�in�a�detailed�tower�installation�form�provided�by�Johnson�Controls.��
The�data�at�Mast�0149�were�collected�using�an�NRG�Symphonie�Plus3�data�logger;�data�were�provided�to�AWS�Truepower�in�their�raw�binary�format�via�ftp�and�email.�Each�data�file�contained�10Ͳminute�average�wind� speed,� direction,� temperature� and� solar� radiation� measurements,� along� with� their� standard�
� ����������������������������������������������������������������������������������������������������������������������������������������������������������������Page�5���
�
Preliminary�Solar�Resource�and�Energy�Assessment�with�Uncertainty�
Iowa�Tribe�of�Oklahoma�Solar�Project�Site,�Johnson�Controls,�March�27,�2013��
deviations.� The� pyranometer� used� in� the� measurement� program� is� assumed� to� be� a� LICOR� LIͲ200�mounted�off�the�side�of�the�tower.��
An� experienced�AWS� Truepower�meteorologist� screened� the�data� for� completeness� and�quality,� and�examined� any� suspect� values.�The�main� considerations� addressed�by� this� validation�process� included�identification� of� invalid� measurements,� ramp� events� produced� by� periods� of� cloud� cover,� and�verification� of�missing� data.� After� validation,� the� data� recovery�was� 88.2%� for� the� global� horizontal�irradiance�(GHI)�component.��
4. SOLAR�AND�METEOROLOGICAL�RESOURCE�CHARACTERISTICS��Data�from�Mast�0149�was�evaluated�to�obtain�summary�statistics�for�the�period�of�data�collection.��Table�2�presents� the�observed�monthly�GHI�and�data�recovery�during� its�15Ͳmonth�period�of�record.�During�this�period,� the� total�GHI�was�1650�kWh/m2.�Figure�2� shows� the�observed�monthly� solar� resource�at�Mast�0149�between�November�2011�and�January�2013,� in�addition�to�concurrent�records�from�several�reference�data�sources.��
Table�2.�Iowa�Tribe�of�Oklahoma�Solar�Project�Design�
MonthͲYear� Irradiation�(kWh/m2/month) Data�Recovery�(%)�NovͲ11� 73.8 86.5%DecͲ11� 69.8 100.0%�JanͲ12� 101.3 100.0%�FebͲ12� 90.5 100.0%�MarͲ12� 142.3 100.0%�AprͲ12� 159.7 100.0%�MayͲ12� 206.9 100.0%�JunͲ12� 208.5 100.0%�JulͲ12� 15.9 6.5%AugͲ12� 53.4 32.3%SepͲ12� 150.7 100.0%�OctͲ12� 118.5 100.0%�NovͲ12� 105.6 100.0%�DecͲ12� 74.7 100.0%�JanͲ13� 78.4 100.0%�Total� 1650 88.2
�
5. REFERENCE�DATA�SOURCES�AWS� Truepower� relied� on� the� following� sources� of� reference� data� to� estimate� the� longͲterm� solar�resource�at�the�project�site:���
x 10Ͳkm�gridded�solar�and�meteorological�data�sets�produced�by�the�State�University�of�New�York�(SUNY)1�as�a�part�of�the�National�Solar�Radiation�Database�(NSRDB)�
x 10Ͳkm�gridded�solar�and�meteorological�data�sets�produced�by�Clean�Power�Research�(CPR)�as�an�extension�of�the�SUNY�model�
������������������������������������������������������������1�Perez,�R.,�Ineichen,�P.,�Moore,�K.,�Kmiecikm,�M.,�Chain,�C.,�George,�R.,�Vignola,�F.,�“A�New�Operational�SatelliteͲtoͲIrradiance�Model”,�Solar�Energy,�73�5,�pp.�307Ͳ317.�
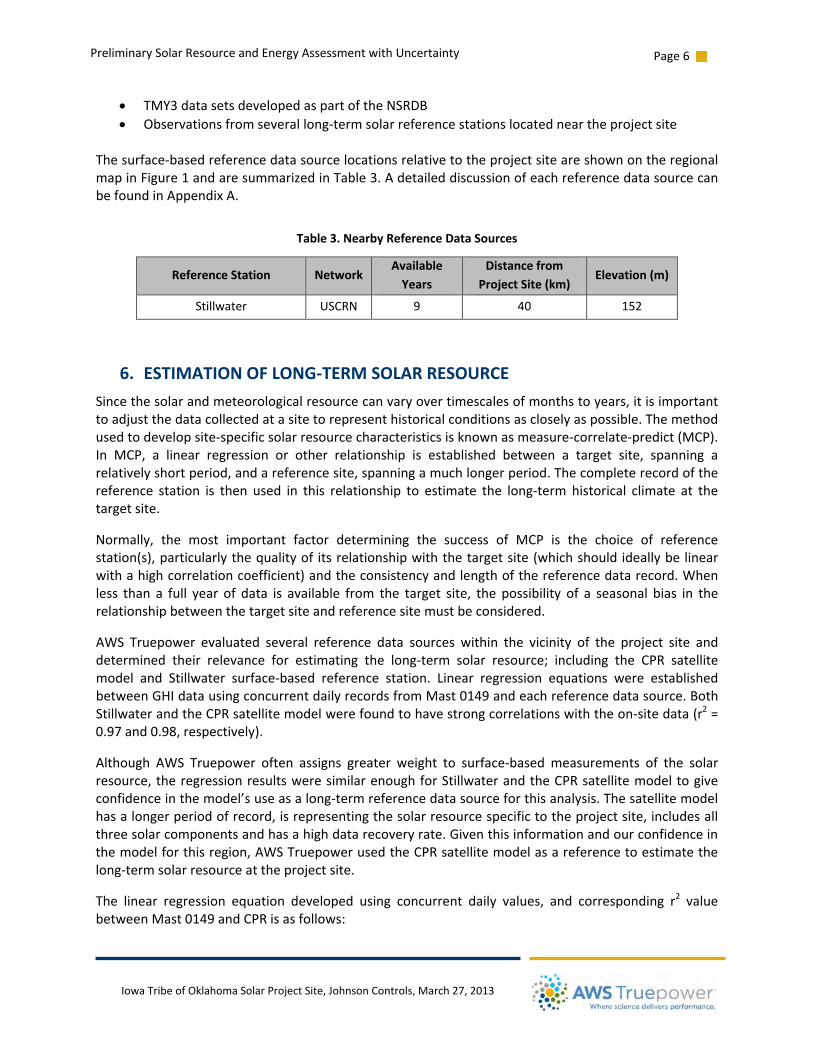
� ����������������������������������������������������������������������������������������������������������������������������������������������������������������Page�6���
�
Preliminary�Solar�Resource�and�Energy�Assessment�with�Uncertainty�
Iowa�Tribe�of�Oklahoma�Solar�Project�Site,�Johnson�Controls,�March�27,�2013��
x TMY3�data�sets�developed�as�part�of�the�NSRDB�x Observations�from�several�longͲterm�solar�reference�stations�located�near�the�project�site�
�The�surfaceͲbased�reference�data�source�locations�relative�to�the�project�site�are�shown�on�the�regional�map�in�Figure�1�and�are�summarized�in�Table�3.�A�detailed�discussion�of�each�reference�data�source�can�be�found�in�Appendix�A.��
Table�3.�Nearby�Reference�Data�Sources�
Reference�Station� Network�Available�Years�
Distance�from�Project�Site�(km)�
Elevation�(m)�
Stillwater� USCRN� 9� 40� 152�
�
6. ESTIMATION�OF�LONGͲTERM�SOLAR�RESOURCE�Since�the�solar�and�meteorological�resource�can�vary�over�timescales�of�months�to�years,�it�is�important�to�adjust�the�data�collected�at�a�site�to�represent�historical�conditions�as�closely�as�possible.�The�method�used�to�develop�siteͲspecific�solar�resource�characteristics�is�known�as�measureͲcorrelateͲpredict�(MCP).�In�MCP,� a� linear� regression� or� other� relationship� is� established� between� a� target� site,� spanning� a�relatively�short�period,�and�a�reference�site,�spanning�a�much�longer�period.�The�complete�record�of�the�reference� station� is� then�used� in� this� relationship� to�estimate� the� longͲterm�historical� climate� at� the�target�site.��
Normally,� the� most� important� factor� determining� the� success� of� MCP� is� the� choice� of� reference�station(s),�particularly�the�quality�of� its�relationship�with�the�target�site�(which�should� ideally�be� linear�with�a�high�correlation�coefficient)�and�the�consistency�and� length�of�the�reference�data�record.�When�less� than�a� full�year�of�data� is�available� from� the� target� site,� the�possibility�of�a� seasonal�bias� in� the�relationship�between�the�target�site�and�reference�site�must�be�considered.��
AWS� Truepower� evaluated� several� reference� data� sources�within� the� vicinity� of� the� project� site� and�determined� their� relevance� for� estimating� the� longͲterm� solar� resource;� including� the� CPR� satellite�model� and� Stillwater� surfaceͲbased� reference� station.� Linear� regression� equations� were� established�between�GHI�data�using�concurrent�daily�records�from�Mast�0149�and�each�reference�data�source.�Both�Stillwater�and�the�CPR�satellite�model�were�found�to�have�strong�correlations�with�the�onͲsite�data�(r2�=�0.97�and�0.98,�respectively).���
Although�AWS� Truepower� often� assigns� greater�weight� to� surfaceͲbased�measurements� of� the� solar�resource,�the�regression�results�were�similar�enough�for�Stillwater�and�the�CPR�satellite�model�to�give�confidence�in�the�model’s�use�as�a�longͲterm�reference�data�source�for�this�analysis.�The�satellite�model�has�a�longer�period�of�record,�is�representing�the�solar�resource�specific�to�the�project�site,�includes�all�three�solar�components�and�has�a�high�data�recovery�rate.�Given�this�information�and�our�confidence�in�the�model�for�this�region,�AWS�Truepower�used�the�CPR�satellite�model�as�a�reference�to�estimate�the�longͲterm�solar�resource�at�the�project�site.�
The� linear� regression� equation� developed� using� concurrent� daily� values,� and� corresponding� r2� value�between�Mast�0149�and�CPR�is�as�follows:��
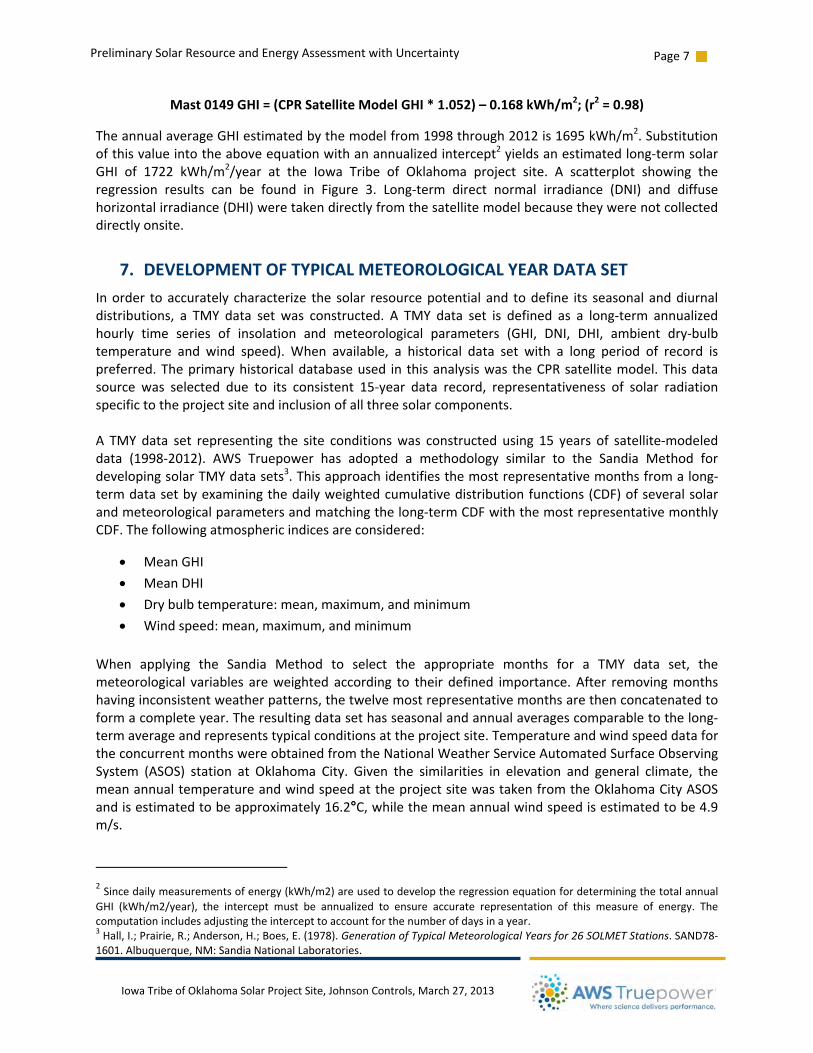
� ����������������������������������������������������������������������������������������������������������������������������������������������������������������Page�7���
�
Preliminary�Solar�Resource�and�Energy�Assessment�with�Uncertainty�
Iowa�Tribe�of�Oklahoma�Solar�Project�Site,�Johnson�Controls,�March�27,�2013��
Mast�0149�GHI�=�(CPR�Satellite�Model�GHI�*�1.052)�–�0.168�kWh/m2;�(r2�=�0.98)�
The�annual�average�GHI�estimated�by�the�model�from�1998�through�2012�is�1695�kWh/m2.�Substitution�of�this�value�into�the�above�equation�with�an�annualized�intercept2�yields�an�estimated�longͲterm�solar�GHI� of� 1722� kWh/m2/year� at� the� Iowa� Tribe� of� Oklahoma� project� site.� A� scatterplot� showing� the�regression� results� can� be� found� in� Figure� 3.� LongͲterm� direct� normal� irradiance� (DNI)� and� diffuse�horizontal�irradiance�(DHI)�were�taken�directly�from�the�satellite�model�because�they�were�not�collected�directly�onsite.�
7. DEVELOPMENT�OF�TYPICAL�METEOROLOGICAL�YEAR�DATA�SET�In�order� to�accurately�characterize� the�solar� resource�potential�and� to�define� its�seasonal�and�diurnal�distributions,� a� TMY� data� set�was� constructed.�A� TMY� data� set� is� defined� as� a� longͲterm� annualized�hourly� time� series� of� insolation� and� meteorological� parameters� (GHI,� DNI,� DHI,� ambient� dryͲbulb�temperature� and�wind� speed).�When� available,� a� historical� data� set�with� a� long� period� of� record� is�preferred.�The�primary�historical�database�used� in� this�analysis�was� the�CPR�satellite�model.�This�data�source�was� selected� due� to� its� consistent� 15Ͳyear� data� record,� representativeness� of� solar� radiation�specific�to�the�project�site�and�inclusion�of�all�three�solar�components.���A�TMY�data� set� representing� the� site� conditions�was� constructed�using�15� years�of� satelliteͲmodeled�data� (1998Ͳ2012).� AWS� Truepower� has� adopted� a� methodology� similar� to� the� Sandia� Method� for�developing�solar�TMY�data�sets3.�This�approach�identifies�the�most�representative�months�from�a�longͲterm�data�set�by�examining�the�daily�weighted�cumulative�distribution�functions�(CDF)�of�several�solar�and�meteorological�parameters�and�matching�the�longͲterm�CDF�with�the�most�representative�monthly�CDF.�The�following�atmospheric�indices�are�considered:��
x Mean�GHI�x Mean�DHI�x Dry�bulb�temperature:�mean,�maximum,�and�minimum�x Wind�speed:�mean,�maximum,�and�minimum�
�When� applying� the� Sandia� Method� to� select� the� appropriate� months� for� a� TMY� data� set,� the�meteorological�variables�are�weighted�according� to� their�defined� importance.�After� removing�months�having�inconsistent�weather�patterns,�the�twelve�most�representative�months�are�then�concatenated�to�form�a�complete�year.�The�resulting�data�set�has�seasonal�and�annual�averages�comparable�to�the�longͲterm�average�and�represents�typical�conditions�at�the�project�site.�Temperature�and�wind�speed�data�for�the�concurrent�months�were�obtained�from�the�National�Weather�Service�Automated�Surface�Observing�System� (ASOS)� station� at�Oklahoma� City.�Given� the� similarities� in� elevation� and� general� climate,� the�mean�annual�temperature�and�wind�speed�at�the�project�site�was�taken�from�the�Oklahoma�City�ASOS�and�is�estimated�to�be�approximately�16.2°C,�while�the�mean�annual�wind�speed�is�estimated�to�be�4.9�m/s.�
������������������������������������������������������������2�Since�daily�measurements�of�energy�(kWh/m2)�are�used�to�develop�the�regression�equation�for�determining�the�total�annual�GHI� (kWh/m2/year),� the� intercept�must� be� annualized� to� ensure� accurate� representation� of� this�measure� of� energy.� The�computation�includes�adjusting�the�intercept�to�account�for�the�number�of�days�in�a�year.�3�Hall,�I.;�Prairie,�R.;�Anderson,�H.;�Boes,�E.�(1978).�Generation�of�Typical�Meteorological�Years�for�26�SOLMET�Stations.�SAND78Ͳ1601.�Albuquerque,�NM:�Sandia�National�Laboratories.
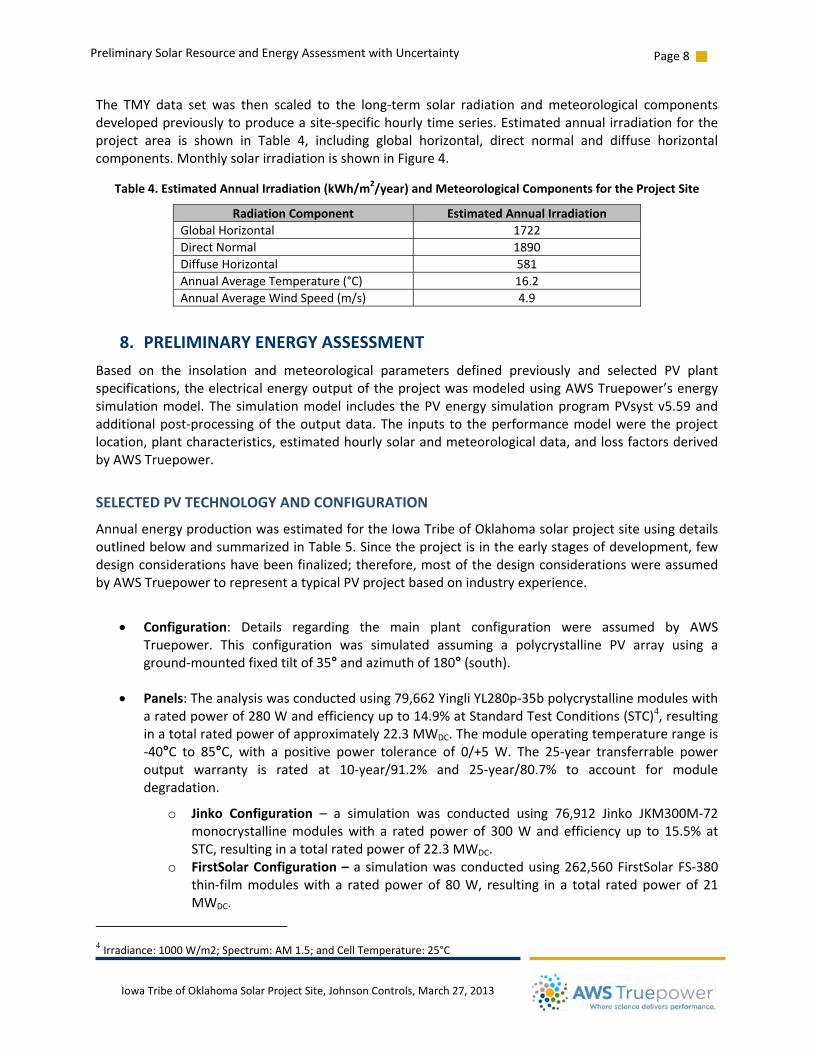
� ����������������������������������������������������������������������������������������������������������������������������������������������������������������Page�8���
�
Preliminary�Solar�Resource�and�Energy�Assessment�with�Uncertainty�
Iowa�Tribe�of�Oklahoma�Solar�Project�Site,�Johnson�Controls,�March�27,�2013��
The� TMY� data� set�was� then� scaled� to� the� longͲterm� solar� radiation� and�meteorological� components�developed�previously�to�produce�a�siteͲspecific�hourly�time�series.�Estimated�annual� irradiation�for�the�project� area� is� shown� in� Table� 4,� including� global� horizontal,� direct� normal� and� diffuse� horizontal�components.�Monthly�solar�irradiation�is�shown�in�Figure�4.�
Table�4.�Estimated�Annual�Irradiation�(kWh/m2/year)�and�Meteorological�Components�for�the�Project�Site�
Radiation�Component Estimated�Annual�Irradiation�Global�Horizontal�� 1722Direct�Normal� 1890Diffuse�Horizontal�� 581Annual�Average�Temperature�(°C) 16.2Annual�Average�Wind�Speed�(m/s) 4.9
8. PRELIMINARY�ENERGY�ASSESSMENT�Based� on� the� insolation� and� meteorological� parameters� defined� previously� and� selected� PV� plant�specifications,�the�electrical�energy�output�of�the�project�was�modeled�using�AWS�Truepower’s�energy�simulation�model.�The�simulation�model� includes� the�PV�energy�simulation�program�PVsyst�v5.59�and�additional�postͲprocessing�of� the�output�data.�The� inputs� to� the�performance�model�were� the�project�location,�plant�characteristics,�estimated�hourly�solar�and�meteorological�data,�and�loss�factors�derived�by�AWS�Truepower.�
SELECTED�PV�TECHNOLOGY�AND�CONFIGURATION�
Annual�energy�production�was�estimated�for�the�Iowa�Tribe�of�Oklahoma�solar�project�site�using�details�outlined�below�and�summarized�in�Table�5.�Since�the�project�is�in�the�early�stages�of�development,�few�design�considerations�have�been�finalized;�therefore,�most�of�the�design�considerations�were�assumed�by�AWS�Truepower�to�represent�a�typical�PV�project�based�on�industry�experience.���
x Configuration:� Details� regarding� the� main� plant� configuration� were� assumed� by� AWS�Truepower.� This� configuration� was� simulated� assuming� a� polycrystalline� PV� array� using� a�groundͲmounted�fixed�tilt�of�35°�and�azimuth�of�180°�(south).��
x Panels:�The�analysis�was�conducted�using�79,662�Yingli�YL280pͲ35b�polycrystalline�modules�with�a�rated�power�of�280�W�and�efficiency�up�to�14.9%�at�Standard�Test�Conditions�(STC)4,�resulting�in�a�total�rated�power�of�approximately�22.3�MWDC.�The�module�operating�temperature�range�is�Ͳ40°C� to� 85°C,�with� a� positive� power� tolerance� of� 0/+5�W.� The� 25Ͳyear� transferrable� power�output� warranty� is� rated� at� 10Ͳyear/91.2%� and� 25Ͳyear/80.7%� to� account� for� module�degradation.
o Jinko� Configuration� –� a� simulation� was� conducted� using� 76,912� Jinko� JKM300MͲ72�monocrystalline�modules�with�a� rated�power�of�300�W�and�efficiency�up� to�15.5%�at�STC,�resulting�in�a�total�rated�power�of�22.3�MWDC.�
o FirstSolar�Configuration�–�a�simulation�was�conducted�using�262,560�FirstSolar�FSͲ380�thinͲfilm�modules�with�a� rated�power�of�80�W,� resulting� in�a� total� rated�power�of�21�MWDC.�
������������������������������������������������������������4 Irradiance:�1000�W/m2;�Spectrum:�AM�1.5;�and�Cell�Temperature:�25°C
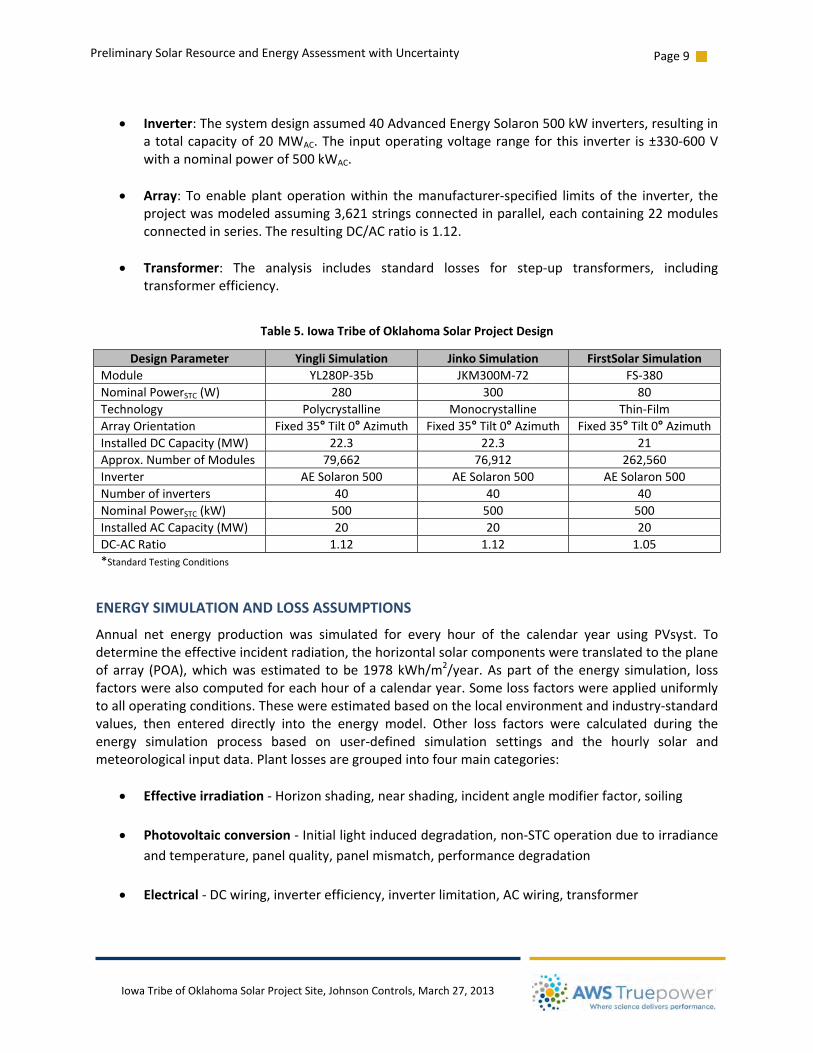
� ����������������������������������������������������������������������������������������������������������������������������������������������������������������Page�9���
�
Preliminary�Solar�Resource�and�Energy�Assessment�with�Uncertainty�
Iowa�Tribe�of�Oklahoma�Solar�Project�Site,�Johnson�Controls,�March�27,�2013��
�x Inverter:�The�system�design�assumed�40�Advanced�Energy�Solaron�500�kW�inverters,�resulting�in�
a�total�capacity�of�20�MWAC.�The� input�operating�voltage�range� for�this� inverter� is�±330Ͳ600�V�with�a�nominal�power�of�500�kWAC.��
x Array:�To�enable�plant�operation�within� the�manufacturerͲspecified� limits�of� the� inverter,� the�project�was�modeled�assuming�3,621�strings�connected�in�parallel,�each�containing�22�modules�connected�in�series.�The�resulting�DC/AC�ratio�is�1.12.��
x Transformer:� The� analysis� includes� standard� losses� for� stepͲup� transformers,� including�transformer�efficiency.���
Table�5.�Iowa�Tribe�of�Oklahoma�Solar�Project�Design�
Design�Parameter� Yingli�Simulation Jinko�Simulation FirstSolar�SimulationModule� YL280PͲ35b JKM300MͲ72 FSͲ380Nominal�PowerSTC�(W)� 280 300 80�Technology� Polycrystalline Monocrystalline ThinͲFilmArray�Orientation� Fixed�35°�Tilt�0° Azimuth Fixed�35° Tilt�0° Azimuth Fixed�35°�Tilt�0° AzimuthInstalled�DC�Capacity�(MW)� 22.3 22.3 21�Approx.�Number�of�Modules� 79,662 76,912 262,560Inverter� AE�Solaron�500� AE�Solaron�500� AE�Solaron�500�Number�of�inverters� 40 40 40�Nominal�PowerSTC�(kW)� 500 500 500Installed�AC�Capacity�(MW)� 20 20 20�DCͲAC�Ratio� 1.12 1.12 1.05*Standard�Testing�Conditions� ��
ENERGY�SIMULATION�AND�LOSS�ASSUMPTIONS�
Annual� net� energy� production�was� simulated� for� every� hour� of� the� calendar� year� using� PVsyst.� To�determine�the�effective�incident�radiation,�the�horizontal�solar�components�were�translated�to�the�plane�of�array� (POA),�which�was�estimated� to�be�1978�kWh/m2/year.�As�part�of� the�energy� simulation,� loss�factors�were�also�computed�for�each�hour�of�a�calendar�year.�Some�loss�factors�were�applied�uniformly�to�all�operating�conditions.�These�were�estimated�based�on�the�local�environment�and�industryͲstandard�values,� then� entered� directly� into� the� energy�model.� Other� loss� factors�were� calculated� during� the�energy� simulation� process� based� on� userͲdefined� simulation� settings� and� the� hourly� solar� and�meteorological�input�data.�Plant�losses�are�grouped�into�four�main�categories:��
x Effective�irradiation�Ͳ�Horizon�shading,�near�shading,�incident�angle�modifier�factor,�soiling��
x Photovoltaic�conversion�Ͳ�Initial�light�induced�degradation,�nonͲSTC�operation�due�to�irradiance�and�temperature,�panel�quality,�panel�mismatch,�performance�degradation��
x Electrical�Ͳ�DC�wiring,�inverter�efficiency,�inverter�limitation,�AC�wiring,�transformer��
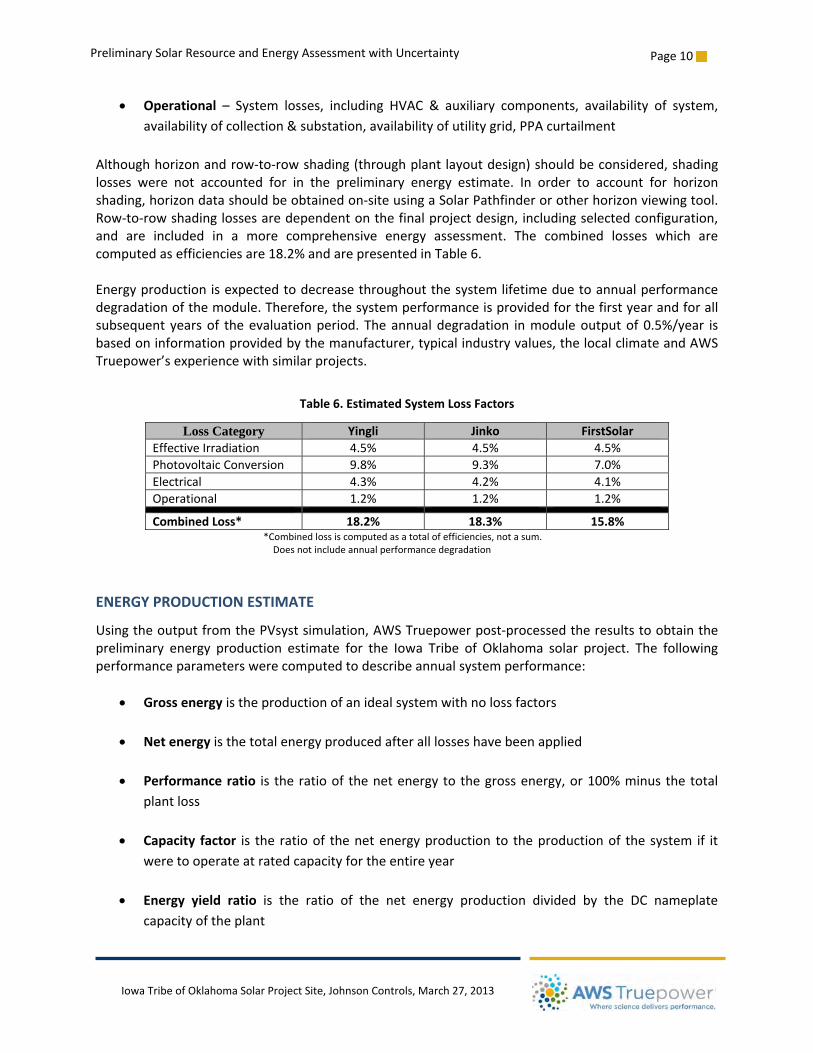
� ����������������������������������������������������������������������������������������������������������������������������������������������������������������Page�10���
�
Preliminary�Solar�Resource�and�Energy�Assessment�with�Uncertainty�
Iowa�Tribe�of�Oklahoma�Solar�Project�Site,�Johnson�Controls,�March�27,�2013��
x Operational� –� System� losses,� including�HVAC�&� auxiliary� components,� availability� of� system,�availability�of�collection�&�substation,�availability�of�utility�grid,�PPA�curtailment�
�Although�horizon�and�rowͲtoͲrow�shading�(through�plant� layout�design)�should�be�considered,�shading�losses�were� not� accounted� for� in� the� preliminary� energy� estimate.� In� order� to� account� for� horizon�shading,�horizon�data�should�be�obtained�onͲsite�using�a�Solar�Pathfinder�or�other�horizon�viewing�tool.�RowͲtoͲrow�shading� losses�are�dependent�on�the�final�project�design,� including�selected�configuration,�and� are� included� in� a� more� comprehensive� energy� assessment.� The� combined� losses� which� are�computed�as�efficiencies�are�18.2%�and�are�presented�in�Table�6.��Energy�production� is�expected�to�decrease�throughout�the�system� lifetime�due�to�annual�performance�degradation�of�the�module.�Therefore,�the�system�performance�is�provided�for�the�first�year�and�for�all�subsequent�years�of� the�evaluation�period.�The�annual�degradation� in�module�output�of�0.5%/year� is�based�on�information�provided�by�the�manufacturer,�typical�industry�values,�the�local�climate�and�AWS�Truepower’s�experience�with�similar�projects.��
Table�6.�Estimated�System�Loss�Factors�
Loss Category Yingli Jinko FirstSolar�Effective�Irradiation� 4.5% 4.5% 4.5%�Photovoltaic�Conversion� 9.8% 9.3% 7.0%�Electrical� 4.3% 4.2% 4.1%�Operational� 1.2% 1.2% 1.2%��
Combined�Loss*� 18.2% 18.3% 15.8%�� � � ����������*Combined�loss�is�computed�as�a�total�of�efficiencies,�not�a�sum.��
��������������Does�not�include�annual�performance�degradation���ENERGY�PRODUCTION�ESTIMATE��
Using�the�output�from�the�PVsyst�simulation,�AWS�Truepower�postͲprocessed�the�results�to�obtain�the�preliminary� energy� production� estimate� for� the� Iowa� Tribe� of�Oklahoma� solar� project.� The� following�performance�parameters�were�computed�to�describe�annual�system�performance:���
x Gross�energy�is�the�production�of�an�ideal�system�with�no�loss�factors��x Net�energy�is�the�total�energy�produced�after�all�losses�have�been�applied��x Performance�ratio� is�the�ratio�of�the�net�energy�to�the�gross�energy,�or�100%�minus�the� total�
plant�loss��x Capacity� factor� is� the� ratio�of� the�net�energy�production� to� the�production�of� the�system� if� it�
were�to�operate�at�rated�capacity�for�the�entire�year��x Energy� yield� ratio� is� the� ratio� of� the� net� energy� production� divided� by� the� DC� nameplate�
capacity�of�the�plant��
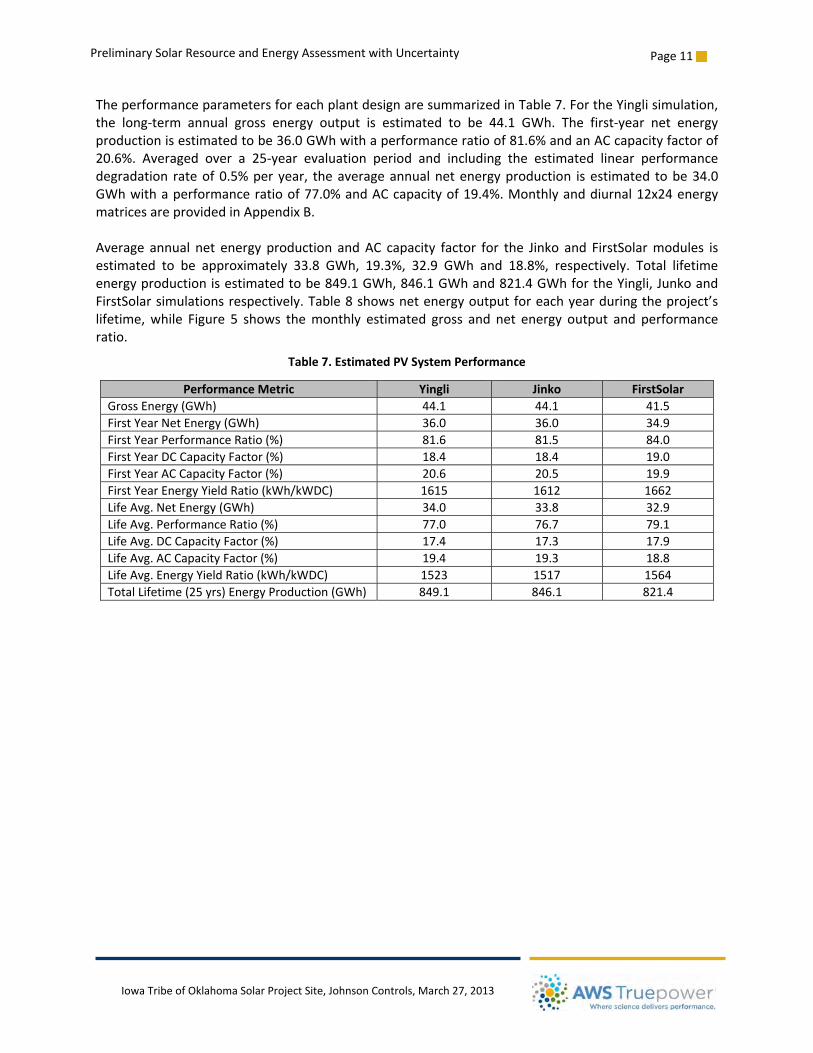
� ����������������������������������������������������������������������������������������������������������������������������������������������������������������Page�11���
�
Preliminary�Solar�Resource�and�Energy�Assessment�with�Uncertainty�
Iowa�Tribe�of�Oklahoma�Solar�Project�Site,�Johnson�Controls,�March�27,�2013��
The�performance�parameters�for�each�plant�design�are�summarized�in�Table�7.�For�the�Yingli�simulation,�the� longͲterm� annual� gross� energy� output� is� estimated� to� be� 44.1� GWh.� The� firstͲyear� net� energy�production�is�estimated�to�be�36.0�GWh�with�a�performance�ratio�of�81.6%�and�an�AC�capacity�factor�of�20.6%.� Averaged� over� a� 25Ͳyear� evaluation� period� and� including� the� estimated� linear� performance�degradation� rate�of�0.5%�per�year,� the�average�annual�net�energy�production� is�estimated� to�be�34.0�GWh�with�a�performance�ratio�of�77.0%�and�AC�capacity�of�19.4%.�Monthly�and�diurnal�12x24�energy�matrices�are�provided�in�Appendix�B.���Average�annual�net�energy�production�and�AC� capacity� factor� for� the� Jinko�and�FirstSolar�modules� is�estimated� to� be� approximately� 33.8� GWh,� 19.3%,� 32.9� GWh� and� 18.8%,� respectively.� Total� lifetime�energy�production� is�estimated�to�be�849.1�GWh,�846.1�GWh�and�821.4�GWh�for�the�Yingli,�Junko�and�FirstSolar�simulations�respectively.�Table�8�shows�net�energy�output�for�each�year�during�the�project’s�lifetime,�while� Figure�5� shows� the�monthly�estimated� gross� and�net�energy�output� and�performance�ratio.�
Table�7.�Estimated�PV�System�Performance�
Performance�Metric� Yingli Jinko FirstSolarGross�Energy�(GWh)� 44.1 44.1 41.5First�Year�Net�Energy�(GWh)� 36.0 36.0 34.9First�Year�Performance�Ratio�(%)� 81.6 81.5 84.0First�Year�DC�Capacity�Factor�(%)� 18.4 18.4 19.0First�Year�AC�Capacity�Factor�(%)� 20.6 20.5 19.9First�Year�Energy�Yield�Ratio�(kWh/kWDC) 1615 1612 1662Life�Avg.�Net�Energy�(GWh)� 34.0 33.8 32.9Life�Avg.�Performance�Ratio�(%)� 77.0 76.7 79.1Life�Avg.�DC�Capacity�Factor�(%)� 17.4 17.3 17.9Life�Avg.�AC�Capacity�Factor�(%)� 19.4 19.3 18.8Life�Avg.�Energy�Yield�Ratio�(kWh/kWDC) 1523 1517 1564Total�Lifetime�(25�yrs)�Energy�Production�(GWh) 849.1 846.1 821.4
�
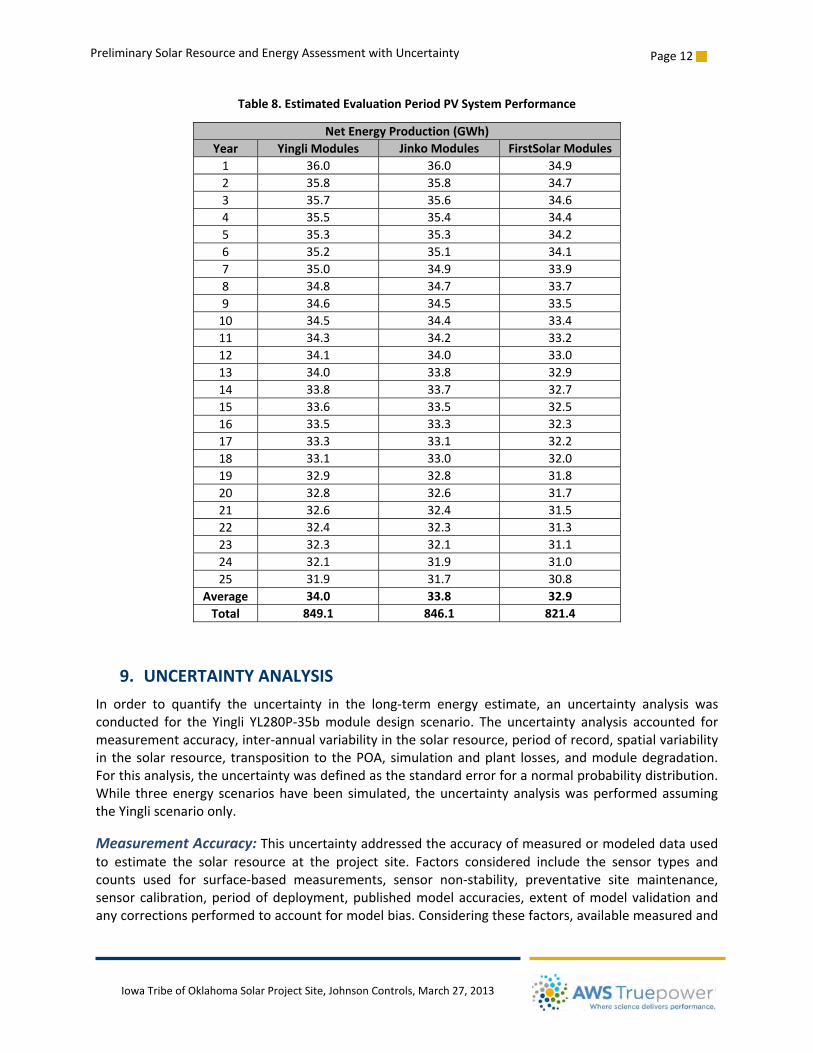
� ����������������������������������������������������������������������������������������������������������������������������������������������������������������Page�12���
�
Preliminary�Solar�Resource�and�Energy�Assessment�with�Uncertainty�
Iowa�Tribe�of�Oklahoma�Solar�Project�Site,�Johnson�Controls,�March�27,�2013��
Table�8.�Estimated�Evaluation�Period�PV�System�Performance�
Net�Energy�Production�(GWh)�Year� Yingli�Modules� Jinko�Modules FirstSolar�Modules�1� 36.0 36.0 34.9�2� 35.8 35.8 34.7�3� 35.7 35.6 34.6�4� 35.5 35.4 34.4�5� 35.3 35.3 34.2�6� 35.2 35.1 34.1�7� 35.0 34.9 33.9�8� 34.8 34.7 33.7�9� 34.6 34.5 33.5�10� 34.5 34.4 33.4�11� 34.3 34.2 33.2�12� 34.1 34.0 33.0�13� 34.0 33.8 32.9�14� 33.8 33.7 32.7�15� 33.6 33.5 32.5�16� 33.5 33.3 32.3�17� 33.3 33.1 32.2�18� 33.1 33.0 32.0�19� 32.9 32.8 31.8�20� 32.8 32.6 31.7�21� 32.6 32.4 31.5�22� 32.4 32.3 31.3�23� 32.3 32.1 31.1�24� 32.1 31.9 31.0�25� 31.9 31.7 30.8�
Average� 34.0 33.8 32.9�Total� 849.1 846.1 821.4�
�
9. UNCERTAINTY�ANALYSIS��In� order� to� quantify� the� uncertainty� in� the� longͲterm� energy� estimate,� an� uncertainty� analysis�was�conducted� for� the� Yingli� YL280PͲ35b�module�design� scenario.� The�uncertainty� analysis� accounted� for�measurement�accuracy,�interͲannual�variability�in�the�solar�resource,�period�of�record,�spatial�variability�in� the�solar� resource,� transposition� to� the�POA,�simulation�and�plant� losses,�and�module�degradation.�For�this�analysis,�the�uncertainty�was�defined�as�the�standard�error�for�a�normal�probability�distribution.�While� three�energy� scenarios�have�been� simulated,� the�uncertainty�analysis�was�performed�assuming�the�Yingli�scenario�only.��
Measurement�Accuracy:�This�uncertainty�addressed�the�accuracy�of�measured�or�modeled�data�used�to� estimate� the� solar� resource� at� the� project� site.� Factors� considered� include� the� sensor� types� and�counts� used� for� surfaceͲbased� measurements,� sensor� nonͲstability,� preventative� site� maintenance,�sensor�calibration,�period�of�deployment,�published�model�accuracies,�extent�of�model�validation�and�any�corrections�performed�to�account�for�model�bias.�Considering�these�factors,�available�measured�and�
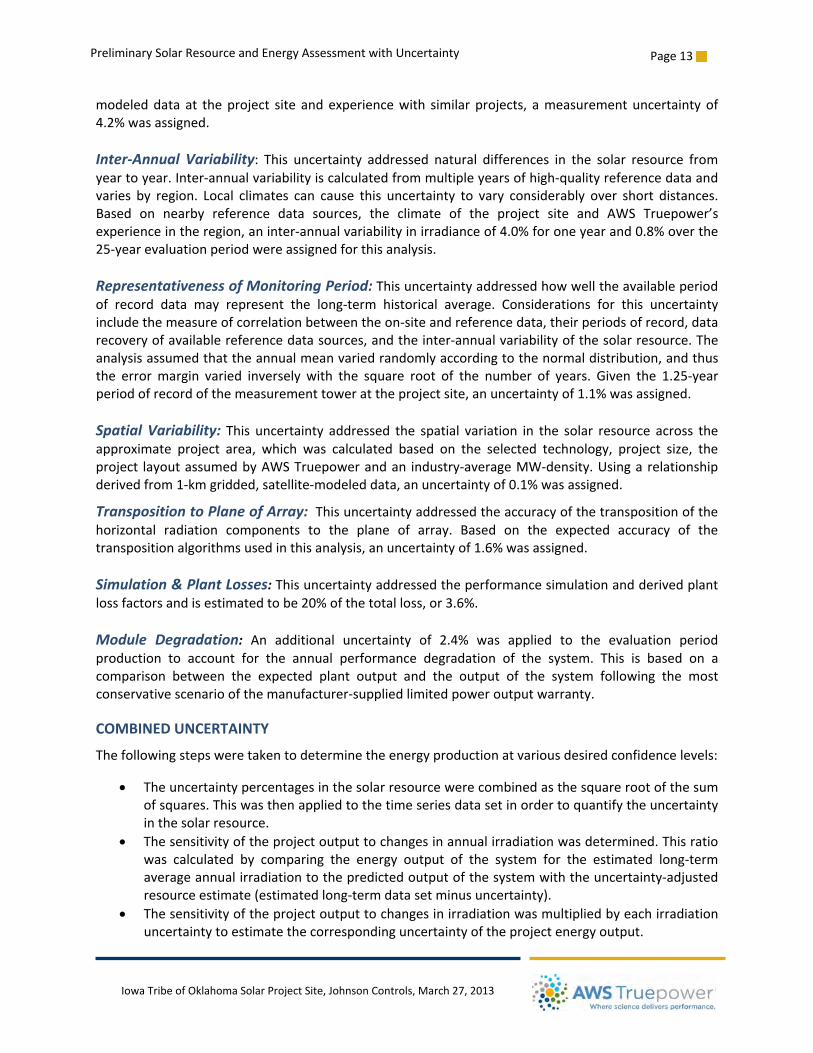
� ����������������������������������������������������������������������������������������������������������������������������������������������������������������Page�13���
�
Preliminary�Solar�Resource�and�Energy�Assessment�with�Uncertainty�
Iowa�Tribe�of�Oklahoma�Solar�Project�Site,�Johnson�Controls,�March�27,�2013��
modeled�data�at� the�project� site�and�experience�with� similar�projects,�a�measurement�uncertainty�of�4.2%�was�assigned.��InterͲAnnual�Variability:� This� uncertainty� addressed�natural�differences� in� the� solar� resource� from�year�to�year.�InterͲannual�variability�is�calculated�from�multiple�years�of�highͲquality�reference�data�and�varies�by� region.� Local� climates� can� cause� this�uncertainty� to� vary� considerably�over� short�distances.�Based� on� nearby� reference� data� sources,� the� climate� of� the� project� site� and� AWS� Truepower’s�experience�in�the�region,�an�interͲannual�variability�in�irradiance�of�4.0%�for�one�year�and�0.8%�over�the�25Ͳyear�evaluation�period�were�assigned�for�this�analysis.��Representativeness�of�Monitoring�Period:�This�uncertainty�addressed�how�well�the�available�period�of� record� data�may� represent� the� longͲterm� historical� average.� Considerations� for� this� uncertainty�include�the�measure�of�correlation�between�the�onͲsite�and�reference�data,�their�periods�of�record,�data�recovery�of�available�reference�data�sources,�and�the�interͲannual�variability�of�the�solar�resource.�The�analysis�assumed�that�the�annual�mean�varied�randomly�according�to�the�normal�distribution,�and�thus�the� error�margin� varied� inversely�with� the� square� root� of� the� number� of� years.�Given� the� 1.25Ͳyear�period�of�record�of�the�measurement�tower�at�the�project�site,�an�uncertainty�of�1.1%�was�assigned.��Spatial�Variability:�This�uncertainty�addressed� the� spatial�variation� in� the� solar� resource�across� the�approximate� project� area,�which�was� calculated� based� on� the� selected� technology,� project� size,� the�project� layout�assumed�by�AWS�Truepower�and�an� industryͲaverage�MWͲdensity.�Using�a�relationship�derived�from�1Ͳkm�gridded,�satelliteͲmodeled�data,�an�uncertainty�of�0.1%�was�assigned.�
Transposition�to�Plane�of�Array:��This�uncertainty�addressed�the�accuracy�of�the�transposition�of�the�horizontal� radiation� components� to� the� plane� of� array.� Based� on� the� expected� accuracy� of� the�transposition�algorithms�used�in�this�analysis,�an�uncertainty�of�1.6%�was�assigned.��Simulation�&�Plant�Losses:�This�uncertainty�addressed�the�performance�simulation�and�derived�plant�loss�factors�and�is�estimated�to�be�20%�of�the�total�loss,�or�3.6%.��Module� Degradation:� An� additional� uncertainty� of� 2.4%� was� applied� to� the� evaluation� period�production� to� account� for� the� annual� performance� degradation� of� the� system.� This� is� based� on� a�comparison� between� the� expected� plant� output� and� the� output� of� the� system� following� the�most�conservative�scenario�of�the�manufacturerͲsupplied�limited�power�output�warranty.�
COMBINED�UNCERTAINTY�
The�following�steps�were�taken�to�determine�the�energy�production�at�various�desired�confidence�levels:�
x The�uncertainty�percentages�in�the�solar�resource�were�combined�as�the�square�root�of�the�sum�of�squares.�This�was�then�applied�to�the�time�series�data�set�in�order�to�quantify�the�uncertainty�in�the�solar�resource.�
x The�sensitivity�of�the�project�output�to�changes�in�annual�irradiation�was�determined.�This�ratio�was� calculated� by� comparing� the� energy� output� of� the� system� for� the� estimated� longͲterm�average�annual�irradiation�to�the�predicted�output�of�the�system�with�the�uncertaintyͲadjusted�resource�estimate�(estimated�longͲterm�data�set�minus�uncertainty).�
x The�sensitivity�of�the�project�output�to�changes�in�irradiation�was�multiplied�by�each�irradiation�uncertainty�to�estimate�the�corresponding�uncertainty�of�the�project�energy�output.�
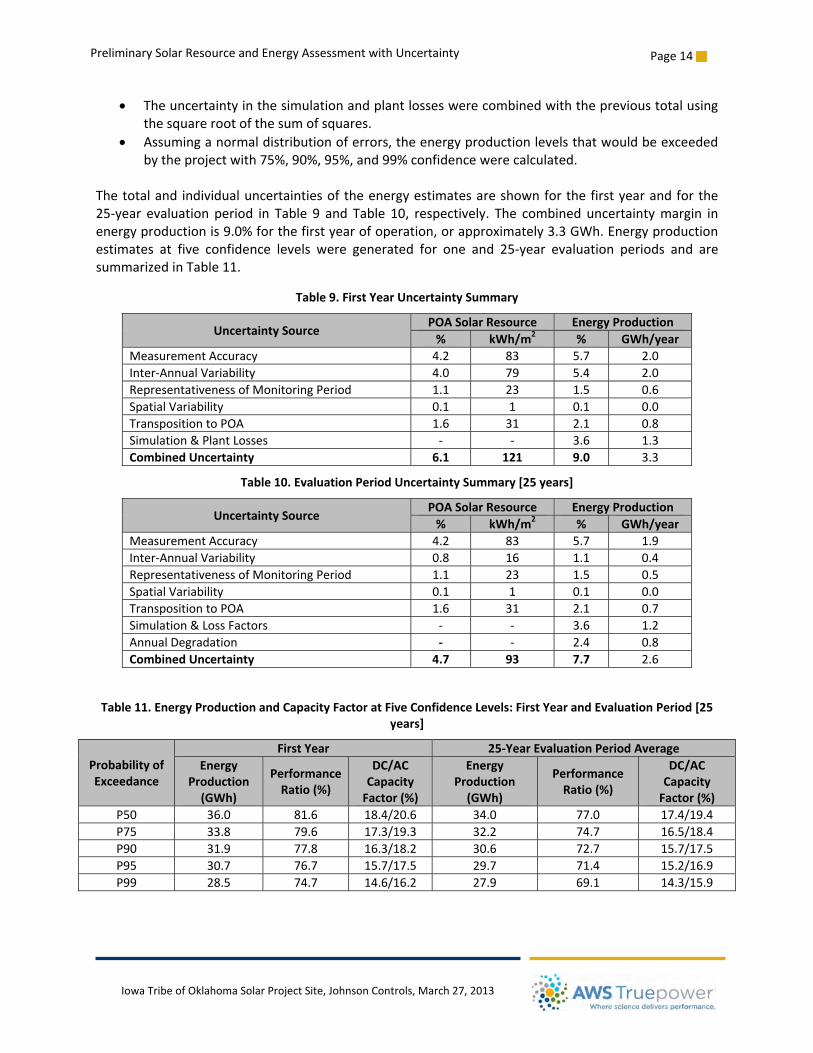
� ����������������������������������������������������������������������������������������������������������������������������������������������������������������Page�14���
�
Preliminary�Solar�Resource�and�Energy�Assessment�with�Uncertainty�
Iowa�Tribe�of�Oklahoma�Solar�Project�Site,�Johnson�Controls,�March�27,�2013��
x The�uncertainty�in�the�simulation�and�plant�losses�were�combined�with�the�previous�total�using�the�square�root�of�the�sum�of�squares.�
x Assuming�a�normal�distribution�of�errors,�the�energy�production�levels�that�would�be�exceeded�by�the�project�with�75%,�90%,�95%,�and�99%�confidence�were�calculated.�
�The�total�and� individual�uncertainties�of�the�energy�estimates�are�shown�for�the�first�year�and�for�the�25Ͳyear�evaluation�period� in�Table�9�and�Table�10,� respectively.�The� combined�uncertainty�margin� in�energy�production�is�9.0%�for�the�first�year�of�operation,�or�approximately�3.3�GWh.�Energy�production�estimates� at� five� confidence� levels�were� generated� for� one� and� 25Ͳyear� evaluation� periods� and� are�summarized�in�Table�11.�
Table�9.�First�Year�Uncertainty�Summary�
Uncertainty�Source� POA�Solar�Resource Energy�Production% kWh/m2 %� GWh/year
Measurement�Accuracy� 4.2 83 5.7� 2.0InterͲAnnual�Variability� 4.0 79 5.4� 2.0Representativeness�of�Monitoring�Period 1.1 23 1.5� 0.6Spatial�Variability� 0.1 1 0.1� 0.0Transposition�to�POA 1.6 31 2.1� 0.8Simulation�&�Plant�Losses� Ͳ Ͳ 3.6� 1.3Combined�Uncertainty� 6.1 121 9.0� 3.3
Table�10.�Evaluation�Period�Uncertainty�Summary�[25�years]�
Uncertainty�Source� POA�Solar�Resource Energy�Production% kWh/m2 %� GWh/year
Measurement�Accuracy� 4.2 83 5.7� 1.9InterͲAnnual�Variability� 0.8 16 1.1� 0.4Representativeness�of�Monitoring�Period 1.1 23 1.5� 0.5Spatial�Variability� 0.1 1 0.1� 0.0Transposition�to�POA 1.6 31 2.1� 0.7Simulation�&�Loss�Factors� Ͳ Ͳ 3.6� 1.2Annual�Degradation� Ͳ Ͳ 2.4� 0.8Combined�Uncertainty� 4.7 93 7.7� 2.6
�
Table�11.�Energy�Production�and�Capacity�Factor�at�Five�Confidence�Levels:�First�Year�and�Evaluation�Period�[25�years]�
Probability�of�Exceedance�
First�Year 25ͲYear�Evaluation�Period�AverageEnergy�
Production�(GWh)�
Performance�Ratio�(%)�
DC/AC�Capacity�Factor�(%)�
Energy�Production�(GWh)�
Performance�Ratio�(%)�
DC/AC�Capacity�Factor�(%)�
P50� 36.0� 81.6� 18.4/20.6� 34.0� 77.0� 17.4/19.4�P75� 33.8� 79.6� 17.3/19.3 32.2� 74.7� 16.5/18.4P90� 31.9� 77.8� 16.3/18.2� 30.6� 72.7� 15.7/17.5�P95� 30.7� 76.7� 15.7/17.5 29.7� 71.4� 15.2/16.9P99� 28.5� 74.7� 14.6/16.2� 27.9� 69.1� 14.3/15.9�
�

� ����������������������������������������������������������������������������������������������������������������������������������������������������������������Page�15���
�
Preliminary�Solar�Resource�and�Energy�Assessment�with�Uncertainty�
Iowa�Tribe�of�Oklahoma�Solar�Project�Site,�Johnson�Controls,�March�27,�2013��
10. ��SUMMARY�The�preliminary� longͲterm�energy�production�potential�was�estimated�for�the� Iowa�Tribe�of�Oklahoma�Solar�project� site�near�Oklahoma�City,�Oklahoma.� Solar�and�meteorological� resource�data� from�a�15Ͳmonth�onͲsite�measurement�program� from�November�2011� through� January�2013�were�evaluated� to�estimate� the� longͲterm� solar� resource� and� uncertainty� at� the�Mast� 0149� location.� Using� estimated�irradiance� from� the� CPR� satellite�model� and� a�methodology� to� adjust� data� having� a� short� period� of�record�to�the�longͲterm,�AWS�Truepower�estimated�the�longͲterm�GHI�to�be�1722�kWh/m2/year.�A�TMY�data�set�was� then�developed�and�scaled� to� the� longͲterm�solar� radiation�estimates.�The�mean�annual�temperature�is�expected�to�be�approximately�16.2°C�
Preliminary�energy�production�potential�was�estimated� for� the�plant�using� a�primary�design�of�Yingli�YL280PͲ35b�modules��and�two�additional�designs�using�Jinko�JKM300MͲ72�and�First�Solar�FSͲ380�module�types.�The� firstͲyear�gross�energy�output�of� the� Iowa�Tribe�of�Oklahoma�solar�project�using� the�Yingli�YL280PͲ35b�modules�is�estimated�to�be�44.1�GWh.�The�firstͲyear�net�energy�production�is�estimated�to�be�36.0�GWh�with�a�performance� ratio�of�81.6%�and�an�AC� capacity� factor�and�energy�yield� ratio�of�20.6%�and�1615� kWh/kW,� respectively.�Averaged�over�a�25Ͳyear�evaluation�period�and� including� the�estimated�performance�degradation,�the�average�annual�net�energy�production�is�estimated�to�be�34.0�GWh,�with�an�average�performance�ratio�of�77.0%�and�AC�capacity�of�19.4%.�Over�a�25Ͳyear�evaluation�period,� the�combined�uncertainty�of�7.7%� in�average�annual�production,�or�2.6�GWh,� results� in�a�net�plant�output�estimated�to�be�at�least�30.6�GWh/year�with�90%�confidence.��
�
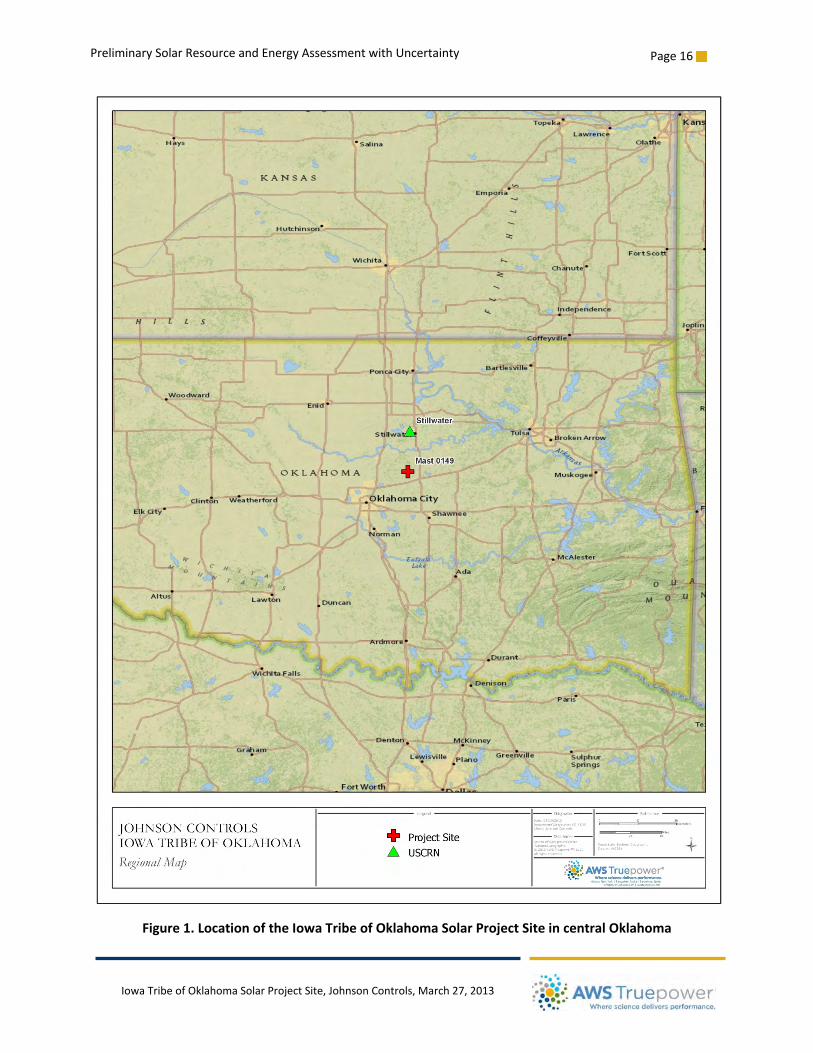
� ����������������������������������������������������������������������������������������������������������������������������������������������������������������Page�16���
�
Preliminary�Solar�Resource�and�Energy�Assessment�with�Uncertainty�
Iowa�Tribe�of�Oklahoma�Solar�Project�Site,�Johnson�Controls,�March�27,�2013��
�
Figure�1.�Location�of�the�Iowa�Tribe�of�Oklahoma�Solar�Project�Site�in�central�Oklahoma��
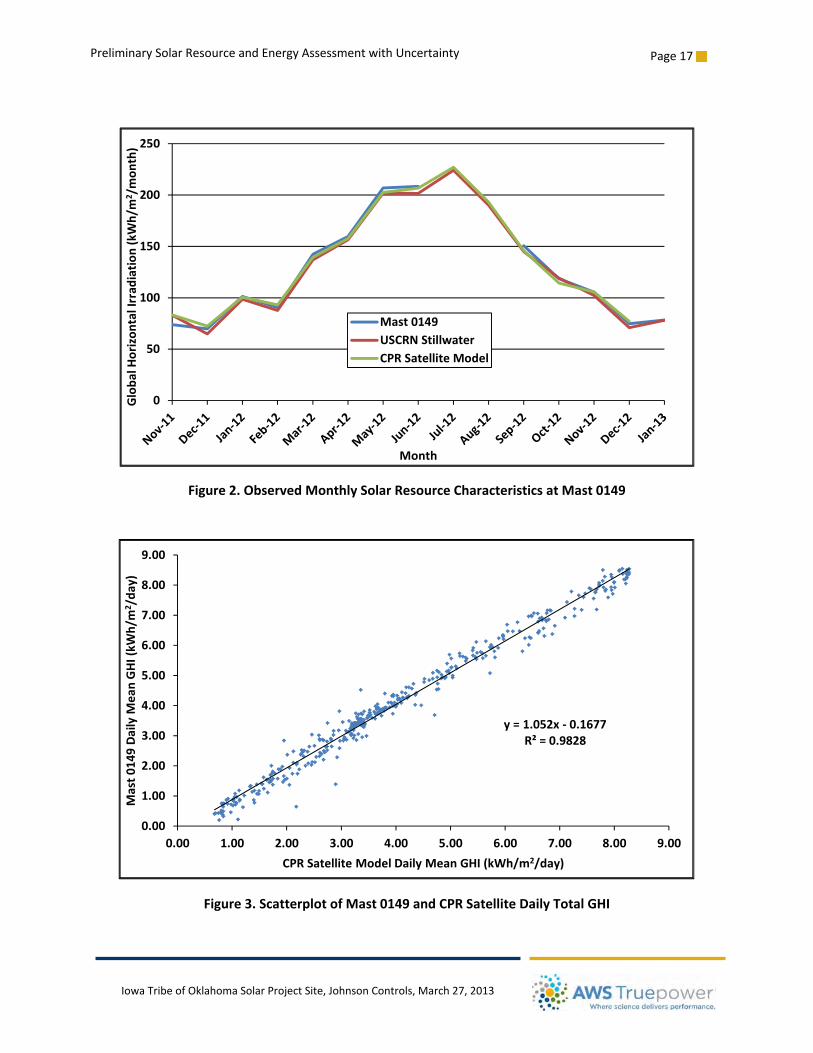
� ����������������������������������������������������������������������������������������������������������������������������������������������������������������Page�17���
�
Preliminary�Solar�Resource�and�Energy�Assessment�with�Uncertainty�
Iowa�Tribe�of�Oklahoma�Solar�Project�Site,�Johnson�Controls,�March�27,�2013��
�
�
Figure�2.�Observed�Monthly�Solar�Resource�Characteristics�at�Mast�0149�
�
�
Figure�3.�Scatterplot�of�Mast�0149�and�CPR�Satellite�Daily�Total�GHI�
�
0
50
100
150
200
250Globa
l�Horizon
tal�Irrad
iation
�(kWh/m
2 /mon
th)
Month
Mast�0149USCRN�StillwaterCPR�Satellite�Model
y�=�1.052x�Ͳ 0.1677R²�=�0.9828
0.00
1.00
2.00
3.00
4.00
5.00
6.00
7.00
8.00
9.00
0.00 1.00 2.00 3.00 4.00 5.00 6.00 7.00 8.00 9.00
Mast�0
149�Daily�M
ean�GHI�(kW
h/m
2 /da
y)
CPR�Satellite�Model�Daily�Mean�GHI�(kWh/m2/day)
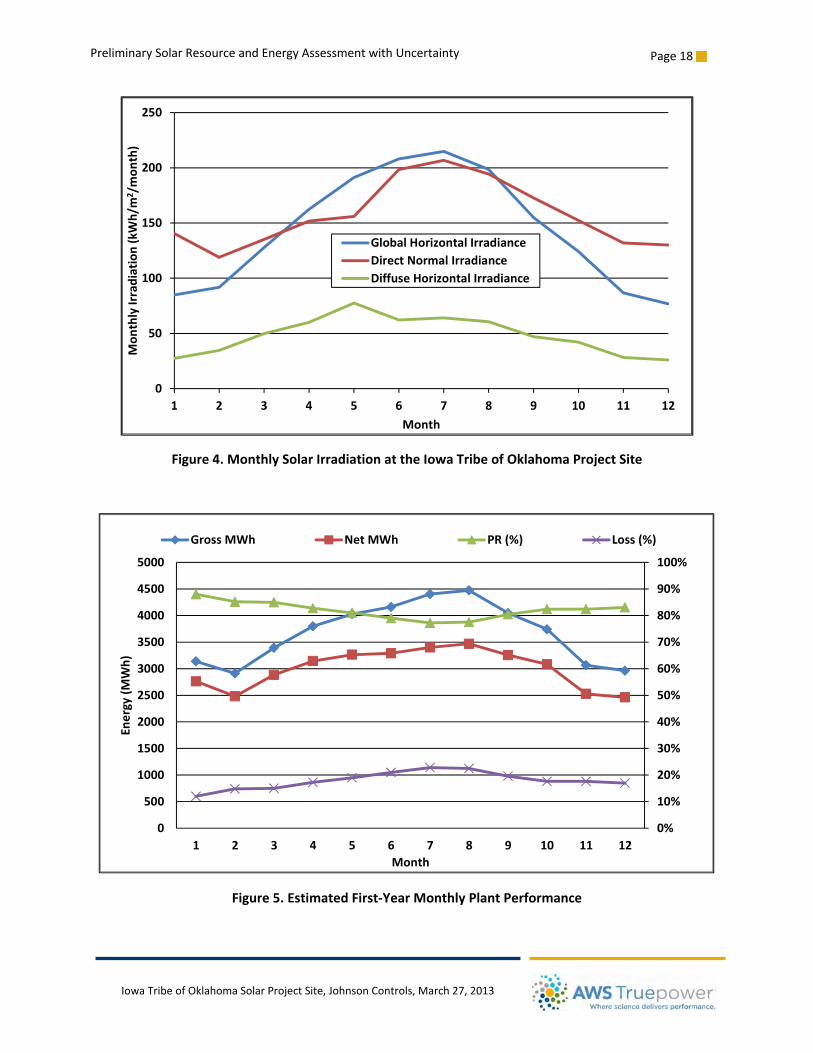
� ����������������������������������������������������������������������������������������������������������������������������������������������������������������Page�18���
�
Preliminary�Solar�Resource�and�Energy�Assessment�with�Uncertainty�
Iowa�Tribe�of�Oklahoma�Solar�Project�Site,�Johnson�Controls,�March�27,�2013��
�
Figure�4.�Monthly�Solar�Irradiation�at�the�Iowa�Tribe�of�Oklahoma�Project�Site�
�
�
Figure�5.�Estimated�FirstͲYear�Monthly�Plant�Performance�
�
0
50
100
150
200
250
1 2 3 4 5 6 7 8 9 10 11 12
Mon
thly�Irradiation�(kWh/m
2 /mon
th)
Month
Global�Horizontal�IrradianceDirect�Normal�IrradianceDiffuse�Horizontal�Irradiance
0%
10%
20%
30%
40%
50%
60%
70%
80%
90%
100%
0
500
1000
1500
2000
2500
3000
3500
4000
4500
5000
1 2 3 4 5 6 7 8 9 10 11 12
Energy�(M
Wh)
Month
Gross�MWh Net�MWh PR�(%) Loss�(%)
� ����������������������������������������������������������������������������������������������������������������������������������������������������������������Page�19���
�
Preliminary�Solar�Resource�and�Energy�Assessment�with�Uncertainty�
Iowa�Tribe�of�Oklahoma�Solar�Project�Site,�Johnson�Controls,�March�27,�2013��
�
�
�
�
APPENDIX�A�–�REFERENCE�DATA�SOURCES��
�
�
�
�
�
�
�
�
�
�
�
�
�
�
�
�
�
�
�
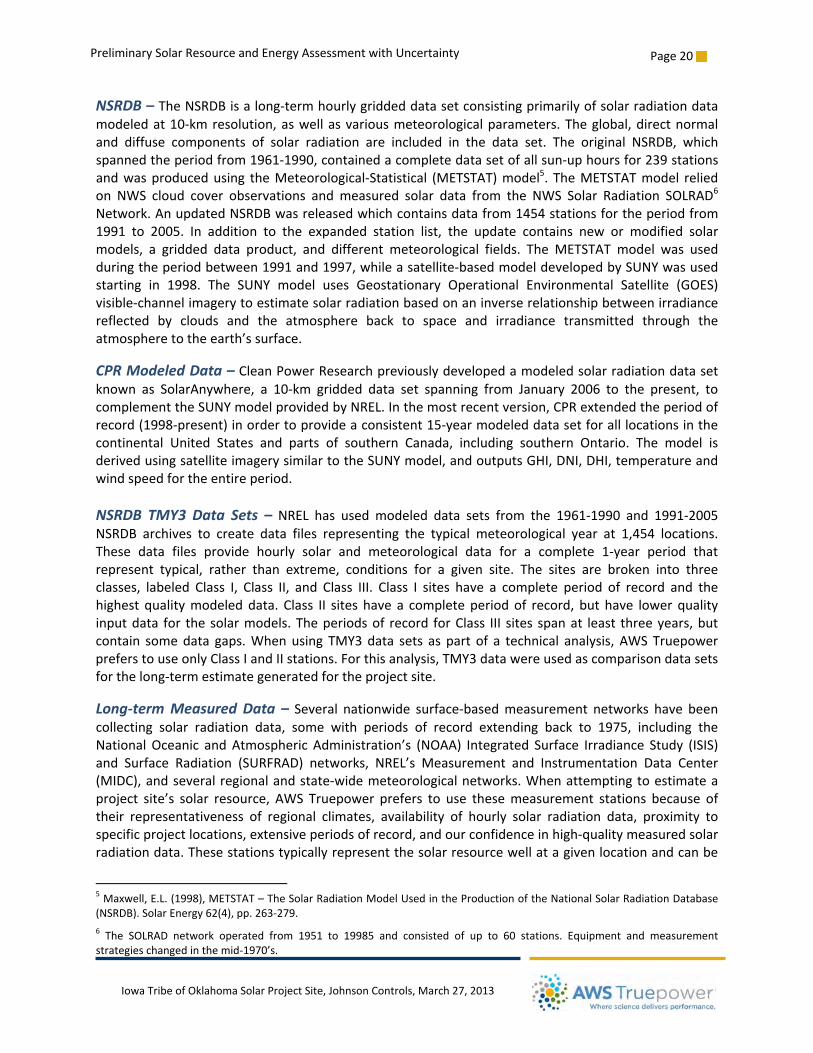
� ����������������������������������������������������������������������������������������������������������������������������������������������������������������Page�20���
�
Preliminary�Solar�Resource�and�Energy�Assessment�with�Uncertainty�
Iowa�Tribe�of�Oklahoma�Solar�Project�Site,�Johnson�Controls,�March�27,�2013��
NSRDB�–�The�NSRDB�is�a�longͲterm�hourly�gridded�data�set�consisting�primarily�of�solar�radiation�data�modeled�at�10Ͳkm�resolution,�as�well�as�various�meteorological�parameters.�The�global,�direct�normal�and� diffuse� components� of� solar� radiation� are� included� in� the� data� set.� The� original� NSRDB,�which�spanned�the�period�from�1961Ͳ1990,�contained�a�complete�data�set�of�all�sunͲup�hours�for�239�stations�and�was�produced�using� the�MeteorologicalͲStatistical� (METSTAT)�model5.�The�METSTAT�model� relied�on�NWS� cloud� cover� observations� and�measured� solar� data� from� the�NWS� Solar� Radiation� SOLRAD6�Network.�An�updated�NSRDB�was�released�which�contains�data�from�1454�stations�for�the�period�from�1991� to� 2005.� In� addition� to� the� expanded� station� list,� the� update� contains� new� or�modified� solar�models,� a� gridded� data� product,� and� different�meteorological� fields.� The�METSTAT�model�was� used�during�the�period�between�1991�and�1997,�while�a�satelliteͲbased�model�developed�by�SUNY�was�used�starting� in� 1998.� The� SUNY� model� uses� Geostationary� Operational� Environmental� Satellite� (GOES)�visibleͲchannel�imagery�to�estimate�solar�radiation�based�on�an�inverse�relationship�between�irradiance�reflected� by� clouds� and� the� atmosphere� back� to� space� and� irradiance� transmitted� through� the�atmosphere�to�the�earth’s�surface.�
CPR�Modeled�Data�–�Clean�Power�Research�previously�developed�a�modeled�solar�radiation�data�set�known� as� SolarAnywhere,� a� 10Ͳkm� gridded� data� set� spanning� from� January� 2006� to� the� present,� to�complement�the�SUNY�model�provided�by�NREL.�In�the�most�recent�version,�CPR�extended�the�period�of�record�(1998Ͳpresent)�in�order�to�provide�a�consistent�15Ͳyear�modeled�data�set�for�all�locations�in�the�continental� United� States� and� parts� of� southern� Canada,� including� southern� Ontario.� The�model� is�derived�using�satellite�imagery�similar�to�the�SUNY�model,�and�outputs�GHI,�DNI,�DHI,�temperature�and�wind�speed�for�the�entire�period.��NSRDB� TMY3�Data� Sets� –�NREL� has� used�modeled� data� sets� from� the� 1961Ͳ1990� and� 1991Ͳ2005�NSRDB� archives� to� create� data� files� representing� the� typical�meteorological� year� at� 1,454� locations.�These� data� files� provide� hourly� solar� and� meteorological� data� for� a� complete� 1Ͳyear� period� that�represent� typical,� rather� than� extreme,� conditions� for� a� given� site.� The� sites� are� broken� into� three�classes,� labeled�Class� I,�Class� II,� and�Class� III.�Class� I� sites�have� a� complete� period�of� record� and� the�highest�quality�modeled�data.�Class� II� sites�have�a� complete�period�of� record,�but�have� lower�quality�input�data� for� the�solar�models.�The�periods�of� record� for�Class� III�sites�span�at� least� three�years,�but�contain� some�data�gaps.�When�using�TMY3�data� sets�as�part�of�a� technical�analysis,�AWS�Truepower�prefers�to�use�only�Class�I�and�II�stations.�For�this�analysis,�TMY3�data�were�used�as�comparison�data�sets�for�the�longͲterm�estimate�generated�for�the�project�site.�
LongͲterm�Measured�Data�–� Several�nationwide� surfaceͲbased�measurement�networks�have�been�collecting� solar� radiation� data,� some� with� periods� of� record� extending� back� to� 1975,� including� the�National�Oceanic�and�Atmospheric�Administration’s� (NOAA)� Integrated� Surface� Irradiance� Study� (ISIS)�and� Surface� Radiation� (SURFRAD)� networks,� NREL’s�Measurement� and� Instrumentation� Data� Center�(MIDC),�and�several�regional�and�stateͲwide�meteorological�networks.�When�attempting�to�estimate�a�project� site’s� solar� resource,�AWS�Truepower�prefers� to�use� these�measurement� stations�because�of�their� representativeness� of� regional� climates,� availability� of� hourly� solar� radiation� data,� proximity� to�specific�project�locations,�extensive�periods�of�record,�and�our�confidence�in�highͲquality�measured�solar�radiation�data.�These�stations�typically�represent�the�solar�resource�well�at�a�given�location�and�can�be�
������������������������������������������������������������5�Maxwell,�E.L.�(1998),�METSTAT�–�The�Solar�Radiation�Model�Used�in�the�Production�of�the�National�Solar�Radiation�Database�(NSRDB).�Solar�Energy�62(4),�pp.�263Ͳ279.�6� The� SOLRAD� network� operated� from� 1951� to� 19985� and� consisted� of� up� to� 60� stations.� Equipment� and�measurement�strategies�changed�in�the�midͲ1970’s.�

� ����������������������������������������������������������������������������������������������������������������������������������������������������������������Page�21���
�
Preliminary�Solar�Resource�and�Energy�Assessment�with�Uncertainty�
Iowa�Tribe�of�Oklahoma�Solar�Project�Site,�Johnson�Controls,�March�27,�2013��
used� to�determine� the� longͲterm� solar� resource�and� to�adjust�modeled�data� to�account� for�potential�biases.�
Data�was�examined�from�nearby�United�States�Climate�Reference�Network�(USCRN)�station�at�Stillwater.�The�USCRN�was�established�by�NOAA� in�2000� to�help�detect� climate� change� in� the�United�States.�By�meeting�the�requirements�of�the�Global�Climate�Observing�System� (GCOS),�the�network’s�122�stations�are�used� continuously� in�operational� climate�monitoring�activities�and� for�understanding� current�and�historical� climate� anomalies.� Stations� are�purposely� sited� in� stable� environments� that� are�unlikely� to�experience�human�activity.�Solar�radiation� is�measured�on�a�2Ͳsecond�sampling� interval�with�a�Kipp�&�Zonen� SP� Lite�Pyranometer� and� translated� into�hourͲaveraged�data� records.� Sensors�undergo� annual�maintenance.���������������������������������������

� ����������������������������������������������������������������������������������������������������������������������������������������������������������������Page�22���
�
Preliminary�Solar�Resource�and�Energy�Assessment�with�Uncertainty�
Iowa�Tribe�of�Oklahoma�Solar�Project�Site,�Johnson�Controls,�March�27,�2013��
��������
APPENDIX�B�–�MONTHLY/DIURNAL�ENERGY�MATRICES��
�
�
�
�
�
�
�
�
�
�
�
�
�
�
�
�
�
�
�
�
�
�
�
�
�
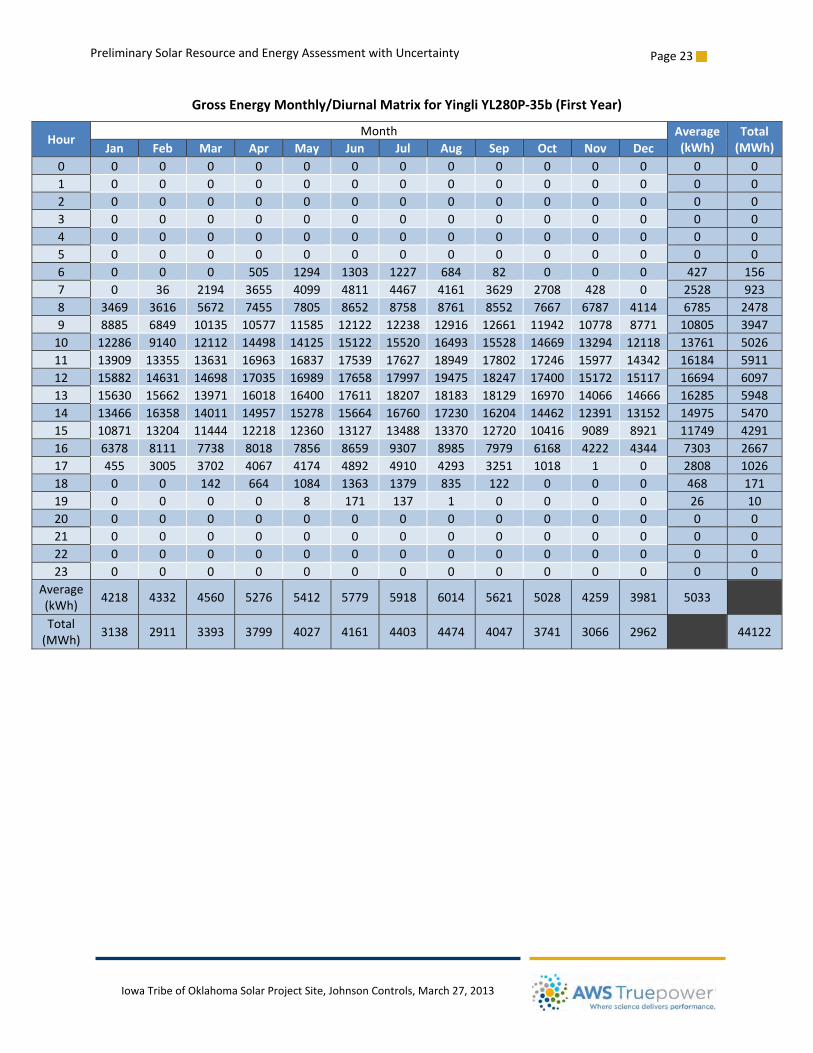
� ����������������������������������������������������������������������������������������������������������������������������������������������������������������Page�23���
�
Preliminary�Solar�Resource�and�Energy�Assessment�with�Uncertainty�
Iowa�Tribe�of�Oklahoma�Solar�Project�Site,�Johnson�Controls,�March�27,�2013��
Gross�Energy�Monthly/Diurnal�Matrix�for�Yingli�YL280PͲ35b�(First�Year)�
Hour� Month� Average�(kWh)�
Total�(MWh)�Jan� Feb� Mar� Apr� May� Jun� Jul� Aug� Sep� Oct� Nov� Dec�
0� 0� 0� 0� 0� 0� 0� 0� 0� 0� 0� 0� 0� 0� 0�1� 0� 0� 0� 0� 0� 0� 0� 0� 0� 0� 0� 0� 0� 0�2� 0� 0� 0� 0� 0� 0� 0� 0� 0� 0� 0� 0� 0� 0�3� 0� 0� 0� 0� 0� 0� 0� 0� 0� 0� 0� 0� 0� 0�4� 0� 0� 0� 0� 0� 0� 0� 0� 0� 0� 0� 0� 0� 0�5� 0� 0� 0� 0� 0� 0� 0� 0� 0� 0� 0� 0� 0� 0�6� 0� 0� 0� 505� 1294� 1303� 1227� 684� 82� 0� 0� 0� 427� 156�7� 0� 36� 2194� 3655� 4099� 4811� 4467� 4161� 3629� 2708� 428� 0� 2528� 923�8� 3469� 3616� 5672� 7455� 7805� 8652� 8758� 8761� 8552� 7667� 6787� 4114� 6785� 2478�9� 8885� 6849� 10135� 10577� 11585� 12122� 12238� 12916� 12661� 11942� 10778� 8771� 10805� 3947�10� 12286� 9140� 12112� 14498� 14125� 15122� 15520� 16493� 15528� 14669� 13294� 12118� 13761� 5026�11� 13909� 13355� 13631� 16963� 16837� 17539� 17627� 18949� 17802� 17246� 15977� 14342� 16184� 5911�12� 15882� 14631� 14698� 17035� 16989� 17658� 17997� 19475� 18247� 17400� 15172� 15117� 16694� 6097�13� 15630� 15662� 13971� 16018� 16400� 17611� 18207� 18183� 18129� 16970� 14066� 14666� 16285� 5948�14� 13466� 16358� 14011� 14957� 15278� 15664� 16760� 17230� 16204� 14462� 12391� 13152� 14975� 5470�15� 10871� 13204� 11444� 12218� 12360� 13127� 13488� 13370� 12720� 10416� 9089� 8921� 11749� 4291�16� 6378� 8111� 7738� 8018� 7856� 8659� 9307� 8985� 7979� 6168� 4222� 4344� 7303� 2667�17� 455� 3005� 3702� 4067� 4174� 4892� 4910� 4293� 3251� 1018� 1� 0� 2808� 1026�18� 0� 0� 142� 664� 1084� 1363� 1379� 835� 122� 0� 0� 0� 468� 171�19� 0� 0� 0� 0� 8� 171� 137� 1� 0� 0� 0� 0� 26� 10�20� 0� 0� 0� 0� 0� 0� 0� 0� 0� 0� 0� 0� 0� 0�21� 0� 0� 0� 0� 0� 0� 0� 0� 0� 0� 0� 0� 0� 0�22� 0� 0� 0� 0� 0� 0� 0� 0� 0� 0� 0� 0� 0� 0�23� 0� 0� 0� 0� 0� 0� 0� 0� 0� 0� 0� 0� 0� 0�
Average�(kWh)� 4218� 4332� 4560� 5276� 5412� 5779� 5918� 6014� 5621� 5028� 4259� 3981� 5033�
Total�(MWh)� 3138� 2911� 3393� 3799� 4027� 4161� 4403� 4474� 4047� 3741� 3066� 2962� 44122�
� �
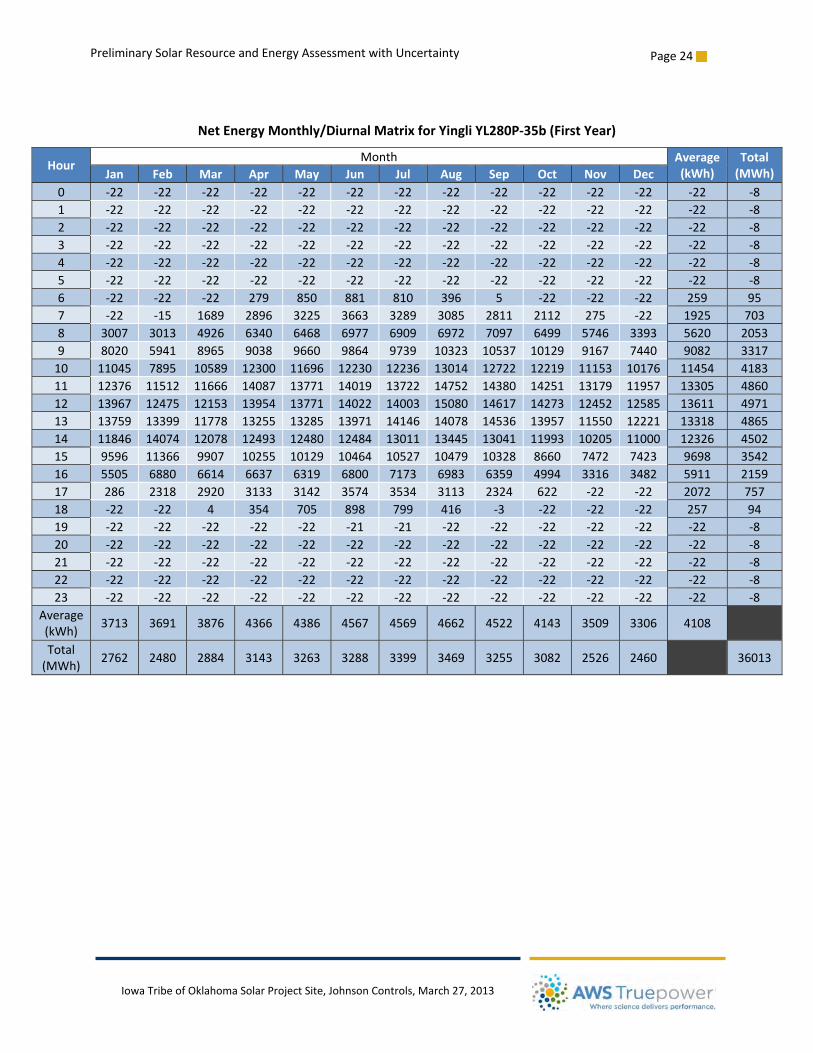
� ����������������������������������������������������������������������������������������������������������������������������������������������������������������Page�24���
�
Preliminary�Solar�Resource�and�Energy�Assessment�with�Uncertainty�
Iowa�Tribe�of�Oklahoma�Solar�Project�Site,�Johnson�Controls,�March�27,�2013��
�
Net�Energy�Monthly/Diurnal�Matrix�for�Yingli�YL280PͲ35b�(First�Year)�
Hour� Month� Average�(kWh)�
Total�(MWh)�Jan� Feb� Mar� Apr� May� Jun� Jul� Aug� Sep� Oct� Nov� Dec�
0� Ͳ22� Ͳ22� Ͳ22� Ͳ22� Ͳ22� Ͳ22� Ͳ22� Ͳ22� Ͳ22� Ͳ22� Ͳ22� Ͳ22� Ͳ22� Ͳ8�1� Ͳ22� Ͳ22� Ͳ22� Ͳ22� Ͳ22� Ͳ22� Ͳ22� Ͳ22� Ͳ22� Ͳ22� Ͳ22� Ͳ22� Ͳ22� Ͳ8�2� Ͳ22� Ͳ22� Ͳ22� Ͳ22� Ͳ22� Ͳ22� Ͳ22� Ͳ22� Ͳ22� Ͳ22� Ͳ22� Ͳ22� Ͳ22� Ͳ8�3� Ͳ22� Ͳ22� Ͳ22� Ͳ22� Ͳ22� Ͳ22� Ͳ22� Ͳ22� Ͳ22� Ͳ22� Ͳ22� Ͳ22� Ͳ22� Ͳ8�4� Ͳ22� Ͳ22� Ͳ22� Ͳ22� Ͳ22� Ͳ22� Ͳ22� Ͳ22� Ͳ22� Ͳ22� Ͳ22� Ͳ22� Ͳ22� Ͳ8�5� Ͳ22� Ͳ22� Ͳ22� Ͳ22� Ͳ22� Ͳ22� Ͳ22� Ͳ22� Ͳ22� Ͳ22� Ͳ22� Ͳ22� Ͳ22� Ͳ8�6� Ͳ22� Ͳ22� Ͳ22� 279� 850� 881� 810� 396� 5� Ͳ22� Ͳ22� Ͳ22� 259� 95�7� Ͳ22� Ͳ15� 1689� 2896� 3225� 3663� 3289� 3085� 2811� 2112� 275� Ͳ22� 1925� 703�8� 3007� 3013� 4926� 6340� 6468� 6977� 6909� 6972� 7097� 6499� 5746� 3393� 5620� 2053�9� 8020� 5941� 8965� 9038� 9660� 9864� 9739� 10323� 10537� 10129� 9167� 7440� 9082� 3317�10� 11045� 7895� 10589� 12300� 11696� 12230� 12236� 13014� 12722� 12219� 11153� 10176� 11454� 4183�11� 12376� 11512� 11666� 14087� 13771� 14019� 13722� 14752� 14380� 14251� 13179� 11957� 13305� 4860�12� 13967� 12475� 12153� 13954� 13771� 14022� 14003� 15080� 14617� 14273� 12452� 12585� 13611� 4971�13� 13759� 13399� 11778� 13255� 13285� 13971� 14146� 14078� 14536� 13957� 11550� 12221� 13318� 4865�14� 11846� 14074� 12078� 12493� 12480� 12484� 13011� 13445� 13041� 11993� 10205� 11000� 12326� 4502�15� 9596� 11366� 9907� 10255� 10129� 10464� 10527� 10479� 10328� 8660� 7472� 7423� 9698� 3542�16� 5505� 6880� 6614� 6637� 6319� 6800� 7173� 6983� 6359� 4994� 3316� 3482� 5911� 2159�17� 286� 2318� 2920� 3133� 3142� 3574� 3534� 3113� 2324� 622� Ͳ22� Ͳ22� 2072� 757�18� Ͳ22� Ͳ22� 4� 354� 705� 898� 799� 416� Ͳ3� Ͳ22� Ͳ22� Ͳ22� 257� 94�19� Ͳ22� Ͳ22� Ͳ22� Ͳ22� Ͳ22� Ͳ21� Ͳ21� Ͳ22� Ͳ22� Ͳ22� Ͳ22� Ͳ22� Ͳ22� Ͳ8�20� Ͳ22� Ͳ22� Ͳ22� Ͳ22� Ͳ22� Ͳ22� Ͳ22� Ͳ22� Ͳ22� Ͳ22� Ͳ22� Ͳ22� Ͳ22� Ͳ8�21� Ͳ22� Ͳ22� Ͳ22� Ͳ22� Ͳ22� Ͳ22� Ͳ22� Ͳ22� Ͳ22� Ͳ22� Ͳ22� Ͳ22� Ͳ22� Ͳ8�22� Ͳ22� Ͳ22� Ͳ22� Ͳ22� Ͳ22� Ͳ22� Ͳ22� Ͳ22� Ͳ22� Ͳ22� Ͳ22� Ͳ22� Ͳ22� Ͳ8�23� Ͳ22� Ͳ22� Ͳ22� Ͳ22� Ͳ22� Ͳ22� Ͳ22� Ͳ22� Ͳ22� Ͳ22� Ͳ22� Ͳ22� Ͳ22� Ͳ8�
Average�(kWh)� 3713� 3691� 3876� 4366� 4386� 4567� 4569� 4662� 4522� 4143� 3509� 3306� 4108�
Total�(MWh)� 2762� 2480� 2884� 3143� 3263� 3288� 3399� 3469� 3255� 3082� 2526� 2460� 36013�
�
�
�

Commercial Alternative Energy Analysis
PREPARED FOR THE
August 1, 2014
Iowa Tribe of Oklahoma

2
Prepared by
Jeff Pollard, PE, VP of EngineeringRay Chambers, CEM, CEP, CEA, Commercial Energy AdvisorRandy Jarvis, VP of Corporate Development

3
ALTERNATIVEENERGYANALYSIS
1.0 Executive Summary
2.0 Scope of Work
This report was compiled for the Iowa Tribe of Oklahoma by Smart Energy Source LLC (SES) certifi ed energy professionals, Stillwater, Oklaho-ma. Information was provided to SES by the Iowa Tribe of Oklahoma in regard to the Iowa Tribe Wind Project Report prepared by AWS Truepower for Johnson Controls dated March 27, 2013 and the Wind Study Report for the Iowa Tribe of Oklaho-ma Wind Project provided to the Bureau of Indian Affairs by Solas Energy Consulting U.S. Inc. dated June 26, 2013. This information was used to com-
pare the economic viability of stand-alone and utili-ty grade wind and solar power generation systems when compared to the Iowa Tribe of Oklahoma connected meter loads as documented by Central Rural Electric Cooperative.
This report discusses the alternative energy systems as outlined in the scope of work. The information enclosed is intended to help the Iowa Tribe of Oklahoma achieve its energy effi ciency objectives of reducing overall energy use and allow for a de-fi ned strategic energy plan going forward.
The objective of this report is to defi ne the viabil-ity of alternative energy systems in relationship to the Iowa Tribe of Oklahoma’s historical electrical usage of individual meters and the aggregated load of all meters on the Central Rural Electric Coopera-tive’s electrical distribution grid.
SES utilized the information in the referenced re-ports in addition to billing data provided by CREC and cost estimates associated with potential system impacts. These resources were used to develop assessments on wind and solar projects.
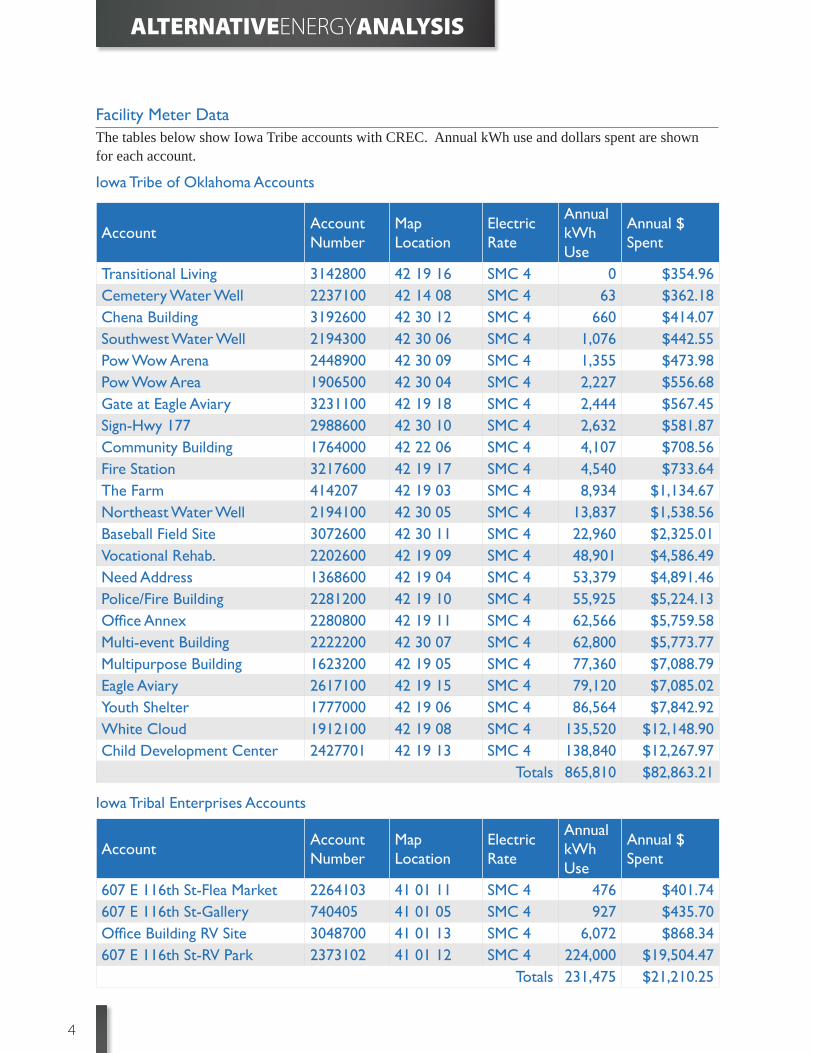
4
ALTERNATIVEENERGYANALYSIS
AccountAccount Number
Map Location
Electric Rate
Annual kWh Use
Annual $ Spent
Transitional Living 3142800 42 19 16 SMC 4 0 $354.96Cemetery Water Well 2237100 42 14 08 SMC 4 63 $362.18Chena Building 3192600 42 30 12 SMC 4 660 $414.07Southwest Water Well 2194300 42 30 06 SMC 4 1,076 $442.55Pow Wow Arena 2448900 42 30 09 SMC 4 1,355 $473.98Pow Wow Area 1906500 42 30 04 SMC 4 2,227 $556.68Gate at Eagle Aviary 3231100 42 19 18 SMC 4 2,444 $567.45Sign-Hwy 177 2988600 42 30 10 SMC 4 2,632 $581.87Community Building 1764000 42 22 06 SMC 4 4,107 $708.56Fire Station 3217600 42 19 17 SMC 4 4,540 $733.64The Farm 414207 42 19 03 SMC 4 8,934 $1,134.67Northeast Water Well 2194100 42 30 05 SMC 4 13,837 $1,538.56Baseball Field Site 3072600 42 30 11 SMC 4 22,960 $2,325.01Vocational Rehab. 2202600 42 19 09 SMC 4 48,901 $4,586.49Need Address 1368600 42 19 04 SMC 4 53,379 $4,891.46Police/Fire Building 2281200 42 19 10 SMC 4 55,925 $5,224.13Offi ce Annex 2280800 42 19 11 SMC 4 62,566 $5,759.58Multi-event Building 2222200 42 30 07 SMC 4 62,800 $5,773.77Multipurpose Building 1623200 42 19 05 SMC 4 77,360 $7,088.79Eagle Aviary 2617100 42 19 15 SMC 4 79,120 $7,085.02Youth Shelter 1777000 42 19 06 SMC 4 86,564 $7,842.92White Cloud 1912100 42 19 08 SMC 4 135,520 $12,148.90Child Development Center 2427701 42 19 13 SMC 4 138,840 $12,267.97
Totals 865,810 $82,863.21
AccountAccount Number
Map Location
Electric Rate
Annual kWh Use
Annual $ Spent
607 E 116th St-Flea Market 2264103 41 01 11 SMC 4 476 $401.74607 E 116th St-Gallery 740405 41 01 05 SMC 4 927 $435.70Offi ce Building RV Site 3048700 41 01 13 SMC 4 6,072 $868.34607 E 116th St-RV Park 2373102 41 01 12 SMC 4 224,000 $19,504.47
Totals 231,475 $21,210.25
Iowa Tribe of Oklahoma Accounts
Facility Meter Data
Iowa Tribal Enterprises Accounts
The tables below show Iowa Tribe accounts with CREC. Annual kWh use and dollars spent are shown for each account.

5
ALTERNATIVEENERGYANALYSIS
InterpretationIn Figure 1, research from the National Renewable Energy Laboratory for the Department of Energy maps the Oklahoma annual wind power at 50-m height, which conclusively shows the Iowa Tribal Complex has poor to marginal wind resource potential.
Figure 1 – Courtesy the National Renewable Energy Laboratory for the Department of Energy

6
ALTERNATIVEENERGYANALYSIS
Figure 2 – Courtesy the National Renewable Energy Laboratory for the Department of Energy
InterpretationIn Figure 2, research from the National Renewable Energy Laboratory for the Department of Energy shows the Iowa Tribal Complex is located in an area where there is approximately 5 kWh/m2/day.

7
ALTERNATIVEENERGYANALYSIS
Assessment Resources
Assessment Constants
Facility and electric meter data was used to identify actual aggregated load for contiguous and non-con-tiguous electrical meters located on Central Rural Electric Cooperative’s distribution grid to provide base load, peak and operational electrical use.
Wind and solar characteristics used in the report were supplied in the two alternative energy wind and solar data projects reports. The titles for each report only list wind; however, there is a section dedicated to solar (photovoltaic) projects in both. The reports are:
Iowa Tribe Wind Project report prepared by AWS Truepower for Johnson Controls dated March 27, 2013
Wind Study Report for the Iowa Tribe of Okla-homa Wind Project provided to the Bureau of Indian Affairs by Solas Energy Consulting US Inc. dated June 26, 2013
Green House Gas Emissions
The web link, http://www.epa.gov/cleanenergy/energy-resources/calculator.html#results pro-vides the path to the Environmental Protection Agency calculator used to calculate carbon di-oxide equivalent (CO2e) reductions in relation-ship to energy reduction projects.
Reference Reports
Project costs are estimates only using industrial averages and standards; however, SES always recommends bids from multiple contractors on any project to ensure a competitive and economical priced structure.
Current load profi les for the metered locations served by Central Rural Electric Cooperative’s distribution system, January 2013 through De-cember 2013.
Cost per watt for installed wind and solar sys-tems are $3 per watt. The prices of solar sys-tems are typically less expensive (per unit) for larger systems than smaller systems (economy of scale).
Typical residential cost for electrical generation by wind is $4 per watt produced/installed – this cost is typically in the $5 to $6 range, based on research analysis of average cost across the United States.
Typical, utility grade cost for electric generation by wind is $3 per watt. (large scale)
Typical residential cost for electrical generation by solar is $4 per watt produced/installed – this cost is typically in the $7 to $9 range based on research analysis of the average cost across the United States.
Typical utility grade cost for electrical genera-tion by solar is $3 per watt. (large scale)
Capacity factor for wind is 37.4 percent (capac-ity factor is the difference from time of actual use compared to full production) based on referenced report fi ndings.
Capacity factor for solar is 94 percent - First year (capacity factor is the difference from time of actual use compared to full production) based on referenced report fi ndings.
The estimated cost of interconnection engineer-ing study (KAMO Power), $50,000.
The estimated cost of interconnection substation (KAMO Power), $2,000,000.
The estimated cost of distribution line per mile (CREC), $120,000.
The estimated cost of transmission line per mile (KAMO Power), $350,000.
8
ALTERNATIVEENERGYANALYSIS
Potentially, more costs could be associated with infrastructure upgrades depending on the results of the Interconnection Engineering Study.
The estimated avoided cost of power is $0.02 per kWh.
Wind and Solar Assessments
The methodology of any assessment will provide a base line of information, or experimental control point, which can be used to gauge any study or assessment in the future to present conditions. The analytical process for current or future projects will be measured against this base line to validate project economics, processes and feasibilities that allow decision makers to realize estimated and or target savings potential.
SES has developed four alternative energy assess-ments from information included in the referenced reports. Additional historical energy use data and estimated distribution and transmission system im-pact costs were provided by Central Rural Electric Cooperative. This data was used in the wind and solar net metering assessments.
The assessments include:
A. Wind – Utility Revenue Grade System
B. Wind – Net Metering Contract
C. Solar – Utility Revenue Grade System
D. Solar – Net Metering Contract
Each assessment has an evaluation followed by a calculation worksheet. Each assessment includes an estimated cost for the generator plant, utility related system impact costs, the total project cost, revenue when applicable, payback in years and a return on investment.
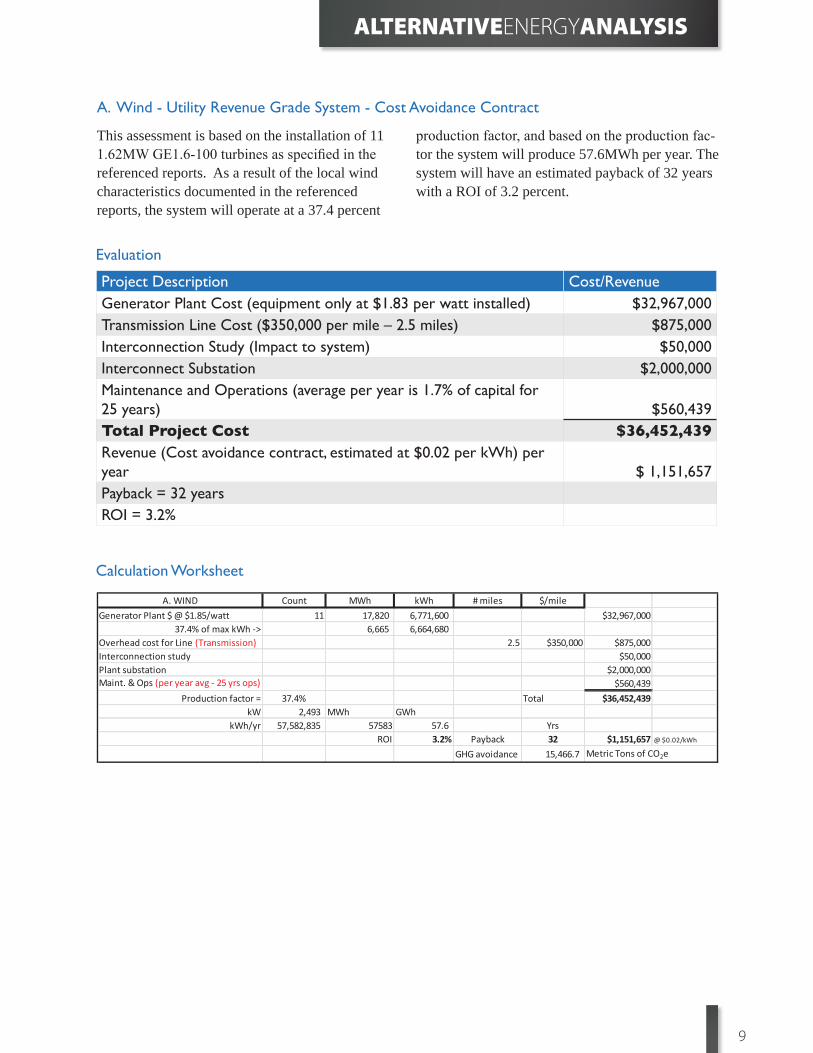
9
ALTERNATIVEENERGYANALYSIS
A. Wind - Utility Revenue Grade System - Cost Avoidance Contract
Evaluation
Calculation Worksheet
This assessment is based on the installation of 11 1.62MW GE1.6-100 turbines as specifi ed in the referenced reports. As a result of the local wind characteristics documented in the referenced reports, the system will operate at a 37.4 percent
production factor, and based on the production fac-tor the system will produce 57.6MWh per year. The system will have an estimated payback of 32 years with a ROI of 3.2 percent.
Project Description Cost/RevenueGenerator Plant Cost (equipment only at $1.83 per watt installed) $32,967,000Transmission Line Cost ($350,000 per mile – 2.5 miles) $875,000Interconnection Study (Impact to system) $50,000Interconnect Substation $2,000,000Maintenance and Operations (average per year is 1.7% of capital for 25 years) $560,439Total Project Cost $36,452,439Revenue (Cost avoidance contract, estimated at $0.02 per kWh) per year $ 1,151,657Payback = 32 yearsROI = 3.2%
A. WIND Count MWh kWh # miles $/mileGenerator Plant $ @ $1.85/watt 11 17,820 6,771,600 $32,967,000
37.4% of max kWh -> 6,665 6,664,680 Overhead cost for Line (Transmission) 2.5 $350,000 $875,000Interconnection study $50,000Plant substation $2,000,000Maint. & Ops (per year avg - 25 yrs ops) $560,439
Production factor = 37.4% Total $36,452,439kW 2,493 MWh GWh
kWh/yr 57,582,835 57583 57.6 Yrs ROI 3.2% Payback 32 $1,151,657 @ $0.02/kWh
GHG avoidance 15,466.7 Metric Tons of CO2e

10
ALTERNATIVEENERGYANALYSIS
B. Wind - Net Metering Contract
Evaluation
Calculation Worksheet
This analysis is based on the installation of one 1.62 MW GE1.6 turbine as specifi ed in the refer-enced reports. As a result of the local wind charac-teristics documented in the referenced reports, the system will operate at a 37.4 percent production
factor, and based on the production factor the sys-tem will produce 5.23 MWh per year. The system will have an estimated payback of 51.9 years with a ROI of 1.9 percent.
Project Description Cost/RevenueGenerator Plant cost (equipment only at $1.85 per watt installed) $ 2,997,000Distribution Line Cost ($120,000 per mile – 2.5 miles) $300,000Interconnection Study (impact to system) $50,000Interconnection Substation $2,000,000Maintenance and Operations (average per year is 4.7% of capital for 25 years) $50,949Total Project Cost $5,397,949Net Metering cost reduction contractPayback = 51.9 yearsROI = 1.9%
B. WIND Count kWh # miles $/mileGenerator Plant $ @ $1.85/watt 1 1,620 $2,997,000
37.4% of max kWh -> 606 Overhead cost for Line (Distribution) 2.5 $120,000 $300,000Interconnection study $50,000Plant substation $2,000,000Maint. & Ops (per year avg - 25 yrs ops) $50,949
Production factor = 37.4% MWh GWh Total $5,397,949kW 227 5,234.80 5.23
kWh/Mo 436,234 YrskWh/Yr 5,234,803 ROI 1.9% Payback 51.9
GHG avoidance 1,406.1 Metric Tons of CO2e

11
ALTERNATIVEENERGYANALYSIS
C. Solar - Utility Revenue Grade System - Cost Avoidance Contract
Evaluation
Calculation Worksheet
This assessment is based on the installation of 79,662 Yingli YL-280p solar modules. As a result of the local solar intensity characteristics docu-mented in the referenced reports, the system will operate at a 94 percent production factor the fi rst year, and based on the production factor the system will produce 20.9 MWh per year. The system
modules will degrade over time. After 10 years, the systems will operate at an estimated production factor of 91.2 percent. Support system cost (frame/rack system) for solar panels are not known at this time. The system will have an estimated payback of 77.3 years with a ROI of 1.3 percent.
Project Description Cost/RevenueGenerator Plant Cost (equipment only at $3 per watt installed) $66,916,080Transmission Line Cost ($350,000 per mile – 2.5miles) $875,000Interconnection Study (Impact to system) $50,000Interconnect Substation $2,000,000Maintenance and Operations (average per year is 1.7% of capital for 25 years) $1,137,573Total Project Cost $70,978,653Revenue (Cost Avoidance Contract, estimated at $0.02 per kWh) per year $918,356
Payback = 77.3 yearsROI = 1.3%
C. SOLAR Count MWh kWh # miles $/mile
Generator Plant $ @ $3.00/watt 79,662 22.3 22,305 $66,916,080 94% of max kWh -> (First Year) 21.0 20,967
Overhead cost for Line (Transmission) 2.5 $350,000 $875,000Interconnection study $50,000Plant substation $2,000,000Maint. & Ops (per year avg - 25 yrs ops) $1,137,573.36
Total $70,978,653kW 20,967
kWh/yr 45,917,814 Yrs ROI 1.3% Payback 77.3 $918,356 @ $0.02/kWh
GHG avoidance 32,977.3 Metric Tons of CO2e

12
ALTERNATIVEENERGYANALYSIS
D. Solar Net Metering Contract
Evaluation
Calculation Worksheet
This assessment is based on the installation of 980 Yingli YL-280p solar modules. As a result of the local solar intensity characteristics documented in the referenced reports, the system will operate at a 94 percent production factor the fi rst year, and based on the production factor the system will pro-duce 1.1MWh per year. The system modules will
degrade over time. After 10 years, the systems will operate at an estimated production factor of 91.2 percent. Support system cost (frame/rack system) for solar panels are not known at this time. The system will have an estimated payback of 31 years with a ROI of 3.2 percent.
Project Description Cost/RevenueGenerator Plant Cost (equipment only at $3 per watt installed) $823,200
Distribution Line Cost at $120,000 per mile – 2.5 miles) $300,000
Interconnection Study (impact to system) $50,000
Interconnection substation $2,000,000
Maintenance and Operations (average per year is 4.7% of capital for 25 years) $38,690
Total Project Cost $3,211,890Net Metering cost reduction contractPayback = 31 yearsROI = 3.2%
D. SOLAR Count kWh/day ft2 # miles $/mileGenerator Plant $ 980 3,293 7,840 $823,200 @ $3.00/Watt
94% of max kWh -> (First Year) 3,095 Overhead cost for Line (Distribution) 2.5 $120,000 $300,000Interconnection study $50,000Plant substation $2,000,000Maint. & Ops (per year avg - 25 yrs ops) $38,690
Total $3,211,890 kW 258
kWh/Mo 91,928 YrskWh/yr 1,103,141 ROI 3.2% Payback 31
GHG avoidance 792.3 Metric Tons of CO2e

13
ALTERNATIVEENERGYANALYSIS
Considerations
The following items should be considered in de-termining the feasibility of alternative sources of power generation for the Iowa Tribe of Oklahoma.
Availablility of sustained wind at height of installation – The observed mean wind speed provided by the AWS Truepower Report, Iowa Tribe of Oklahoma, Johnson Controls, March 27, 2013 at their measurement location (WGS84, Zone 14 – Easting 669343, Northing 3958302), page 1.
Cost of electric grid infrastructure upgrades – Information and cost estimates provided by Jeff Pollard PE, System Engineer - Central Rural Electric Cooperative.
Initial cost of alternative energy projects – The information provided for estimating the cost per watt for alternative energy is from
the U.S. Energy Information Administration, “Levelized Cost of New Generation Resources in the Annual Energy Outlook 2013” published January 2013. http://www.eia.gov/forecasts/aeo/data.cfm
A key question must be answered by the collec-tive body of the Iowa Tribe of Oklahoma before moving forward with any project. Does the devel-opment of a wind farm or solar park agree with the Iowa Tribe of Oklahoma’s commitment to the environment?
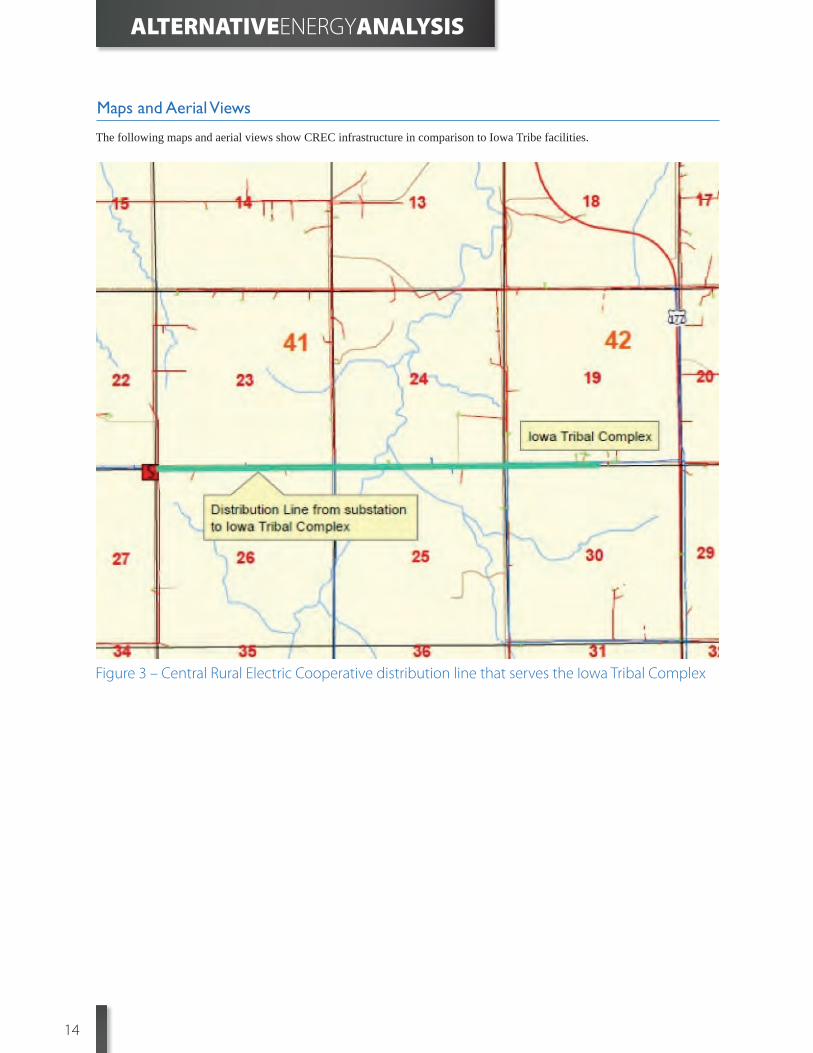
14
ALTERNATIVEENERGYANALYSIS
Figure 3 – Central Rural Electric Cooperative distribution line that serves the Iowa Tribal Complex
Maps and Aerial Views
The following maps and aerial views show CREC infrastructure in comparison to Iowa Tribe facilities.
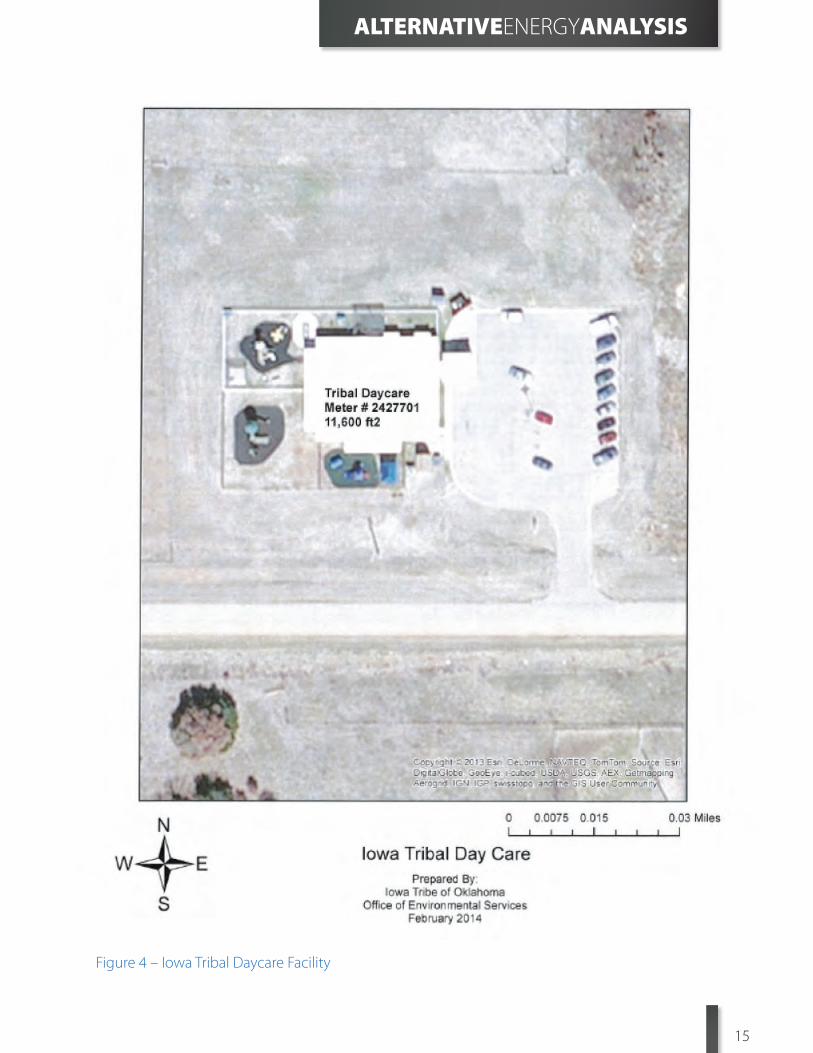
15
ALTERNATIVEENERGYANALYSIS
Figure 4 – Iowa Tribal Daycare Facility
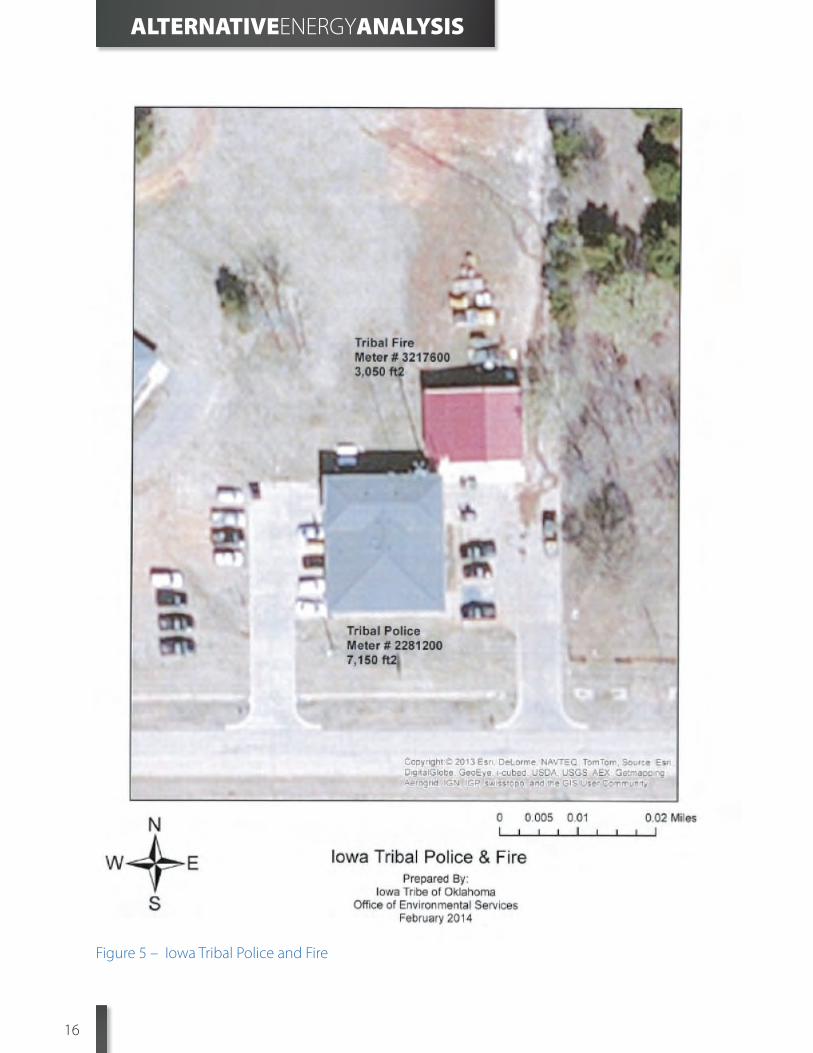
16
ALTERNATIVEENERGYANALYSIS
Figure 5 – Iowa Tribal Police and Fire

17
ALTERNATIVEENERGYANALYSIS
Figure 6 – Iowa Tribal Aviary
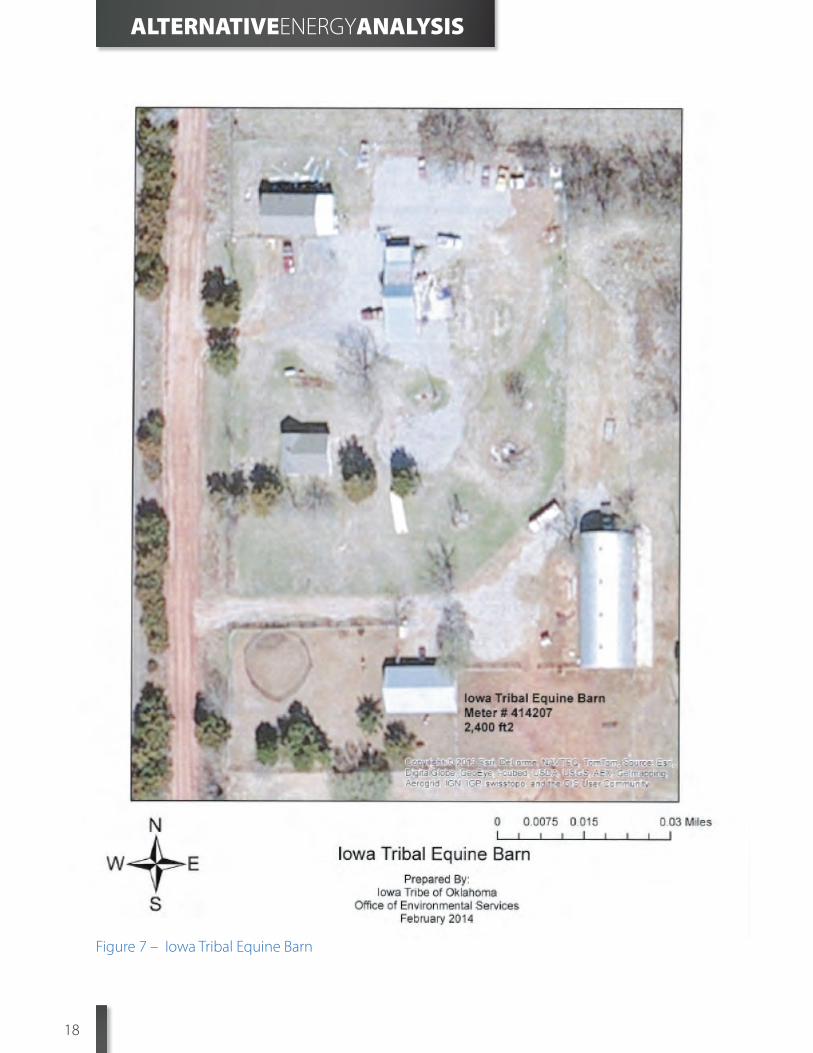
18
ALTERNATIVEENERGYANALYSIS
Figure 7 – Iowa Tribal Equine Barn
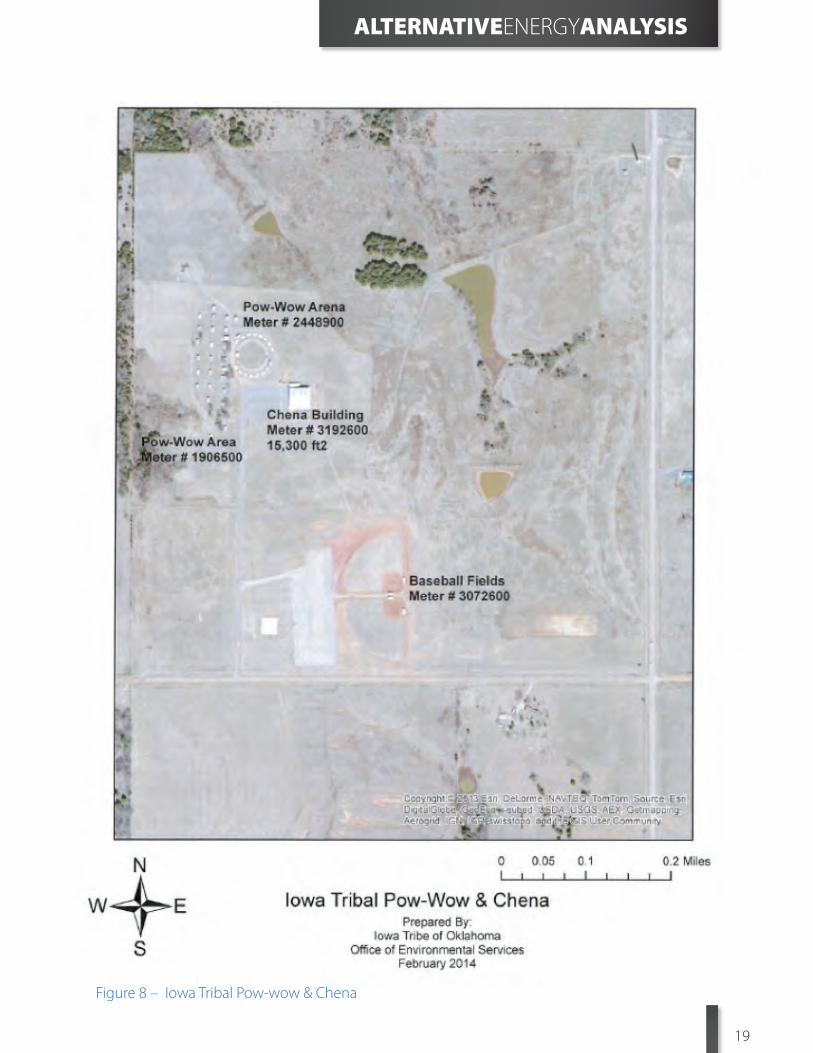
19
ALTERNATIVEENERGYANALYSIS
Figure 8 – Iowa Tribal Pow-wow & Chena
Iowa Tribe of Oklahoma 335588 E. 750 Road Perkins, OK 74059
Phone +1 405-547-2402 1-888-336-IOWA www.iowanation.org
Submitted to Bureau of Indian Affairs Prepared by Solas Energy Consulting US Inc. Issue date: June 26, 2013 Grant Number: GTB08T82218
FINAL NARRATIVE SF-425 WIND STUDY REPORT
Iowa Tribe of Oklahoma Wind Project
June 30, 2013
Iowa Tribe of Oklahoma Wind Study Report 1
CONTENTS
1. Executive Summary ............................................................................................................................... 7
1.1. Project Overview ........................................................................................................................... 7
1.1.1. Small Wind Overview ............................................................................................................ 7
1.2. Conclusions ................................................................................................................................... 8
1.2.1. Conclusions – Small Wind ..................................................................................................... 8
1.3. Next Steps ..................................................................................................................................... 9
1.3.1. Next Steps – Small Wind ....................................................................................................... 9
2. Transmission and Interconnect Study ................................................................................................. 10
2.1. Overview of Scope ...................................................................................................................... 10
2.2. Thermal Screening ...................................................................................................................... 10
2.2.1. Regional Generation and Transmission Queues ................................................................. 11
2.2.2. Regional Existing Generation .............................................................................................. 13
2.2.3. Thermal Screening Setup .................................................................................................... 14
2.2.4. Outline of Scenarios ............................................................................................................ 14
2.2.5. Results ................................................................................................................................. 15
2.2.6. Key Findings ........................................................................................................................ 16
2.3. Interconnection Feasibility Process ............................................................................................ 16
2.3.1. N-1 Single Contingency Analysis ......................................................................................... 17
2.3.2. Key Findings ........................................................................................................................ 18
2.3.3. Methodology ....................................................................................................................... 19
2.4. Financial Model Inputs ................................................................................................................ 20
2.4.1. Summary of Interconnection Model Inputs ........................................................................ 20
3. Market Research for Unbundling Green Tags ..................................................................................... 22
3.1. Summary of Scope ...................................................................................................................... 22
3.2. Overview of the Renewable Energy Credit (REC) Market ........................................................... 23
3.3. Purchasers of RECs ...................................................................................................................... 24
3.3.1. Project Developer Value ..................................................................................................... 24
3.3.2. REC Certification ................................................................................................................. 24
3.4. Oklahoma REC Market ................................................................................................................ 26
3.5. Compliance Markets in Surrounding States................................................................................ 27

Iowa Tribe of Oklahoma Wind Study Report 2
3.6. REC Voluntary Market ................................................................................................................. 28
3.7. Green Power on Federal Lands ................................................................................................... 30
3.8. Adding Value to RECs .................................................................................................................. 31
3.8.1. Long term REC contracts ..................................................................................................... 31
3.8.2. Naming Rights/Value Add ................................................................................................... 31
3.9. Compliance Obligations and Reporting ...................................................................................... 32
3.9.1. Key Findings ........................................................................................................................ 32
3.10. Financial Model Inputs ............................................................................................................ 33
4. NEPA, FAA, Biological and Environmental Studies .............................................................................. 34
4.1. Overview of Scope ...................................................................................................................... 34
4.1.1. CIA Early Stage Environmental Studies ............................................................................... 34
4.1.2. Aviation Constraints ............................................................................................................ 35
4.1.3. Microwave Beam Path Constraints ..................................................................................... 35
4.2. Detailed Study Results ................................................................................................................ 35
4.2.1. Summary of CIA Results ...................................................................................................... 35
4.2.2. Threatened and Endangered Species ................................................................................. 36
4.2.3. Bird and Bat Species ............................................................................................................ 37
4.2.4. Wetlands/Water Resources ................................................................................................ 38
4.2.5. Geology/Soils ...................................................................................................................... 38
4.2.6. Historic Sites/Cultural Resources ........................................................................................ 39
4.2.7. Public Lands......................................................................................................................... 39
4.2.8. Aviation ............................................................................................................................... 39
4.2.9. Microwave Beam Path Constraints ..................................................................................... 40
4.2.10. Agency Meetings and Consultation .................................................................................... 41
4.2.11. Habitat Assessment............................................................................................................. 42
4.2.12. Sound Receptor Analysis ..................................................................................................... 43
4.3. Constraints Map .......................................................................................................................... 44
4.4. Permitting Matrix ........................................................................................................................ 44
4.4.1. Key Findings ........................................................................................................................ 46
4.4.2. Oklahoma Wind Energy and Mineral Rights ....................................................................... 46
4.4.3. Construction Permitting ...................................................................................................... 48
4.4.4. Logan and Lincoln Counties – Construction Permitting ...................................................... 48

Iowa Tribe of Oklahoma Wind Study Report 3
4.5. Permitting Financial Model Inputs .............................................................................................. 49
4.5.1. Environmental and Permitting Model Inputs ..................................................................... 49
4.5.2. Summary of Environmental and Permitting Model Inputs ................................................. 49
5. Power Purchase Research and Negotiations ...................................................................................... 51
5.1. Overview of Scope ...................................................................................................................... 51
5.2. Brown Market Price Fundamentals ............................................................................................ 52
5.2.1. Upside Price Risks ............................................................................................................... 54
5.2.2. Downside Price Risks ........................................................................................................... 54
5.3. Types of Models for Power Sales ................................................................................................ 55
5.3.1. Power Purchase Agreements .............................................................................................. 55
5.3.2. Power Sales – Merchant Market ......................................................................................... 57
5.4. Existing Projects in SPP and their Structures .............................................................................. 57
5.4.1. Key Findings ........................................................................................................................ 59
5.5. Bundled vs. Unbundled Power .................................................................................................... 59
5.5.1. Results ................................................................................................................................. 59
5.5.2. Key Findings ........................................................................................................................ 60
5.6. Potential Off-Takers .................................................................................................................... 60
5.6.1. Results ................................................................................................................................. 60
5.7. Power Purchase Financial Model Inputs ..................................................................................... 60
5.7.1. Power Purchase Inputs ....................................................................................................... 60
5.7.2. Summary of Power Purchase Model Inputs ....................................................................... 61
6. Wind Farm Design & Preliminary Turbine Selection ........................................................................... 62
6.1. Wind Farm Design ....................................................................................................................... 62
6.1.1. Overview of Scope .............................................................................................................. 62
6.1.2. Wind Resource Mapping ..................................................................................................... 63
6.1.3. Project Site Layout Design .................................................................................................. 63
6.1.4. Energy Estimates ................................................................................................................. 64
6.1.5. Results ................................................................................................................................. 68
6.2. Wind Turbine Selection ............................................................................................................... 69
6.2.1. Purpose ............................................................................................................................... 70
6.2.2. Request for Quotation and Selection of Vendors ............................................................... 71
6.2.3. Summary of Results ............................................................................................................ 72

Iowa Tribe of Oklahoma Wind Study Report 4
6.2.4. Detailed Analysis ................................................................................................................. 73
6.3. Land Strategy and Development Work ....................................................................................... 80
6.3.1. Description of Project Area ................................................................................................. 80
6.3.2. Leasing Processes for Various Land Types (Tribal, Private and State) ................................ 81
6.3.3. Acquisition Strategy ............................................................................................................ 86
6.3.4. Lease Forms ........................................................................................................................ 87
6.3.5. Title Curative ....................................................................................................................... 90
6.3.6. Financial Model Inputs for Land Acquisition ....................................................................... 90
6.3.7. Financial Model Input Assumptions .................................................................................... 91
6.4. Geotechnical Investigation ......................................................................................................... 91
6.4.1. Geology ............................................................................................................................... 91
6.4.2. Subsurface Stratigraphy ...................................................................................................... 92
6.4.3. Groundwater Conditions..................................................................................................... 93
6.4.4. Geophysical Surveys ............................................................................................................ 93
6.4.5. Geotechnical Recommendations ........................................................................................ 93
6.4.6. FOUNDATION CONSTRUCTION CRITERIA ........................................................................... 94
6.4.7. Limitations ........................................................................................................................... 97
6.5. Layout and Turbine Selection Financial Model Inputs ................................................................ 97
7. Economic Feasibility Analysis .............................................................................................................. 98
7.1. Overview of Scope ...................................................................................................................... 98
7.2. Wind Project Ownership Structure ............................................................................................. 98
7.2.1. Project Development .......................................................................................................... 99
7.2.2. Co-Developer/Partner ....................................................................................................... 100
7.2.3. Full Project Sale plus Project Landowner .......................................................................... 100
7.3. Financing Vehicles ..................................................................................................................... 101
7.3.1. Debt Financing .................................................................................................................. 101
7.3.2. Equity Financing ................................................................................................................ 101
7.3.3. Tax Equity Financing / Investment-Grade Sourcing .......................................................... 101
7.3.4. Benefits ............................................................................................................................. 102
7.3.5. Considerations .................................................................................................................. 102
7.4. Incentive Analysis ...................................................................................................................... 102
7.5. Native American Incentives ...................................................................................................... 105
Iowa Tribe of Oklahoma Wind Study Report 5
7.6. Economic Modeling Results ...................................................................................................... 105
7.6.1. Project Conclusions ........................................................................................................... 106
7.6.2. Key Findings ...................................................................................................................... 106
7.7. Analysis ..................................................................................................................................... 106
7.7.1. Summary ........................................................................................................................... 106
7.7.2. Key Findings ...................................................................................................................... 106
7.7.3. Detailed Analysis ............................................................................................................... 107
7.7.4. Assumptions ...................................................................................................................... 107
7.7.5. Notes and Details .............................................................................................................. 108
7.8. Modeling ................................................................................................................................... 108
7.8.1. Summary ........................................................................................................................... 108
7.8.2. Results: 50 MW Scenario .................................................................................................. 108
7.8.3. Results: 20 MW Scenario .................................................................................................. 109
8. Supplemental Analysis – Small WInd ................................................................................................ 110
8.1. Energy Sustainability ................................................................................................................. 110
8.2. Electricity Consumption and Load ............................................................................................ 110
8.2.1. Oklahoma Gas and Electric ............................................................................................... 111
8.2.2. Central Rural Electric Cooperative .................................................................................... 113
8.2.3. Additional Observations and Recommendations ............................................................. 117
8.3. Turbine Site Selection ............................................................................................................... 118
8.4. Turbine Selection ...................................................................................................................... 121
8.5. Energy Estimates ....................................................................................................................... 124
8.5.1. Key Findings – Energy Production ..................................................................................... 125
8.6. Small Wind Straight-line Payback ............................................................................................. 126
8.7. Final Conclusions on Small Wind .............................................................................................. 126

Iowa Tribe of Oklahoma Wind Study Report 6
Special thanks to the following consultants who provided information and analysis utilized in the
preparation of this report:
Altis Energy Services LLC 3525 Osage Street, Denver, CO 80211
Atwell, 3033 East 1st Avenue, Ste 415, Denver, CO 80206
Aviation Systems, 2510 West 237th St., Suite 210, Torrance, CA 90505
AWS Truepower, LLC, 463 New Karner Road, Albany, NY 12205
Comsearch, 19700 Janelia Farm Blvd., Ashburn, VA 20147
Doerner, Saunders, Daniel & Anderson, LLP, Two West 2nd Street, Suite 700, Tulsa, OK 74103
Ecology and Environment, 9300 West 110th Street, Suite 645, Overland Park, KS 66210 Renewable Choice Energy, 4775 Walnut Street, Suite 230, Boulder CO 80301
Renewable Resource Consultants, 3801 Doris Lane, Round Rock, TX 78664
Solas Energy Consulting US Inc., 1136 E. Stuart Rd., Suite 4206, Fort Collins, CO 80525
Summit Energy (a division of Schneider Electric), 20830 N. Tatum Blvd., Suite 330, Phoenix, AZ 85050
Iowa Tribe of Oklahoma Wind Study Report 7
1. EXECUTIVE SUMMARY
1.1. Project Overview
The Iowa Tribe of Oklahoma was awarded Grant GTB08T82218 from the Department of the Interior in
December 2010. The original grant period was specified as December 7, 2010 to through December 31,
2012. The Iowa Tribe requested a 3-month extension in Fall of 2012 to complete a few additional
studies to support the grant findings.
The scope of the grant was to determine the feasibility of a utility scale wind energy project on Tribal
Lands. Pursuant to a separate DOE grant, wind resource data collection began in November 2011 at a
single 60-meter measurement mast (designated Mast 0149) located near Fallis, Oklahoma. A sodar unit
was also installed at the site which was being used to extrapolate the data collected from the met
tower. After monitoring the wind at the met site for approximately 9 months and conducting
correlations with long-term data, it was determined that the wind resource in the area near Fallis was
not likely to be sufficient for a utility-scale wind project.
This early conclusion led to a re-evaluation of the proposed location for the project. A wind resource
map was created to identify areas in the vicinity with higher wind speeds. This map was then graphically
overlayed on land parcel information obtained from the respective counties so that land ownership in
conjunction with wind resource could be analyzed. The areas of land that were associated with the Iowa
Tribe were then identified to determine if the projected wind speeds at parcels associated with the
tribal parcels could potentially support a utility scale wind project.
The area with the highest wind resource identified in the wind map corresponded well to the location of
the tribal parcels. A new area for a proposed project site was identified using the parcel map which
would maximize the use of tribal parcels while targeting areas with the highest wind speeds. The new
area is located approximately 20 miles north-northeast of the met mast in Fallis.
After locating what was determined to be the best site from a wind resource and land ownership
perspective, boundaries were drawn for both a 20 MW and a 50 MW project size. This project site area
was then used as the boundary for additional studies and project feasibility, including environmental,
land, wind setbacks, permitting, species, and other areas of concern. A site plan was then developed for
proposed wind turbine locations taking into account these constraints.
The site plan was developed for each project size, and a Turbine Request for Proposal was conducted to
determine pricing. Construction estimates were developed for both project sizes, and research was
conducted on the potential project revenues. Finally, financial models were run for both project sizes.
1.1.1. Small Wind Overview During the course of the feasibility study, the Tribe became increasingly interested in looking at their
own electricity consumption patterns and determining if a small wind turbine for their own load would
be feasible. As information was being collected and analyzed for the utility feasibility project, additional
information was collected and analysis was performed to determine the feasibility of self-generation.
This research included a detailed analysis of the Tribe’s electricity usage, the potential sizes for a wind

Iowa Tribe of Oklahoma Wind Study Report 8
turbine installation, the regulations and requirements through the utility, as well as siting information
for a turbine. A supplemental analysis on small wind has been added in Section 8 of this report.
1.2. Conclusions
Several conclusions were drawn as a result of the study. They are as follows:
A 50MW project had better economics than a 20 MW project.
The power purchase price in the region is low in comparison to the rest of the country. The
project economics are marginal at current rates. Either a 15% increase in power prices or a 15%
decrease in project capital costs could provide the project with competitive returns.
The REC market is not currently robust, and the cost associated with certifying the project for
REC sales unbundled from the brown power is probably not justified at this time.
Many of the financial incentives for utility scale wind energy projects are related to federal tax
benefits, and since the tribe does not have taxable income, those benefits were not realized in
the economics, which also hurt the economics. These benefits, however, could be realized by a
private developer entity.
The estimated initial development budget needed to bring the project to a stage where it could
be financed is approximately $2 million for the 20 MW project and $3 million for the 50 MW
project. The capital costs to procure the turbines and install the project were approximately $43
million for the 20 MW project and $93 million for the 50 MW project.
The Tribe does not have the resources to proceed as the lead developer with the project,
however Several avenues are available that the Tribe could take to participate in the project
including the following:
o The Tribe could look for a development partner to co-develop the project, and retain an
ownership interest.
o The Tribe could sell its existing interest in the project and become a landowner for the
project.
1.2.1. Conclusions – Small Wind
The small wind analysis concluded the following:
An opportunity exists for the Tribe to reduce its energy costs through energy efficiency, energy
management and renewable energy.
Small wind is not necessarily the ideal technology for the Tribe for self-generation due to the
lack of suitable small wind technologies for the Tribe’s low wind resource. Solar photovoltaics
(PV) may be a better choice for self-generation and should be considered further.
The current local net metering provisions with the electricity providers dis-advantage wind
generation with their policies for monthly energy generation true-ups, as well as limitations on
size of small wind turbines allowed.

Iowa Tribe of Oklahoma Wind Study Report 9
1.3. Next Steps
If the Tribe determines that it would like to proceed with the utility scale wind project, then the next
steps should be taken:
Establish a special purpose company (SPC) for the project development assets, and transfer this
feasibility study and all existing work products into that company.
Execute land lease agreements between the Tribe and the SPC which allow for the development
and construction of a utility-scale wind generation project on Tribal Lands. During the course of
this feasibility study, a land-lease agreement was developed in conjunction with the Tribal
attorneys, which could be utilized for this purpose.
Solicit interest from all Tribal members who hold land in fee simple in the area to execute leases
with those members, and work with the BIA to secure parcels which are held either in Tribal
Trust or are Federal parcels allocated to the Trust.
Solicit interest from private developers, once the land is secure, and find a partner or purchaser
for the project assets. From that point, a private developer would fund the development capital
required to move the project forward.
1.3.1. Next Steps – Small Wind Although the supplemental analysis for small wind did not provide out economically, the analysis
strongly made a case that the Tribe can improve its energy usage, reduce costs and incorporate other
renewable energy technologies into its operations. The following are the next steps for the Tribe:
Within the supplemental analysis, several ideas were brought forward, such as appointing an
energy manager, researching utility accounts which have no utilization, but are costing money
every month, and focusing on energy efficiency measures.
The analysis showed that solar PV would be economic if the tribe were to secure funding under
a grant program such as DE-FOA-0000852: Community Scale Clean Energy Projects. This grant
application is due at the end of June and it is strongly recommended that the Tribe pursue this
grant application for its larger facilities.
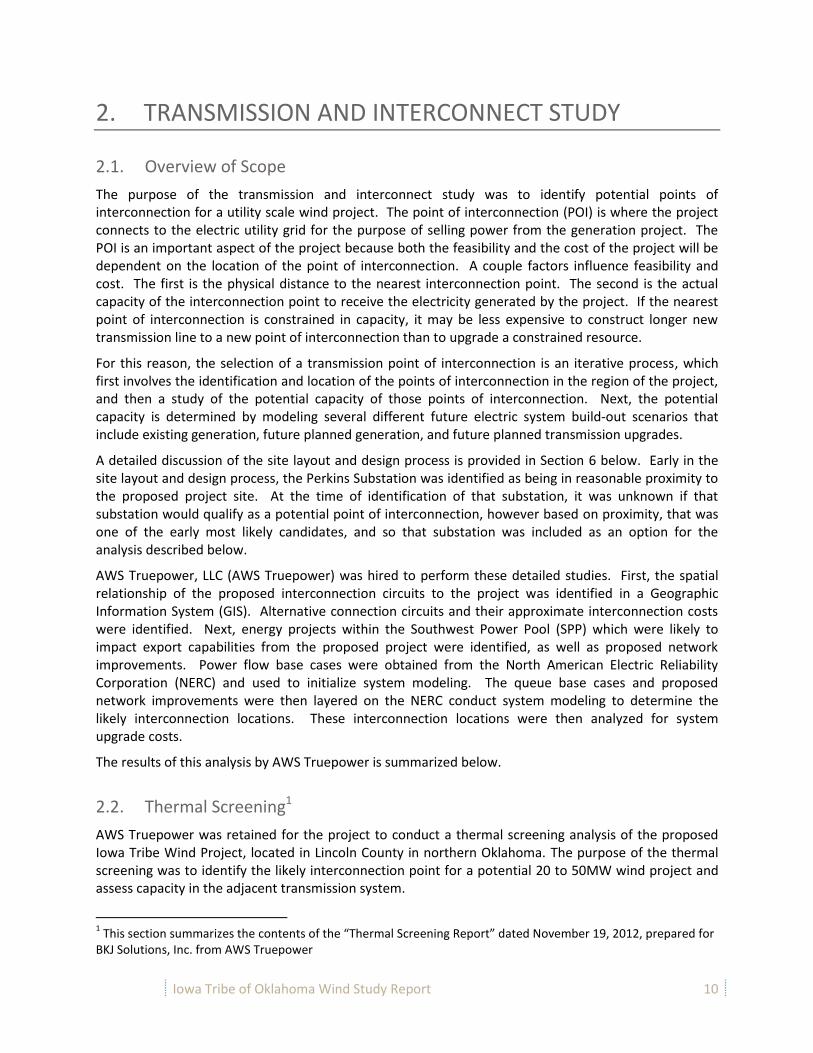
Iowa Tribe of Oklahoma Wind Study Report 10
2. TRANSMISSION AND INTERCONNECT STUDY
2.1. Overview of Scope
The purpose of the transmission and interconnect study was to identify potential points of interconnection for a utility scale wind project. The point of interconnection (POI) is where the project connects to the electric utility grid for the purpose of selling power from the generation project. The POI is an important aspect of the project because both the feasibility and the cost of the project will be dependent on the location of the point of interconnection. A couple factors influence feasibility and cost. The first is the physical distance to the nearest interconnection point. The second is the actual capacity of the interconnection point to receive the electricity generated by the project. If the nearest point of interconnection is constrained in capacity, it may be less expensive to construct longer new transmission line to a new point of interconnection than to upgrade a constrained resource.
For this reason, the selection of a transmission point of interconnection is an iterative process, which first involves the identification and location of the points of interconnection in the region of the project, and then a study of the potential capacity of those points of interconnection. Next, the potential capacity is determined by modeling several different future electric system build-out scenarios that include existing generation, future planned generation, and future planned transmission upgrades.
A detailed discussion of the site layout and design process is provided in Section 6 below. Early in the site layout and design process, the Perkins Substation was identified as being in reasonable proximity to the proposed project site. At the time of identification of that substation, it was unknown if that substation would qualify as a potential point of interconnection, however based on proximity, that was one of the early most likely candidates, and so that substation was included as an option for the analysis described below.
AWS Truepower, LLC (AWS Truepower) was hired to perform these detailed studies. First, the spatial relationship of the proposed interconnection circuits to the project was identified in a Geographic Information System (GIS). Alternative connection circuits and their approximate interconnection costs were identified. Next, energy projects within the Southwest Power Pool (SPP) which were likely to impact export capabilities from the proposed project were identified, as well as proposed network improvements. Power flow base cases were obtained from the North American Electric Reliability Corporation (NERC) and used to initialize system modeling. The queue base cases and proposed network improvements were then layered on the NERC conduct system modeling to determine the likely interconnection locations. These interconnection locations were then analyzed for system upgrade costs.
The results of this analysis by AWS Truepower is summarized below.
2.2. Thermal Screening1
AWS Truepower was retained for the project to conduct a thermal screening analysis of the proposed Iowa Tribe Wind Project, located in Lincoln County in northern Oklahoma. The purpose of the thermal screening was to identify the likely interconnection point for a potential 20 to 50MW wind project and assess capacity in the adjacent transmission system.
1 This section summarizes the contents of the “Thermal Screening Report” dated November 19, 2012, prepared for
BKJ Solutions, Inc. from AWS Truepower
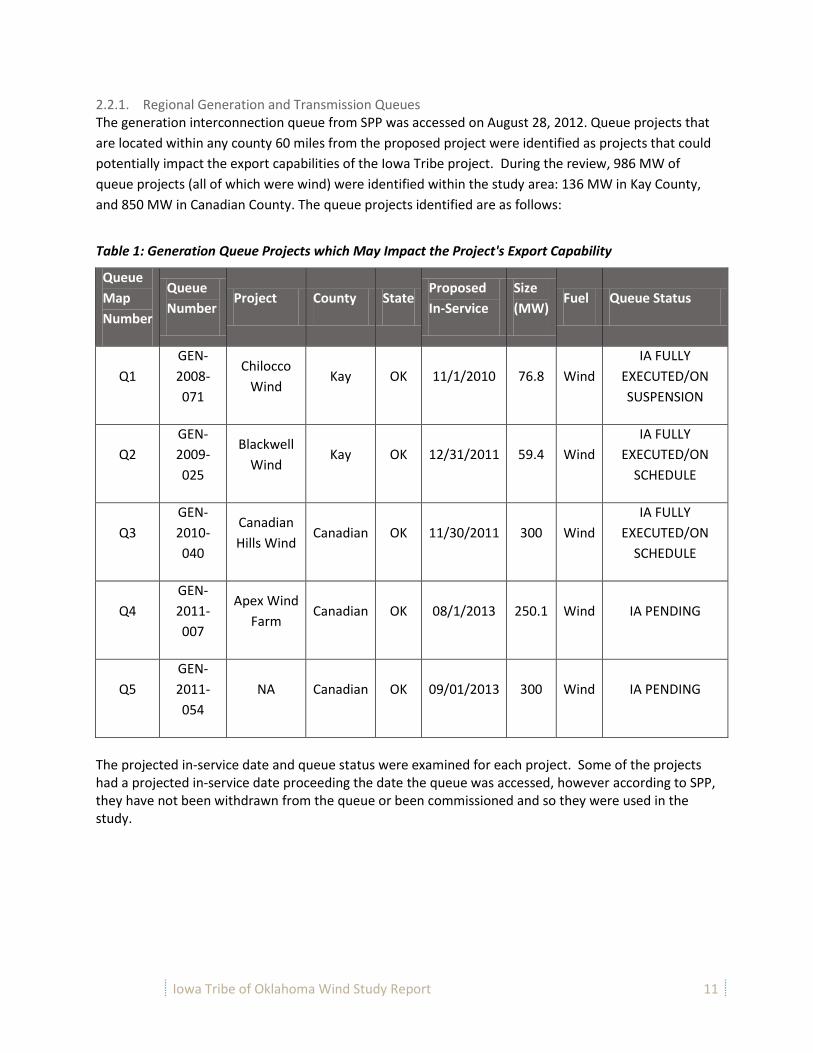
Iowa Tribe of Oklahoma Wind Study Report 11
2.2.1. Regional Generation and Transmission Queues The generation interconnection queue from SPP was accessed on August 28, 2012. Queue projects that
are located within any county 60 miles from the proposed project were identified as projects that could
potentially impact the export capabilities of the Iowa Tribe project. During the review, 986 MW of
queue projects (all of which were wind) were identified within the study area: 136 MW in Kay County,
and 850 MW in Canadian County. The queue projects identified are as follows:
Table 1: Generation Queue Projects which May Impact the Project's Export Capability
Queue
Map
Number
Queue
Number Project County State
Proposed
In-Service
Size
(MW) Fuel Queue Status
Q1
GEN-
2008-
071
Chilocco
Wind Kay OK 11/1/2010 76.8 Wind
IA FULLY
EXECUTED/ON
SUSPENSION
Q2
GEN-
2009-
025
Blackwell
Wind Kay OK 12/31/2011 59.4 Wind
IA FULLY
EXECUTED/ON
SCHEDULE
Q3
GEN-
2010-
040
Canadian
Hills Wind Canadian OK 11/30/2011 300 Wind
IA FULLY
EXECUTED/ON
SCHEDULE
Q4
GEN-
2011-
007
Apex Wind
Farm Canadian OK 08/1/2013 250.1 Wind IA PENDING
Q5
GEN-
2011-
054
NA Canadian OK 09/01/2013 300 Wind IA PENDING
The projected in-service date and queue status were examined for each project. Some of the projects had a projected in-service date proceeding the date the queue was accessed, however according to SPP, they have not been withdrawn from the queue or been commissioned and so they were used in the study.
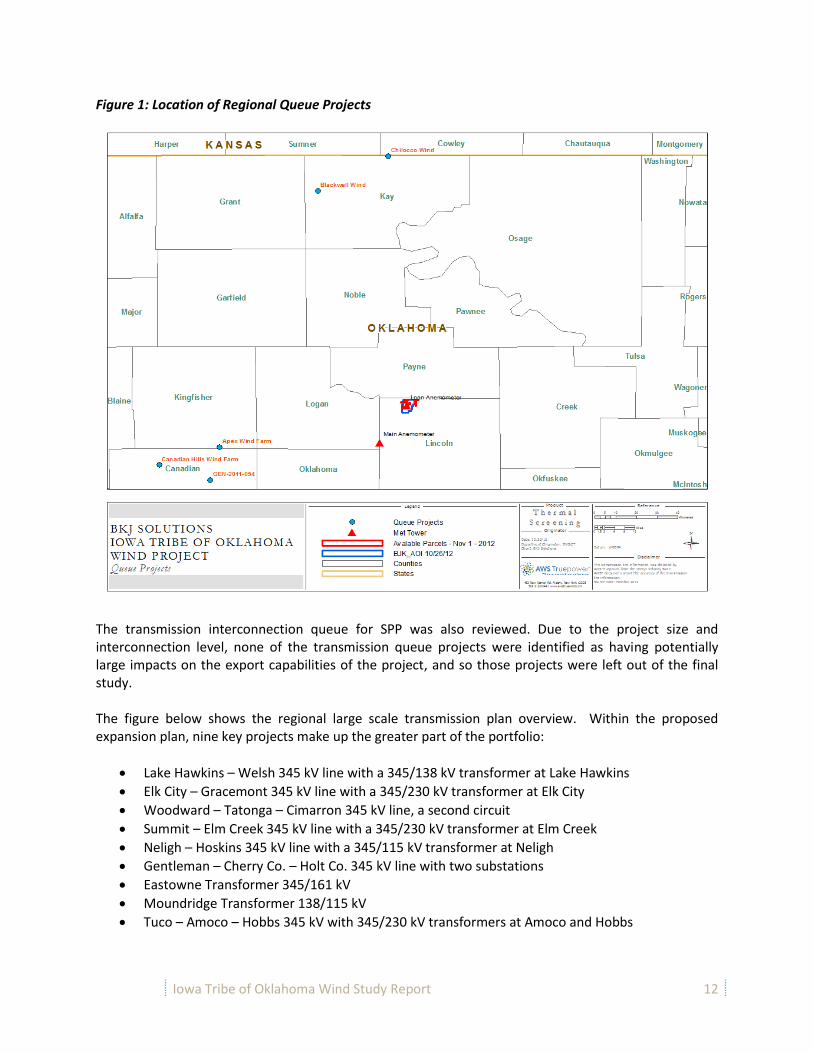
Iowa Tribe of Oklahoma Wind Study Report 12
Figure 1: Location of Regional Queue Projects
The transmission interconnection queue for SPP was also reviewed. Due to the project size and interconnection level, none of the transmission queue projects were identified as having potentially large impacts on the export capabilities of the project, and so those projects were left out of the final study. The figure below shows the regional large scale transmission plan overview. Within the proposed expansion plan, nine key projects make up the greater part of the portfolio:
Lake Hawkins – Welsh 345 kV line with a 345/138 kV transformer at Lake Hawkins
Elk City – Gracemont 345 kV line with a 345/230 kV transformer at Elk City
Woodward – Tatonga – Cimarron 345 kV line, a second circuit
Summit – Elm Creek 345 kV line with a 345/230 kV transformer at Elm Creek
Neligh – Hoskins 345 kV line with a 345/115 kV transformer at Neligh
Gentleman – Cherry Co. – Holt Co. 345 kV line with two substations
Eastowne Transformer 345/161 kV
Moundridge Transformer 138/115 kV
Tuco – Amoco – Hobbs 345 kV with 345/230 kV transformers at Amoco and Hobbs
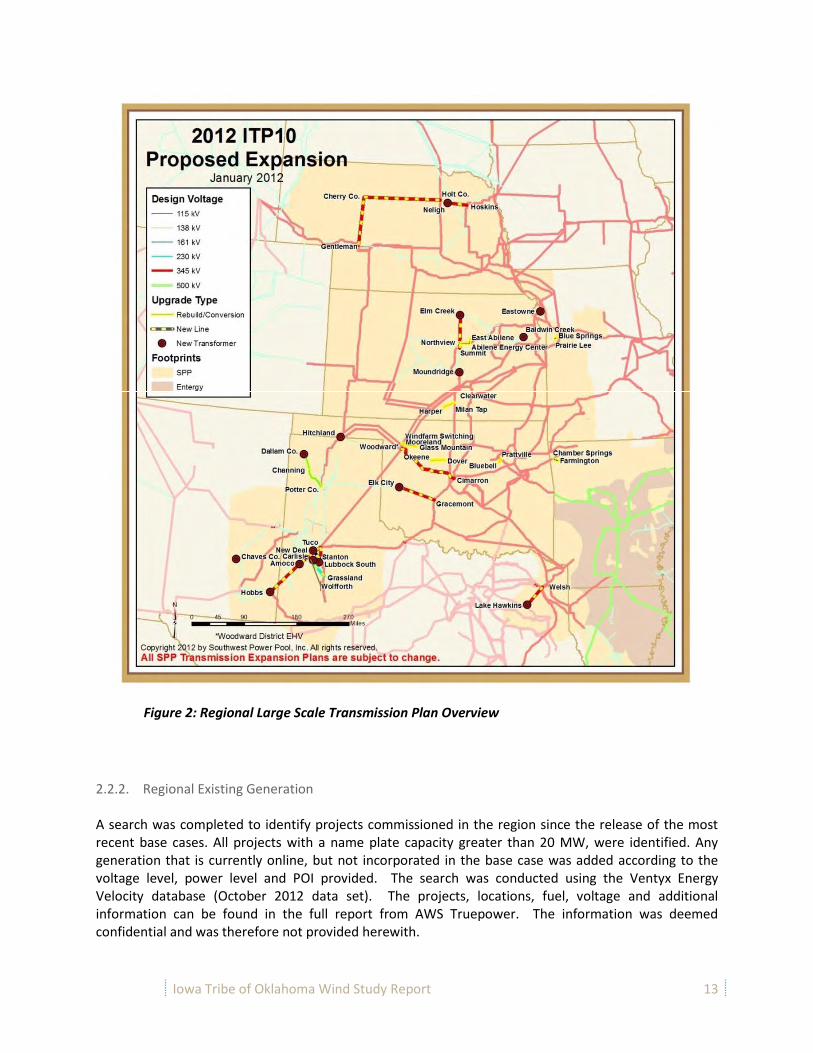
Iowa Tribe of Oklahoma Wind Study Report 13
2.2.2. Regional Existing Generation A search was completed to identify projects commissioned in the region since the release of the most recent base cases. All projects with a name plate capacity greater than 20 MW, were identified. Any generation that is currently online, but not incorporated in the base case was added according to the voltage level, power level and POI provided. The search was conducted using the Ventyx Energy Velocity database (October 2012 data set). The projects, locations, fuel, voltage and additional information can be found in the full report from AWS Truepower. The information was deemed confidential and was therefore not provided herewith.
Figure 2: Regional Large Scale Transmission Plan Overview
Iowa Tribe of Oklahoma Wind Study Report 14
2.2.3. Thermal Screening Setup The thermal screening was conducted using base cases compiled by the NERC for 2011. The power flows were solved using Commonwealth Associate’s Transmission 2000® software. Cases used for the base case analysis were Summer 2011, Winter 2011, Summer 2016, Winter 2016, and Summer 2021. To provide conservative results, all generation projects were added to the queue at listed capacity. During the base case analysis, generation from the Iowa Tribe project was ramped up until a system violation (voltage or thermal violation) occurred, which determined the amount of new generation the local system could accommodate. The most constrained base case was then selected for further study, in which the queue projects were added, as well as the existing regional wind projects at full capacity, to represent regional high wind events. For the analysis, generation in the Oklahoma Gas & Electric (OGE) and American Electric Power West (AEPW) control areas was re-dispatched to accommodate the identified existing generation added to the control area. When adding a small amount of generation, this redispatch method is generally representative of the economic dispatch methods used by system operators, in which output from typically more costly fossil plants is minimized to accommodate typically cheaper wind generation. Nuclear and coal generators, often with a cost of energy similar or less than wind, were slightly underutilized due to the de-ratings but this should not significantly impact system results. To evaluate the impact of queue projects on the Iowa Tribe project’s export capability at the Perkins Substation, the project was added to the Perkins Substation along with the queue and existing projects. The project’s output level was then ramped up until a system violation occurred, thus determining the thermal capacity of the POI substation. All modifications to the base case were done within the OGE, AEPW, and Associated Electric Cooperative, Inc. (AECI) control areas, and all queue projects and wind plants were modeled with a +/- 0.95 power factor.
2.2.4. Outline of Scenarios The Iowa Tribe project was modeled using three scenarios, which are outlined in Table 2: Scenario Overview and Descriptions. The scenarios encompass the modeling of 0%, 50%, and 100% of the queue projects2. For the 50% scenario, both Blackwell Wind (Q2) and Canadian Hills Wind (Q3) were included, as both projects were under construction at the time of the modeling. The Blackwell Wind project was developed by Own Energy and Sold to NextEra. Both Blackwell Wind and Canadian Hills Wind projects reached commercial operation prior to the end of 2012. The remaining three projects have more uncertainty surrounding their development; thus, they were not selected for inclusion in the 50% scenario. The initial development of Chilocco Wind (Q1) was funded under the US Department of Energy (DOE) Tribal Energy Program. Movement in the development of this project over the last year appears to have halted and the future of the project looks doubtful. Therefore, the project was not considered for the 50% scenario. Both the Apex Wind Farm (Q4), and GEN-2011-054 (Q5) appear to be either alternative project locations for the Canadian Hills Wind (Apex Wind Farm) project or potential
2 The queue projects as listed in Table 1: Generation Queue Projects which May Impact the Project's Export
Capability
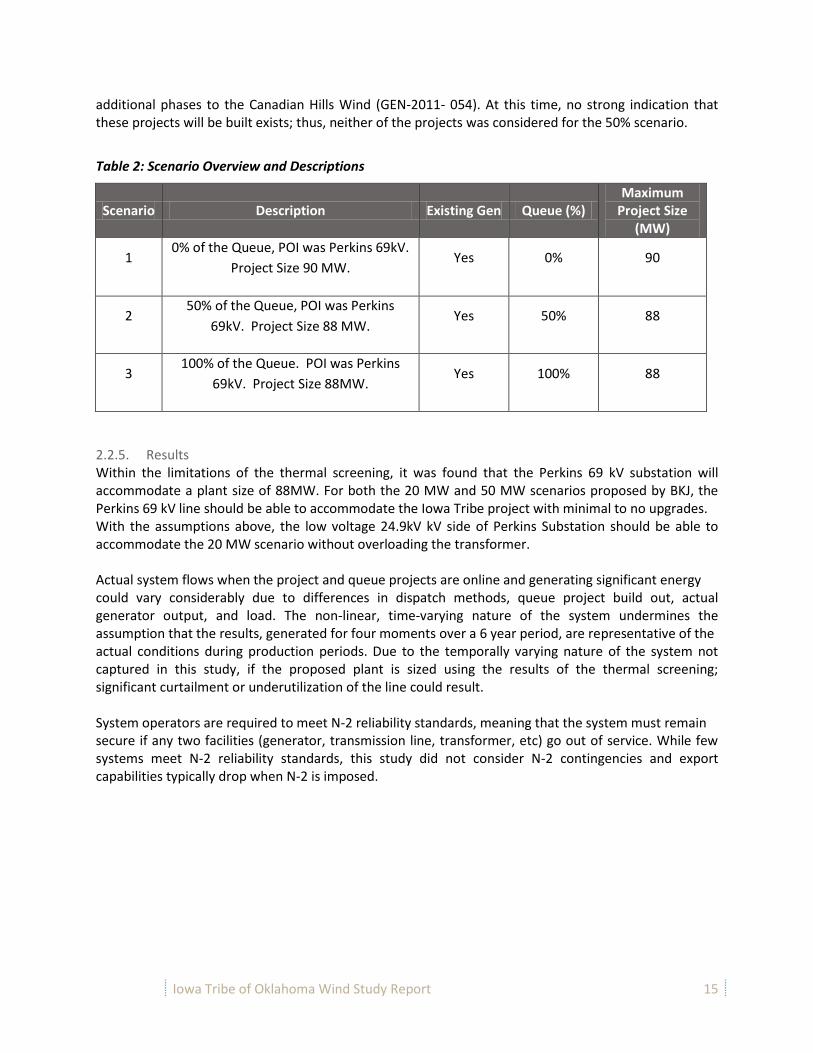
Iowa Tribe of Oklahoma Wind Study Report 15
additional phases to the Canadian Hills Wind (GEN-2011- 054). At this time, no strong indication that these projects will be built exists; thus, neither of the projects was considered for the 50% scenario.
Table 2: Scenario Overview and Descriptions
Scenario Description Existing Gen Queue (%) Maximum
Project Size (MW)
1 0% of the Queue, POI was Perkins 69kV.
Project Size 90 MW. Yes 0% 90
2 50% of the Queue, POI was Perkins
69kV. Project Size 88 MW. Yes 50% 88
3 100% of the Queue. POI was Perkins
69kV. Project Size 88MW. Yes 100% 88
2.2.5. Results Within the limitations of the thermal screening, it was found that the Perkins 69 kV substation will accommodate a plant size of 88MW. For both the 20 MW and 50 MW scenarios proposed by BKJ, the Perkins 69 kV line should be able to accommodate the Iowa Tribe project with minimal to no upgrades. With the assumptions above, the low voltage 24.9kV kV side of Perkins Substation should be able to accommodate the 20 MW scenario without overloading the transformer. Actual system flows when the project and queue projects are online and generating significant energy could vary considerably due to differences in dispatch methods, queue project build out, actual generator output, and load. The non-linear, time-varying nature of the system undermines the assumption that the results, generated for four moments over a 6 year period, are representative of the actual conditions during production periods. Due to the temporally varying nature of the system not captured in this study, if the proposed plant is sized using the results of the thermal screening; significant curtailment or underutilization of the line could result. System operators are required to meet N-2 reliability standards, meaning that the system must remain secure if any two facilities (generator, transmission line, transformer, etc) go out of service. While few systems meet N-2 reliability standards, this study did not consider N-2 contingencies and export capabilities typically drop when N-2 is imposed.
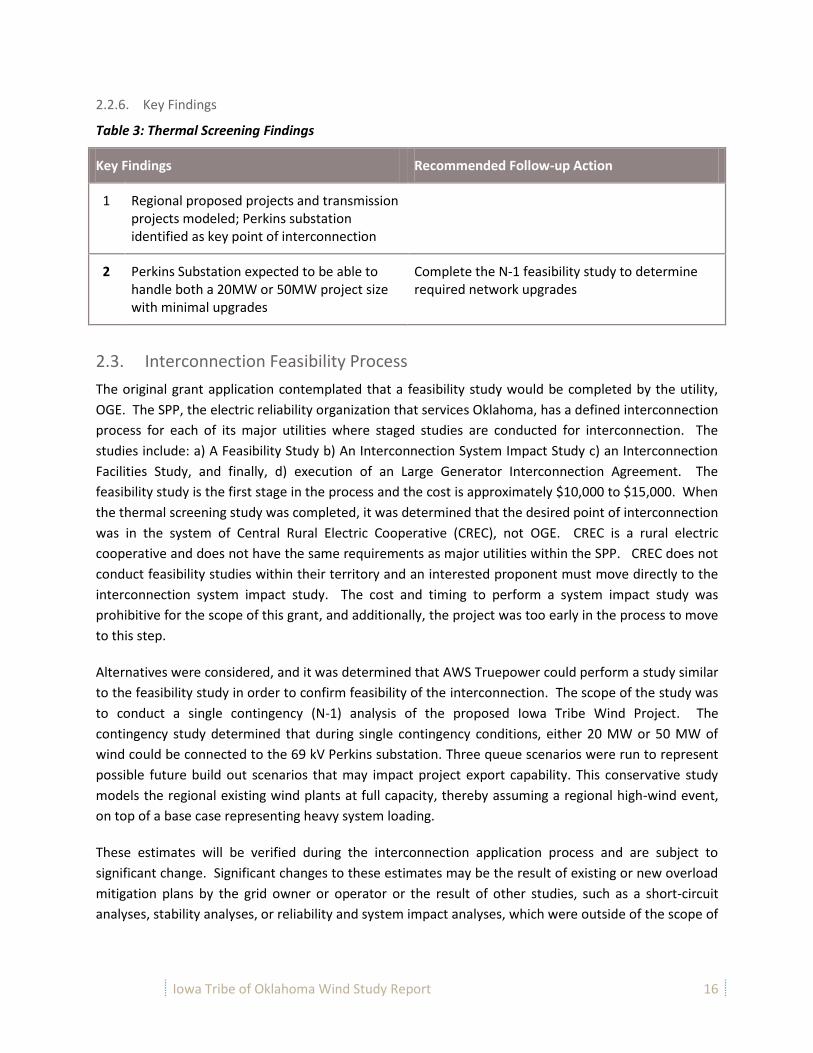
Iowa Tribe of Oklahoma Wind Study Report 16
2.2.6. Key Findings
Table 3: Thermal Screening Findings
Key Findings Recommended Follow-up Action
1 Regional proposed projects and transmission projects modeled; Perkins substation identified as key point of interconnection
2 Perkins Substation expected to be able to handle both a 20MW or 50MW project size with minimal upgrades
Complete the N-1 feasibility study to determine required network upgrades
2.3. Interconnection Feasibility Process
The original grant application contemplated that a feasibility study would be completed by the utility,
OGE. The SPP, the electric reliability organization that services Oklahoma, has a defined interconnection
process for each of its major utilities where staged studies are conducted for interconnection. The
studies include: a) A Feasibility Study b) An Interconnection System Impact Study c) an Interconnection
Facilities Study, and finally, d) execution of an Large Generator Interconnection Agreement. The
feasibility study is the first stage in the process and the cost is approximately $10,000 to $15,000. When
the thermal screening study was completed, it was determined that the desired point of interconnection
was in the system of Central Rural Electric Cooperative (CREC), not OGE. CREC is a rural electric
cooperative and does not have the same requirements as major utilities within the SPP. CREC does not
conduct feasibility studies within their territory and an interested proponent must move directly to the
interconnection system impact study. The cost and timing to perform a system impact study was
prohibitive for the scope of this grant, and additionally, the project was too early in the process to move
to this step.
Alternatives were considered, and it was determined that AWS Truepower could perform a study similar
to the feasibility study in order to confirm feasibility of the interconnection. The scope of the study was
to conduct a single contingency (N-1) analysis of the proposed Iowa Tribe Wind Project. The
contingency study determined that during single contingency conditions, either 20 MW or 50 MW of
wind could be connected to the 69 kV Perkins substation. Three queue scenarios were run to represent
possible future build out scenarios that may impact project export capability. This conservative study
models the regional existing wind plants at full capacity, thereby assuming a regional high-wind event,
on top of a base case representing heavy system loading.
These estimates will be verified during the interconnection application process and are subject to
significant change. Significant changes to these estimates may be the result of existing or new overload
mitigation plans by the grid owner or operator or the result of other studies, such as a short-circuit
analyses, stability analyses, or reliability and system impact analyses, which were outside of the scope of
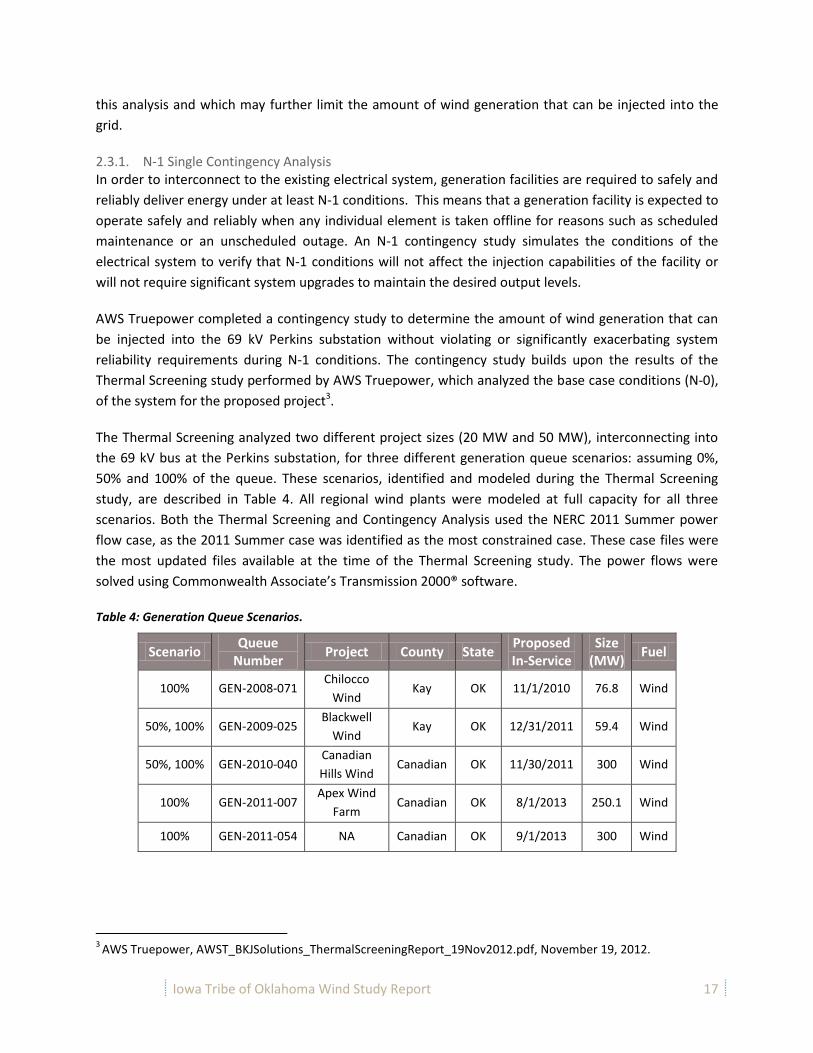
Iowa Tribe of Oklahoma Wind Study Report 17
this analysis and which may further limit the amount of wind generation that can be injected into the
grid.
2.3.1. N-1 Single Contingency Analysis In order to interconnect to the existing electrical system, generation facilities are required to safely and
reliably deliver energy under at least N-1 conditions. This means that a generation facility is expected to
operate safely and reliably when any individual element is taken offline for reasons such as scheduled
maintenance or an unscheduled outage. An N-1 contingency study simulates the conditions of the
electrical system to verify that N-1 conditions will not affect the injection capabilities of the facility or
will not require significant system upgrades to maintain the desired output levels.
AWS Truepower completed a contingency study to determine the amount of wind generation that can
be injected into the 69 kV Perkins substation without violating or significantly exacerbating system
reliability requirements during N-1 conditions. The contingency study builds upon the results of the
Thermal Screening study performed by AWS Truepower, which analyzed the base case conditions (N-0),
of the system for the proposed project3.
The Thermal Screening analyzed two different project sizes (20 MW and 50 MW), interconnecting into
the 69 kV bus at the Perkins substation, for three different generation queue scenarios: assuming 0%,
50% and 100% of the queue. These scenarios, identified and modeled during the Thermal Screening
study, are described in Table 4. All regional wind plants were modeled at full capacity for all three
scenarios. Both the Thermal Screening and Contingency Analysis used the NERC 2011 Summer power
flow case, as the 2011 Summer case was identified as the most constrained case. These case files were
the most updated files available at the time of the Thermal Screening study. The power flows were
solved using Commonwealth Associate’s Transmission 2000® software.
Table 4: Generation Queue Scenarios.
Scenario Queue Number Project County State Proposed
In-Service Size
(MW) Fuel
100% GEN-2008-071 Chilocco
Wind Kay OK 11/1/2010 76.8 Wind
50%, 100% GEN-2009-025 Blackwell
Wind Kay OK 12/31/2011 59.4 Wind
50%, 100% GEN-2010-040 Canadian
Hills Wind Canadian OK 11/30/2011 300 Wind
100% GEN-2011-007 Apex Wind
Farm Canadian OK 8/1/2013 250.1 Wind
100% GEN-2011-054 NA Canadian OK 9/1/2013 300 Wind
3
AWS Truepower, AWST_BKJSolutions_ThermalScreeningReport_19Nov2012.pdf, November 19, 2012.
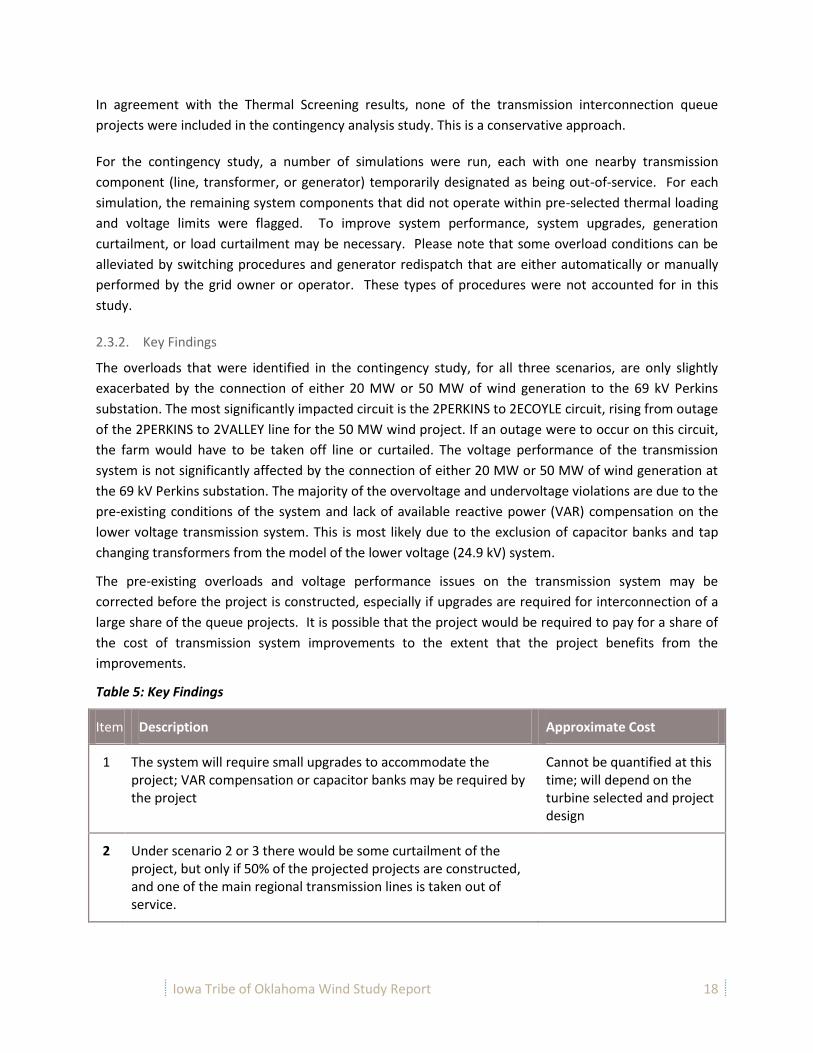
Iowa Tribe of Oklahoma Wind Study Report 18
In agreement with the Thermal Screening results, none of the transmission interconnection queue
projects were included in the contingency analysis study. This is a conservative approach.
For the contingency study, a number of simulations were run, each with one nearby transmission
component (line, transformer, or generator) temporarily designated as being out-of-service. For each
simulation, the remaining system components that did not operate within pre-selected thermal loading
and voltage limits were flagged. To improve system performance, system upgrades, generation
curtailment, or load curtailment may be necessary. Please note that some overload conditions can be
alleviated by switching procedures and generator redispatch that are either automatically or manually
performed by the grid owner or operator. These types of procedures were not accounted for in this
study.
2.3.2. Key Findings
The overloads that were identified in the contingency study, for all three scenarios, are only slightly
exacerbated by the connection of either 20 MW or 50 MW of wind generation to the 69 kV Perkins
substation. The most significantly impacted circuit is the 2PERKINS to 2ECOYLE circuit, rising from outage
of the 2PERKINS to 2VALLEY line for the 50 MW wind project. If an outage were to occur on this circuit,
the farm would have to be taken off line or curtailed. The voltage performance of the transmission
system is not significantly affected by the connection of either 20 MW or 50 MW of wind generation at
the 69 kV Perkins substation. The majority of the overvoltage and undervoltage violations are due to the
pre-existing conditions of the system and lack of available reactive power (VAR) compensation on the
lower voltage transmission system. This is most likely due to the exclusion of capacitor banks and tap
changing transformers from the model of the lower voltage (24.9 kV) system.
The pre-existing overloads and voltage performance issues on the transmission system may be
corrected before the project is constructed, especially if upgrades are required for interconnection of a
large share of the queue projects. It is possible that the project would be required to pay for a share of
the cost of transmission system improvements to the extent that the project benefits from the
improvements.
Table 5: Key Findings
Item Description Approximate Cost
1 The system will require small upgrades to accommodate the project; VAR compensation or capacitor banks may be required by the project
Cannot be quantified at this time; will depend on the turbine selected and project design
2 Under scenario 2 or 3 there would be some curtailment of the project, but only if 50% of the projected projects are constructed, and one of the main regional transmission lines is taken out of service.
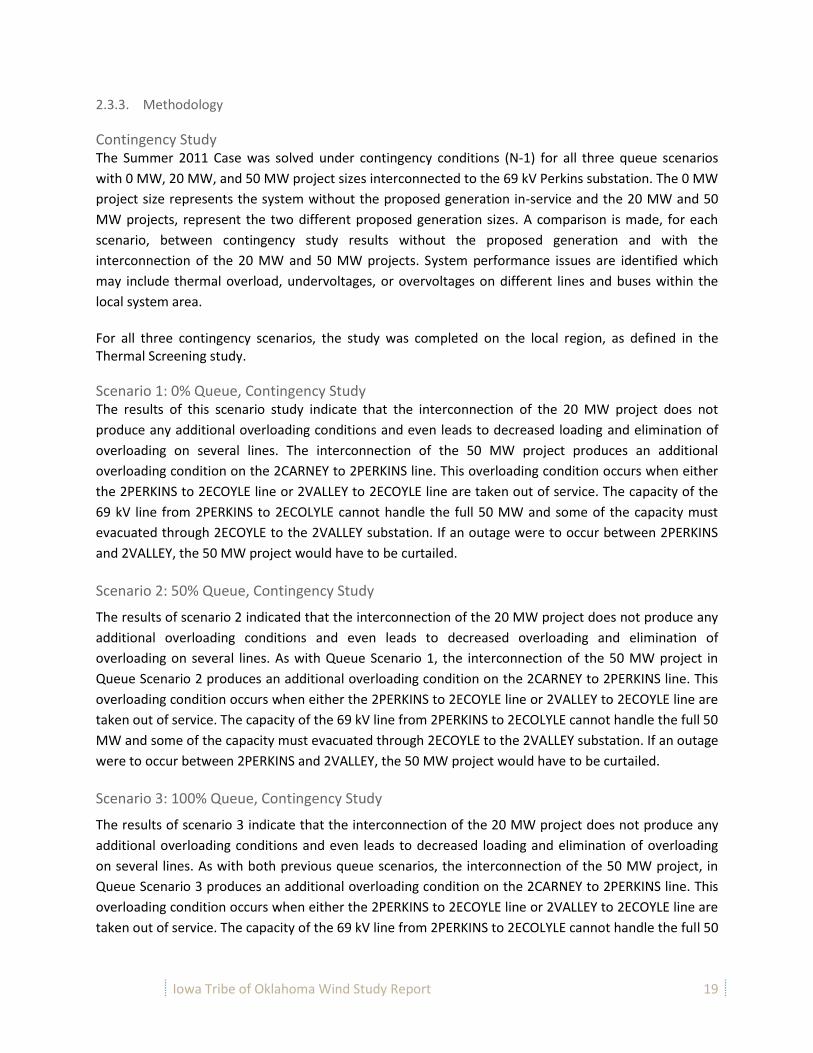
Iowa Tribe of Oklahoma Wind Study Report 19
2.3.3. Methodology
Contingency Study The Summer 2011 Case was solved under contingency conditions (N-1) for all three queue scenarios
with 0 MW, 20 MW, and 50 MW project sizes interconnected to the 69 kV Perkins substation. The 0 MW
project size represents the system without the proposed generation in-service and the 20 MW and 50
MW projects, represent the two different proposed generation sizes. A comparison is made, for each
scenario, between contingency study results without the proposed generation and with the
interconnection of the 20 MW and 50 MW projects. System performance issues are identified which
may include thermal overload, undervoltages, or overvoltages on different lines and buses within the
local system area.
For all three contingency scenarios, the study was completed on the local region, as defined in the Thermal Screening study.
Scenario 1: 0% Queue, Contingency Study The results of this scenario study indicate that the interconnection of the 20 MW project does not
produce any additional overloading conditions and even leads to decreased loading and elimination of
overloading on several lines. The interconnection of the 50 MW project produces an additional
overloading condition on the 2CARNEY to 2PERKINS line. This overloading condition occurs when either
the 2PERKINS to 2ECOYLE line or 2VALLEY to 2ECOYLE line are taken out of service. The capacity of the
69 kV line from 2PERKINS to 2ECOLYLE cannot handle the full 50 MW and some of the capacity must
evacuated through 2ECOYLE to the 2VALLEY substation. If an outage were to occur between 2PERKINS
and 2VALLEY, the 50 MW project would have to be curtailed.
Scenario 2: 50% Queue, Contingency Study
The results of scenario 2 indicated that the interconnection of the 20 MW project does not produce any
additional overloading conditions and even leads to decreased overloading and elimination of
overloading on several lines. As with Queue Scenario 1, the interconnection of the 50 MW project in
Queue Scenario 2 produces an additional overloading condition on the 2CARNEY to 2PERKINS line. This
overloading condition occurs when either the 2PERKINS to 2ECOYLE line or 2VALLEY to 2ECOYLE line are
taken out of service. The capacity of the 69 kV line from 2PERKINS to 2ECOLYLE cannot handle the full 50
MW and some of the capacity must evacuated through 2ECOYLE to the 2VALLEY substation. If an outage
were to occur between 2PERKINS and 2VALLEY, the 50 MW project would have to be curtailed.
Scenario 3: 100% Queue, Contingency Study
The results of scenario 3 indicate that the interconnection of the 20 MW project does not produce any
additional overloading conditions and even leads to decreased loading and elimination of overloading
on several lines. As with both previous queue scenarios, the interconnection of the 50 MW project, in
Queue Scenario 3 produces an additional overloading condition on the 2CARNEY to 2PERKINS line. This
overloading condition occurs when either the 2PERKINS to 2ECOYLE line or 2VALLEY to 2ECOYLE line are
taken out of service. The capacity of the 69 kV line from 2PERKINS to 2ECOLYLE cannot handle the full 50
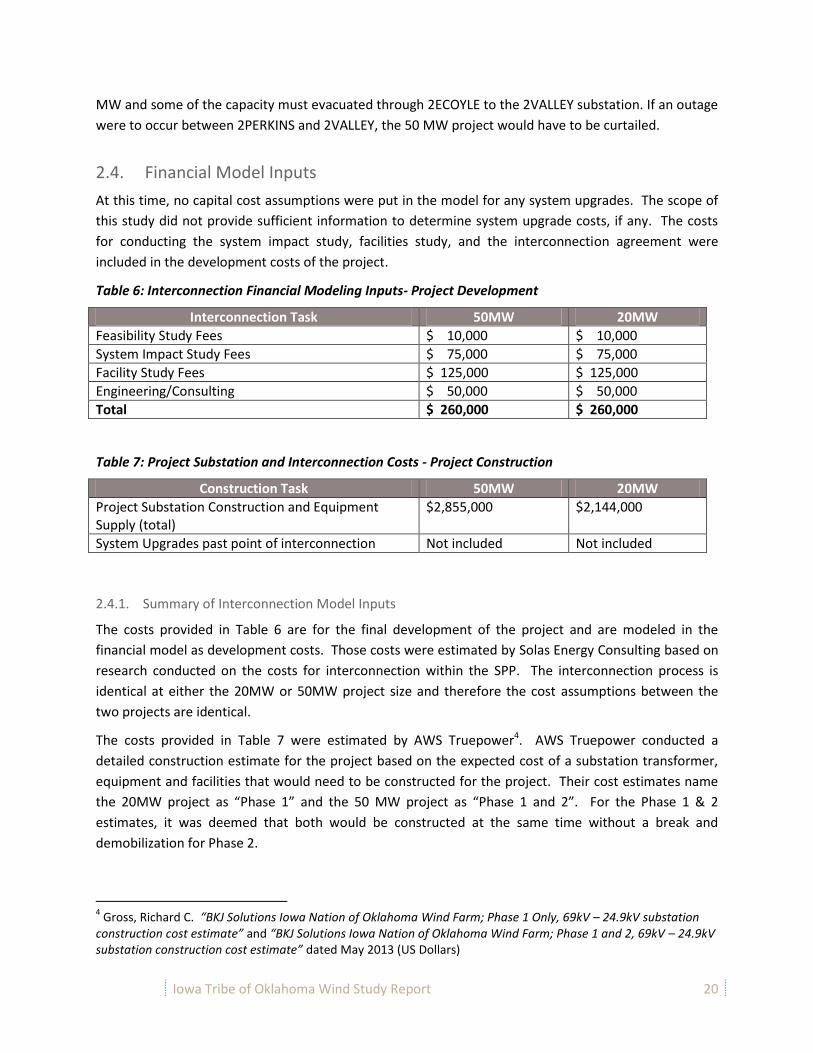
Iowa Tribe of Oklahoma Wind Study Report 20
MW and some of the capacity must evacuated through 2ECOYLE to the 2VALLEY substation. If an outage
were to occur between 2PERKINS and 2VALLEY, the 50 MW project would have to be curtailed.
2.4. Financial Model Inputs
At this time, no capital cost assumptions were put in the model for any system upgrades. The scope of
this study did not provide sufficient information to determine system upgrade costs, if any. The costs
for conducting the system impact study, facilities study, and the interconnection agreement were
included in the development costs of the project.
Table 6: Interconnection Financial Modeling Inputs- Project Development
Interconnection Task 50MW 20MW
Feasibility Study Fees $ 10,000 $ 10,000
System Impact Study Fees $ 75,000 $ 75,000
Facility Study Fees $ 125,000 $ 125,000
Engineering/Consulting $ 50,000 $ 50,000
Total $ 260,000 $ 260,000
Table 7: Project Substation and Interconnection Costs - Project Construction
Construction Task 50MW 20MW
Project Substation Construction and Equipment Supply (total)
$2,855,000 $2,144,000
System Upgrades past point of interconnection Not included Not included
2.4.1. Summary of Interconnection Model Inputs
The costs provided in Table 6 are for the final development of the project and are modeled in the
financial model as development costs. Those costs were estimated by Solas Energy Consulting based on
research conducted on the costs for interconnection within the SPP. The interconnection process is
identical at either the 20MW or 50MW project size and therefore the cost assumptions between the
two projects are identical.
The costs provided in Table 7 were estimated by AWS Truepower4. AWS Truepower conducted a
detailed construction estimate for the project based on the expected cost of a substation transformer,
equipment and facilities that would need to be constructed for the project. Their cost estimates name
the 20MW project as “Phase 1” and the 50 MW project as “Phase 1 and 2”. For the Phase 1 & 2
estimates, it was deemed that both would be constructed at the same time without a break and
demobilization for Phase 2.
4 Gross, Richard C. “BKJ Solutions Iowa Nation of Oklahoma Wind Farm; Phase 1 Only, 69kV – 24.9kV substation
construction cost estimate” and “BKJ Solutions Iowa Nation of Oklahoma Wind Farm; Phase 1 and 2, 69kV – 24.9kV substation construction cost estimate” dated May 2013 (US Dollars)

Iowa Tribe of Oklahoma Wind Study Report 21
It should be noted that no costs were included in the financial model for any system upgrades external
to the project infrastructure. The N-1 contingency did identify that it is possible that system upgrades
will be required, however estimating the costs of those upgrades was outside the scope of this feasibility
study. A rough estimation of those costs normally is conducted by the utility during the system impact
study, with refined estimates during the facility study. At that time, the utility would determine the cost
and schedule for conducting any required system upgrades, and those costs would be allocated to the
generator. The cost allocation must be accepted prior to signing the finalized interconnection
agreement.
Iowa Tribe of Oklahoma Wind Study Report 22
3. MARKET RESEARCH FOR UNBUNDLING GREEN TAGS5
3.1. Summary of Scope
Any generation source, such as coal, gas, wind, solar or hydropower produces electricity, measured in
mega-watt hours (MWh), and that electricity is sold in the market-place for a specific price. The
electricity market consists of both multiple bi-lateral contracts (power purchase agreements) between
buyers and sellers, and generation which is placed into the grid by generators and utilized by consumers
without direct bi-lateral contracts (the spot market). An electric utility generating power and selling to
retail consumers, as an example, is generating power at a known cost and providing into the retail
market according to a tariff, which may change based on season, time of day, demand and supply.
When electricity is generated by a renewable source, such as wind power or solar power, the electricity
has a price premium in the market place because no associated carbon emission is generated.
Electricity generated by a renewable energy source can be sold as green power (bundled power) or can
be ‘unbundled’ into two components – the actual electrons, also called ‘brown power’ and the value of
the renewable price premium – the renewable energy credit (REC), which is also called a ‘green-tag’ in
some markets. When developing an independent power project, the developer is always seeking to
maximize the revenue from a power project. With renewable energy projects, the maximum revenue
may be gained from either selling the green power in one bundle (brown power + RECs), or from
breaking apart the green power into two commodities – the brown power and the RECs, and selling
them separately. The contract value the project developer is able to acquire for RECs is dependent on
the current appetite of market participants for the green tags. Some regions that have Renewable
Portfolio Standard (RPS) requirements, but have limited renewable resources or are a larger distance
from the generation source, may be willing to pay a premium for the unbundled RECs to meet the RPS
requirements. The market appetite for RECs is one of the keys to potential project profitability for a
green energy project because this provides some additional project revenue.
The purpose of this section of analysis is to consider whether unbundling the green power into two
commodities might garner a larger price in the market then selling the power as ‘green’, which is
bundled. This section is specific to the value for that green tag or REC. A discussion of the value of
bundled energy and pure brown power is considered in Section 5.
Initially, research was conducted on the voluntary and compulsory green tag and REC market. An
emphasis was placed on the SPP and Oklahoma REC market, although the national market was also
reviewed for potential opportunities. The carbon value of the RECs was determined including both the
EPC E-Grid rules and the REC vs. Carbon Offsets pricing and indicative REC value was also determined.
A REC value enhancement strategy was analyzed, which included research on a “Tribal REC” branding
strategy to determine if a REC premium could be obtained from the sale of RECs to the Federal or State
5 This section is primarily drawn from “BKJ Solutions, Iowa Tribe of OK REC Consulting” dated November 2, 2012
prepared for BKJ Solutions, Inc. from Renewable Choice Energy, with some edits, modifications, and conclusions by Solas Energy Consulting US Inc.

Iowa Tribe of Oklahoma Wind Study Report 23
governments. Additionally, research was conducted on adding value through offering naming rights or
providing flexible term contract options.
The results of the analysis were utilized to provide sensitivities for REC value in the project economic
model.
3.2. Overview of the Renewable Energy Credit (REC) Market
Renewable energy credits, or RECs, are how green power is tracked and traded in North America. RECs
verify that one megawatt-hour (MWh) of green power has been generated and embody the
environmental attributes of that clean energy including the associated greenhouse gas reductions. RECs
are certified by third parties, and purchased by the U.S. EPA, Air Force, Fortune 500 companies as well as
many major universities and non-governmental organizations (NGOs). RECs may be generated by the
following energy producing technology types: wind farms, biomass facilities, qualifying hydroelectric
projects, geothermal projects and photovoltaic/solar projects.
When a renewable facility produces one MWh of electricity and adds it to the power grid, they also
generate one corresponding REC (one-for-one). Once the electricity is on the power grid, there is no way
to accurately track where it ends up - it mixes with the electricity generated from coal, nuclear and all
other sources. One can think of the national power grid a big pool of energy. Unless you are fully off-
grid, there is no way to tell where the electrons running through your computer right now actually
originated. However, if you have ownership of RECs corresponding to the amount of power you take out
of the pool, you know that at least that much power was generated at a renewable facility and added
back to the power grid somewhere.
All renewable energy tracking is based on RECs - in both compliance and voluntary markets. As of
November 2012, twenty nine U.S. states and the District of Columbia have established Renewable
Portfolio Standards (RPS) or renewable electricity standards. These standards essentially mandate that
utilities in those states have a certain percentage green power in their power mix (e.g. 20% by 2020).
The way that these utilities prove that they have this green power in the mix is through ownership of the
associated RECs. These markets with compliance obligations are termed compliance markets, and the
driving force behind the market is the government legislation where utilities are required to purchase
RECs.
The voluntary market works the same way. If you hear a company is “wind powered” or “buying green
power” it probably means they are buying enough RECs to match their electricity usage. A common
misunderstanding is that when green power is purchased through a utility it is somehow different than
buying RECs. When green power is bought through a utility, it simply means that both delivered power
and RECs are being purchased together. This is often referred to as “bundled” power or “power plus,”
where the REC or power alone is referred to as an “unbundled” product. The main point for the
consumer to understand here is that the electrons from the wind farm aren’t all going directly to the site
of the end user either way; the consumer is simply ensuring that its usage is replaced in the pool with

Iowa Tribe of Oklahoma Wind Study Report 24
clean energy. For both the compliance and voluntary buyer, RECs are the only way to track and trade
grid-sourced, as opposed to on-site, green power.
3.3. Purchasers of RECs
Buying green power is becoming more popular as we have seen an increase in both compliance and
voluntary buyers over the past ten years – voluntary buyers have actually purchased a higher volume of
RECs over the past several years than the utilities that are mandated to buy because of an RPS. On the
voluntary side, buying RECs is a way for many organizations to show that they are green powered or
using 100% renewable energy – an environmental commitment that can help them connect to
customers, partners and important stakeholders through marketing and branding efforts. Since the REC
embodies the environmental benefits of producing clean energy, the buyer can also reduce their
greenhouse gas emissions through REC purchases. From businesses trying to be good corporate citizens
and universities supporting student interests to government agencies looking to support domestic
industry, REC purchasers come in all sizes and types of organizations.
3.3.1. Project Developer Value The value of the REC system goes beyond value to the buyer. For renewable energy developers, RECs
provide an additional income stream that can help make a project more viable or more competitive with
conventional fossil fuel generators. It allows them to capture the added value in producing energy in a
sustainable way. Further, the robust voluntary and compliance REC markets demonstrate broad support
and demand for renewable energy. On the support side, corporate advertising dollars can help spread
the word and garner public support. On the demand side, increased green power demand helps drive up
REC prices, providing further incentive for new development. At its essence, the REC market can provide
an important revenue source that many projects rely on as a core element of their project’s financial
performance.
3.3.2. REC Certification Not all renewable energy credits are certified. In compliance markets, RECs are generally delivered from
seller to buyer via regional tracking systems and must meet state guidelines. Regional tracking systems
include the Midwest Regional Energy Tracking System (MRETS) and the Generation Attribute Tracking
System (GATS) in the PJM region, among others. These tracking systems are used to trace the chain-of-
custody of the REC and ensure that no double-counting occurs. To show that the project meets state
guidelines, each individual green power facility must go through an application process with the state in
order to qualify to sell RECs to compliance constrained entities (large utilities). Every state RPS has
slightly different criteria.
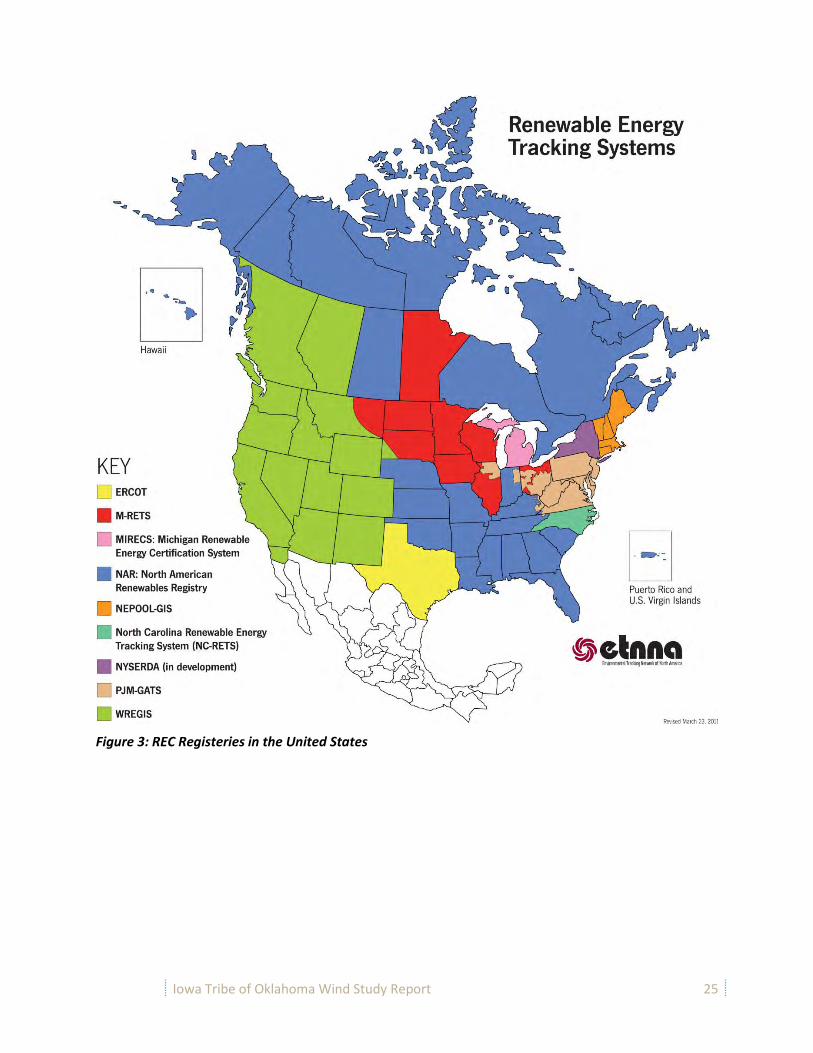
Iowa Tribe of Oklahoma Wind Study Report 25
Figure 3: REC Registeries in the United States

Iowa Tribe of Oklahoma Wind Study Report 26
3.4. Oklahoma REC Market6
Eight states do not have mandatory requirements for renewable energy, but rather voluntary goals.
These programs operate similarly to a mandatory RPS, but typically no penalty is assessed for non-
compliance. Oklahoma has such a goal.
Oklahoma’s renewable energy goal was established in May 2010 by the Oklahoma Energy Security Act.
The goal is related to generation capacity rather than actual generation. It aims for 15% of total
installed generation capacity to come from renewables by 2015. Eligible resources are wind, solar,
hydropower, hydrogen, geothermal, biomass, and distributed generation smaller than 5 MW capacity.
Energy efficiency and demand side management (DSM) can be used to meet 25% of the overall 15%
goal.
Because this goal is related to generation capacity and not actual generation, RECs are not traded to
comply with the goal. Instead, every electricity generating entity or company operating electricity
generation facilities in Oklahoma must file a report with the Oklahoma Corporation Commission (OCC)
by March 1 of each year disclosing total installed capacity of the entity’s facilities, generation from each
facility, and the resource for each facility. The annual renewable energy percentage is then simply
calculated by dividing total renewable energy generation capacity in the state plus any savings from
DSM measures by the total electricity generation in the state.
For 2011, the OCC determined that 14.54% of Oklahoma’s total generation capacity came from
renewable resources and DSM. This percentage was achieved by 2,754.85 MW of installed renewable
capacity as well as 165 MW of DSM measures. This was an increase from 12.85% in 2010 and
demonstrates that Oklahoma is well on its way to achieving the voluntary goal. It is important to note
that not every electrical generation producer provides this data, and therefore the OCC uses its best
estimates to track achievement of this goal. It is unlikely that this goal will provide any additional value
to new wind projects developed in Oklahoma in the near term.
The vast majority of the renewable energy capacity in the state comes from wind power development,
and Oklahoma ranks 8th best in the nation for both existing and potential capacity for wind power.
Additionally, a substantial hydropower base of 805 MW and a single biomass facility are installed. No
geothermal or large scale solar plants were identified in the state.
Many Oklahoma utilities are selling RECs to their local customers with prices ranging from $0.35 to $1.72
per 100 kWh7. Although specific accurate numbers are not disclosed, it is estimated that only a few
thousand Oklahomans are purchasing RECs to offset their carbon footprint. In these cases, it is possible
that off takers such as OG&E are willing to pay above National REC prices (historically, $1.00-
6 This section is a combination of information from Renewable Choice Energy and Schneider Electric. All
information is from Renewable Choice Energy unless otherwise noted. 7 Report “Electricity Price Modeling & Incentive Opportunity Assessment” dated May 30, 2013 by Schneider
Electric.
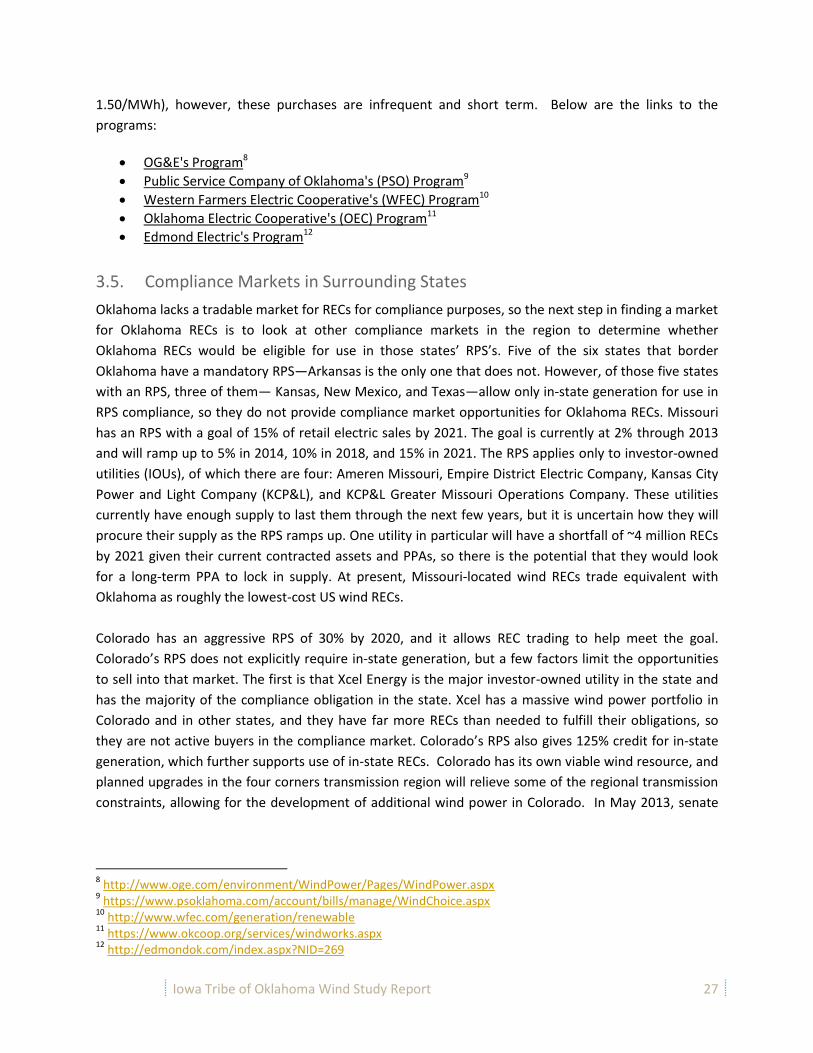
Iowa Tribe of Oklahoma Wind Study Report 27
1.50/MWh), however, these purchases are infrequent and short term. Below are the links to the
programs:
OG&E's Program8
Public Service Company of Oklahoma's (PSO) Program9
Western Farmers Electric Cooperative's (WFEC) Program10
Oklahoma Electric Cooperative's (OEC) Program11
Edmond Electric's Program12
3.5. Compliance Markets in Surrounding States
Oklahoma lacks a tradable market for RECs for compliance purposes, so the next step in finding a market
for Oklahoma RECs is to look at other compliance markets in the region to determine whether
Oklahoma RECs would be eligible for use in those states’ RPS’s. Five of the six states that border
Oklahoma have a mandatory RPS—Arkansas is the only one that does not. However, of those five states
with an RPS, three of them— Kansas, New Mexico, and Texas—allow only in-state generation for use in
RPS compliance, so they do not provide compliance market opportunities for Oklahoma RECs. Missouri
has an RPS with a goal of 15% of retail electric sales by 2021. The goal is currently at 2% through 2013
and will ramp up to 5% in 2014, 10% in 2018, and 15% in 2021. The RPS applies only to investor-owned
utilities (IOUs), of which there are four: Ameren Missouri, Empire District Electric Company, Kansas City
Power and Light Company (KCP&L), and KCP&L Greater Missouri Operations Company. These utilities
currently have enough supply to last them through the next few years, but it is uncertain how they will
procure their supply as the RPS ramps up. One utility in particular will have a shortfall of ~4 million RECs
by 2021 given their current contracted assets and PPAs, so there is the potential that they would look
for a long-term PPA to lock in supply. At present, Missouri-located wind RECs trade equivalent with
Oklahoma as roughly the lowest-cost US wind RECs.
Colorado has an aggressive RPS of 30% by 2020, and it allows REC trading to help meet the goal.
Colorado’s RPS does not explicitly require in-state generation, but a few factors limit the opportunities
to sell into that market. The first is that Xcel Energy is the major investor-owned utility in the state and
has the majority of the compliance obligation in the state. Xcel has a massive wind power portfolio in
Colorado and in other states, and they have far more RECs than needed to fulfill their obligations, so
they are not active buyers in the compliance market. Colorado’s RPS also gives 125% credit for in-state
generation, which further supports use of in-state RECs. Colorado has its own viable wind resource, and
planned upgrades in the four corners transmission region will relieve some of the regional transmission
constraints, allowing for the development of additional wind power in Colorado. In May 2013, senate
8 http://www.oge.com/environment/WindPower/Pages/WindPower.aspx
9 https://www.psoklahoma.com/account/bills/manage/WindChoice.aspx
10 http://www.wfec.com/generation/renewable
11 https://www.okcoop.org/services/windworks.aspx
12 http://edmondok.com/index.aspx?NID=269
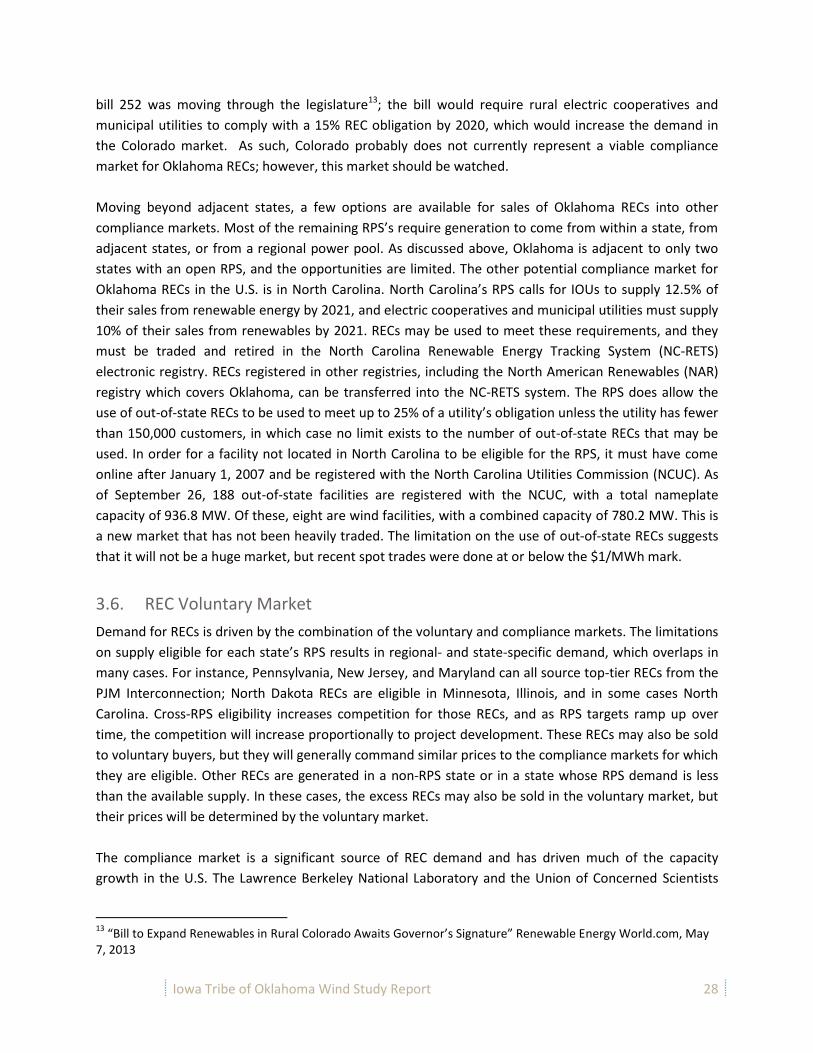
Iowa Tribe of Oklahoma Wind Study Report 28
bill 252 was moving through the legislature13; the bill would require rural electric cooperatives and
municipal utilities to comply with a 15% REC obligation by 2020, which would increase the demand in
the Colorado market. As such, Colorado probably does not currently represent a viable compliance
market for Oklahoma RECs; however, this market should be watched.
Moving beyond adjacent states, a few options are available for sales of Oklahoma RECs into other
compliance markets. Most of the remaining RPS’s require generation to come from within a state, from
adjacent states, or from a regional power pool. As discussed above, Oklahoma is adjacent to only two
states with an open RPS, and the opportunities are limited. The other potential compliance market for
Oklahoma RECs in the U.S. is in North Carolina. North Carolina’s RPS calls for IOUs to supply 12.5% of
their sales from renewable energy by 2021, and electric cooperatives and municipal utilities must supply
10% of their sales from renewables by 2021. RECs may be used to meet these requirements, and they
must be traded and retired in the North Carolina Renewable Energy Tracking System (NC-RETS)
electronic registry. RECs registered in other registries, including the North American Renewables (NAR)
registry which covers Oklahoma, can be transferred into the NC-RETS system. The RPS does allow the
use of out-of-state RECs to be used to meet up to 25% of a utility’s obligation unless the utility has fewer
than 150,000 customers, in which case no limit exists to the number of out-of-state RECs that may be
used. In order for a facility not located in North Carolina to be eligible for the RPS, it must have come
online after January 1, 2007 and be registered with the North Carolina Utilities Commission (NCUC). As
of September 26, 188 out-of-state facilities are registered with the NCUC, with a total nameplate
capacity of 936.8 MW. Of these, eight are wind facilities, with a combined capacity of 780.2 MW. This is
a new market that has not been heavily traded. The limitation on the use of out-of-state RECs suggests
that it will not be a huge market, but recent spot trades were done at or below the $1/MWh mark.
3.6. REC Voluntary Market
Demand for RECs is driven by the combination of the voluntary and compliance markets. The limitations
on supply eligible for each state’s RPS results in regional- and state-specific demand, which overlaps in
many cases. For instance, Pennsylvania, New Jersey, and Maryland can all source top-tier RECs from the
PJM Interconnection; North Dakota RECs are eligible in Minnesota, Illinois, and in some cases North
Carolina. Cross-RPS eligibility increases competition for those RECs, and as RPS targets ramp up over
time, the competition will increase proportionally to project development. These RECs may also be sold
to voluntary buyers, but they will generally command similar prices to the compliance markets for which
they are eligible. Other RECs are generated in a non-RPS state or in a state whose RPS demand is less
than the available supply. In these cases, the excess RECs may also be sold in the voluntary market, but
their prices will be determined by the voluntary market.
The compliance market is a significant source of REC demand and has driven much of the capacity
growth in the U.S. The Lawrence Berkeley National Laboratory and the Union of Concerned Scientists
13
“Bill to Expand Renewables in Rural Colorado Awaits Governor’s Signature” Renewable Energy World.com, May 7, 2013

Iowa Tribe of Oklahoma Wind Study Report 29
have projected that state RPSs will require over 300 million MWh of renewable generation by 2020.
RPSs are dynamic insofar as they are legislation open to amendment. California and Colorado, for
example, increased their goals in the past few years, while Ohio has recently seen proposed legislation
to repeal the RPS. Nonetheless, the compliance market will continue to be a large source of demand,
and this could impact pricing in the voluntary market.
Voluntary REC demand has increased steadily over the past ten years. The National Renewable Energy
Laboratory (NREL) estimates that the total voluntary market exceeds 35 million MWh. This is comprised
of sales through utility green pricing programs, competitive electricity sales, and REC sales (i.e. Green-e
Energy-certified sales). The Center for Resource Solutions, which runs the Greene Energy program,
reported 28 million MWh in total Green-e-certified sales in 2011, a 21 percent increase over 2010.
Green pricing programs are now offered by over 850 utilities nationwide, and competitive electricity
suppliers continue to expand their green power offerings in an effort to attract customers. These
programs continue to grow in popularity and are often sources of state-specific demand for RECs.
Recent low prices, among other factors, have resulted in voluntary buyers purchasing a larger volume of
RECs, and the purchase of renewable energy has become increasingly normal for businesses— Green-e
Energy retail sales have grown at an annual compounded rate of 44% from 2006-2011. Even factoring in
this growth in demand, the combination of increasing supply and the economic downturn has resulted
in the market falling to the lowest prices in its history. As we emerge from this period, we would hope to
see increasing demand from business and individuals as well as the growth of existing federal, state and
municipal-level initiatives utilizing the REC markets to support renewable development, driving prices
back toward previous levels. Unfortunately, it is difficult to predict the timing of this market growth and
developers remain cautious when evaluating voluntary market pricing over the next 3 to 5 years.
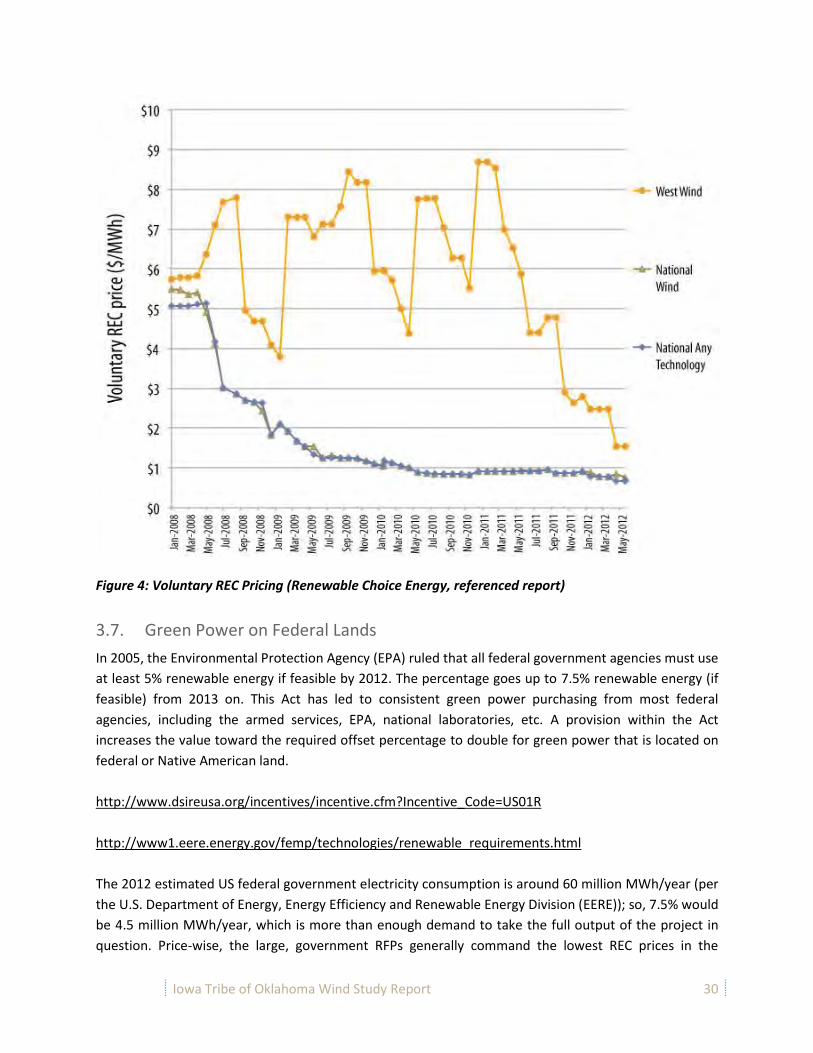
Iowa Tribe of Oklahoma Wind Study Report 30
Figure 4: Voluntary REC Pricing (Renewable Choice Energy, referenced report)
3.7. Green Power on Federal Lands
In 2005, the Environmental Protection Agency (EPA) ruled that all federal government agencies must use
at least 5% renewable energy if feasible by 2012. The percentage goes up to 7.5% renewable energy (if
feasible) from 2013 on. This Act has led to consistent green power purchasing from most federal
agencies, including the armed services, EPA, national laboratories, etc. A provision within the Act
increases the value toward the required offset percentage to double for green power that is located on
federal or Native American land.
http://www.dsireusa.org/incentives/incentive.cfm?Incentive_Code=US01R
http://www1.eere.energy.gov/femp/technologies/renewable_requirements.html
The 2012 estimated US federal government electricity consumption is around 60 million MWh/year (per
the U.S. Department of Energy, Energy Efficiency and Renewable Energy Division (EERE)); so, 7.5% would
be 4.5 million MWh/year, which is more than enough demand to take the full output of the project in
question. Price-wise, the large, government RFPs generally command the lowest REC prices in the

Iowa Tribe of Oklahoma Wind Study Report 31
market due to their public nature and competition. Two recent such RFPs were run by Western Area
Power Authority and the Defense Logistics Agency (July-October 2012), resulting in REC prices in the
$0.60-$0.65/MWh range for 2012, somewhat higher for 2013-2016 (perhaps a 4-year blended cost of
around $0.75-0.80/MWh). With Native American REC values worth double to this constituency, we
could expect prices in this market just under $1.50/MWh for the near-term. Looking longer-term, the
continuation, cancellation or expansion of this federal EPA Act is highly dependent on politics. It is
conceivable that the program is expanded, creating more demand and higher prices (perhaps up to $5-
8/MWh in out years). It is also conceivable that the program is abandoned altogether by the next
administration. A reasonable 10-year number to put to the EPACT 2005 REC opportunity may be $1.50-
3.00/MWh.
3.8. Adding Value to RECs
3.8.1. Long term REC contracts The strongest likely market for RECs from the Iowa Tribe of Oklahoma project appears to be the
voluntary market. Voluntary RECs are sold either by full calendar year generation or half-year
generation. Half years are sold due to the overlap in generation periods of eligibility under the Green-e
Energy program. Green-e allows retail sales made in a given year to be filled with RECs generated in the
same calendar year, the last six months of the preceding year, or the first three months of the
subsequent year. The most common REC contract is for a spot transaction of RECs that have already
been generated. This gives the generator the ability to offer a firm, rather than a contingent contract,
and the pricing for the RECs of that particular vintage is often relatively established in the market, which
gives both the seller and the buyer confidence that the pricing is appropriate. These contracts are easy
to execute and to settle.
“Long Term” in the voluntary REC market typically means two to three year contracts, and these are
relatively uncommon. Since 2007, voluntary REC prices have dropped significantly. Buyers who made
long term commitments prior to the price dropping have ended up paying for legacy contracts at a
higher price than if they had just bought in the spot market. For this reason, the market place has been
hesitant to engage in long-term REC contracts; however, the current low pricing is starting to entice
more buyers into the marketplace in the form of long-term contracts as the risk of further price drops is
fairly low.
3.8.2. Naming Rights/Value Add Outside of the traditional REC trading model of marketers and utilities aggregating large volumes of
supply from many facilities, examples of partnership or sole off-taker purchasers exist as well. In this
model, a sophisticated buyer with a moderate to large appetite for renewable energy seeks to identify a
project in development which is looking for a long term REC or Power and REC purchase agreement to
help clear the financial hurdles it faces. This buyer assumes that a premium will be associated with such
an agreement, but also anticipates a variety of benefits beyond a traditional REC contract. These
benefits may include naming rights to the facility, communication support from the developer/owner,
increased media coverage, as well as other marketing and branding benefits.
Iowa Tribe of Oklahoma Wind Study Report 32
An example of this type of agreement was facilitated by Renewable Choice Energy in 2008 between the
developer, John Deere Renewables and the US furniture manufacturer Steelcase. This was the first time
that one company made a long-term commitment to purchase all the renewable energy credits and the
associated naming and branding rights from a facility. Since that transaction, several large companies
have been utilizing the same model, including Walmart and Google.
It should be noted that while some good examples of this model exist, from PPA plus RECs to the sole
off-taker REC only model presented here, this is not yet a common contract in the renewables industry.
Firms like Renewable Choice and others are always looking to identify buyers and developers who would
be a good fit for this type of agreement and even the EPA has begun to try to encourage this type of
partnership, but it would be unwise for a project developer to expect that this is a likely scenario at
present.
3.9. Compliance Obligations and Reporting14
As discussed in Section 3.3.2 above, the entity generating the RECs must be registered and in some cases
conduct compliance auditing of the RECs generated. The ongoing REC monitoring, reporting and
compliance obligations are a real project cost that must be accounted for in the long term operating
costs of a facility. Additionally, when the RECs and brown power are unbundled, the facility must now
contract with two different entities for the sale of the power and the RECs. For a facility which is likely
to be project financed, this introduces an additional level of complexity to the valuation because power
purchase agreements are long term, while REC agreements are typically less than 5 years, and so
estimating the forward pricing of those REC contracts after 5 years becomes an uncertainty in the
financial model.
With the value of RECs currently so low, it is difficult to recommend that the RECs be unbundled from
the green power as a separate revenue stream. The additional administrative costs introduced into the
project by the compliance obligations for RECs alone might off-set the bulk of any additional revenue
gained by unbundling. Likely, more purchasers exist for a green energy product and this would also
provide the lowest operating expense structure for the project, which is important based on the existing
project economics.
3.9.1. Key Findings
Table 8: REC Market Findings
Key Findings
1 The prices for both voluntary and compulsory REC purchases are low. Unbundling the power and RECs may not lead to any price premium for the RECS and may lead to additional administrative costs.
14
This section provided by Solas Energy Consulting US Inc.

Iowa Tribe of Oklahoma Wind Study Report 33
2 The Iowa Tribe of Oklahoma’s project presents a unique opportunity for a purchaser who would see additional value in a Native American Branding opportunity; however, a purchaser should be sought who can also take the power.
3 REC sales to US government entities would garner a price premium over the traditional REC market. Research should be conducted on these potential off-takers specifically.
3.10. Financial Model Inputs
After research on the REC pricing and the administrative costs associated with unbundling green tags or
RECs from the green power, it was determined that the best course of action would be to sell a bundled
product. This strategy eliminates additional long-term project operating costs and allows for a larger
pool of potential purchasers who might be interested in both the power and the associated
environmental attributes.
No cases were run in the financial model for an unbundled scenario because the associated cost was
deemed to be higher and the associated revenue was deemed to be lower than with a bundled product.
Iowa Tribe of Oklahoma Wind Study Report 34
4. NEPA, FAA, BIOLOGICAL AND ENVIRONMENTAL STUDIES
4.1. Overview of Scope
In order to determine the feasibility of a wind project at the proposed location, the Iowa Tribe
commissioned environmental consultant Ecology and Environment, Inc. (E&E) to perform a critical issues
analysis (CIA)15. The scope of the CIA was to perform a detailed desktop review of the region to analyze
potential project constraints that need to be factored into the siting and final development plan for the
wind project. This CIA reviewed multiple issues including:
Threatened and endangered species
Bird and Bat Species
Wetlands/Water Resources
Geology/Soils
Historic Sites/Cultural Resources
Public Lands and Land Use
Federal Aviation Administration (FAA) Airport Locations
The CIA also included a permitting matrix outlining required permits or approvals, the responsible agency, the requirements and the expected time frame.
The CIA assumptions initially included a much larger project area than what was ultimately selected.
The reason for this is that initial indications from the project met tower were unfavorable for the
project, and a new area needed to be determined16. The study area for the CIA encompassed over
82,000 acres. The proposed tribal lands available for wind development for this Project were a small
subset of this at approximately 6,400 acres. The Project study area boundary was developed in
conversation between BKJ Solutions and E & E to encompass all potential locations and buffer zones for
development of the proposed wind project. Part of the ultimate project boundary lies outside of the
eastern boundary of the CIA assessment area.
4.1.1. CIA Early Stage Environmental Studies
Following the completion of the CIA, research was conducted by Solas Energy Consulting that more clearly identified tribally owned parcels which then enabled additional site specific field-based environmental and cultural studies to be performed. BKJ commissioned Atwell, LLC for these studies, which included:
Agency Meetings and Consultation
Biological and Cultural Resource Site Reconnaissance
Biological Resources
Archaeological Resources and Historic Structures
15
Hrabe, Ryan “Critical Issues Analysis for the Proposed Iowa Tribe Wind Project, Lincoln and Logan Counties, Oklahoma” Ecology and Environment, Inc. August 31, 2012. 16
Reference discussion on site selection in Section 6.
Iowa Tribe of Oklahoma Wind Study Report 35
Land Use Relative to Existing Easements and Sound Receptors
Constraints Mapping
Permits, Licenses, and Regulatory Approvals Upon completion of the early stage environmental field studies Atwell created an Environmental Work Plan to outline the scope, cost range and timeline of anticipated environmental field studies required to achieve a construction ready project.
4.1.2. Aviation Constraints
BKJ commissioned Aviation Systems (ASI) to evaluate project feasibility from an airspace point of view.
The ASI Study17 reviewed the project against the aviation and airspace criteria set forth in Federal
Aviation regulation (FAR) Part 77 (14 CFR 77) Safe, Efficient Use and Preservation of the Navigable
Airspace, the United States Standard for Terminal Instrument Procedures (TERPS) and FAA Order JO
7400.2J Procedures for Handling Airspace Matters, which are the criteria used by the FAA to evaluate
aeronautical compatibility if or when the project is submitted to the FAA for official regulatory review.
4.1.3. Microwave Beam Path Constraints
Wind turbines can interfere with certain microwave bands, especially sensitive first-responder networks,
and so the location of the proposed project needs to be mapped against regional microwave beam
paths. BKJ commissioned Comsearch to determine potential microwave pathway impacts. See
Comsearch report18 and summary in 4.2.9.
4.2. Detailed Study Results
4.2.1. Summary of CIA Results E&E’s methodology for the analysis focused on obtaining publicly available geographic information
system (GIS) shapefiles from a variety of federal, state, and local agencies. E&E also reviewed literature
and conducted queries of on-line databases to obtain relevant information for analysis. The review was
conducted by a multi-disciplinary team of resource professionals, including wetland scientists, botanists,
avian/bat biologists, and GIS technicians, all of whom have previous wind permitting experience in
Oklahoma.
The most prominent environmental issue identified within the CIA was the potential impact to avian
species. This includes species protected by the Endangered Species Act, Migratory Bird Treaty Act, and
Bald and Golden Eagle Protection Act. Although potential for impacts to avian species exists, no critical
issues were identified that should prevent construction of a wind energy facility within the area
reviewed in the CIA.
17
Allen, Gary M. “Iowa Tribe of Oklahoma Wind Power Project, 12-N-0728.001” Aviation Systems Inc. February 27, 2013 18
Comsearch“Wind Power GeoPlanner Microwave Study” March 8, 2013
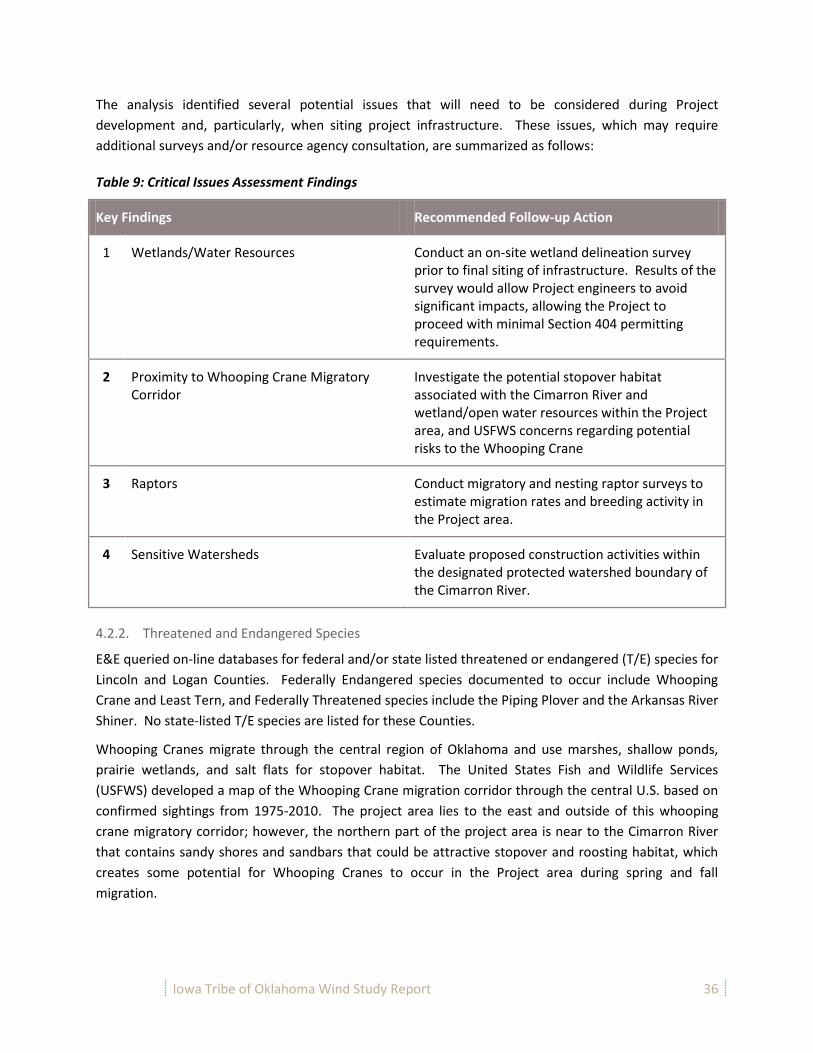
Iowa Tribe of Oklahoma Wind Study Report 36
The analysis identified several potential issues that will need to be considered during Project
development and, particularly, when siting project infrastructure. These issues, which may require
additional surveys and/or resource agency consultation, are summarized as follows:
Table 9: Critical Issues Assessment Findings
Key Findings Recommended Follow-up Action
1 Wetlands/Water Resources Conduct an on-site wetland delineation survey prior to final siting of infrastructure. Results of the survey would allow Project engineers to avoid significant impacts, allowing the Project to proceed with minimal Section 404 permitting requirements.
2 Proximity to Whooping Crane Migratory Corridor
Investigate the potential stopover habitat associated with the Cimarron River and wetland/open water resources within the Project area, and USFWS concerns regarding potential risks to the Whooping Crane
3 Raptors Conduct migratory and nesting raptor surveys to estimate migration rates and breeding activity in the Project area.
4 Sensitive Watersheds Evaluate proposed construction activities within the designated protected watershed boundary of the Cimarron River.
4.2.2. Threatened and Endangered Species
E&E queried on-line databases for federal and/or state listed threatened or endangered (T/E) species for
Lincoln and Logan Counties. Federally Endangered species documented to occur include Whooping
Crane and Least Tern, and Federally Threatened species include the Piping Plover and the Arkansas River
Shiner. No state-listed T/E species are listed for these Counties.
Whooping Cranes migrate through the central region of Oklahoma and use marshes, shallow ponds,
prairie wetlands, and salt flats for stopover habitat. The United States Fish and Wildlife Services
(USFWS) developed a map of the Whooping Crane migration corridor through the central U.S. based on
confirmed sightings from 1975-2010. The project area lies to the east and outside of this whooping
crane migratory corridor; however, the northern part of the project area is near to the Cimarron River
that contains sandy shores and sandbars that could be attractive stopover and roosting habitat, which
creates some potential for Whooping Cranes to occur in the Project area during spring and fall
migration.
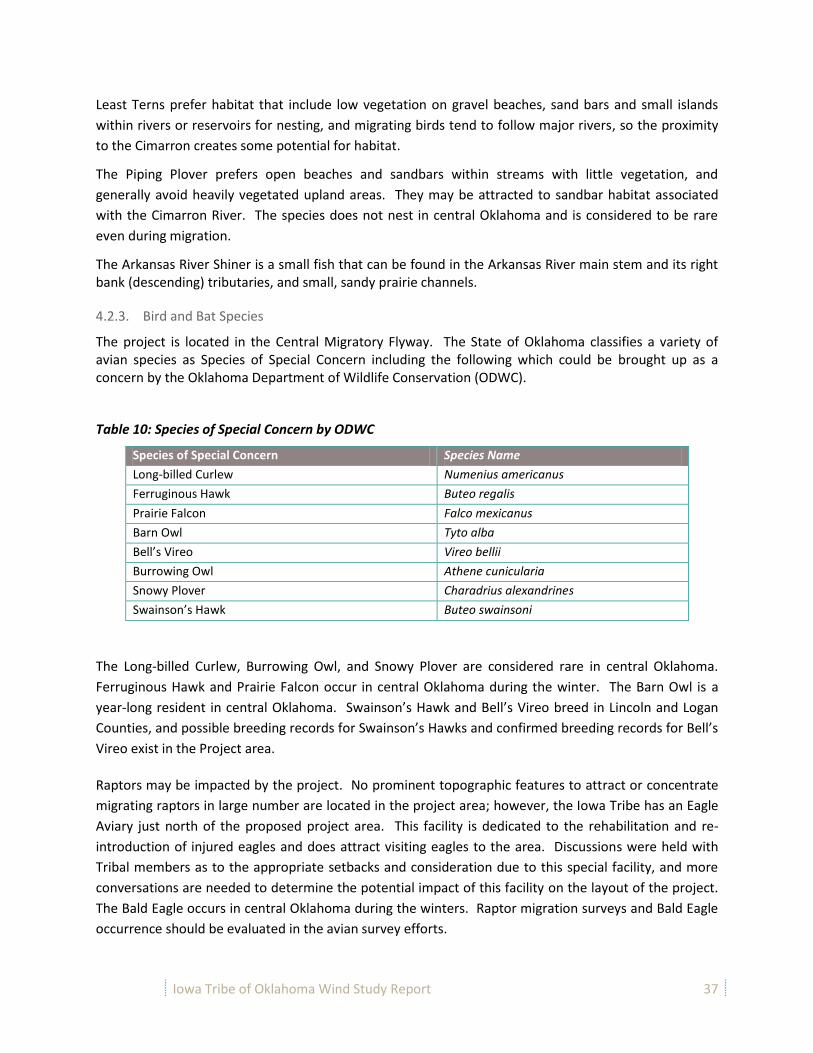
Iowa Tribe of Oklahoma Wind Study Report 37
Least Terns prefer habitat that include low vegetation on gravel beaches, sand bars and small islands
within rivers or reservoirs for nesting, and migrating birds tend to follow major rivers, so the proximity
to the Cimarron creates some potential for habitat.
The Piping Plover prefers open beaches and sandbars within streams with little vegetation, and
generally avoid heavily vegetated upland areas. They may be attracted to sandbar habitat associated
with the Cimarron River. The species does not nest in central Oklahoma and is considered to be rare
even during migration.
The Arkansas River Shiner is a small fish that can be found in the Arkansas River main stem and its right bank (descending) tributaries, and small, sandy prairie channels.
4.2.3. Bird and Bat Species
The project is located in the Central Migratory Flyway. The State of Oklahoma classifies a variety of avian species as Species of Special Concern including the following which could be brought up as a concern by the Oklahoma Department of Wildlife Conservation (ODWC).
Table 10: Species of Special Concern by ODWC
Species of Special Concern Species Name
Long-billed Curlew Numenius americanus
Ferruginous Hawk Buteo regalis
Prairie Falcon Falco mexicanus
Barn Owl Tyto alba
Bell’s Vireo Vireo bellii
Burrowing Owl Athene cunicularia
Snowy Plover Charadrius alexandrines
Swainson’s Hawk Buteo swainsoni
The Long-billed Curlew, Burrowing Owl, and Snowy Plover are considered rare in central Oklahoma.
Ferruginous Hawk and Prairie Falcon occur in central Oklahoma during the winter. The Barn Owl is a
year-long resident in central Oklahoma. Swainson’s Hawk and Bell’s Vireo breed in Lincoln and Logan
Counties, and possible breeding records for Swainson’s Hawks and confirmed breeding records for Bell’s
Vireo exist in the Project area.
Raptors may be impacted by the project. No prominent topographic features to attract or concentrate
migrating raptors in large number are located in the project area; however, the Iowa Tribe has an Eagle
Aviary just north of the proposed project area. This facility is dedicated to the rehabilitation and re-
introduction of injured eagles and does attract visiting eagles to the area. Discussions were held with
Tribal members as to the appropriate setbacks and consideration due to this special facility, and more
conversations are needed to determine the potential impact of this facility on the layout of the project.
The Bald Eagle occurs in central Oklahoma during the winters. Raptor migration surveys and Bald Eagle
occurrence should be evaluated in the avian survey efforts.
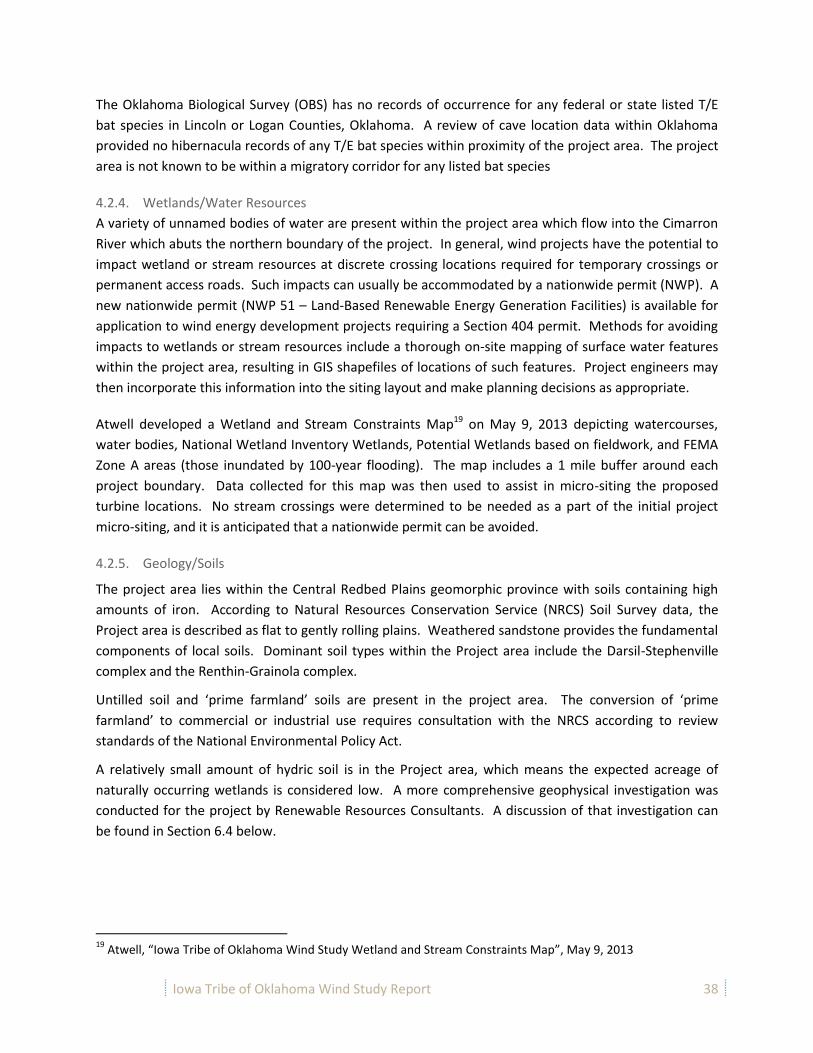
Iowa Tribe of Oklahoma Wind Study Report 38
The Oklahoma Biological Survey (OBS) has no records of occurrence for any federal or state listed T/E
bat species in Lincoln or Logan Counties, Oklahoma. A review of cave location data within Oklahoma
provided no hibernacula records of any T/E bat species within proximity of the project area. The project
area is not known to be within a migratory corridor for any listed bat species
4.2.4. Wetlands/Water Resources
A variety of unnamed bodies of water are present within the project area which flow into the Cimarron
River which abuts the northern boundary of the project. In general, wind projects have the potential to
impact wetland or stream resources at discrete crossing locations required for temporary crossings or
permanent access roads. Such impacts can usually be accommodated by a nationwide permit (NWP). A
new nationwide permit (NWP 51 – Land-Based Renewable Energy Generation Facilities) is available for
application to wind energy development projects requiring a Section 404 permit. Methods for avoiding
impacts to wetlands or stream resources include a thorough on-site mapping of surface water features
within the project area, resulting in GIS shapefiles of locations of such features. Project engineers may
then incorporate this information into the siting layout and make planning decisions as appropriate.
Atwell developed a Wetland and Stream Constraints Map19 on May 9, 2013 depicting watercourses,
water bodies, National Wetland Inventory Wetlands, Potential Wetlands based on fieldwork, and FEMA
Zone A areas (those inundated by 100-year flooding). The map includes a 1 mile buffer around each
project boundary. Data collected for this map was then used to assist in micro-siting the proposed
turbine locations. No stream crossings were determined to be needed as a part of the initial project
micro-siting, and it is anticipated that a nationwide permit can be avoided.
4.2.5. Geology/Soils
The project area lies within the Central Redbed Plains geomorphic province with soils containing high
amounts of iron. According to Natural Resources Conservation Service (NRCS) Soil Survey data, the
Project area is described as flat to gently rolling plains. Weathered sandstone provides the fundamental
components of local soils. Dominant soil types within the Project area include the Darsil-Stephenville
complex and the Renthin-Grainola complex.
Untilled soil and ‘prime farmland’ soils are present in the project area. The conversion of ‘prime
farmland’ to commercial or industrial use requires consultation with the NRCS according to review
standards of the National Environmental Policy Act.
A relatively small amount of hydric soil is in the Project area, which means the expected acreage of
naturally occurring wetlands is considered low. A more comprehensive geophysical investigation was
conducted for the project by Renewable Resources Consultants. A discussion of that investigation can
be found in Section 6.4 below.
19
Atwell, “Iowa Tribe of Oklahoma Wind Study Wetland and Stream Constraints Map”, May 9, 2013
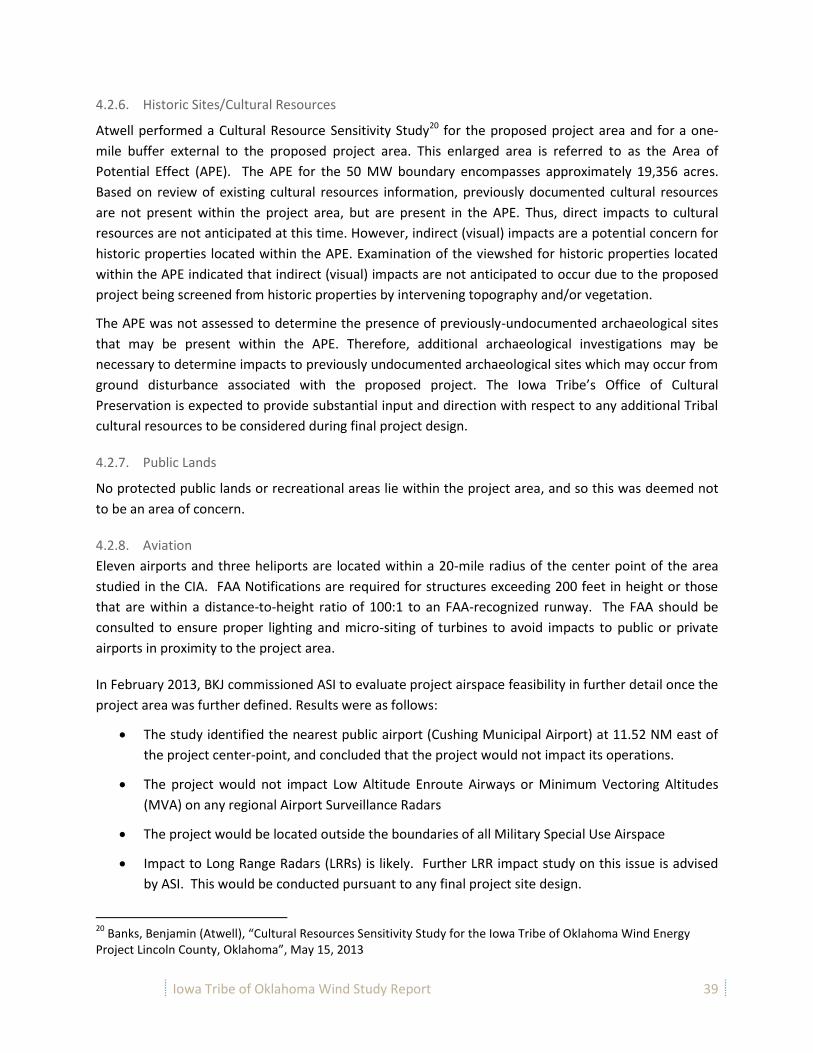
Iowa Tribe of Oklahoma Wind Study Report 39
4.2.6. Historic Sites/Cultural Resources
Atwell performed a Cultural Resource Sensitivity Study20 for the proposed project area and for a one-
mile buffer external to the proposed project area. This enlarged area is referred to as the Area of
Potential Effect (APE). The APE for the 50 MW boundary encompasses approximately 19,356 acres.
Based on review of existing cultural resources information, previously documented cultural resources
are not present within the project area, but are present in the APE. Thus, direct impacts to cultural
resources are not anticipated at this time. However, indirect (visual) impacts are a potential concern for
historic properties located within the APE. Examination of the viewshed for historic properties located
within the APE indicated that indirect (visual) impacts are not anticipated to occur due to the proposed
project being screened from historic properties by intervening topography and/or vegetation.
The APE was not assessed to determine the presence of previously-undocumented archaeological sites
that may be present within the APE. Therefore, additional archaeological investigations may be
necessary to determine impacts to previously undocumented archaeological sites which may occur from
ground disturbance associated with the proposed project. The Iowa Tribe’s Office of Cultural
Preservation is expected to provide substantial input and direction with respect to any additional Tribal
cultural resources to be considered during final project design.
4.2.7. Public Lands
No protected public lands or recreational areas lie within the project area, and so this was deemed not
to be an area of concern.
4.2.8. Aviation
Eleven airports and three heliports are located within a 20-mile radius of the center point of the area
studied in the CIA. FAA Notifications are required for structures exceeding 200 feet in height or those
that are within a distance-to-height ratio of 100:1 to an FAA-recognized runway. The FAA should be
consulted to ensure proper lighting and micro-siting of turbines to avoid impacts to public or private
airports in proximity to the project area.
In February 2013, BKJ commissioned ASI to evaluate project airspace feasibility in further detail once the
project area was further defined. Results were as follows:
The study identified the nearest public airport (Cushing Municipal Airport) at 11.52 NM east of
the project center-point, and concluded that the project would not impact its operations.
The project would not impact Low Altitude Enroute Airways or Minimum Vectoring Altitudes
(MVA) on any regional Airport Surveillance Radars
The project would be located outside the boundaries of all Military Special Use Airspace
Impact to Long Range Radars (LRRs) is likely. Further LRR impact study on this issue is advised
by ASI. This would be conducted pursuant to any final project site design.
20
Banks, Benjamin (Atwell), “Cultural Resources Sensitivity Study for the Iowa Tribe of Oklahoma Wind Energy Project Lincoln County, Oklahoma”, May 15, 2013

Iowa Tribe of Oklahoma Wind Study Report 40
Minimal to no impact is expected to NEXRAD weather radar operations.
The project area does not exceed the permit requirements of the Oklahoma Aircraft Pilot and
Passenger Protection Act
If a turbine were to exceed 600 feet, then it could impact the approach airspace associated with
the Stillwater Regional Airport. Also any structures over 499 feet would initially be considered a
presumed Hazard and a possible VFR Flyway (HW 177) would have to be evaluated as part of a
State permit requirement.
ASI recommends refreshing this study prior to filing for a formal FAA determination due to common
policy and procedural revisions that could render the study’s conclusion obsolete.
4.2.9. Microwave Beam Path Constraints
The Comsearch report21 commissioned by BKJ identifies a single microwave path bisecting the
northeastern corner of the project area (figure 1). This pathway, known as a Freznel Zone was
calculated and mapped, and GIS shapefiles were provided to BKJ. The Freznel Zone shapefiles were
subsequently loaded into the project constraints map to ensure that the area was avoided in layout
design. A site visit conducted by Solas Energy Consulting in May 2013 identified an additional potential
beam path, which is utilized by the Tribe for their first responder activities. This path was identified too
late within the study time period to provide the information to Comsearch to re-do their analysis;
however, it should be noted that the potential impact of this beam path is considered minor to the
project. It is likely that the only potential impact to the project would be careful planning and siting of
wind turbines to prevent interference with the existing tower.
21
Comsearch“Wind Power GeoPlanner Microwave Study” March 8, 2013
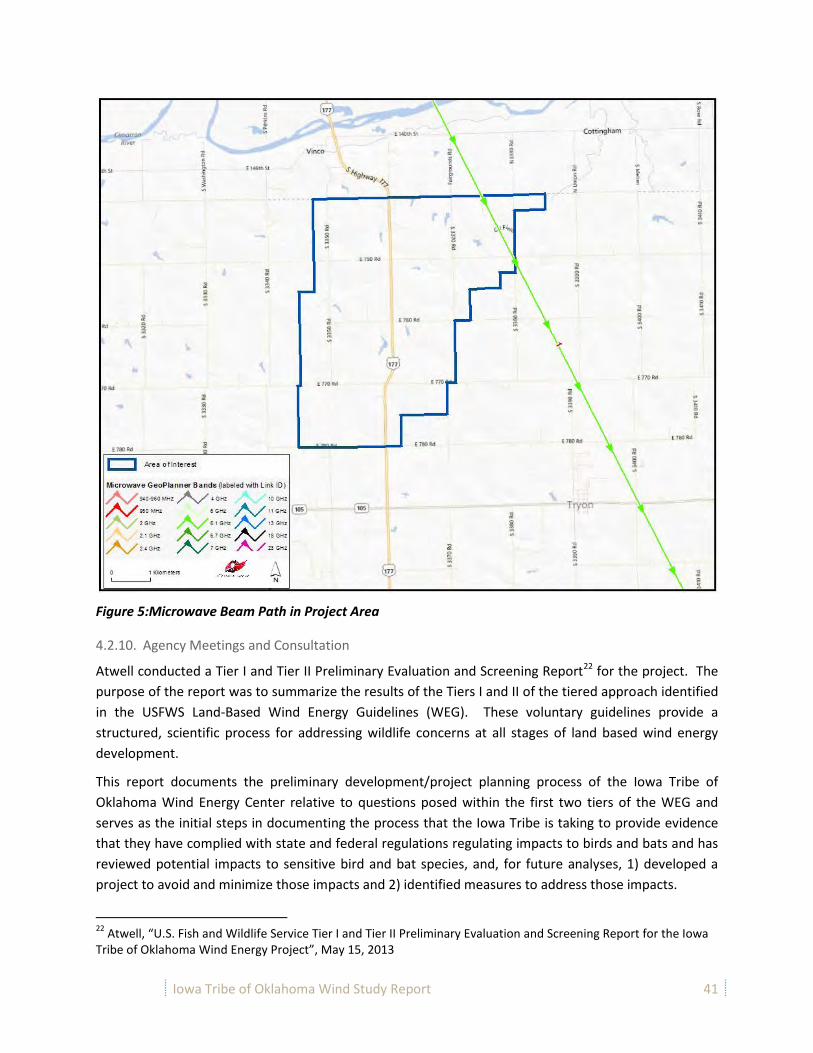
Iowa Tribe of Oklahoma Wind Study Report 41
Figure 5:Microwave Beam Path in Project Area
4.2.10. Agency Meetings and Consultation
Atwell conducted a Tier I and Tier II Preliminary Evaluation and Screening Report22 for the project. The
purpose of the report was to summarize the results of the Tiers I and II of the tiered approach identified
in the USFWS Land-Based Wind Energy Guidelines (WEG). These voluntary guidelines provide a
structured, scientific process for addressing wildlife concerns at all stages of land based wind energy
development.
This report documents the preliminary development/project planning process of the Iowa Tribe of
Oklahoma Wind Energy Center relative to questions posed within the first two tiers of the WEG and
serves as the initial steps in documenting the process that the Iowa Tribe is taking to provide evidence
that they have complied with state and federal regulations regulating impacts to birds and bats and has
reviewed potential impacts to sensitive bird and bat species, and, for future analyses, 1) developed a
project to avoid and minimize those impacts and 2) identified measures to address those impacts.
22
Atwell, “U.S. Fish and Wildlife Service Tier I and Tier II Preliminary Evaluation and Screening Report for the Iowa Tribe of Oklahoma Wind Energy Project”, May 15, 2013
Iowa Tribe of Oklahoma Wind Study Report 42
Specifically, Tier I of the WEG is a preliminary site evaluation on a broad geographical scale to
understand which species of concern may be present, what critical habitat might exist, and whether
areas of wildlife concentration are present. Tier II consists of the same review but on a project-level
scale. The project site is more specifically evaluated relative to the potential for sensitive species to
occupy the site and potential impacts to those species are assessed.
At the conclusion of each tiered analysis, a series of decision points are evaluated prior to moving to the
next tier. Decisions are based on the information obtained from adequately answering the questions in
each tier. Part of the decision process for each tier is an evaluation of risk; estimates of risk will typically
be qualitative, but are often based on quantitative information. No adverse responses were presented
to any of the Tier I or II questions.
In addition the tiered USFWS study, letters requesting preliminary face to face meetings with the Bureau
of Indian Affairs (BIA)23, Oklahoma Archaeological Survey (OAS)24, Oklahoma Department of Wildlife
Conservation (ODWC)25, State Historic Preservation Office (SHPO)26 and U.S. Fish and Wildlife Service27
to present the project and discuss potential concerns were drafted by Atwell. However, at the direction
of the Tribe, these letters would not be formally sent until more formal decisions on the project status
were made.
4.2.11. Habitat Assessment
Atwell performed a Habitat Assessment28 on May 10, 2013 that involved background wetlands,
topographic, flood, land use, land cover, critical habitat, and threatened and endangered species
research, combined with a windshield site reconnaissance and the generation of a habitat map29 for the
project area.
According to their assessment the project area contains relatively intact riparian and wooded areas
when compared to the surrounding region. However these habitats do not constituted optimal habitat
for the protected species - least tern, piping plover or whooping crane. These species may pass within
or adjacent to the study area as part of migration events, however their presence is unlikely due to the
limited wetland and other aquatic habitats located within the study area. The potential presence of
least terns on the nearby Cimarron River may pose a potential, albeit low, risk due to their documented
presence along the riverine corridor; however, documented occurrences in this location are rare and
would be associated with the preferable riverine habitat of the Cimarron River. Therefore, it is unlikely
that the proposed project will have an increased adverse impact of the least tern, piping plover, or
whooping crane.
23
Haas, Chris (Atwell), “BIA Agency Meeting Request Letter”, May 1, 2013 24
Haas, Chris (Atwell), “OAS Agency Meeting Request Letter”, May 1, 2013 25
Hass, Chris (Atwell), “ODWD Agency Meeting Request Letter”, May 1, 2013 26
Hass, Chris (Atwell), “SHPO Agency Meeting Request Letter”, May 1, 2013 27
Haas, Chris (Atwell) “USFWS Agency Meeting Request Letter”, May 1, 2013. 28
Haas, Chris (Atwell) “Habitat Assessment for the Iowa Tribe of Oklahoma Wind Energy Project”, May 10, 2013. 29
Atwell, “Iowa Tribe of Oklahoma Wind Study Habitat Map” May 9, 2013
Iowa Tribe of Oklahoma Wind Study Report 43
Suitable habitat for the Texas horned lizard is available and their preferred prey item, harvester ant
mounds, was observed in the project area. Additional coordination with the ODWC may be
recommended to reduce potential adverse impacts to this species. Also, the use of BMPs during
construction and operations is recommended to further reduce potential concerns for the above
mentioned species.
4.2.12. Sound Receptor Analysis
Atwell performed a Sound Receptor Analysis30 covering the larger 50 MW project boundary including a
one mile buffer surrounding the project area which covered approximately 19,356 acres. GIS and aerial
photography was used to identify potential receptors, which were verified in the field to the extent
practicable based on public access points.
A total of 625 potential sound receptors (a sound receptor is a residence or structure that may be
occupied) were identified within the study area through desktop and field observations. Of the
receptors, the majority were assessed to be barns (381) and residences (233), with limited industrial (8)
and municipal (3) receptors also present. A total of 392 receptors were assessed to be vacant. Of the
vacant receptors, the majority (381) consisted of barns, and the remaining 11 vacant receptors consisted
of 10 residential receptors and 1 industrial receptor. The remaining 233 receptors were assessed to be
occupied and consisted of 223 residential, 7 industrial, and 3 municipal receptors.
Identified potential sound receptors were generally scattered across the study area with some areas of
somewhat concentrated occurrences of sound receptors, such as in the vicinity of the Iowa Tribe of
Oklahoma Headquarters and in the vicinity of the community of Vinco in the northwestern portion of
the study area. A table31 detailing the identified receptors and associated maps is contained in the
referenced document. On the enclosed maps32, receptors assessed to be vacant are not labeled with a
receptor ID.
In addition to identifying potential sound receptors within the study area, state and local regulations
were reviewed to assess potential noise and sound regulations that may be applicable to the proposed
project. State of Oklahoma regulations were reviewed, and state level ordinances and/or regulations
were not identified that would directly govern noise associated with wind energy facilities. Similarly,
officials from Lincoln County indicated that the County does not currently have noise regulations.
Nevertheless, although specific regulations or ordinances governing noise levels for the proposed facility
were not identified, it is recommended that the proposed project adopt best management practices
relative to reducing impacts resulting from noise (e.g. setbacks from residences and other sensitive
noise receptors).
Based on historical research, levels beyond 50 decibels at a property/boundary line (depending on
average wind speed) appear to be a common threshold for evaluating noise emissions from wind
facilities; with levels above this threshold requiring additional micro-siting efforts to minimize impacts to
sensitive receptors, or mitigation efforts than can assist in reducing potential impacts to surrounding
30
Haas, Chris (Atwell) “Sound Receptor Analysis Report”, May 10, 2013 31
Haas, Chris (Atwell) “Sound Receptor Analysis Table”, May 10, 2013 32
Atwell, “Sound Receptor Analysis Map”, May 10, 2013
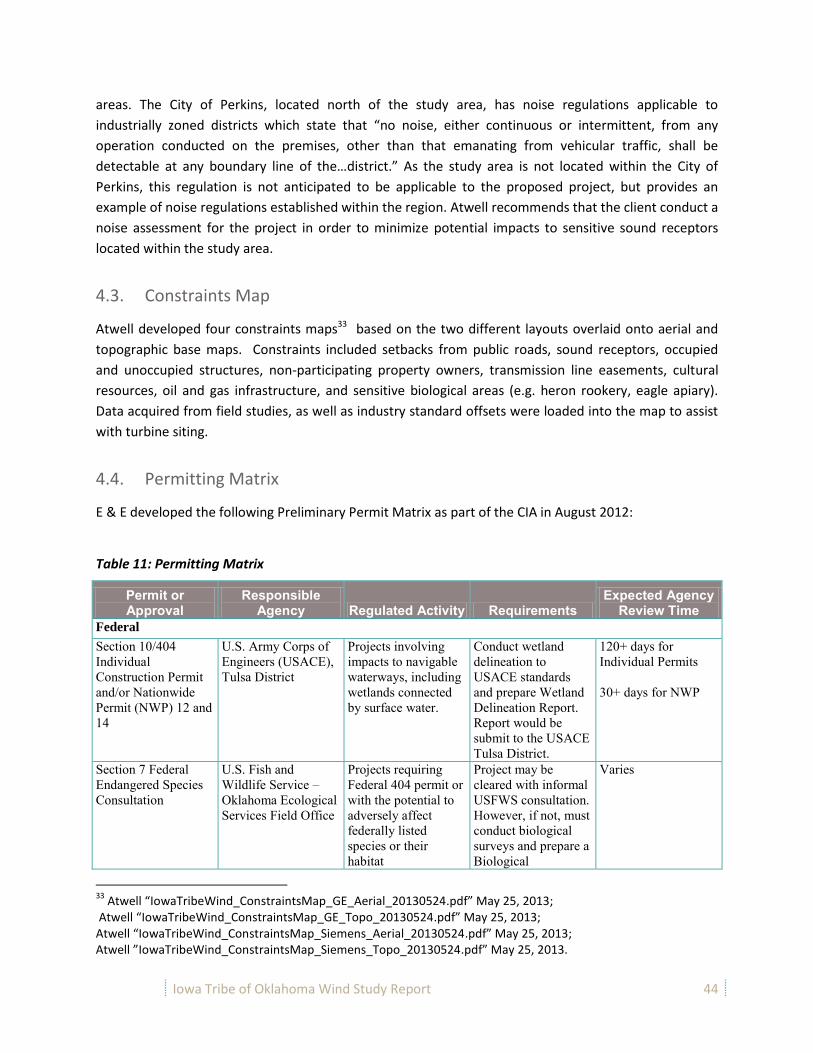
Iowa Tribe of Oklahoma Wind Study Report 44
areas. The City of Perkins, located north of the study area, has noise regulations applicable to
industrially zoned districts which state that “no noise, either continuous or intermittent, from any
operation conducted on the premises, other than that emanating from vehicular traffic, shall be
detectable at any boundary line of the…district.” As the study area is not located within the City of
Perkins, this regulation is not anticipated to be applicable to the proposed project, but provides an
example of noise regulations established within the region. Atwell recommends that the client conduct a
noise assessment for the project in order to minimize potential impacts to sensitive sound receptors
located within the study area.
4.3. Constraints Map
Atwell developed four constraints maps33 based on the two different layouts overlaid onto aerial and
topographic base maps. Constraints included setbacks from public roads, sound receptors, occupied
and unoccupied structures, non-participating property owners, transmission line easements, cultural
resources, oil and gas infrastructure, and sensitive biological areas (e.g. heron rookery, eagle apiary).
Data acquired from field studies, as well as industry standard offsets were loaded into the map to assist
with turbine siting.
4.4. Permitting Matrix
E & E developed the following Preliminary Permit Matrix as part of the CIA in August 2012:
Table 11: Permitting Matrix
Permit or Approval
Responsible Agency Regulated Activity Requirements
Expected Agency Review Time
Federal
Section 10/404 Individual Construction Permit and/or Nationwide Permit (NWP) 12 and 14
U.S. Army Corps of Engineers (USACE), Tulsa District
Projects involving impacts to navigable waterways, including wetlands connected by surface water.
Conduct wetland delineation to USACE standards and prepare Wetland Delineation Report. Report would be submit to the USACE Tulsa District.
120+ days for Individual Permits 30+ days for NWP
Section 7 Federal Endangered Species Consultation
U.S. Fish and Wildlife Service – Oklahoma Ecological Services Field Office
Projects requiring Federal 404 permit or with the potential to adversely affect federally listed species or their habitat
Project may be cleared with informal USFWS consultation. However, if not, must conduct biological surveys and prepare a Biological
Varies
33
Atwell “IowaTribeWind_ConstraintsMap_GE_Aerial_20130524.pdf” May 25, 2013; Atwell “IowaTribeWind_ConstraintsMap_GE_Topo_20130524.pdf” May 25, 2013; Atwell “IowaTribeWind_ConstraintsMap_Siemens_Aerial_20130524.pdf” May 25, 2013; Atwell ”IowaTribeWind_ConstraintsMap_Siemens_Topo_20130524.pdf” May 25, 2013.
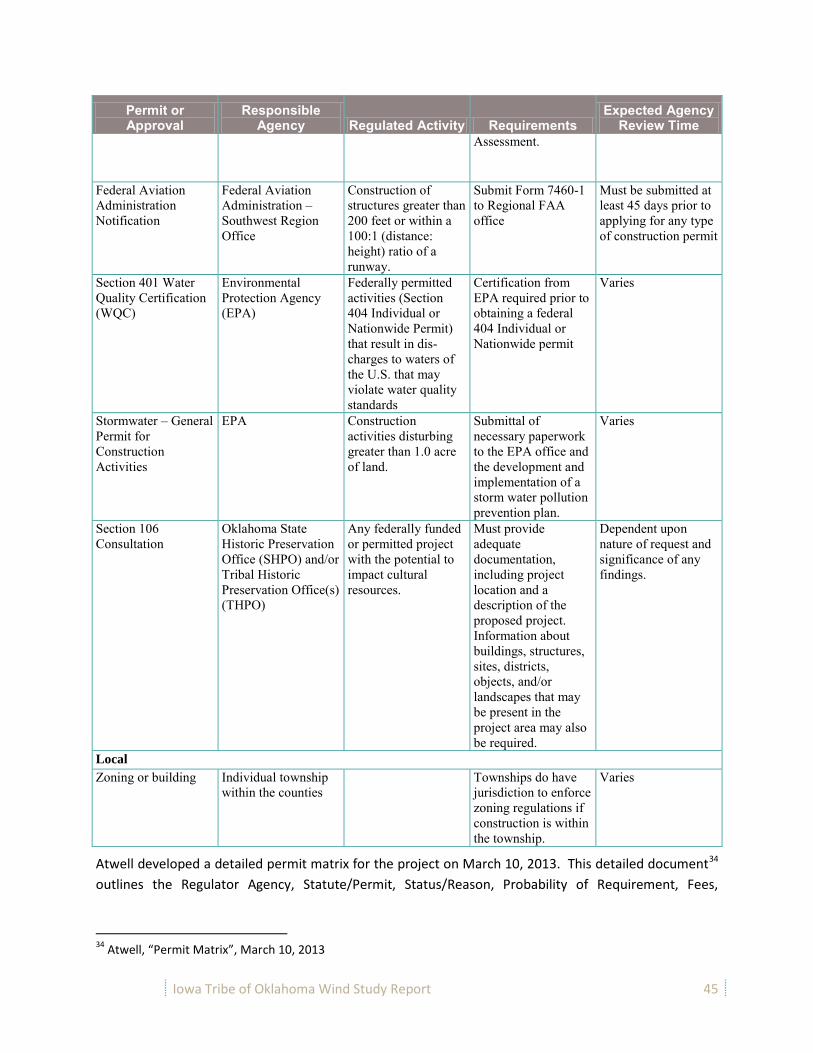
Iowa Tribe of Oklahoma Wind Study Report 45
Permit or Approval
Responsible Agency Regulated Activity Requirements
Expected Agency Review Time
Assessment.
Federal Aviation Administration Notification
Federal Aviation Administration – Southwest Region Office
Construction of structures greater than 200 feet or within a 100:1 (distance: height) ratio of a runway.
Submit Form 7460-1 to Regional FAA office
Must be submitted at least 45 days prior to applying for any type of construction permit
Section 401 Water Quality Certification (WQC)
Environmental Protection Agency (EPA)
Federally permitted activities (Section 404 Individual or Nationwide Permit) that result in dis-charges to waters of the U.S. that may violate water quality standards
Certification from EPA required prior to obtaining a federal 404 Individual or Nationwide permit
Varies
Stormwater – General Permit for Construction Activities
EPA Construction activities disturbing greater than 1.0 acre of land.
Submittal of necessary paperwork to the EPA office and the development and implementation of a storm water pollution prevention plan.
Varies
Section 106 Consultation
Oklahoma State Historic Preservation Office (SHPO) and/or Tribal Historic Preservation Office(s) (THPO)
Any federally funded or permitted project with the potential to impact cultural resources.
Must provide adequate documentation, including project location and a description of the proposed project. Information about buildings, structures, sites, districts, objects, and/or landscapes that may be present in the project area may also be required.
Dependent upon nature of request and significance of any findings.
Local
Zoning or building Individual township within the counties
Townships do have jurisdiction to enforce zoning regulations if construction is within the township.
Varies
Atwell developed a detailed permit matrix for the project on March 10, 2013. This detailed document34
outlines the Regulator Agency, Statute/Permit, Status/Reason, Probability of Requirement, Fees,
34
Atwell, “Permit Matrix”, March 10, 2013

Iowa Tribe of Oklahoma Wind Study Report 46
Application Review Timeframe, Public Process and Additional information. Key Requirement drawn
from both the E&E and Atwell matrices are summarized in Table 12: Key Permitting Requirements.
4.4.1. Key Findings
Table 12: Key Permitting Requirements
Critical Permits or Compliance Items
1 National Environmental Policy Act (NEPA)
2 Endangered Species Act (USFWS Section 7 Consultation)
3 ASTM Phase I ESA
4 Determination of No Hazard to Air Navigation
5 Aeronautical Study
6 Oklahoma Wind Energy Development Act
7 Threatened and Endangered Species Consultation Review
8 National Historic Preservation Act (Sec 106 Review Consultation)
4.4.2. Oklahoma Wind Energy and Mineral Rights
The constraints map identifies numerous oil and gas wells and related infrastructure within the project
area. Understanding how the Mineral Rights holders interact with the project as it is sited and
developed is crucial for a successful project. Doerner, Saunders, Daniel & Anderson, L.L.P provided a
legal memorandum35 giving an overview of the Oklahoma Wind Energy Development Act, The
Exploration Rights Act of 2011, and Pertinent Case Law as they related to the impacts that mineral rights
holders can have on wind energy development.
Summary of Oklahoma Wind Energy Development Act (The “Act”)
The legislature acknowledges that wind energy resources and their promotion are important to the
economic growth the Oklahoma, and further recognizes the need to reconcile the relative rights of
mineral interest owners and parties leasing land to wind energy developers, specifically with regard to
decommissioning of wind energy sites and hazards that may be associated with such sites.
The Act addressed decommissioning of wind energy facilities and provides a procedure and practices for
removing and remediating the land where such facilities are located upon abandonment or the end of
their useful life.
The Act requires the owner file a financial evidence of security with the Oklahoma Corporation
Commission in the form of a surety bond, collateral bond, parent guaranty or letter of credit following
the fifteenth year of operation. The owner shall provide the estimate of cost of decommissioning upon
which the financial security shall be determined.
The Act also requires the owner or operator of the facility to describe how any compensation made
relative the amount of energy produced is determined. Any landowner with lease payment based on
energy produced shall have the right to inspect the records of owner or operator for the past 24
35
Anderson, Matthew, “Oklahoma Statutes and Case Law Relating to Wind Energy Development”, Doerner, Saunders, Daniel & Anderson, L.L.P, May 22, 2013.

Iowa Tribe of Oklahoma Wind Study Report 47
months. Each year the owner or operator shall report to the Commission the power generated from
the facility.
Owners and operators must also carry insurance customarily acceptable in the industry naming the
landowner an additional insured, and must provide the landowner the certificate and at least a 30 day
notice of any material modification, cancellation or termination of the insurance.
Summary of the Exploration Rights Act of 2011 (The “ERA”)
Under Oklahoma law the surface estate is servient to the dominant mineral estate. The ERA provides
that “the lessee of a wind or solar energy agreement or the wind energy developer shall not
unreasonably interfere with the mineral owner’s right to make reasonable use of the surface estate,
including the right of ingress and egress therefor, for the purpose of exploring, severing, capturing and
producing the minerals.” The ERA also states ““[i]t is the intent of this act to confirm the mineral
owner’s historical right to make reasonable use of the surface estate, including the right of ingress and
egress therefor, for the purpose of exploring, severing, capturing and producing the minerals, and
nothing in this act is intended to expand or diminish those historical rights. Further, nothing in this act
shall amend or modify the surface damages statutes or be interpreted to grant, expand or diminish any
person’s rights therein”
Notwithstanding the fact that the mineral estate is dominant to the surface estate, the mineral owner
must limit its use of the surface to what is reasonably necessary for the operation and development of
the mineral lease. Furthermore, the mineral interest holder’s use of the surface “must be exercised with
due regard to the right of the owner of the surface.”
The ERA also details a 30 day notice requirement required for the developer prior to the beginning
construction.
Pertinent Case Law
In a recent case, the United States District Court for the Northern District of Oklahoma addressed the
application of the ERA relative to the rights of a mineral interest holder and the holder of a lease for
wind energy purposes in an unreported decision, Osage Nation v. Wind Capital Group, LLC, 2011 WL
6371384. The Court found that the use of the surface by the wind energy developer did not
unreasonably interfere with the mineral interest owner’s rights to explore, capture or produce oil and
gas. See Osage Nation, at 9.
The Court cited an Oklahoma Supreme Court Case wherein the mineral interest owner had sought to
force a party with surface rights to buy out its lease. See Gulf Pipeline Co. v. Pawnee Tulsa Petroleum
Co., 127 P. 252 (Okla. 1912). The surface rights holder refused to buy out the mineral interest owner’s
rights at the exorbitant amount demanded and preceded to construct improvements on the land. The
mineral interest holder responded by beginning to drill a well dangerously near the surface owner’s
improvements. The surface owner sought and ultimately obtained a permanent injunction restricting
the mineral interest holder from placing its well near the improvements. The court found that there
were other locations where the well could be drilled within the area comprising the mineral interest
owner’s property. The court reasoned as follows:

Iowa Tribe of Oklahoma Wind Study Report 48
Having the right to drill anywhere, and the right to occupy the surface not
being conveyed to them, but reserved to the owners, it follows that they must
exercise their right to drill with due regard to the rights of the owners of the
surface, and that where they can fully enjoy their own rights without injury to
others they should not be allowed out of the spirit of wantonness or of
blackmail, to jeopardize the property and the lives of others exercising an equal
right. See Gulf Pipeline Co., 127 P. at 253-54.
Thus, the mineral interest owner’s rights to use the surface are limited in nature, limited to what is
reasonably necessary to access the minerals. See Liverly v. Tidewater Petroleum Co., 139 P.3d 897, 903
(Okla. 2006).
4.4.3. Construction Permitting36
No statewide construction permit requirements exist other than the stormwater and zero-emission
facility permits from the Oklahoma Department of Environmental Quality as discussed above. The
Department of Environmental Quality handles storm water drainage permits for areas that disturb
more than one acre cumulative. Jennifer Wright at the Oklahoma Department of Environmental
Quality (405.702.1077) is the contact to help with stormwater/sewage permitting. The website for
the DEQ is www.deq.state.ok.us.
Frequently transportation permits are required to bring in the heavy equipment, including turbines,
substation transformers, and other over-sized loads. The Oklahoma Department of Public Safety
(http://www.dps.state.ok.us/swp) is the entity that handles transportation permits. Typically, the
responsibility for transportation of the components to the site is done by the manufacturers of the
turbines and components; thus, these permits would be the responsibility of the manufacturers.
The cost for the permitting would be considered in the turbine and/or transformer pricing.
Wind energy siting and permitting requirements vary in Oklahoma from county to county, and local
building codes and ordinances may also apply.
4.4.4. Logan and Lincoln Counties – Construction Permitting
In Logan and Lincoln counties, after conversations with local officials, it appears that no restrictions
to construction are enforced, unless the project falls within city limits, then it must follow the town
enforcement codes. The Chamber of Commerce asks the developer to work with local officials to
ensure they remain aware of all activities. The contact information for the Lincoln County Clerk’s
Office is (405)258-0080, and the commissioners are Don Sporleder (chairman), Ricky Taylor and Lee
Doolen. The contact information for the Logan County Clerk’s office is (405)282-0267, and the
commissioners are Mark Sharpton, Michael Pearson and Monty Piearcy.
36
This section provided by Solas Energy Consulting US Inc.
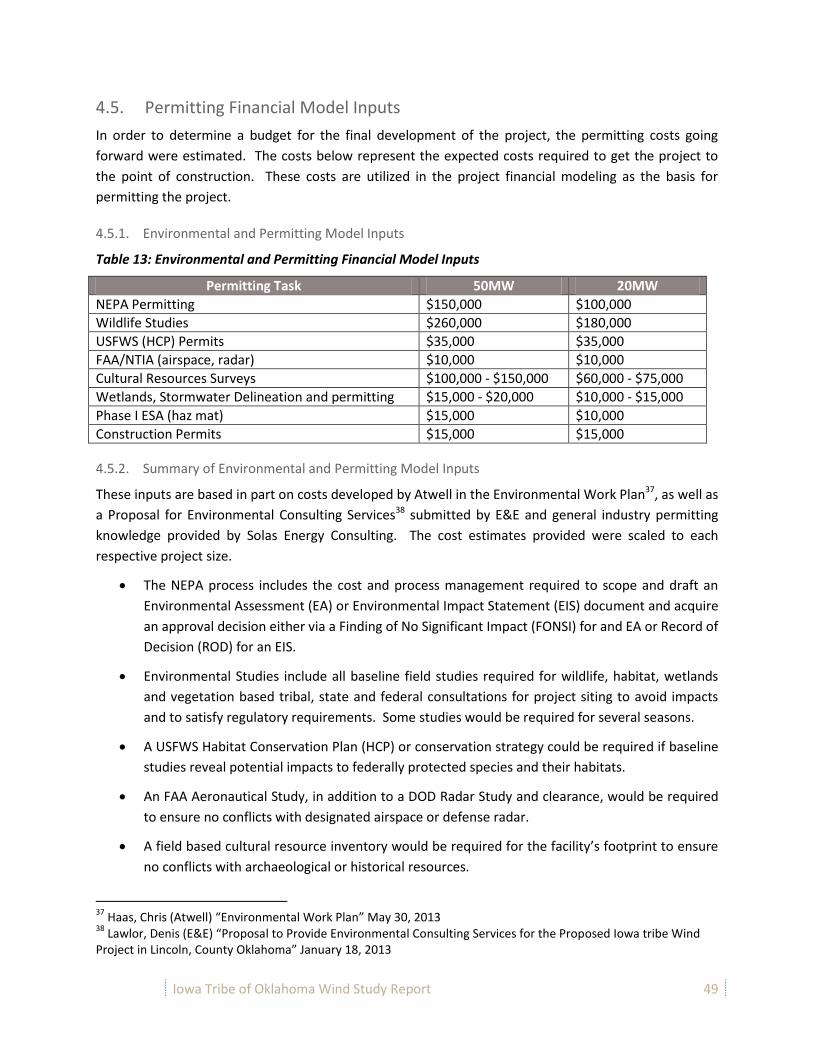
Iowa Tribe of Oklahoma Wind Study Report 49
4.5. Permitting Financial Model Inputs
In order to determine a budget for the final development of the project, the permitting costs going
forward were estimated. The costs below represent the expected costs required to get the project to
the point of construction. These costs are utilized in the project financial modeling as the basis for
permitting the project.
4.5.1. Environmental and Permitting Model Inputs
Table 13: Environmental and Permitting Financial Model Inputs
Permitting Task 50MW 20MW
NEPA Permitting $150,000 $100,000
Wildlife Studies $260,000 $180,000
USFWS (HCP) Permits $35,000 $35,000
FAA/NTIA (airspace, radar) $10,000 $10,000
Cultural Resources Surveys $100,000 - $150,000 $60,000 - $75,000
Wetlands, Stormwater Delineation and permitting $15,000 - $20,000 $10,000 - $15,000
Phase I ESA (haz mat) $15,000 $10,000
Construction Permits $15,000 $15,000
4.5.2. Summary of Environmental and Permitting Model Inputs
These inputs are based in part on costs developed by Atwell in the Environmental Work Plan37, as well as
a Proposal for Environmental Consulting Services38 submitted by E&E and general industry permitting
knowledge provided by Solas Energy Consulting. The cost estimates provided were scaled to each
respective project size.
The NEPA process includes the cost and process management required to scope and draft an
Environmental Assessment (EA) or Environmental Impact Statement (EIS) document and acquire
an approval decision either via a Finding of No Significant Impact (FONSI) for and EA or Record of
Decision (ROD) for an EIS.
Environmental Studies include all baseline field studies required for wildlife, habitat, wetlands
and vegetation based tribal, state and federal consultations for project siting to avoid impacts
and to satisfy regulatory requirements. Some studies would be required for several seasons.
A USFWS Habitat Conservation Plan (HCP) or conservation strategy could be required if baseline
studies reveal potential impacts to federally protected species and their habitats.
An FAA Aeronautical Study, in addition to a DOD Radar Study and clearance, would be required
to ensure no conflicts with designated airspace or defense radar.
A field based cultural resource inventory would be required for the facility’s footprint to ensure
no conflicts with archaeological or historical resources.
37
Haas, Chris (Atwell) “Environmental Work Plan” May 30, 2013 38
Lawlor, Denis (E&E) “Proposal to Provide Environmental Consulting Services for the Proposed Iowa tribe Wind Project in Lincoln, County Oklahoma” January 18, 2013

Iowa Tribe of Oklahoma Wind Study Report 50
Wetlands delineations and surveys would be required for wetland areas and waters of the U.S.
that may be impacted by civil infrastructure.
A NPDES stormwater permit and management plan would need to be designed to minimize stormwater runoff.
A Phase I ESA would be required to ensure that no facilities are sited on an area contaminated with hazardous Materials
Construction related permits include road and bridge use, grading plans, and similar administrative permits that would be acquired by the construction contractor closer to construction.

Iowa Tribe of Oklahoma Wind Study Report 51
5. POWER PURCHASE RESEARCH AND NEGOTIATIONS
5.1. Overview of Scope
Section 3 of this report discusses REC pricing and the concept of bundled vs. unbundled green power. Section 3 also discusses the price for RECs in an unbundled scenario. The value of RECs, however, is just a small portion of the total overall value of green energy; thus, the most important factor to understand for a power project is the value at which the energy itself can be sold. This section serves to analyze the value of the unbundled brown power pricing, as well as the bundled green power.
Summit Energy, a subsidiary of Schneider Electric, was hired by the Iowa Tribe of Oklahoma to research brown power pricing and bundled green power pricing, as well as analyze the potential structures for the sale of the electricity. Schneider Electric conducted research on potential power purchasers and pricing in the Southwest Power Pool (SPP) market. Several criteria were researched including:
Common power purchase agreement terms and conditions
Expectations on power price for both brown and bundled contracts including ancillary services and wheeling charges, if applicable
Bundled power sales vs. Unbundled REC/Brown Power sales strategies
Potential Off-takers and specific opportunities including power RFQs
Oklahoma Gas and Electric (OGE) (brown) price market fundamentals – current state and projected future rates (conservative and aggressive forecast)
OGE (green – RECs bundled with electricity) price market fundamentals – current state and projected future rates (conservative and aggressive forecast)
Research into any public renewable energy project structures with generation in SPP, including evaluation and analysis of commercial structures (term and rates, etc)
List of potential off-take in market area (those who have bought third party renewables within the SPP.
Types of models (sell project to buyer, PPA, hybrid, etc)
Evaluation of how modeling changes for different project size scenarios 1. 20MW 2. 50MW 3. 50+ MW
Research any existing or proposed federal, state or local incentives associated with wind energy development
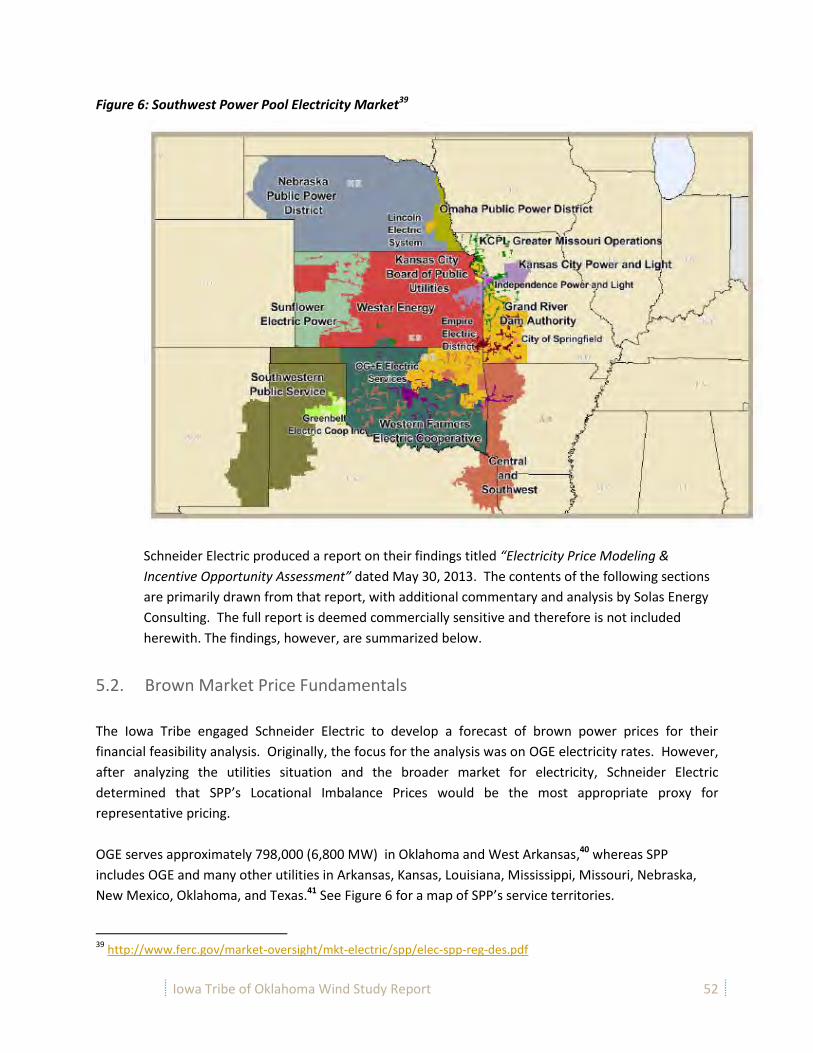
Iowa Tribe of Oklahoma Wind Study Report 52
Figure 6: Southwest Power Pool Electricity Market39
Schneider Electric produced a report on their findings titled “Electricity Price Modeling &
Incentive Opportunity Assessment” dated May 30, 2013. The contents of the following sections
are primarily drawn from that report, with additional commentary and analysis by Solas Energy
Consulting. The full report is deemed commercially sensitive and therefore is not included
herewith. The findings, however, are summarized below.
5.2. Brown Market Price Fundamentals
The Iowa Tribe engaged Schneider Electric to develop a forecast of brown power prices for their
financial feasibility analysis. Originally, the focus for the analysis was on OGE electricity rates. However,
after analyzing the utilities situation and the broader market for electricity, Schneider Electric
determined that SPP’s Locational Imbalance Prices would be the most appropriate proxy for
representative pricing.
OGE serves approximately 798,000 (6,800 MW) in Oklahoma and West Arkansas,40 whereas SPP
includes OGE and many other utilities in Arkansas, Kansas, Louisiana, Mississippi, Missouri, Nebraska,
New Mexico, Oklahoma, and Texas.41 See Figure 6 for a map of SPP’s service territories.
39
http://www.ferc.gov/market-oversight/mkt-electric/spp/elec-spp-reg-des.pdf

Iowa Tribe of Oklahoma Wind Study Report 53
SPP provides access to 5 years of historical hourly data. OGE has many different rate classes for
customers and the components in the rate classes are not always directly related to electricity
prices. OGE will perform multiple upgrades over the next 5 years and they are issuing long term
debt to accomplish this.42
OGE’s rates do not correlate well with Natural Gas futures, whereas SPP average spot prices
have historically tracked the NYMEX prompt month natural gas contract closely. On a quarterly
basis since 2007, the aforementioned gas contract has been able to explain over 90% of the
variation in the SPP spot market average price.
Figure 7: SPP Spot Prices versus NYMEX Prompt At the moment, SPP does not have futures data available. SPP only has an Energy Imbalance Service
Market, but is in the process of implementing the SPP Integrated Marketplace, which will include both
Day-Ahead and Real-Time markets (March 2014).43
In order to find an appropriate proxy, Schneider Electric looked at the fuel mix in Oklahoma and found
that Natural Gas dominated.44 Since the R2 for NYMEX and SPP is 90%, other fuels were not used for the
forecast. Additionally, other fuels follow the natural gas market as they are substitutes. They expect
natural gas to continue to be a price-setting fuel in most North American power markets, including SPP.
40
http://media.corporate-ir.net/media_files/irol/10/106374/OGE_2012AR.pdf P2 41
http://www.spp.org/section.asp?pageID=1 42
http://media.corporate-ir.net/media_files/irol/10/106374/OGE_2012AR.pdf P29 43
http://www.spp.org/section.asp?pageid=143 44
http://www.eia.gov/state/?sid=OK
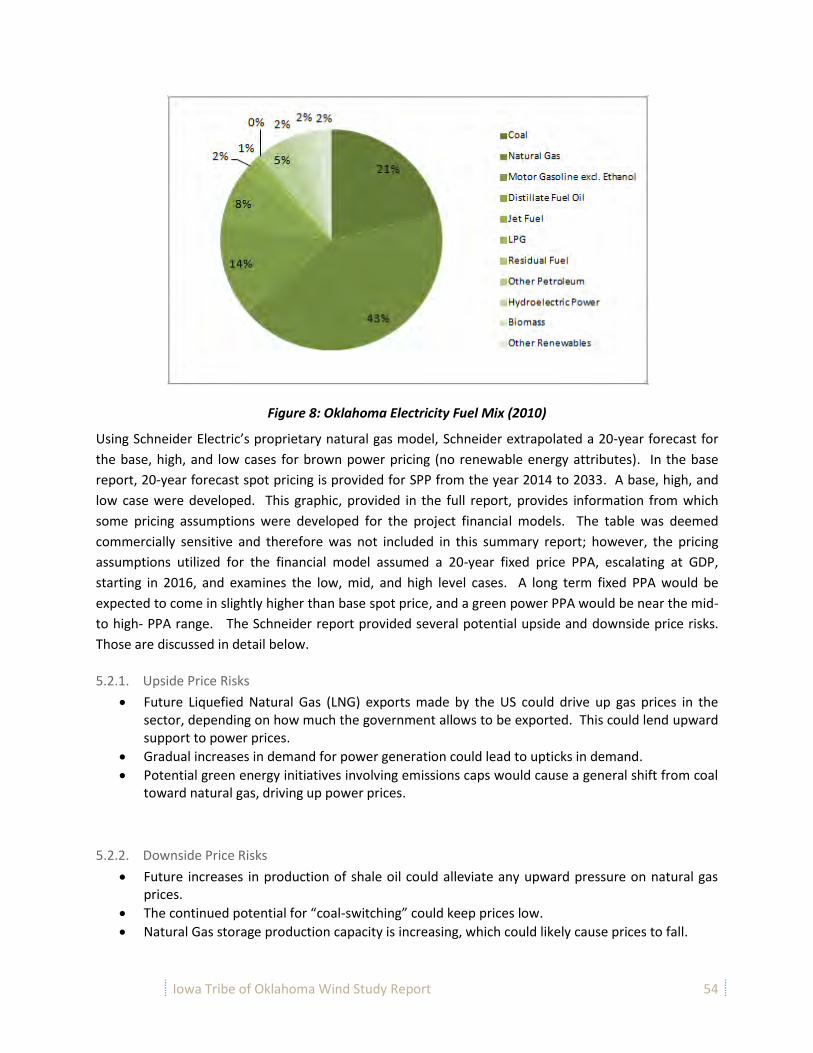
Iowa Tribe of Oklahoma Wind Study Report 54
Figure 8: Oklahoma Electricity Fuel Mix (2010)
Using Schneider Electric’s proprietary natural gas model, Schneider extrapolated a 20-year forecast for
the base, high, and low cases for brown power pricing (no renewable energy attributes). In the base
report, 20-year forecast spot pricing is provided for SPP from the year 2014 to 2033. A base, high, and
low case were developed. This graphic, provided in the full report, provides information from which
some pricing assumptions were developed for the project financial models. The table was deemed
commercially sensitive and therefore was not included in this summary report; however, the pricing
assumptions utilized for the financial model assumed a 20-year fixed price PPA, escalating at GDP,
starting in 2016, and examines the low, mid, and high level cases. A long term fixed PPA would be
expected to come in slightly higher than base spot price, and a green power PPA would be near the mid-
to high- PPA range. The Schneider report provided several potential upside and downside price risks.
Those are discussed in detail below.
5.2.1. Upside Price Risks
Future Liquefied Natural Gas (LNG) exports made by the US could drive up gas prices in the sector, depending on how much the government allows to be exported. This could lend upward support to power prices.
Gradual increases in demand for power generation could lead to upticks in demand.
Potential green energy initiatives involving emissions caps would cause a general shift from coal toward natural gas, driving up power prices.
5.2.2. Downside Price Risks
Future increases in production of shale oil could alleviate any upward pressure on natural gas prices.
The continued potential for “coal-switching” could keep prices low.
Natural Gas storage production capacity is increasing, which could likely cause prices to fall.

Iowa Tribe of Oklahoma Wind Study Report 55
Gradual increases in NGL (Natural Gas Liquids) production could help to keep the overall supply of energy options constant.
5.3. Types of Models for Power Sales
After research on the potential models for power sales from the project, it was determined that the
most likely off-take scenario was to sell the entire output (all the energy generated) of the facility under
a long-term PPA. Sometimes, a project developer will provide one or more PPAs to different off-takers,
however at either the 20 MW or 50 MW in size, there would be power purchasers interested in the
entire output. Another sales option would include a full merchant facility, or a shorter-term PPA
followed by merchant operations after expiration of the PPA. An explanation of a PPA vs. a merchant
facility is discussed below.
5.3.1. Power Purchase Agreements45 Power Purchase Agreements (PPAs) are financial agreements for delivery of power in which a third-party
developer such as the Iowa Tribe owns, operates, and maintains the generating asset and delivers that
power via a purchase contract to an end-user or other off-taker, such as an investor owned utility,
power retailer, or municipality. If the PPA includes the corresponding environmental attributes then the
power is delivered under a ‘green power PPA’. If the environmental attributes are stripped away and
sold separately as RECs, then the power delivered under a PPA would be a ‘brown power PPA’. PPAs are
typically offered in term lengths of 10 years or more, often 15- or 20-year deals. A green power PPA will
always be at an equal or higher rate than a brown power PPA. If the off-taker places no value on the
environmental attributes, then a green or brown power PPA would be identically priced. It is, however,
probable that a green power PPA would have a higher price and more interested counterparties as
compared to a straight brown power PPA offering.
For end-users of electricity, PPAs are generally priced on a $/MWh purchased basis and may include an
initial cost of energy figure that is escalated by a fixed percent in each subsequent year. PPAs are very
common and the long-term commitment of the agreement structure would allow the project to be
financed for the Iowa Tribe without the end-user or utility incurring up-front capital costs.
PPAs are one of the most common means by which renewable energy projects are financed, as the off-
take arrangements allow for stable, predictable revenue to the project’s investors and ensure that there
are counterparties in place through the payback period on the initial investment. For end-users, a PPA
can be seen as a 3rd party supplier of power, similar to a retail energy provider in deregulated markets,
that provides the commodity portion of the power, but in most cases still relies on the prevailing utility
for delivery to the facility. In a PPA arrangement, the pricing is often inclusive of all transmission,
distribution, congestion, and other ancillary fees so that the price being evaluated is “as delivered to the
site.” In the event that the Iowa Tribe is offering power “from the bus bar” (which means from the
substation) or from the point of origin at the generator, the end use purchaser is responsible for
transmission or “wheeling” the energy to its distribution network and ensuring reliable scheduling and 45
This section primarily drawn from the Schneider Electric report, with some additional editing and content provided by Solas Energy Consulting.

Iowa Tribe of Oklahoma Wind Study Report 56
delivery to its facilities. It is incumbent that any PPA is crystal clear on the point of delivery and who is
responsible for non-generation charges.
Transmission and wheeling charges (charges to ‘move’ the power to the end user) within the SPP region
can be identified and calculated once the destination for the electricity is known. Those wheeling
charges can be quite high, and any consideration of who could purchase the power must factor in those
wheeling charges. Selling the power to an entity that must be wheeled long distances could make the
project cost-prohibitive and so the strategy will be to identify an off-taker within a reasonable wheeling
market if a long term PPA vehicle is utilized for the sale of the power.
Benefits of Utilizing a Power Purchase Agreement Provides relatively known, stable energy price to both the Iowa Tribe and end user for 10-,15-,
or 20-year type terms – effectively hedging against future increases in grid power costs
If all environmental attributes are included with the sale of power, PPAs provide the most direct
and tangible link to a generating asset, short of on-site generation or a direct equity investment
in an asset
The Iowa Tribe could negotiate performance incentives in to the PPA for availability factor and
can benefit from control and operation of its own facility management
If the Iowa Tribe were to maintain control over the project, the tribe could create jobs, a source
of revenue, and develop technical skills within the tribal members.
PPAs are fairly common and generally understood in the energy and financial community where
typical contracting and delivery terms are established
Very financeable provided financial underwriting standards (price, counterparty
creditworthiness) are met
Considerations PPAs are generally structured as long term contracts with predictable revenue streams, which
effectively limits the Iowa Tribe’s upside potential in event power prices rise over fixed price
power structure sold over life of PPA
PPAs may not be as cost effective as brown power + RECs when stipulations are made that RECs
are to be bundled with power purchased
Caution should be exercised in negotiating a direct purchase / PPA contract to ensure that all
costs associated with “wheeling” the power into an end-user’s site have been accounted for in
pricing as the SPP wheeling costs can be expensive.
The signatory party to a PPA in most every case requires the developer to provide some form of
financial security to secure the power sale obligations to the buyer. This is a significant hurdle
for small developers and can drive smaller developers into partnerships with larger entities that
can put up multi-million dollar letters of credit for the offtake. This requirement alone may
drive the Iowa Tribe to consider a development partner for this project.
Direct purchase / PPAs are often positioned to off-take purchasers as a hedge against future rise in
energy costs and may in some cases be provided at a discount to grid-sourced electricity over the course
of the agreement. Green power PPAs are attractive to utility off-takers because the cost of fuel (wind or
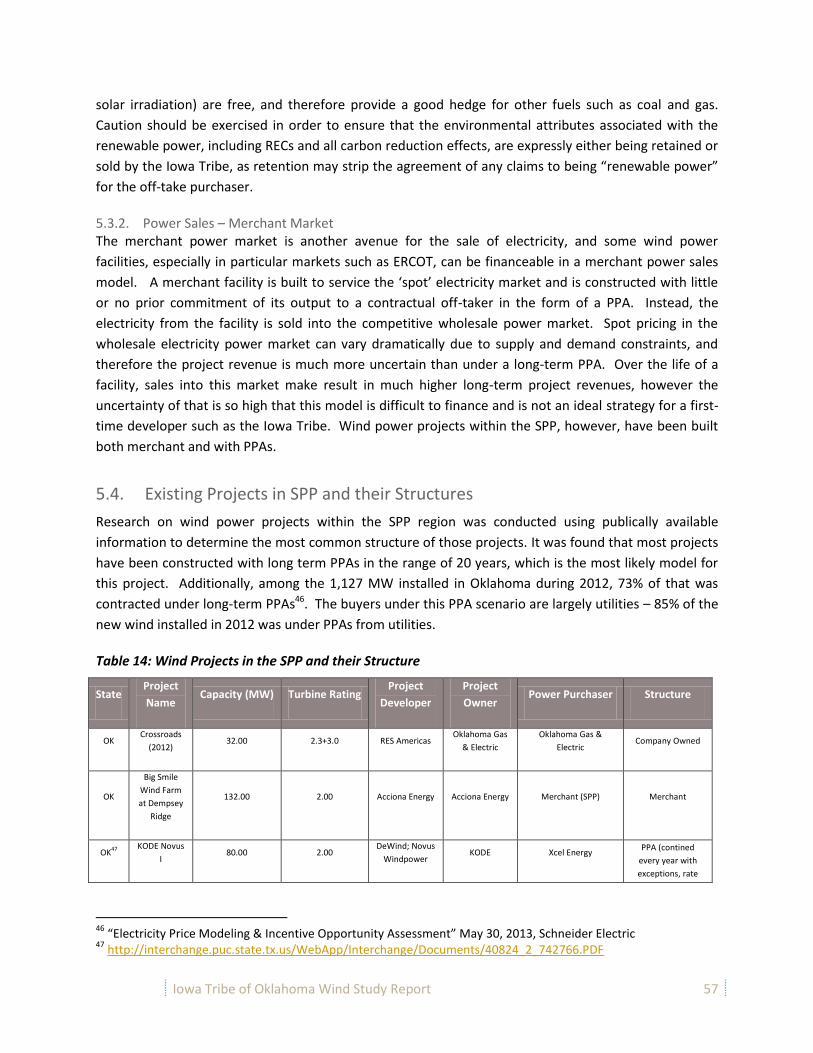
Iowa Tribe of Oklahoma Wind Study Report 57
solar irradiation) are free, and therefore provide a good hedge for other fuels such as coal and gas.
Caution should be exercised in order to ensure that the environmental attributes associated with the
renewable power, including RECs and all carbon reduction effects, are expressly either being retained or
sold by the Iowa Tribe, as retention may strip the agreement of any claims to being “renewable power”
for the off-take purchaser.
5.3.2. Power Sales – Merchant Market The merchant power market is another avenue for the sale of electricity, and some wind power
facilities, especially in particular markets such as ERCOT, can be financeable in a merchant power sales
model. A merchant facility is built to service the ‘spot’ electricity market and is constructed with little
or no prior commitment of its output to a contractual off-taker in the form of a PPA. Instead, the
electricity from the facility is sold into the competitive wholesale power market. Spot pricing in the
wholesale electricity power market can vary dramatically due to supply and demand constraints, and
therefore the project revenue is much more uncertain than under a long-term PPA. Over the life of a
facility, sales into this market make result in much higher long-term project revenues, however the
uncertainty of that is so high that this model is difficult to finance and is not an ideal strategy for a first-
time developer such as the Iowa Tribe. Wind power projects within the SPP, however, have been built
both merchant and with PPAs.
5.4. Existing Projects in SPP and their Structures
Research on wind power projects within the SPP region was conducted using publically available
information to determine the most common structure of those projects. It was found that most projects
have been constructed with long term PPAs in the range of 20 years, which is the most likely model for
this project. Additionally, among the 1,127 MW installed in Oklahoma during 2012, 73% of that was
contracted under long-term PPAs46. The buyers under this PPA scenario are largely utilities – 85% of the
new wind installed in 2012 was under PPAs from utilities.
Table 14: Wind Projects in the SPP and their Structure
State Project
Name Capacity (MW) Turbine Rating
Project
Developer
Project
Owner Power Purchaser Structure
OK Crossroads
(2012) 32.00 2.3+3.0 RES Americas
Oklahoma Gas
& Electric
Oklahoma Gas &
Electric Company Owned
OK
Big Smile
Wind Farm
at Dempsey
Ridge
132.00 2.00 Acciona Energy Acciona Energy Merchant (SPP) Merchant
OK47 KODE Novus
I 80.00 2.00
DeWind; Novus
Windpower KODE Xcel Energy
PPA (contined
every year with
exceptions, rate
46
“Electricity Price Modeling & Incentive Opportunity Assessment” May 30, 2013, Schneider Electric 47
http://interchange.puc.state.tx.us/WebApp/Interchange/Documents/40824_2_742766.PDF
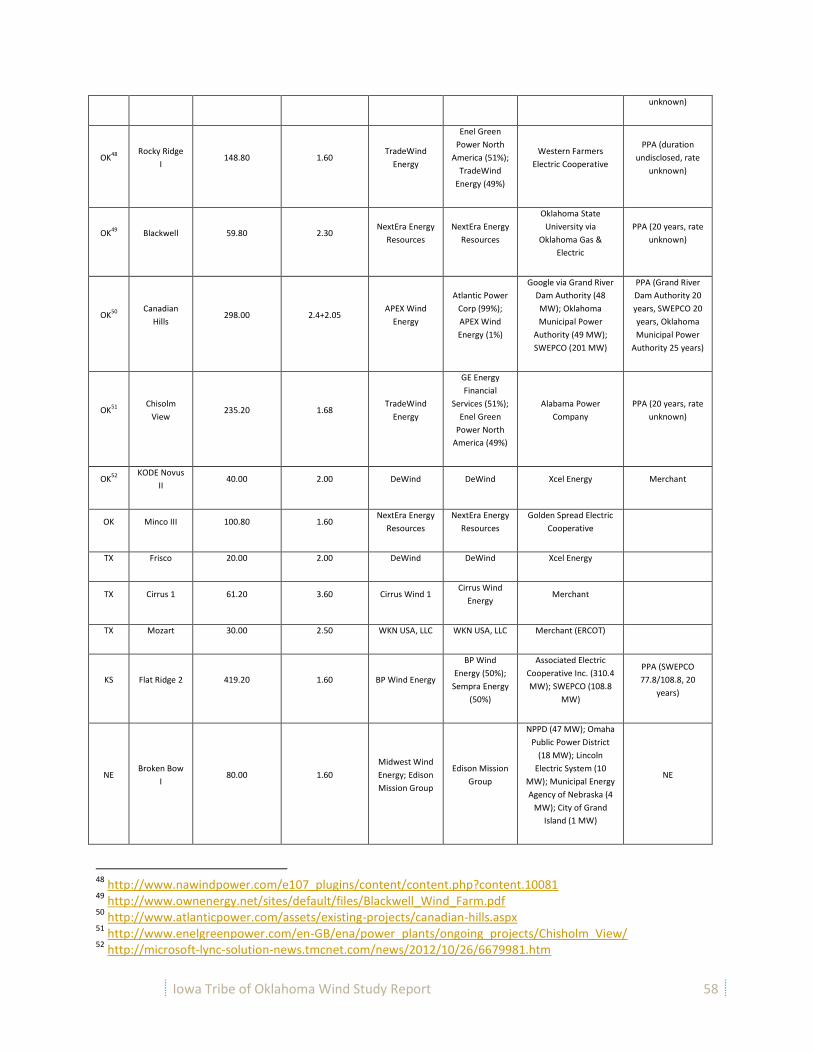
Iowa Tribe of Oklahoma Wind Study Report 58
unknown)
OK48 Rocky Ridge
I 148.80 1.60
TradeWind
Energy
Enel Green
Power North
America (51%);
TradeWind
Energy (49%)
Western Farmers
Electric Cooperative
PPA (duration
undisclosed, rate
unknown)
OK49 Blackwell 59.80 2.30 NextEra Energy
Resources
NextEra Energy
Resources
Oklahoma State
University via
Oklahoma Gas &
Electric
PPA (20 years, rate
unknown)
OK50
Canadian
Hills 298.00 2.4+2.05
APEX Wind
Energy
Atlantic Power
Corp (99%);
APEX Wind
Energy (1%)
Google via Grand River
Dam Authority (48
MW); Oklahoma
Municipal Power
Authority (49 MW);
SWEPCO (201 MW)
PPA (Grand River
Dam Authority 20
years, SWEPCO 20
years, Oklahoma
Municipal Power
Authority 25 years)
OK51 Chisolm
View 235.20 1.68
TradeWind
Energy
GE Energy
Financial
Services (51%);
Enel Green
Power North
America (49%)
Alabama Power
Company
PPA (20 years, rate
unknown)
OK52 KODE Novus
II 40.00 2.00 DeWind DeWind Xcel Energy Merchant
OK Minco III 100.80 1.60 NextEra Energy
Resources
NextEra Energy
Resources
Golden Spread Electric
Cooperative
TX Frisco 20.00 2.00 DeWind DeWind Xcel Energy
TX Cirrus 1 61.20 3.60 Cirrus Wind 1 Cirrus Wind
Energy Merchant
TX Mozart 30.00 2.50 WKN USA, LLC WKN USA, LLC Merchant (ERCOT)
KS Flat Ridge 2 419.20 1.60 BP Wind Energy
BP Wind
Energy (50%);
Sempra Energy
(50%)
Associated Electric
Cooperative Inc. (310.4
MW); SWEPCO (108.8
MW)
PPA (SWEPCO
77.8/108.8, 20
years)
NE Broken Bow
I 80.00 1.60
Midwest Wind
Energy; Edison
Mission Group
Edison Mission
Group
NPPD (47 MW); Omaha
Public Power District
(18 MW); Lincoln
Electric System (10
MW); Municipal Energy
Agency of Nebraska (4
MW); City of Grand
Island (1 MW)
NE
48
http://www.nawindpower.com/e107_plugins/content/content.php?content.10081 49
http://www.ownenergy.net/sites/default/files/Blackwell_Wind_Farm.pdf 50
http://www.atlanticpower.com/assets/existing-projects/canadian-hills.aspx 51
http://www.enelgreenpower.com/en-GB/ena/power_plants/ongoing_projects/Chisholm_View/ 52
http://microsoft-lync-solution-news.tmcnet.com/news/2012/10/26/6679981.htm

Iowa Tribe of Oklahoma Wind Study Report 59
NE Crofton
Bluffs 42.00 1.8+3.0
Edison Mission
Group
Edison Mission
Group
NPPD (20 MW); OPPD
(13 MW); Municipal
Energy Agency of
Nebraska (4 MW);
Lincoln Electric System
(3 MW)
5.4.1. Key Findings
Table 15: Brown Power Purchase Key Findings
Key Findings
1 Most wind projects developed in the SPP market receive long-term power purchase agreements on the order of 15-20 years.
2 A merchant project scenario for the Iowa Tribe Project would be difficult to finance and is considered not feasible.
3 Pricing analysis completed by Schneider Electric provided indications that brown power sold under a long-term PPA could be expected to start at $49 to $70/MWh, escalating over the life of the project.
5.5. Bundled vs. Unbundled Power
The analysis above addresses the brown power resulting from unbundling the RECs from the electricity.
Section 3 provided information regarding the REC sales and expected pricing. The other potential
methodology to sell the power is as a bundled product, or ‘green power’ which ties the electricity to the
RECs and is sold to one off-taker. Ultimately, the project will need to be structured such that the
maximum revenue is obtained. This feasibility study was conducted utilizing historical information and
market knowledge, and recommendations were developed based on that research. It should be noted,
however, that the power market is dynamic and green power especially is driven not just by supply and
demand, but also by environmental legislation related to climate change, politics, and social awareness
of the benefits of green power. All of these elements introduce a certain degree of volatility to any
projections for pricing of green energy.
5.5.1. Results
Based on the analysis in this section and the REC section, it was determined that the most advantageous
structure for the project economic modeling was a bundled product. This is for several reasons. First,
the likelihood of securing a PPA was higher for a bundled product, and this would not necessarily
preclude the project from providing naming rights to the right buyer. Additionally, the long term
administrative costs would be lower, and the project would be more financeable. The US Government
could be an interesting purchaser as they put a 100% premium on green power generated on Native
lands.

Iowa Tribe of Oklahoma Wind Study Report 60
5.5.2. Key Findings
Table 16: Bundled vs. Unbundled Power Sales Findings
Key Findings Caveats & Limitations
1 A bundled ‘green power’ product would likely have the most interested purchasers.
The power market is dynamic, and the bundled vs. unbundled strategy will require continuous review and evaluation as the market changes.
2 A bundled ‘green power’ product may garner a higher sale price than a REC plus brown power sales strategy
This strategy has the highest probability of success if a REC buyer with a strong appetite for Native American RECS is not located.
3 If a buyer is found who is willing to pay a significant premium for the Native American branding, then unbundling may be the best option
The assumed market for this type of buyer is small, which is why this is deemed to be a less likely scenario.
5.6. Potential Off-Takers
5.6.1. Results
Schneider Electric conducted a survey of the market to determine who potential power purchasers might be within the SPP region, as well as non-traditional power purchasers. They noted a trend that non-traditional power purchasers were entering the market and either executing PPAs or stating their intent to purchase RECs. These participants tended to be large organizations who were interested in mitigating power costs, as well as incorporating green branding and sustainability practices into their corporations. The listing of potential off-takers was deemed to be commercially sensitive and therefore was not included within this summary report. The full listing can be found in the base report from Schneider Electric.
5.7. Power Purchase Financial Model Inputs
5.7.1. Power Purchase Inputs
Table 17: Power Purchase Financial Model Inputs
Scenario 20MW and 50MW Case
Comments
Low Case – Brown Power Price, 20 Year PPA
$29/MWh This scenario was not utilized. With a green product it is expected that the mid- to high- case are more likely.
Mid Case – Brown Power Price, 20 year PPA
$33/MWh This is the model base case.
High Case – Brown Power Price, 20 year $39/MWh This is the model high case.

Iowa Tribe of Oklahoma Wind Study Report 61
PPA
15% Additional Premium on power price $45/MWh This case was also examined to determine the impact on the internal rate of return (IRR).
5.7.2. Summary of Power Purchase Model Inputs
The year 2016 was assumed for commercial operation of the project and Schneider’s price projections starting in that year were utilized for the financial model. The power pricing was escalated over the 20 year period. REC pricing was added to the brown power price, and the base assumption was $1/MWh for RECs.
The SPP region is an unusually low market for power pricing. It is not uncommon in other regions of the country, such as the Western Electricity Coordinating Council (WECC), or ISO-New England, for PPAs to be signed at $70-85/MWh. This low power price makes it difficult to reach favorable project economics (reference section 7).
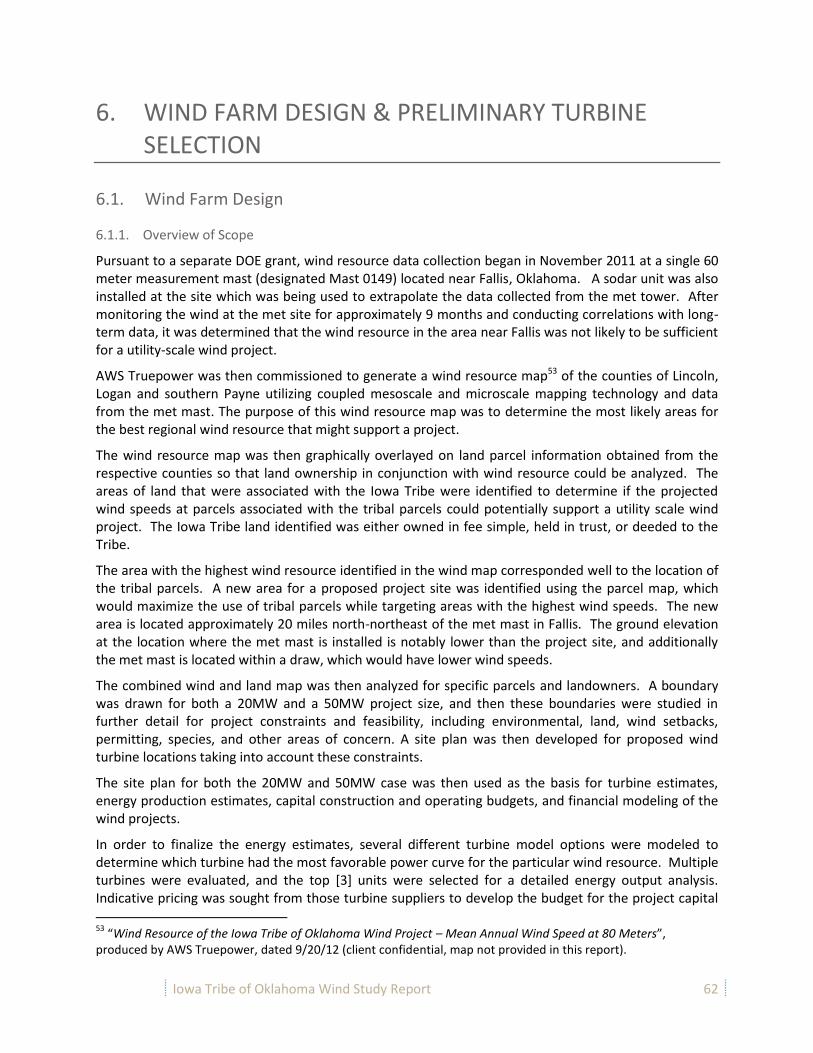
Iowa Tribe of Oklahoma Wind Study Report 62
6. WIND FARM DESIGN & PRELIMINARY TURBINE SELECTION
6.1. Wind Farm Design
6.1.1. Overview of Scope
Pursuant to a separate DOE grant, wind resource data collection began in November 2011 at a single 60 meter measurement mast (designated Mast 0149) located near Fallis, Oklahoma. A sodar unit was also installed at the site which was being used to extrapolate the data collected from the met tower. After monitoring the wind at the met site for approximately 9 months and conducting correlations with long-term data, it was determined that the wind resource in the area near Fallis was not likely to be sufficient for a utility-scale wind project.
AWS Truepower was then commissioned to generate a wind resource map53 of the counties of Lincoln, Logan and southern Payne utilizing coupled mesoscale and microscale mapping technology and data from the met mast. The purpose of this wind resource map was to determine the most likely areas for the best regional wind resource that might support a project.
The wind resource map was then graphically overlayed on land parcel information obtained from the respective counties so that land ownership in conjunction with wind resource could be analyzed. The areas of land that were associated with the Iowa Tribe were identified to determine if the projected wind speeds at parcels associated with the tribal parcels could potentially support a utility scale wind project. The Iowa Tribe land identified was either owned in fee simple, held in trust, or deeded to the Tribe.
The area with the highest wind resource identified in the wind map corresponded well to the location of the tribal parcels. A new area for a proposed project site was identified using the parcel map, which would maximize the use of tribal parcels while targeting areas with the highest wind speeds. The new area is located approximately 20 miles north-northeast of the met mast in Fallis. The ground elevation at the location where the met mast is installed is notably lower than the project site, and additionally the met mast is located within a draw, which would have lower wind speeds.
The combined wind and land map was then analyzed for specific parcels and landowners. A boundary was drawn for both a 20MW and a 50MW project size, and then these boundaries were studied in further detail for project constraints and feasibility, including environmental, land, wind setbacks, permitting, species, and other areas of concern. A site plan was then developed for proposed wind turbine locations taking into account these constraints.
The site plan for both the 20MW and 50MW case was then used as the basis for turbine estimates, energy production estimates, capital construction and operating budgets, and financial modeling of the wind projects.
In order to finalize the energy estimates, several different turbine model options were modeled to determine which turbine had the most favorable power curve for the particular wind resource. Multiple turbines were evaluated, and the top [3] units were selected for a detailed energy output analysis. Indicative pricing was sought from those turbine suppliers to develop the budget for the project capital 53
“Wind Resource of the Iowa Tribe of Oklahoma Wind Project – Mean Annual Wind Speed at 80 Meters”, produced by AWS Truepower, dated 9/20/12 (client confidential, map not provided in this report).

Iowa Tribe of Oklahoma Wind Study Report 63
expenditures. This cost information was input into the financial model along with the energy projections to complete the modeling cases.
6.1.2. Wind Resource Mapping
AWS Truepower utilized their SiteWind® system over the proposed project area to develop a wind speed
map of the region. The SiteWind system is a proprietary coupled mesoscale-microscale model, which is
discussed in more detail later in this section. AWS Truepower utilized a mesoscale grid spacing of 1.2 km
and the final deliverable was a 50 m high resolution wind map. Topographic data was obtained from the
National Elevation Database (NED), and the land cover data was derived from the USGS 30m and
gridded Landsat databases. Pursuant to this work, AWS Truepower delivered a CD ROM to the Iowa
Tribe containing the ESRI ArcReader and the map showing the estimated mean wind speed for several
heights above ground. The map included thematic overlays such as roads, transmission lines, parks,
towns, cities, and other items. This map was used as a coordination tool between the subcontractors
working on the study, and constraints data was layered into this file as it became available. This work
product was deemed commercially sensitive and is not included herewith.
6.1.3. Project Site Layout Design
A layout for the project was developed based on an iterative process between the various contractors
working on the project. AWS Truepower provided a preliminary wind turbine layout based on the wind
speed, additional climate conditions, and standard setbacks. Ecology and Environment performed a
desk-top constraints analysis as discussed in section 4.2.1, which was then integrated with the wind
data. That information was then utilized by Solas Energy Consulting to identify the underlying
landowners. Title records were pulled for the potential landowners and analyzed in greater detail.
Parcels were located which were associated with the Tribe, and another iteration of the site layout was
developed for further study. At this point, the microwave path analysis and FAA studies as discussed in
Section 4 were conducted for a high level fatal flaw analysis of the selected parcels. Solas conducted
additional land research and consultation with the Tribal attorneys to develop a land acquisition
strategy, which is discussed in further detail in Section 6.3 below. Additionally, Atwell Engineering was
contracted to do an on-site environmental screening, and geophysical studies were conducted by
Renewable Resource Consultants. The results of the geophysical studies are discussed in Section 6.4
below.
Based on the inputs available from all subcontractors at the time of the energy production estimates,
minor alterations were made to the preliminary layout to create an updated layout. This updated layout
was utilized as the basis for energy estimates, cost estimating, turbine selection, and development of a
financial model to determine economic project feasibility. It should be noted that some inputs received
after completion of the energy estimates were not considered in the updated layout; these
considerations should be made during continued development of the project layout.
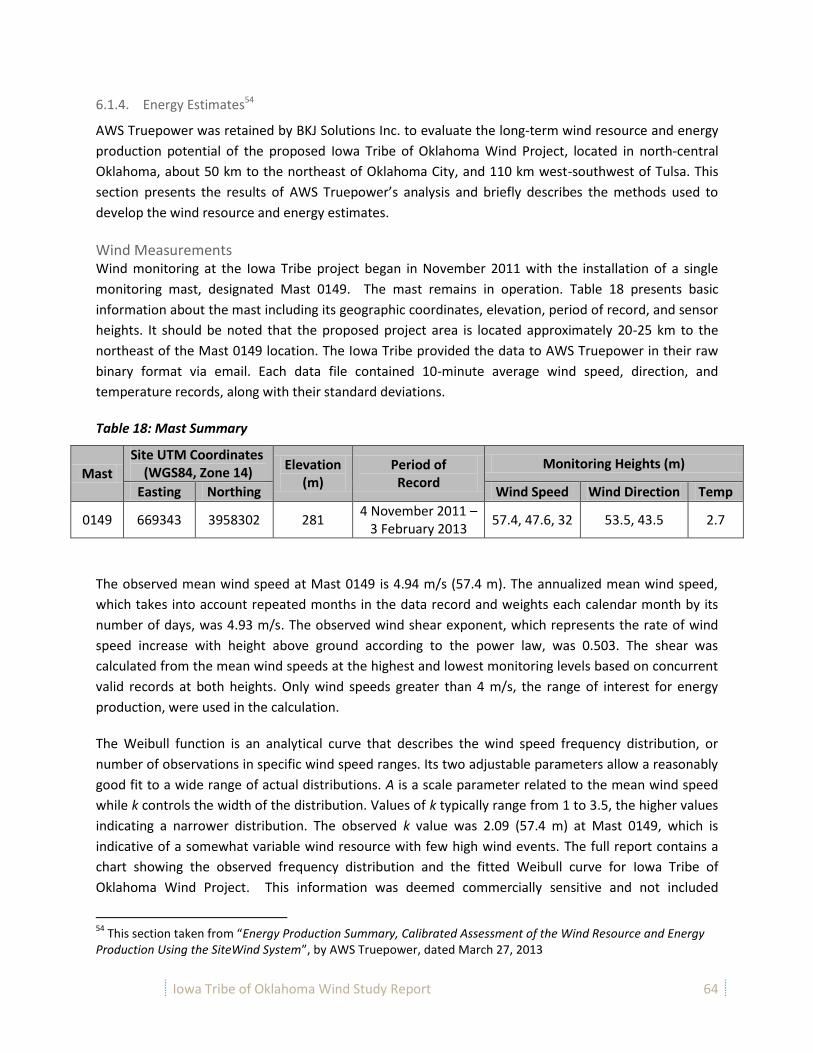
Iowa Tribe of Oklahoma Wind Study Report 64
6.1.4. Energy Estimates54
AWS Truepower was retained by BKJ Solutions Inc. to evaluate the long-term wind resource and energy
production potential of the proposed Iowa Tribe of Oklahoma Wind Project, located in north-central
Oklahoma, about 50 km to the northeast of Oklahoma City, and 110 km west-southwest of Tulsa. This
section presents the results of AWS Truepower’s analysis and briefly describes the methods used to
develop the wind resource and energy estimates.
Wind Measurements Wind monitoring at the Iowa Tribe project began in November 2011 with the installation of a single
monitoring mast, designated Mast 0149. The mast remains in operation. Table 18 presents basic
information about the mast including its geographic coordinates, elevation, period of record, and sensor
heights. It should be noted that the proposed project area is located approximately 20-25 km to the
northeast of the Mast 0149 location. The Iowa Tribe provided the data to AWS Truepower in their raw
binary format via email. Each data file contained 10-minute average wind speed, direction, and
temperature records, along with their standard deviations.
Table 18: Mast Summary
Mast
Site UTM Coordinates (WGS84, Zone 14)
Elevation (m)
Period of Record
Monitoring Heights (m)
Easting Northing Wind Speed Wind Direction Temp
0149 669343 3958302 281 4 November 2011 –
3 February 2013 57.4, 47.6, 32 53.5, 43.5 2.7
The observed mean wind speed at Mast 0149 is 4.94 m/s (57.4 m). The annualized mean wind speed,
which takes into account repeated months in the data record and weights each calendar month by its
number of days, was 4.93 m/s. The observed wind shear exponent, which represents the rate of wind
speed increase with height above ground according to the power law, was 0.503. The shear was
calculated from the mean wind speeds at the highest and lowest monitoring levels based on concurrent
valid records at both heights. Only wind speeds greater than 4 m/s, the range of interest for energy
production, were used in the calculation.
The Weibull function is an analytical curve that describes the wind speed frequency distribution, or
number of observations in specific wind speed ranges. Its two adjustable parameters allow a reasonably
good fit to a wide range of actual distributions. A is a scale parameter related to the mean wind speed
while k controls the width of the distribution. Values of k typically range from 1 to 3.5, the higher values
indicating a narrower distribution. The observed k value was 2.09 (57.4 m) at Mast 0149, which is
indicative of a somewhat variable wind resource with few high wind events. The full report contains a
chart showing the observed frequency distribution and the fitted Weibull curve for Iowa Tribe of
Oklahoma Wind Project. This information was deemed commercially sensitive and not included
54
This section taken from “Energy Production Summary, Calibrated Assessment of the Wind Resource and Energy Production Using the SiteWind System”, by AWS Truepower, dated March 27, 2013
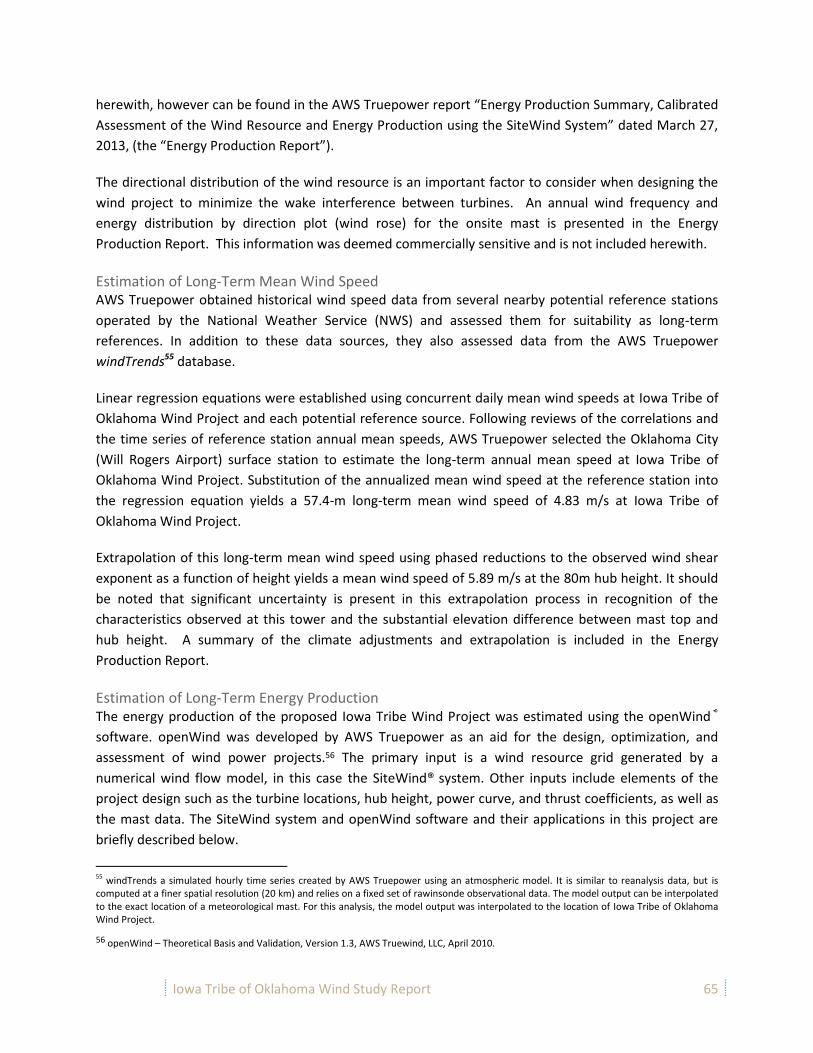
Iowa Tribe of Oklahoma Wind Study Report 65
herewith, however can be found in the AWS Truepower report “Energy Production Summary, Calibrated
Assessment of the Wind Resource and Energy Production using the SiteWind System” dated March 27,
2013, (the “Energy Production Report”).
The directional distribution of the wind resource is an important factor to consider when designing the
wind project to minimize the wake interference between turbines. An annual wind frequency and
energy distribution by direction plot (wind rose) for the onsite mast is presented in the Energy
Production Report. This information was deemed commercially sensitive and is not included herewith.
Estimation of Long-Term Mean Wind Speed AWS Truepower obtained historical wind speed data from several nearby potential reference stations
operated by the National Weather Service (NWS) and assessed them for suitability as long-term
references. In addition to these data sources, they also assessed data from the AWS Truepower
windTrends55 database.
Linear regression equations were established using concurrent daily mean wind speeds at Iowa Tribe of
Oklahoma Wind Project and each potential reference source. Following reviews of the correlations and
the time series of reference station annual mean speeds, AWS Truepower selected the Oklahoma City
(Will Rogers Airport) surface station to estimate the long-term annual mean speed at Iowa Tribe of
Oklahoma Wind Project. Substitution of the annualized mean wind speed at the reference station into
the regression equation yields a 57.4-m long-term mean wind speed of 4.83 m/s at Iowa Tribe of
Oklahoma Wind Project.
Extrapolation of this long-term mean wind speed using phased reductions to the observed wind shear
exponent as a function of height yields a mean wind speed of 5.89 m/s at the 80m hub height. It should
be noted that significant uncertainty is present in this extrapolation process in recognition of the
characteristics observed at this tower and the substantial elevation difference between mast top and
hub height. A summary of the climate adjustments and extrapolation is included in the Energy
Production Report.
Estimation of Long-Term Energy Production The energy production of the proposed Iowa Tribe Wind Project was estimated using the openWind®
software. openWind was developed by AWS Truepower as an aid for the design, optimization, and
assessment of wind power projects.56 The primary input is a wind resource grid generated by a
numerical wind flow model, in this case the SiteWind® system. Other inputs include elements of the
project design such as the turbine locations, hub height, power curve, and thrust coefficients, as well as
the mast data. The SiteWind system and openWind software and their applications in this project are
briefly described below.
55 windTrends a simulated hourly time series created by AWS Truepower using an atmospheric model. It is similar to reanalysis data, but is computed at a finer spatial resolution (20 km) and relies on a fixed set of rawinsonde observational data. The model output can be interpolated to the exact location of a meteorological mast. For this analysis, the model output was interpolated to the location of Iowa Tribe of Oklahoma Wind Project.
56 openWind – Theoretical Basis and Validation, Version 1.3, AWS Truewind, LLC, April 2010.

Iowa Tribe of Oklahoma Wind Study Report 66
The SiteWind System Numerical wind flow models are used to calculate the wind resource variation across a project area due
to changes in terrain and surface roughness. AWS Truepower has developed the SiteWind system to
perform these calculations. SiteWind employs both mesoscale and microscale models to simulate the
wind climate over a wide range of scales. The mesoscale model assesses regional climate conditions and
simulates complex meteorological phenomena such as katabatic (downslope) mountain winds,
channeling through mountain passes, lake and sea breezes, low-level jets, and temperature inversions.
The microscale model accounts for the localized influences of topography and surface roughness
changes and produces a detailed wind resource map and grid. As a final step, the predicted speed and
direction are adjusted with on-site data from masts within the project area. This method has been found
to be more accurate on the whole than microscale wind flow models alone.57
The mesoscale model used for this analysis was the Mesoscale Atmospheric Simulation System
(MASS58), a non-hydrostatic weather model used in commercial and research applications. MASS was
run in a series of nested grids, with the innermost grid having a spatial resolution of 1.2 km. Using
regional weather data, MASS simulated historical weather conditions for a representative sample of
days. The MASS output was then coupled to WindMap – a mass-conserving model – which was run on a
grid scale of 50 m.59 Finally, the output of WindMap was adjusted to the wind speed and direction
distribution at Mast 0149. This last step was performed within openWind, as described below. The
resulting wind resource map is shown in the Energy Production Report.
openWind Once the wind resource model has been run, the resource grid file is imported into openWind to define
the wind resource for the project area. The Weibull parameters in the file are converted to directional
speed-up ratios relating the wind speed at each grid point to the speed at a reference mast. By
associating the model data to a wind speed histogram file for the reference mast, the program is able to
adjust the modeled speed distribution to the true speed distribution observed at a point. This method
usually produces a more accurate estimate of the energy production than relying on the modeled
distributions alone.
A number of reference masts can be used to reduce errors in the predicted spatial variation of the wind
resource across the project area. Conventionally, the project area is broken up into sub-regions, each of
which is associated with a different mast using the distance-weighted interpolation between masts, as
previously described. This avoids discontinuities in wind speeds across the boundaries of areas assigned
to different masts and produces a more realistic picture of the spatial variation of the wind resource.
Within openWind, the adjusted wind resource grid is divided into sub-regions associated with different 57 Beaucage, Philippe and Brower, Michael C, Wind Flow Model Performance – Do More Sophisticated Models Produce More Accurate Wind Resource Estimates?, 6 February 2012
58 Developed for NASA, the US Air Force, and commercial and research applications, MASS is similar to and has been verified against other mesoscale weather models such as MM5 and WRF. For further information, see http://www.meso.com/mass.html.
59 WindMap, developed by AWS Truepower, is a mass-conserving model that adjusts an initial wind field, here supplied by MASS, in response to local variations in topography and surface roughness. See, e.g., Michael Brower, “Validation of the WindMap Model,” Proceedings of WindPower 1999, American Wind Energy Association, June 1999.

Iowa Tribe of Oklahoma Wind Study Report 67
masts to capture variations in the observed speed frequency distribution, although the corresponding
impact on energy production estimates is usually relatively small.
AWS Truepower uses the openWind Deep Array Wake Model (DAWM) to calculate wake losses. This
model actually contains two separate wake models operating independently. The first is the Eddy
Viscosity model, which is based on the thin-shear-layer approximation of the Navier-Stokes equations
assuming axisymmetric wakes of Gaussian cross-sectional form, as originally postulated by Ainslie.60 The
model equations ensure that momentum and mass conservation are observed simultaneously. As
inputs, the wake model requires the ambient turbulence intensity at hub height, which influences the
initial wake deficit behind each turbine and the rate of wake dissipation; the speed and direction
frequency distribution, based on a wind resource grid and associated mast files; the locations of the
turbines; and the turbine thrust coefficient curves. Validation of the openWind Eddy Viscosity model is
described elsewhere.
In response to evidence that conventional wake models like the Eddy Viscosity model underestimate
wake losses in deep (multi-row) arrays of wind turbines, especially offshore, AWS Truepower
implemented a second model designed to handle such situations. This model is loosely based on a
theory developed by Frandsen,61 who postulated that the effect of a deep array of wind turbines on the
atmosphere could be represented as a region of increased surface drag, represented by a surface
roughness length. Where the wind first impinges on the array, an internal boundary layer (IBL) is
created, within which the wind profile is determined by the array roughness rather than by the ambient
roughness. This IBL grows with downwind distance, and once its height exceeds the turbine hub height,
the hub-height speed impinging upon turbines farther downwind is progressively reduced. According to
the Frandsen theory, the effective array roughness is in the range of 1 m to 3 m, or typical of a forest, for
mid-range speeds and typical turbine spacing. AWS Truepower modified the Frandsen model to treat
each turbine as an isolated island of roughness, a necessary change to permit rapid modifications to the
turbine layout for array optimization. In addition, the IBL created by each turbine is assumed to be
centered on the turbine’s hub height.
In combining the two models, the DAWM implicitly defines “shallow” and “deep” zones within a turbine
array. In the shallow zone, the direct wake effects of individual turbines dominate, and the unmodified
Eddy Viscosity (EV) model is used to calculate wake deficits; in the deep zone, the deep-array effect is
more prominent, and thus, the roughness model is employed. The DAWM has been validated at several
offshore and onshore projects.62
60 Ainslie, J.F., 1988, Calculating the flowfield in the wake of wind turbines.” Journal of Wind Engineering and Industrial Aerodynamics, 27. Pages 213-224.
61 Sten Tronæs Frandsen, Turbulence and turbulence-generated structural loading in wind turbine clusters, Risø-R-1188(EN), Risø National Laboratory (January 2007).
62 Brower, Michael C. and Robinson, Nicholas M., “The openWind Deep Array Wake Model – Development and Validation”, May 2012.
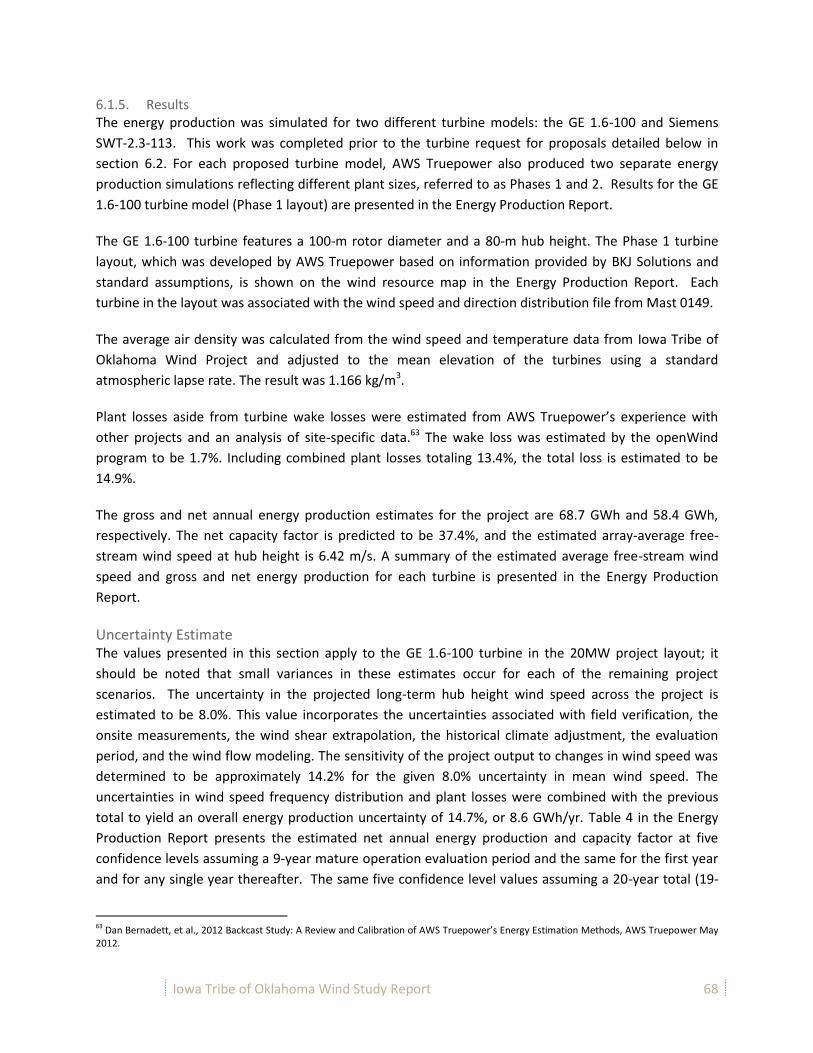
Iowa Tribe of Oklahoma Wind Study Report 68
6.1.5. Results The energy production was simulated for two different turbine models: the GE 1.6-100 and Siemens
SWT-2.3-113. This work was completed prior to the turbine request for proposals detailed below in
section 6.2. For each proposed turbine model, AWS Truepower also produced two separate energy
production simulations reflecting different plant sizes, referred to as Phases 1 and 2. Results for the GE
1.6-100 turbine model (Phase 1 layout) are presented in the Energy Production Report.
The GE 1.6-100 turbine features a 100-m rotor diameter and a 80-m hub height. The Phase 1 turbine
layout, which was developed by AWS Truepower based on information provided by BKJ Solutions and
standard assumptions, is shown on the wind resource map in the Energy Production Report. Each
turbine in the layout was associated with the wind speed and direction distribution file from Mast 0149.
The average air density was calculated from the wind speed and temperature data from Iowa Tribe of
Oklahoma Wind Project and adjusted to the mean elevation of the turbines using a standard
atmospheric lapse rate. The result was 1.166 kg/m3.
Plant losses aside from turbine wake losses were estimated from AWS Truepower’s experience with
other projects and an analysis of site-specific data.63 The wake loss was estimated by the openWind
program to be 1.7%. Including combined plant losses totaling 13.4%, the total loss is estimated to be
14.9%.
The gross and net annual energy production estimates for the project are 68.7 GWh and 58.4 GWh,
respectively. The net capacity factor is predicted to be 37.4%, and the estimated array-average free-
stream wind speed at hub height is 6.42 m/s. A summary of the estimated average free-stream wind
speed and gross and net energy production for each turbine is presented in the Energy Production
Report.
Uncertainty Estimate The values presented in this section apply to the GE 1.6-100 turbine in the 20MW project layout; it
should be noted that small variances in these estimates occur for each of the remaining project
scenarios. The uncertainty in the projected long-term hub height wind speed across the project is
estimated to be 8.0%. This value incorporates the uncertainties associated with field verification, the
onsite measurements, the wind shear extrapolation, the historical climate adjustment, the evaluation
period, and the wind flow modeling. The sensitivity of the project output to changes in wind speed was
determined to be approximately 14.2% for the given 8.0% uncertainty in mean wind speed. The
uncertainties in wind speed frequency distribution and plant losses were combined with the previous
total to yield an overall energy production uncertainty of 14.7%, or 8.6 GWh/yr. Table 4 in the Energy
Production Report presents the estimated net annual energy production and capacity factor at five
confidence levels assuming a 9-year mature operation evaluation period and the same for the first year
and for any single year thereafter. The same five confidence level values assuming a 20-year total (19-
63 Dan Bernadett, et al., 2012 Backcast Study: A Review and Calibration of AWS Truepower’s Energy Estimation Methods, AWS Truepower May 2012.

Iowa Tribe of Oklahoma Wind Study Report 69
year mature operation) evaluation period are contained in Table 5 of the Energy Production Report. The
same values are presented in the Appendix for the three additional energy production scenarios.
Key Findings
Table 19: Energy Assessment Findings
Key Findings
1 The wind resource in the vicinity of the installed met mast near Fallis is not rigorous enough to support a project.
2 The wind resource in the new proposed project area is a class III, low wind resource. The wind resource is in the outer bounds of feasibility and the economics will be driven largely by the achievable power price for the project.
3 A high degree of uncertainty regarding the wind resource exists at the proposed site and additional on-site information should be obtained to verify the projections in the report.
6.2. Wind Turbine Selection64
A request for quotation for wind turbine pricing for the Iowa Tribe of Oklahoma Project was conducted
so that indicative pricing could be obtained for the project feasibility. Many different criterion need to
be considered for the selection of an appropriate technology, including price, technical characteristics,
installed turbine base, service packages, turbine performance, and warranties, among others. More
than a dozen wind turbine manufacturers supply utility-scale technology to the US market, although the
largest installed base is by approximately 9 manufacturers. All of the major manufacturers were
reviewed prior to issuance of the RFP.
As of December 31, 2012, the American Wind Energy Association reported65 that Oklahoma had a total
installed wind energy capacity of 3,134 MW, the sixth highest state for installed capacity in the United
States. This capacity consists of approximately 1,718 individual units, representing 9 turbine
manufacturers. The listing of the manufacturers, the total installed capacity by megawatts (MW), and
the quantity of units per manufacturer is as follows:
Table 20: Installed Capacity in Oklahoma by Manufacturer
Turbine Manufacturer Total Installed (MW)66 Total Number of Units
GE 1252.4 802
Siemens 639.4 278
Vestas 321.9 187
Mitsubishi 278.4 116
64
This section is primarily drawn from “Indicative RFQ Results for Wind Energy Turbines” dated May 21, 2013 by Solas Energy Consulting US Inc. 65
AWEA U.S. Wind Industry Fourth Quarter 2012 Market Report, AWEA Data Services; January 30, 2013 66
The research conducted was not able to identify the manufacturer of approximately 4 MW of turbines installed.
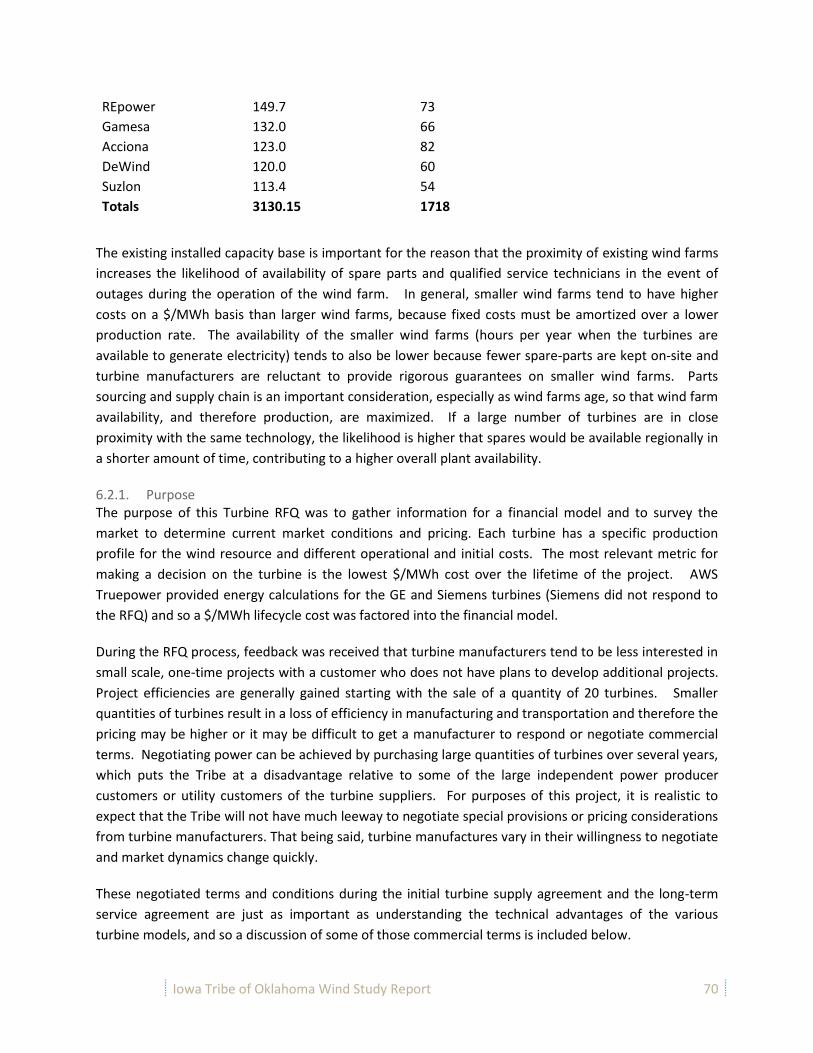
Iowa Tribe of Oklahoma Wind Study Report 70
REpower 149.7 73
Gamesa 132.0 66
Acciona 123.0 82
DeWind 120.0 60
Suzlon 113.4 54
Totals 3130.15 1718
The existing installed capacity base is important for the reason that the proximity of existing wind farms
increases the likelihood of availability of spare parts and qualified service technicians in the event of
outages during the operation of the wind farm. In general, smaller wind farms tend to have higher
costs on a $/MWh basis than larger wind farms, because fixed costs must be amortized over a lower
production rate. The availability of the smaller wind farms (hours per year when the turbines are
available to generate electricity) tends to also be lower because fewer spare-parts are kept on-site and
turbine manufacturers are reluctant to provide rigorous guarantees on smaller wind farms. Parts
sourcing and supply chain is an important consideration, especially as wind farms age, so that wind farm
availability, and therefore production, are maximized. If a large number of turbines are in close
proximity with the same technology, the likelihood is higher that spares would be available regionally in
a shorter amount of time, contributing to a higher overall plant availability.
6.2.1. Purpose The purpose of this Turbine RFQ was to gather information for a financial model and to survey the
market to determine current market conditions and pricing. Each turbine has a specific production
profile for the wind resource and different operational and initial costs. The most relevant metric for
making a decision on the turbine is the lowest $/MWh cost over the lifetime of the project. AWS
Truepower provided energy calculations for the GE and Siemens turbines (Siemens did not respond to
the RFQ) and so a $/MWh lifecycle cost was factored into the financial model.
During the RFQ process, feedback was received that turbine manufacturers tend to be less interested in
small scale, one-time projects with a customer who does not have plans to develop additional projects.
Project efficiencies are generally gained starting with the sale of a quantity of 20 turbines. Smaller
quantities of turbines result in a loss of efficiency in manufacturing and transportation and therefore the
pricing may be higher or it may be difficult to get a manufacturer to respond or negotiate commercial
terms. Negotiating power can be achieved by purchasing large quantities of turbines over several years,
which puts the Tribe at a disadvantage relative to some of the large independent power producer
customers or utility customers of the turbine suppliers. For purposes of this project, it is realistic to
expect that the Tribe will not have much leeway to negotiate special provisions or pricing considerations
from turbine manufacturers. That being said, turbine manufactures vary in their willingness to negotiate
and market dynamics change quickly.
These negotiated terms and conditions during the initial turbine supply agreement and the long-term
service agreement are just as important as understanding the technical advantages of the various
turbine models, and so a discussion of some of those commercial terms is included below.
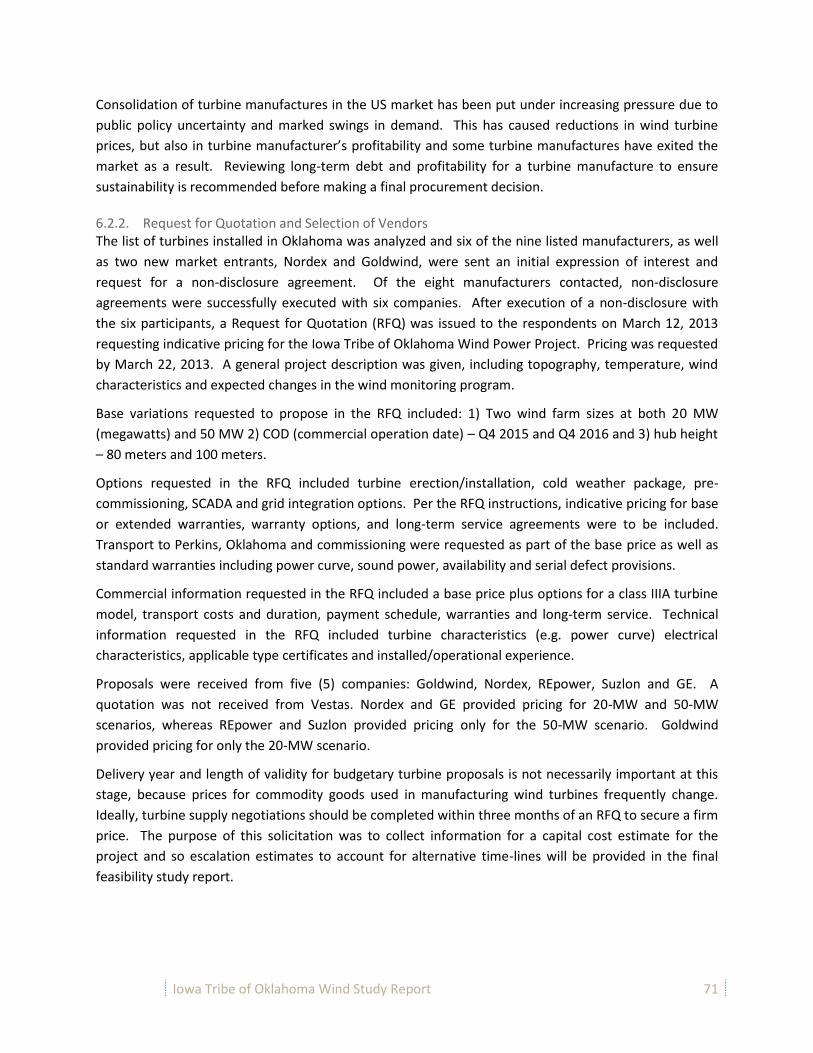
Iowa Tribe of Oklahoma Wind Study Report 71
Consolidation of turbine manufactures in the US market has been put under increasing pressure due to
public policy uncertainty and marked swings in demand. This has caused reductions in wind turbine
prices, but also in turbine manufacturer’s profitability and some turbine manufactures have exited the
market as a result. Reviewing long-term debt and profitability for a turbine manufacture to ensure
sustainability is recommended before making a final procurement decision.
6.2.2. Request for Quotation and Selection of Vendors The list of turbines installed in Oklahoma was analyzed and six of the nine listed manufacturers, as well
as two new market entrants, Nordex and Goldwind, were sent an initial expression of interest and
request for a non-disclosure agreement. Of the eight manufacturers contacted, non-disclosure
agreements were successfully executed with six companies. After execution of a non-disclosure with
the six participants, a Request for Quotation (RFQ) was issued to the respondents on March 12, 2013
requesting indicative pricing for the Iowa Tribe of Oklahoma Wind Power Project. Pricing was requested
by March 22, 2013. A general project description was given, including topography, temperature, wind
characteristics and expected changes in the wind monitoring program.
Base variations requested to propose in the RFQ included: 1) Two wind farm sizes at both 20 MW
(megawatts) and 50 MW 2) COD (commercial operation date) – Q4 2015 and Q4 2016 and 3) hub height
– 80 meters and 100 meters.
Options requested in the RFQ included turbine erection/installation, cold weather package, pre-
commissioning, SCADA and grid integration options. Per the RFQ instructions, indicative pricing for base
or extended warranties, warranty options, and long-term service agreements were to be included.
Transport to Perkins, Oklahoma and commissioning were requested as part of the base price as well as
standard warranties including power curve, sound power, availability and serial defect provisions.
Commercial information requested in the RFQ included a base price plus options for a class IIIA turbine
model, transport costs and duration, payment schedule, warranties and long-term service. Technical
information requested in the RFQ included turbine characteristics (e.g. power curve) electrical
characteristics, applicable type certificates and installed/operational experience.
Proposals were received from five (5) companies: Goldwind, Nordex, REpower, Suzlon and GE. A
quotation was not received from Vestas. Nordex and GE provided pricing for 20-MW and 50-MW
scenarios, whereas REpower and Suzlon provided pricing only for the 50-MW scenario. Goldwind
provided pricing for only the 20-MW scenario.
Delivery year and length of validity for budgetary turbine proposals is not necessarily important at this
stage, because prices for commodity goods used in manufacturing wind turbines frequently change.
Ideally, turbine supply negotiations should be completed within three months of an RFQ to secure a firm
price. The purpose of this solicitation was to collect information for a capital cost estimate for the
project and so escalation estimates to account for alternative time-lines will be provided in the final
feasibility study report.
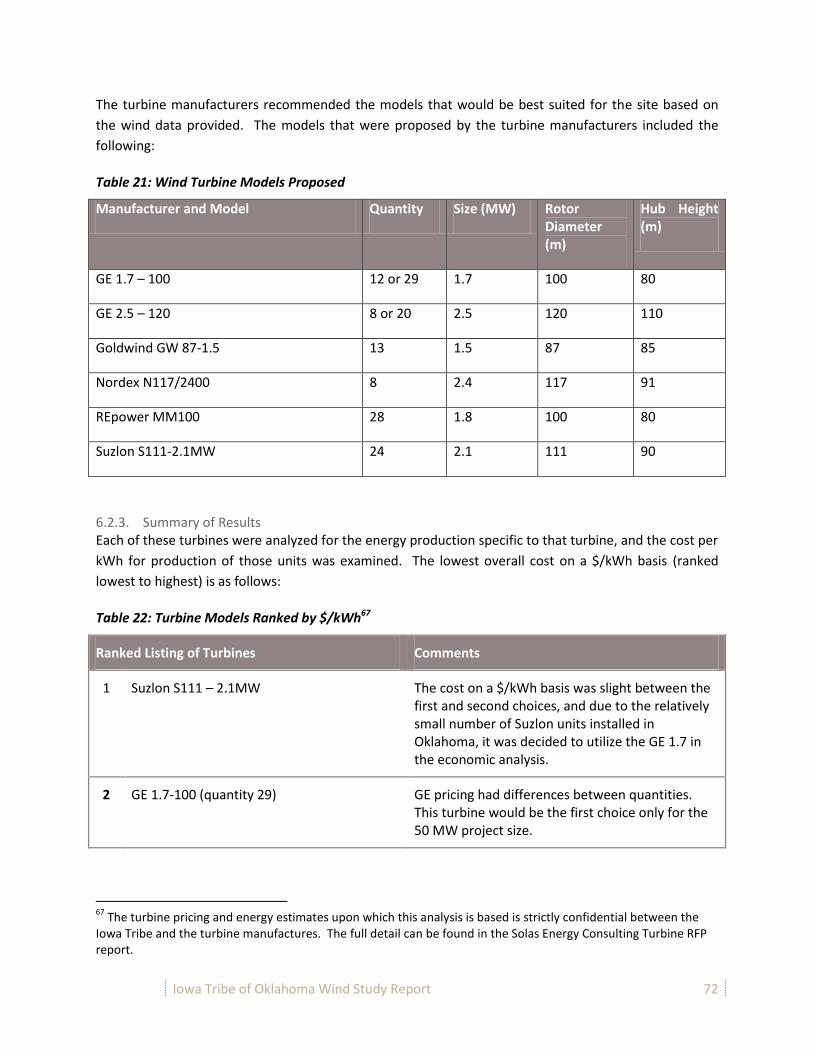
Iowa Tribe of Oklahoma Wind Study Report 72
The turbine manufacturers recommended the models that would be best suited for the site based on
the wind data provided. The models that were proposed by the turbine manufacturers included the
following:
Table 21: Wind Turbine Models Proposed
Manufacturer and Model Quantity Size (MW) Rotor Diameter (m)
Hub Height (m)
GE 1.7 – 100 12 or 29 1.7 100 80
GE 2.5 – 120 8 or 20 2.5 120 110
Goldwind GW 87-1.5 13 1.5 87 85
Nordex N117/2400 8 2.4 117 91
REpower MM100 28 1.8 100 80
Suzlon S111-2.1MW 24 2.1 111 90
6.2.3. Summary of Results Each of these turbines were analyzed for the energy production specific to that turbine, and the cost per
kWh for production of those units was examined. The lowest overall cost on a $/kWh basis (ranked
lowest to highest) is as follows:
Table 22: Turbine Models Ranked by $/kWh67
Ranked Listing of Turbines Comments
1 Suzlon S111 – 2.1MW The cost on a $/kWh basis was slight between the first and second choices, and due to the relatively small number of Suzlon units installed in Oklahoma, it was decided to utilize the GE 1.7 in the economic analysis.
2 GE 1.7-100 (quantity 29) GE pricing had differences between quantities. This turbine would be the first choice only for the 50 MW project size.
67
The turbine pricing and energy estimates upon which this analysis is based is strictly confidential between the Iowa Tribe and the turbine manufactures. The full detail can be found in the Solas Energy Consulting Turbine RFP report.
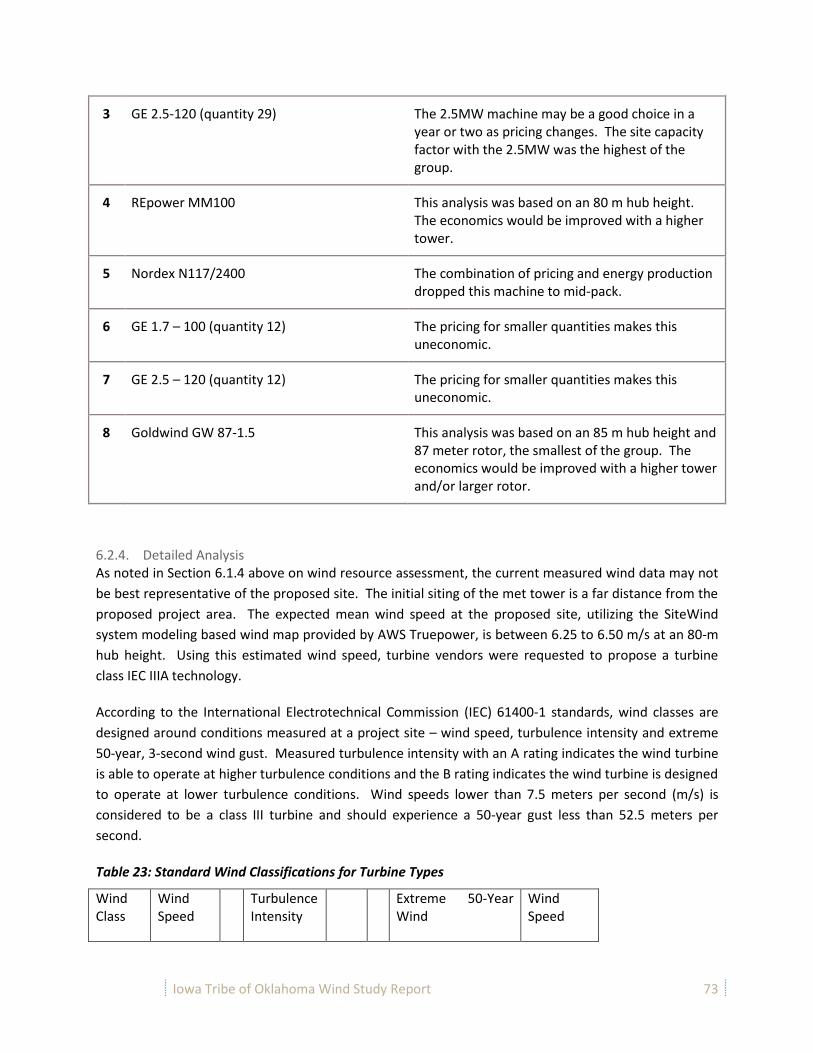
Iowa Tribe of Oklahoma Wind Study Report 73
3 GE 2.5-120 (quantity 29) The 2.5MW machine may be a good choice in a year or two as pricing changes. The site capacity factor with the 2.5MW was the highest of the group.
4 REpower MM100 This analysis was based on an 80 m hub height. The economics would be improved with a higher tower.
5 Nordex N117/2400 The combination of pricing and energy production dropped this machine to mid-pack.
6 GE 1.7 – 100 (quantity 12) The pricing for smaller quantities makes this uneconomic.
7 GE 2.5 – 120 (quantity 12) The pricing for smaller quantities makes this uneconomic.
8 Goldwind GW 87-1.5 This analysis was based on an 85 m hub height and 87 meter rotor, the smallest of the group. The economics would be improved with a higher tower and/or larger rotor.
6.2.4. Detailed Analysis As noted in Section 6.1.4 above on wind resource assessment, the current measured wind data may not
be best representative of the proposed site. The initial siting of the met tower is a far distance from the
proposed project area. The expected mean wind speed at the proposed site, utilizing the SiteWind
system modeling based wind map provided by AWS Truepower, is between 6.25 to 6.50 m/s at an 80-m
hub height. Using this estimated wind speed, turbine vendors were requested to propose a turbine
class IEC IIIA technology.
According to the International Electrotechnical Commission (IEC) 61400-1 standards, wind classes are
designed around conditions measured at a project site – wind speed, turbulence intensity and extreme
50-year, 3-second wind gust. Measured turbulence intensity with an A rating indicates the wind turbine
is able to operate at higher turbulence conditions and the B rating indicates the wind turbine is designed
to operate at lower turbulence conditions. Wind speeds lower than 7.5 meters per second (m/s) is
considered to be a class III turbine and should experience a 50-year gust less than 52.5 meters per
second.
Table 23: Standard Wind Classifications for Turbine Types
Wind Class
Wind Speed
Turbulence Intensity
Extreme 50-Year Wind
Wind Speed

Iowa Tribe of Oklahoma Wind Study Report 74
(3 second gust)
I 10 m/s A 18% I 70 m/s
II 8.5 m/s II 59.5 m/s
III 7.5 m/s B 16% III 52.5 m/s
IV 5 m/s IV 42.0 m/s
6.2.3.1 Energy Production for the Turbines Wind turbines convert the mechanical energy of the wind into electrical energy through the use of a
generator and other equipment housed within the turbine. Each wind turbine has a specific production
profile that works best in a particular wind profile. The measurement of a wind turbine’s ability to
produce power over a specific wind regime is the turbine’s power curve, and as such, each of the 5 wind
turbines being evaluated has a unique power curve. A power curve is the graph of the power output of
a wind turbine at a particular wind speed. Typical wind turbines begin generating at about 3.5 m/s and
cut out at around 25 m/s. Figure 9 shows a generic power curve for a wind turbine.
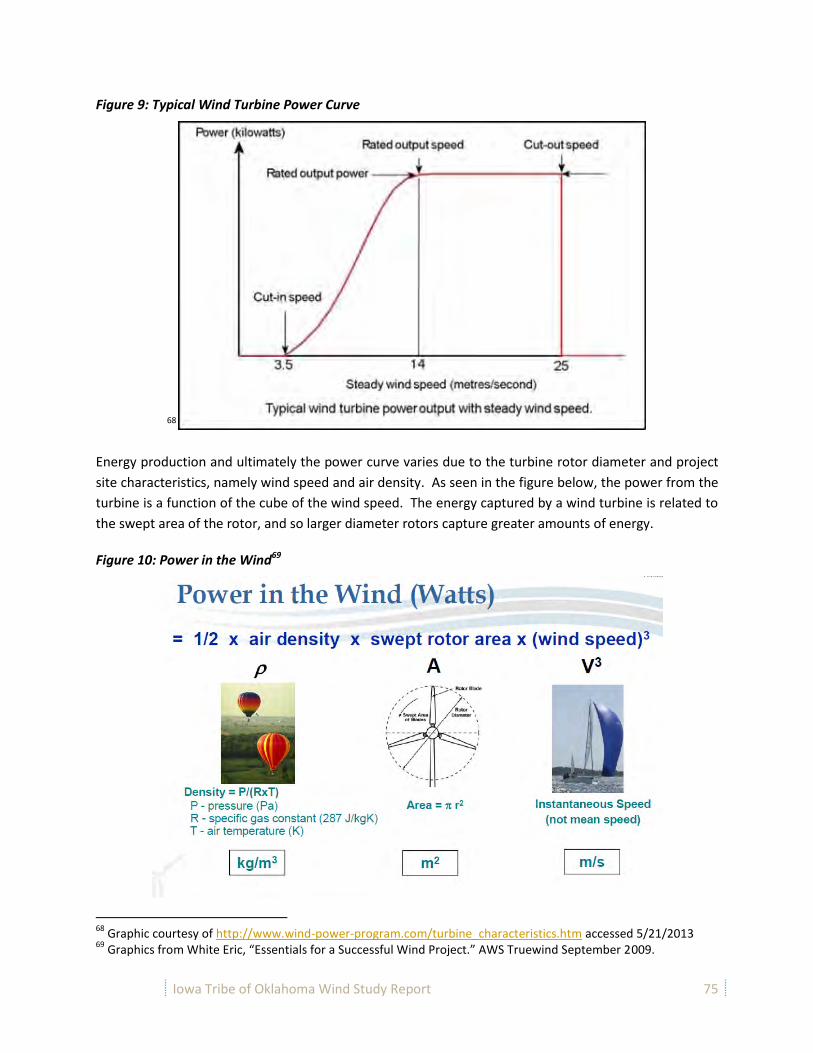
Iowa Tribe of Oklahoma Wind Study Report 75
Figure 9: Typical Wind Turbine Power Curve
68
Energy production and ultimately the power curve varies due to the turbine rotor diameter and project
site characteristics, namely wind speed and air density. As seen in the figure below, the power from the
turbine is a function of the cube of the wind speed. The energy captured by a wind turbine is related to
the swept area of the rotor, and so larger diameter rotors capture greater amounts of energy.
Figure 10: Power in the Wind69
68
Graphic courtesy of http://www.wind-power-program.com/turbine_characteristics.htm accessed 5/21/2013 69
Graphics from White Eric, “Essentials for a Successful Wind Project.” AWS Truewind September 2009.

Iowa Tribe of Oklahoma Wind Study Report 76
In a low wind resource, such as the wind resource for the Iowa Tribe Project, larger rotor diameters are
used to capture more of the wind’s energy. Generally, rotor diameters for IEC class III turbines (lower
resource) will be larger than IEC class I and II rotor diameters - capturing more kinetic energy from the
slower wind. Generally, a higher ratio of rotor diameter to rated power will also produce higher energy
production at lower wind speed sites.
Another phenomenon related to wind speed is the increase of wind speed with an increase in height
above the ground; this is known as wind shear (see figure for example). It is common practice when
designing a wind project to evaluate whether an increase in the hub height of a turbine (ie. higher
tower), to take advantage of the wind shear effect, will produce a more economical project than a
shorter turbine, which would be subjected to lower wind speeds. A higher hub height requires more
steel, resulting in a higher turbine cost; however, this higher cost may be off-set by the increase in
production due to the wind shear effect, and so this is the reason why two different tower heights were
evaluated. The additional cost of the higher hub height must be weighed against the additional revenue
from power generation to determine if the cost outweighs the benefits. Ideally, this calculation is done
using an internal rate of return (IRR) model to capture performance over the life of the project.
Figure 11: Example of Wind Shear69
More recent turbines installed in the United States typically have an 80-m hub height, but 100-m hub
heights are becoming more common, and quotations were received for hub heights up to 120 meters.
Although the Federal Aviation Administration (FAA) has not set a specific limit on the height of a turbine,
a limit of 500 feet (152.4 meters) has been used as a benchmark for structure height (hub height plus
half the rotor diameter). This is based on the current definition of navigable airspace70,71. The FAA
70
http://www.faa.gov/air_traffic/publications/atpubs/AIR/air0603.html 71
http://www.masscec.com/index.cfm/pk/download/pid/11163/id/11645

Iowa Tribe of Oklahoma Wind Study Report 77
considers navigable airspace to be the flight accent and decent paths, as well as all airspace that is more
than 500 ft above ground level (AGL). In general, a greater chance of a turbine being classified as an
aviation hazard exists if the overall structure height exceeds 500 ft, due to a Visible Flight Rule (VFR)
routes. A VFR route are typically land features or rivers that can be used by pilots to navigate. The
Cimarron River may be ruled a VFR. While this does not necessarily preclude turbines from being
installed above 500 ft, it may make the project more sensitive to FAA regulations or more costly to
permit. VFR routes are most commonly along easily distinguishable land features or water ways. It is
likely that the Cimarron River would be considered a primary VFR route, which could have an impact on
the ability of the Iowa Nation project to utilize taller towers and/or much larger rotor diameters.
Energy production estimates can be calculated using a number of software programs. Characteristics of
the wind (e.g. speed, intensity, duration) recorded at the site are matched up with the turbine power
curve to calculate estimated annual energy production. AWS Truepower performed this analysis for the
turbines proposed under the RFQ.
A common term used to compare turbine performance at a particular project site is capacity factor. The
capacity factor (CF) is defined as the percentage of power produced by the plant in relation to the
potential power of the generation facility (installed capacity). Given the low wind speeds at the Iowa
Tribe site, the capacity factor for the turbines was expected to be in the mid to low 30% range. Accurate
wind measurement is the number one factor in determining accurate wind energy production forecasts,
and it should be noted that no actual on-site data for the proposed project area was available, as the
installed met mast is located more than 20 km from site, and so the uncertainty in AWS Truepower’s
projections is high. Installation of a met mast within the project boundary can increase the confidence
in the estimations.
6.2.3.2 Technical Characteristics The wind turbine selected for the project needs to be technically compliant with the project
requirements. Electrical characteristics are not identical for all turbine manufacturers and models.
Although all the electrical requirements for this project are not yet known from the utility/transmission
provider, general electrical requirements for all projects include fault ride through (zero voltage ride
through) and extended frequency ranges. These features keep the turbine on-line during a minor
system or utility fault or frequency variation. Each utility has specific grid requirements and those
requirements can change; thus, the actual electrical characteristics of the units need to be considered
and evaluated by the utility pursuant to a facilities study and interconnection agreement. The
evaluation of the electrical compatibility of the turbines to the grid is outside of the scope of this
evaluation. Once the system impact study (SIS) has been completed, electrical characteristics required
by the Federal Energy Regulatory Commission (FERC) should be clearer.
An international standard exists which applies to the design and certification of wind turbines. This
standard, International Electrotechnical Commission (IEC) 61400-1, specifies the design life, loads, and
requirements for wind turbines and their components. Multiple different organizations conduct the

Iowa Tribe of Oklahoma Wind Study Report 78
testing of the wind turbines to this standard, and issue a certification of the type of turbine to the
particular wind class as specified by the IEC. Some of the organizations that provide design and
manufacturing certifications include: Germanischer Lloyd (GL), Bureau Veritas, TÜV Nord, and DNV
KEMA. Technical certifications are important because debt and equity lenders require this information
in order to loan money to the project. This certification is specific with respect to origin/design of
components. During the development process, the wind turbine manufacturer will review the site
specific loads on the turbine estimate by the climatologic data collected, and provide a mechanical loads
review or suitability review to ensure that those loads are within the design envelope of the wind
turbine certification.
Another consideration in addition to the certifications of the turbine is the turbine Supervisory Control
And Data Acquisition system (SCADA). The SCADA system provides the monitoring of the performance
of the wind turbines and the information needed to operate and maintain the turbines. The SCADA
system allows the Owner to remotely reset turbines for a majority of the types of turbine faults that are
encountered during standard operations, as well as provides valuable information about the output and
performance of the units. Choosing the right SCADA system should be carefully considered because it
will impact your interface with the turbine manufacture during the warranty period (and/or long-term
service), the asset management procedures followed and your interface with the utility. An evaluation
should be made for various factors including the structure of 24/7 monitoring of the operations of the
turbines, data backup and hardware/software design. For a stand-alone wind farm such as is proposed
for the Iowa Tribe of Oklahoma Wind Project, the hardware/software design should not be overly
complex, as it may be for an Independent Power Producer (IPP) that has a number of wind farms that
are monitored as an aggregate.
6.2.3.3 Contractual Agreements Aside from technical characteristics of the wind turbine that is used to calculate revenue, a number of
other factors should be taken into consideration when selecting a turbine manufacture. Contractual
agreements during the construction/erection period and long-term agreements during the operational
life of the wind farm directly impact the revenue and profitability of the wind farm.
Typically, turbine manufacturers include a two year Performance Warranty in the base price of the
turbine, as long as the Purchaser contracts the manufacture as the Service provider. The Performance
Warranty includes provisions for i) Power Curve Guarantee (how much energy will be generated); ii)
Sound Power (how noisy the turbine is); and iii) Availability (how many hours per year the turbine is
available to run, excluding any planned maintenance or other external factors such as a grid shut-down).
Provisions for the Power Curve and Sound Power Guarantees are typically found in the Turbine Supply
Agreement (TSA) and the Availability Guarantee is typically found in the long-term Service Agreement.
This is noteworthy because the objective of the wind project is to generate the maximum amount of
electricity possible over the life of the facility and the power and availability are the key factors to
maximizing production. Wind power projects have a larger up-front capital cost and reduced operating
costs, primarily because the cost of the fuel (the wind) is free. Therefore, once the equipment is
installed, you want to get the maximum value out of it – the most mega-watt hours (MWh) generated

Iowa Tribe of Oklahoma Wind Study Report 79
over the life of the equipment possible. The majority of the operating costs are focused on this aspect,
with many projects electing to pay a slightly less reduced operations fee to have quality parts and
technicians, improving the overall productivity of the turbines (availability).
Because the Iowa Tribe does not own and operate other wind power facilities, is it is recommended that
the Tribe consider purchasing an extended equipment warranty from the manufacturer which will most
likely be bundled with a long-term Service Agreement. One advantage of this Service/Warranty bundle
is that the turbine manufacture should include an Availability Guarantee for the duration of the long-
term Service Agreement rather than just the initial two-year Warranty. The Availability Guarantee is
designed to motivate the wind farm technicians (turbine manufacture in this case) to operate the wind
farm at the highest possible energy production (i.e. revenue!). Exclusions to the Availability Guarantee
will include periods when the wind turbines are not “available” such scheduled maintenance, utility/grid
outages, Owner requested shut-downs and force majeure. If the wind turbine experiences down time at
fault of the Service provider, this will count against the availability calculation. If the Availability
Guarantee is not met, the Service provider will be required to pay the wind farm owner liquidated
damages (LDs) for energy production losses. If the operating hours are above the Availability
Guarantee, there may be a provision for the Service provider to receive a bonus payment. These types
of provisions are common with service agreements and are expected by project lenders and equity
participants.
With respect to the Power Curve and Sound Power Guarantees, it is important to understand both what
the guarantee is and what the manufacture’s liability is if the guarantee is not filled. Sound restrictions
are generally imposed by the county and zoning provisions. No sound restrictions were identified in the
location proposed for the Iowa Tribe’s project based on conversations with local permitting authorities;
so, Sound Power may not be a critical guarantee to negotiate with manufacturers. However, due to the
close proximity of many residents and the Tribe’s own facilities, the Tribe should definitely consider the
sound power of the respective manufacturers in the context of being a good neighbor in the community.
The guaranteed limit by manufacturers is expressed as a decibel A-weighted (dBA) level. Some
manufactures express the guarantee as a percent (i.e. 95%), so this should also be noted. The Power
Curve Guarantee is critical because losses over a 20-year period can reach millions of dollars for a
project of this size if a project is required to implement a noise reduction strategy.
The calculation for LDs for not meeting the power curve guarantee may be for one or more turbines and
one or more years. If the calculation for losses is generous, it may multiply production losses by all
turbines in the wind farm and twenty years, which is the typical design life of a turbine. However, the
limit of liability for the Power Curve Guarantee will most likely be reached before the result of that
calculation. The power curve guarantee generally requires the completion of a power performance test,
including installation of permanent meteorological towers, which is typically completed at the cost of
the developer. Preparing a wind farm for a power performance test should take place during turbine
negotiations, because one or more turbines should be selected for the measurement prior to
completion of the final wind farm layout.

Iowa Tribe of Oklahoma Wind Study Report 80
In addition to limits of liability associated with the Performance Warranty, limits of liability are given for
performance of supply, delivery and commissioning in the TSA. If the Purchaser experiences delay due
to the fault of the manufacture, the project schedule will suffer and financial damages will incur. LDs
are meant to cover these financial losses, but they may not cover all losses associated with delay. LDs
are typically assessed on a per-turbine per-day rate for delivery, turbine completion and commissioning
(or any other performance-related activities associated with the turbine manufacture). The LDs will
have a maximum upper allowable limit of liability in the contract because the turbine manufacture also
needs to protect their losses in the event of a delay. In addition to limits of liability for LDs and the
Performance Warranty, an Overall Limit of Liability is assessed for the TSA, which covers all other
contractual liabilities. This is typically set at 100% of the contract price, but can vary depending on the
manufacturer.
6.2.3.4 Project Execution and Experience Project management during the construction phase of the wind project is critical to bringing the wind
farm online, within budget. Once the TSA has been signed, the turbine manufacturer will assign a
project manager responsible to communicate delivery of components, status of turbine completion
after erection and commissioning. If any delays occur during this process, the entire project schedule
will suffer, impacting third party contractors performing civil works at the site.
6.2.3.5 Long Term Operations
As mentioned above, procuring turbines for a wind energy project has significant up-front capital costs.
Although the long-term operating costs are lower due to the free cost of the fuel, the long-term
operating performance is also crucial for a project’s profitability. The lowest price turbine model is not
always the logical choice for turbine procurement, because the project is designed to operate a
minimum of 20 years, not just one year. The Service team will need a minimum of two service
technicians regardless of the number of turbines at the site. A general rule of thumb is two service
technicians for twenty turbines, but a third technician is most likely required for rotation. If the wind
farm comprises ten turbines, Service costs may be higher on a per-turbine basis so working with a
turbine manufacture or independent contractor with other projects nearby can help manage costs.
6.3. Land Strategy and Development Work72
6.3.1. Description of Project Area
The 50 MW project area boundary covers approximately 7,860 acres and is comprised of parcels owned
by the Iowa Tribe, the State of Oklahoma, and private owners. The 20 MW project area lies within the
50 MW boundary and is approximately 2,875 acres. Both project boundaries are considered to be
conceptual and subject to modification based on landowner participation.
Tribal parcels are not contiguous, necessitating the acquisition of private and possibly State parcels to
enable the project footprints.
72
This section provided by Solas Energy Consulting US Inc.

Iowa Tribe of Oklahoma Wind Study Report 81
The 50 MW boundary will be the focus of the land strategy effort since the 20 MW project area can be
carved out of the larger effort once contiguous landowner participation is better understood. Of the
approximate 7,860 acres approximately 1,328 acres (17%) of the land is tribal trust, restricted or fee
land; approximately 6,492 acres (83%) is private, and roughly 40 acres (0.01%) is owned by the State of
Oklahoma.
Figure 12: Land Map of Proposed Project Area
6.3.2. Leasing Processes for Various Land Types (Tribal, Private and State)
Tribal Land (Under Bureau of Indian Affairs (BIA) jurisdiction)
The following section is based on a legal memo73 prepared by Doerner, Saunders, Daniel & Anderson, L.L.P for this feasibility study summarizing the land acquisition procedure for land under BIA jurisdiction.
Several different types of Iowa tribal parcels exist within the project area including trust property, restricted Indian land, and land that the Iowa Tribe owns in fee. The trust and restricted property lies under the jurisdiction of the Bureau of Indian Affairs (BIA), which is part of the U.S. Department of
73
Christensen, Matthew L. “Procedure for Acquiring Lease on Real Estate Subject to the Bureau of Indian Affairs Jurisdiction” Doerner, Saunders, Daniel & Anderson, L.L.P, May 21, 2013.
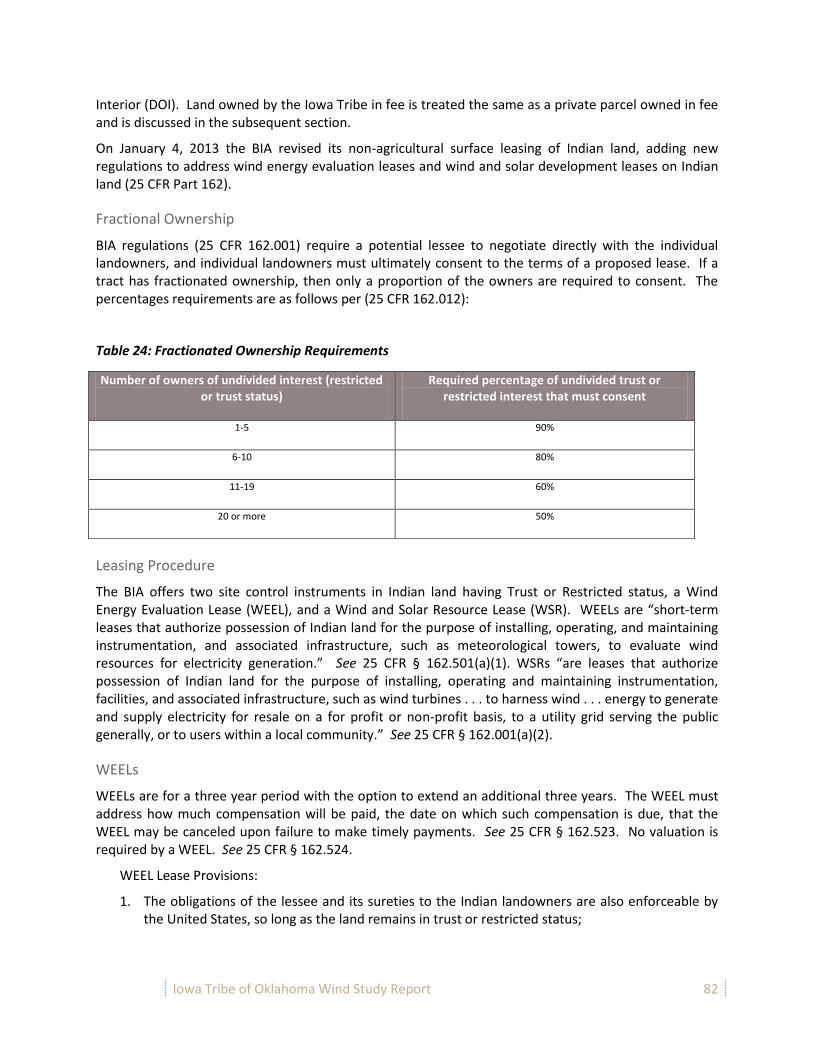
Iowa Tribe of Oklahoma Wind Study Report 82
Interior (DOI). Land owned by the Iowa Tribe in fee is treated the same as a private parcel owned in fee and is discussed in the subsequent section.
On January 4, 2013 the BIA revised its non-agricultural surface leasing of Indian land, adding new regulations to address wind energy evaluation leases and wind and solar development leases on Indian land (25 CFR Part 162).
Fractional Ownership
BIA regulations (25 CFR 162.001) require a potential lessee to negotiate directly with the individual landowners, and individual landowners must ultimately consent to the terms of a proposed lease. If a tract has fractionated ownership, then only a proportion of the owners are required to consent. The percentages requirements are as follows per (25 CFR 162.012):
Table 24: Fractionated Ownership Requirements
Leasing Procedure
The BIA offers two site control instruments in Indian land having Trust or Restricted status, a Wind Energy Evaluation Lease (WEEL), and a Wind and Solar Resource Lease (WSR). WEELs are “short-term leases that authorize possession of Indian land for the purpose of installing, operating, and maintaining instrumentation, and associated infrastructure, such as meteorological towers, to evaluate wind resources for electricity generation.” See 25 CFR § 162.501(a)(1). WSRs “are leases that authorize possession of Indian land for the purpose of installing, operating and maintaining instrumentation, facilities, and associated infrastructure, such as wind turbines . . . to harness wind . . . energy to generate and supply electricity for resale on a for profit or non-profit basis, to a utility grid serving the public generally, or to users within a local community.” See 25 CFR § 162.001(a)(2).
WEELs
WEELs are for a three year period with the option to extend an additional three years. The WEEL must address how much compensation will be paid, the date on which such compensation is due, that the WEEL may be canceled upon failure to make timely payments. See 25 CFR § 162.523. No valuation is required by a WEEL. See 25 CFR § 162.524.
WEEL Lease Provisions:
1. The obligations of the lessee and its sureties to the Indian landowners are also enforceable by the United States, so long as the land remains in trust or restricted status;
Number of owners of undivided interest (restricted or trust status)
Required percentage of undivided trust or restricted interest that must consent
1-5 90%
6-10 80%
11-19 60%
20 or more 50%

Iowa Tribe of Oklahoma Wind Study Report 83
2. There must be no unlawful conduct, creation of nuisance, illegal activity, or negligent use or waste of the leased premises;
3. The lessee must comply with all applicable laws, ordinances, rules, regulations and other legal requirements under 25 CFR § 162.014.
4. If historic properties, archeological resources, human remains, or other cultural items, not previously reported are encountered during the course of any activity associated with this lease, all activity in the immediate vicinity of the properties, resources, remains, or items will cease, and the lessee will contact the BIA and the tribe with jurisdiction to determine how to proceed and appropriate disposition.
5. BIA has the right, at any reasonable time during the term of the lease, and upon reasonable notice, in accordance with 25 CFR § 162.589, to enter the leased premises for inspection; and
6. BIA may, at its discretion, treat as a lease violation any failure by the lessee to cooperate with a BIA request to make appropriate records, reports, or information available for BIA inspection and duplication.
Unless otherwise prohibited by law, the lease must also contain the following provisions:
1. The lessee holds the United States and the Indian landowners harmless from any loss, liability, or damages resulting from the lessee’s use or occupation of the leased premises.
2. The lessee indemnifies the United States and the Indian landowners against all liabilities or cost relating to the use, handling, treatment, removal, storage, transportation, or disposal of hazardous materials, or the release or discharge of any hazardous material from the leased premises that occurs during the lease term, regardless of fault, with the exception that the lessee is not required to indemnify the Indian landowners for liability or cost arising from the Indian Landowners’ negligence or willful misconduct.
WSRs
WSRs require a valuation, proof of insurance, performance bond or other security, statement of conformance with tribal law and Federal and tribal environmental and land use requirements. A resource development plan describing improvements and a schedule are also required along with a restoration plan, documentation of technical ability, legal land description, and organizational documentation of the legal entity of the lessee.
WSR Lease Provisions
A WSR must set a definite lease term. The maximum term of a WSR is twenty-five years (25) with an option to renew the lease for an additional twenty five (25) year term. See 25 CFR § 162.540. The required provisions of a WSR Lease are mandated in 25 CFR § 162.542 and are substantially similar to the required provisions discussed above regarding WEEL Provisions.
1. A WSR must address the (i) the nature of permanent improvements 25 CFR § 162.544 and (ii) removal requirements of permanent improvements 25 CFR § 162.545.
2. A WSR must require the lessee to comply with the following “due diligence requirements”:
a) Commence installation of energy facilities within 2 years after the effective date of the lease or consistent with a timeframe in the resource development plan;
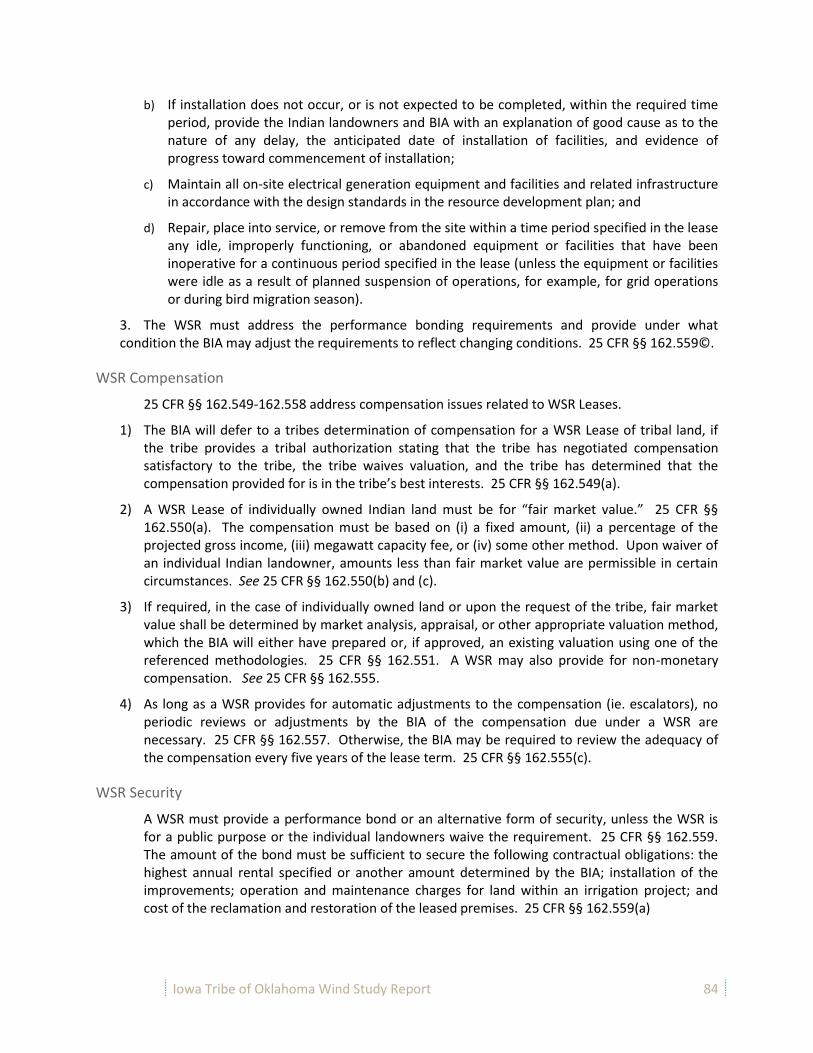
Iowa Tribe of Oklahoma Wind Study Report 84
b) If installation does not occur, or is not expected to be completed, within the required time period, provide the Indian landowners and BIA with an explanation of good cause as to the nature of any delay, the anticipated date of installation of facilities, and evidence of progress toward commencement of installation;
c) Maintain all on-site electrical generation equipment and facilities and related infrastructure in accordance with the design standards in the resource development plan; and
d) Repair, place into service, or remove from the site within a time period specified in the lease any idle, improperly functioning, or abandoned equipment or facilities that have been inoperative for a continuous period specified in the lease (unless the equipment or facilities were idle as a result of planned suspension of operations, for example, for grid operations or during bird migration season).
3. The WSR must address the performance bonding requirements and provide under what condition the BIA may adjust the requirements to reflect changing conditions. 25 CFR §§ 162.559©.
WSR Compensation
25 CFR §§ 162.549-162.558 address compensation issues related to WSR Leases.
1) The BIA will defer to a tribes determination of compensation for a WSR Lease of tribal land, if the tribe provides a tribal authorization stating that the tribe has negotiated compensation satisfactory to the tribe, the tribe waives valuation, and the tribe has determined that the compensation provided for is in the tribe’s best interests. 25 CFR §§ 162.549(a).
2) A WSR Lease of individually owned Indian land must be for “fair market value.” 25 CFR §§ 162.550(a). The compensation must be based on (i) a fixed amount, (ii) a percentage of the projected gross income, (iii) megawatt capacity fee, or (iv) some other method. Upon waiver of an individual Indian landowner, amounts less than fair market value are permissible in certain circumstances. See 25 CFR §§ 162.550(b) and (c).
3) If required, in the case of individually owned land or upon the request of the tribe, fair market value shall be determined by market analysis, appraisal, or other appropriate valuation method, which the BIA will either have prepared or, if approved, an existing valuation using one of the referenced methodologies. 25 CFR §§ 162.551. A WSR may also provide for non-monetary compensation. See 25 CFR §§ 162.555.
4) As long as a WSR provides for automatic adjustments to the compensation (ie. escalators), no periodic reviews or adjustments by the BIA of the compensation due under a WSR are necessary. 25 CFR §§ 162.557. Otherwise, the BIA may be required to review the adequacy of the compensation every five years of the lease term. 25 CFR §§ 162.555(c).
WSR Security
A WSR must provide a performance bond or an alternative form of security, unless the WSR is for a public purpose or the individual landowners waive the requirement. 25 CFR §§ 162.559. The amount of the bond must be sufficient to secure the following contractual obligations: the highest annual rental specified or another amount determined by the BIA; installation of the improvements; operation and maintenance charges for land within an irrigation project; and cost of the reclamation and restoration of the leased premises. 25 CFR §§ 162.559(a)

Iowa Tribe of Oklahoma Wind Study Report 85
The following forms of security are acceptable: (i) certificates of deposit; (ii) irrevocable letters of credit; (iii) negotiable treasury securities; (iv) surety bonds. 25 CFR §§ 162.560.
Parcels Owned in Fee by Private and Tribal Entities Parcels owned in fee are private parcels owned by individuals or entities and are not subject to BIA or
State of Oklahoma jurisdiction. This includes parcels owned by the Iowa Tribe that are not held in Trust
or Restricted status. This is the most straightforward of the three discussed leasing process. It involves
the project company offering a lease contract directly to the landowner and entering into bilateral
negotiations between the two parties in an effort to come to terms on a contractual agreement in the
form of a lease.
Lease terms typically vary from lease to lease depending on the outcomes of the lease negotiations. The
form of lease for the fee parcels are discussed in further detail in the “Lease Forms” section below. They
include up to a seven year development term, and a thirty year operations term. The initial term would
be based on a dollar per acre rate, and the operations term would be rate based on a percentage of the
gross revenue generated by the project with a floor minimum payment based on a dollar per Megawatt
rate.
Provisions also addressed in the form include taxes, owner and lessee’s representation, warranties and
covenants, assignment, Subleasing and cure, access and transmission easements, mortgagee protection;
default and termination, as well as miscellaneous provisions like force majeure and confidentiality.
Iowa tribal parcels owned in fee are considered to be the easiest tribal parcels to lease from a process
standpoint given the lack of BIA jurisdiction, which enables a more streamlined decision making process
between the landowner and the project proponent.
Parcels owned by the State of Oklahoma
Land owned by the Oklahoma Commissioners’ of Land Office, also known as the School Land Commission (SLC) lies within the 50MW project area. The parcel of interest is approximately 160 acres and is currently leased for grazing and timber.
A Doerner, Saunders, Daniel & Anderson, L.L.P memo74 provides a description of the lease form and procedure. The lease process as described in the Memo is outlined below.
The SLC lease form contemplates two phases. Phase I is a three year term for inspection and determination for feasibility for wind energy purposes intended for research and analysis. It may be extended an additional two years due to unforeseen delays. Phase II is intended to last 25 years. The maximum term of any lease is 55 years, but the SLC’s preferred term for wind is between 25 and 30 years.
The terms of each lease must be approved by the SLC, which includes five positions within the Oklahoma Government: the Governor, Lieutenant Governor, State Auditor and Inspector, Superintendent of Public Instruction, and the President of the Board of Agriculture. The Governor executed the final lease.
74
Christensen, Matthew L.“Procedure For Acquiring Lease From Oklahoma Commissioner's of the Land Office of the State of Oklahoma.” Doerner, Saunders, Daniel & Anderson, L.L.P, May 17, 2013

Iowa Tribe of Oklahoma Wind Study Report 86
SLC property must be appraised based on its fair market value by the appraiser of the SLC.
The lease must also be submitted to a public bidding process, with bids that must exceed the minimum fair market value established by the appraiser. The successful high bidder shall pay one-half of the annual rental at the time of auction.
The negotiation, approval and bidding process can take between two and six months.
6.3.3. Acquisition Strategy
The land acquisition strategy is based on the larger 50 MW project area and includes the use of tribal,
private and state lands. While a conceptual boundary exists for the 20 MW site, the successful
acquisition of the parcels within that specific boundary is currently unknown without landowner
feedback, and strategic negotiation flexibility would be gained from having the optionality of nearby
parcels within the 50 MW boundary, so the initial 20 MW contiguous area would be identified after
landowner contacts had been made for the larger area.
Parcel Breakdown
Based on the conceptual layout and all ancillary facilities within the 50 MW project boundary,
approximately 75 individual parcels would need to be acquired. To prioritize the effort, parcels are
grouped into three tiers. Tier 1 tracts are those parcels where turbines and infrastructure
improvements (interconnection, service roads) would be installed. Tier 2 tracts are smaller tracts
needed solely for access and transmission. Tier 3 tracts are those required for non-disturbance, setback
and/or upwind or downwind buffer areas for the turbines. Forty-five (45) parcels are Tier 1, eight (8) are
Tier 2 parcels, and twenty-two (22) are Tier 3 parcels. The locations of these parcels are depicted on the
Land Acquisition Strategy Map75.
The majority of the project infrastructure lies on tribal parcels owned in fee, which for the purpose of
leasing is an identical process to other privately owned land. Under the current layout, only two parcels
have trust or restricted status, which fall under the jurisdiction of the BIA. Only one of those two parcels
has a fractional ownership requiring the consent of multiple owners (see Fractional Ownership).
Implementation
Private Lease Tracts:
The projected acquisition time frame is twelve (12) months to negotiate and acquire the leasehold
interests. The acquisition team is recommended to include the following professionals: (1) field agent
(2) attorney, (3) title agent, and (3) project manager. The field agent will be responsible for field
activities including direct negotiations with the landowners, execution of the contracts and facilitating
payment to the landowners. The attorney will draft the lease documents to support the field agent’s
activities. The title agent should be one of the earliest team entrants to facilitate issuance of the title
abstracts for drafting of the lease contracts with the proper parties, legal descriptions, etc. Project
75
Bergen, Christopher W. “Land Acquisition Strategy Tiers” (map) Altis Energy Services LLC, May 10, 2013

Iowa Tribe of Oklahoma Wind Study Report 87
management oversight is key for purposes of directing strategy, negotiations, priorities and budgeting
compliance.
Tribal Lease Tracts:
A potential Lessee is required to negotiate directly with individual landowners and individual
landowners must ultimately consent to the terms of a proposed lease. If a tract has fractionated
ownership, then only a proportion of the landowners are required to consent in the percentages as is
provided in Table 24: Fractionated Ownership Requirements.
Upon receipt of a WSR lease proposal, the BIA will notify the Lessee if it is complete or not. If the
package is complete, within sixty (60) days of receipt, the BIA will either approve or disapprove the
lease, return for revision, or inform the Lessee that more time is needed to review the lease. If the BIA
requests additional information, , then the Lessee has fifteen (15) days to respond to the concerns
raised by the BIA. The BIA will have thirty (30) days from sending the letter requesting additional time
to either approve or disapprove the proposed lease.
SLC Lease Tracts:
Land owned and managed by the SLC is leased for agricultural and commercial purposes subject to
Oklahoma State Land Commission regulations and laws. The lease terms, which likely will be negotiated
with SLC staff, will need to be approved by the SLC at one of the regularly scheduled meetings and
ultimately the lease be executed by the Governor. The fair market value of the property will need to be
determined by an SLC appraiser. The property must also be submitted to the public bidding process and
bid on at a public auction. The process will take between two (2) and six (6) months.
6.3.4. Lease Forms
Private Lease Form76:
A form of lease agreement for use with the private parcels was developed by Solas Energy Consulting.
This Lease form (the “Private Lease’) is in a format that has been reviewed extensively by debt and
equity financing counsel for use in several hundred megawatts of wind energy projects developed across
the United States. The general terms and provisions have been determined to be reasonable and
acceptable in typical third-party commercial financing transactions including landowner, debt and equity
counsel. The form of agreement has been provided to the Tribe under separate cover, however was
deemed commercially sensitive and not provided herewith.
General Terms and Provisions:
The lease includes a broad right to develop all components of the wind energy project including
transmission, substations, operations and maintenance buildings, access and other critical project
improvements. In addition, the lease includes appropriate references to pertinent legislation as set
forth in the State of Oklahoma Wind Energy Development Act effective as of January 1, 2011 which
addresses the state policies relative to wind energy development.
76
Centera, Kim “Private Lease Form” May 2013

Iowa Tribe of Oklahoma Wind Study Report 88
The lease consists of two terms: (i) an initial period generally consisting of up to five (5) years during
which the Lessee has the right to determine feasibility of the project and commence pre-construction
and construction activities associated with the project and (ii) the operations date of the project defined
as when the project first begins to deliver electrical energy in commercial quantities. During the initial
period, Lessee pays only annual rent commencing with the execution date of the lease and continuing
through the operations date of the project.
Following commencement of the operations period, Lessee pays Owner a percentage of the gross
revenues as offset by minimum rent on an installed Megawatt basis on a quarterly basis, or if no
turbines are installed on the property, minimum rent is paid annually solely based upon the number of
acres leased for purposes of buffer or wind non-interference. The actual economic terms are not
provided in this report as the information is deemed to be commercially sensitive; however, those terms
are in the form of lease provided to the Tribe.
Percentage rent is adjusted every ten (10) years commencing with the operations date of the project.
The Private Lease includes a right to terminate by Lessee upon thirty (30) days’ notice to Owner without
payment or penalty. Owner is restricted from interfering with the Lessee’s use of the property in its
entirety.
The Private Lease does not include a provision for bonding for removal of the improvements because
such requirement must be satisfied separately in accordance with the Oklahoma Corporation
Commission statute.
The Private Lease includes typical cure rights for assignees and commercial lenders (mortgagees)
together with a right to assign the lease for benefit of a lender without a right of Owner consent or
approval.
Lastly, the Private Lease includes a covenant by the Owner to grant access, transmission and facility
easements (substations and operations & maintenance building) upon request by Lessee for both
present and future projects with no additional payments to Owner, provided that Lessee has installed
wind turbines on the leased property.
Tribal Lease Form77:
As previously discussed, the BIA procedures allow for two (2) different general types of lease formats –
(i) short-term evaluation lease for the purpose of installing and maintaining meteorological towers, or
Wind Energy Evaluation Leases (“WEELS”), and (ii) Wind and Solar Resource Leases or (“WSR’s”) which
are intended as longer-term and more permanent use of the property for purposes of installation of a
wind energy project. For purposes of this discussion, we have focused on the requirements of the WSR
lease because we believe it to be more applicable to the present acquisition strategy based upon our
understanding of the intended use of the property.
77
Centera, Kim “BIA Tribal Lease Form” May 2013

Iowa Tribe of Oklahoma Wind Study Report 89
The BIA procedures do not specifically set forth a model lease to allow for flexibility in negotiating and
drafting of the leases. That being said, certain requirements of the WSR lease form must be adhered to
prior to the lease being submitted to the BIA for approval. A review of the WSR lease requirements
indicates that they are generally consistent with those found in the Private Lease form.
Since no specific lease model is required for the BIA, and the Private Lease form has previously been
deemed to be acceptable in other third party arms-length commercial wind project transactions, it is
recommended that the Private Lease form be utilized for purposes of securing the land subject to BIA
jurisdiction, including trust property and restricted Indian land in the interests of consistency and
conformity.
Specific Tribal Lease Terms and Provisions:
A WSR must set a definite lease term which cannot exceed twenty-five years (25) with an option to
renew the lease for an additional twenty five (25) year term. In contrast to the Private Lease, which
allows for an initial five (5) year term, the WSR Lease provides for installation of energy facilities within
two (2) years after the effective date of the lease; subject to a request for extension upon good cause
and depending upon the nature of the delay.
The rent structure is similar to that set forth in the Private Lease, provided that the tribe provides
authorization confirming that the compensation is satisfactory and the compensation was negotiated in
the best interests of the tribe. A WSR Lease of individually owned Indian land must be for “fair market
value” based on (i) a fixed amount, (ii) a percentage of the projected gross income, (iii) Megawatt
capacity fee, or (iv) some other method. Upon waiver of an individual Indian landowner, amounts less
than fair market value are permissible in certain circumstances. In some cases, fair market value must
be determined by market appraisal or other appropriate valuation method, which the BIA will either
have prepared or, if approved, an existing valuation using one of the referenced methodologies.
The procedure for BIA’s approval of the WSR Lease is provided in the regulations, including the fact that
the BIA must respond to an initial inquiry within 60 days of receiving the required information.
State Lease Form78:
A portion of the proposed project area is situated on School Land Commission (SLC) property owned by
the Oklahoma Commissioners of the Land. The SLC requires that the Lessor enter into a Wind Turbine
Power Production Lease. While this lease form is consistent with the Private Lease form in many
respects, it has several very important and significant differences.
Specific State Lease Terms and Provisions:
An SLC lease is approved by the SLC Board of Commissioners and is ultimately signed by the Governor.
The maximum term of any SLC lease is fifty-five (55) years, however, verbal discussions with SLC staff
indicate that the preferred term is between twenty-five (25) to thirty (30) years for wind energy leases.
78
State of Oklahoma Commissioners of Land Office, “Wind Turbine Power Production Lease”, Undated

Iowa Tribe of Oklahoma Wind Study Report 90
The lease is divided into two phases for development, similar to that provided for in the Private Lease,
and the economic payment structure is also equally similar in that a provision exists for an annual
payment in the initial period of the lease with a conversion to a percentage of gross revenues upon
commercial operation of the project (defined in similar fashion to that set forth in the Private Lease).
All property proposed to be the subject of an SLC lease must be appraised and leased for its fair market
rental value as set forth by the appraisers of the SLC. The SLC appraisers consider several variables in
determining the fair market value, including, (A) Present land use; (B) Acres of land in cultivation,
pasture, timber and nonproductive; (C) Soil types and productivity; (D) Availability of water; (E) Climatic
conditions prevailing in the area for the last ten to twenty years; (F) Cash rental price of comparable
agricultural land; and (G) Effective cash return on landlord's share of crop rent from comparable
agricultural land for the five (5) year period preceding the appraisal.
After the fair market value is determined, the lease must then be submitted to a public bidding process
where all of the central economic terms and provisions are subject to public review and open bidding.
In addition to the foregoing, the SLC lease has a restriction on assignment requiring written consent of
the Board of Commissioners and there is an express provision stating that no amendments of the SLC
lease are permitted, with the SLC reserving the express right to approve any subsequent requests for
amendments. This requirement in particular will not be well-received by lenders, which will make
financing the project difficult if state lands are included in the project area.
The SLC lease form also requires Lessor to provide a copy of an agreement for the purchase and sale of
the electricity negotiated for the project along with all subsequent amendments.
6.3.5. Title Curative
Title Curative for the project in its entirety will involve resolution of anticipated lender and title
insurance issues in order to prepare the project for lender due diligence and scrutiny. Such issues
include, but are not limited to, subordination of prior deeds of trust or mortgages affecting the land,
together with non-disturbance agreements for tenants that have contracted for use of the land,
including grazing and crop production.
Owners may also be asked to complete affidavits to clear matters showing of record, including oil and
gas leases affecting the property, and transfer of unresolved interests pertaining to probate of deceased
relatives and/or unresolved fractional interests.
In the specific case of the Oklahoma Land Commission property, while the SLC lease requires that the
property be leased “as is” the property is currently the subject of a grazing and timber lease. Since the
SLC lease procedure requires consent of any prior contractual holders, this tenant will need to sign a
non-disturbance agreement or some other agreement whereby consent to the granting of the SLC lease
is given.
6.3.6. Financial Model Inputs for Land Acquisition
Table 25: Financial Model Inputs for Land Acquisition (Development Costs)
Task 20 MW 50MW
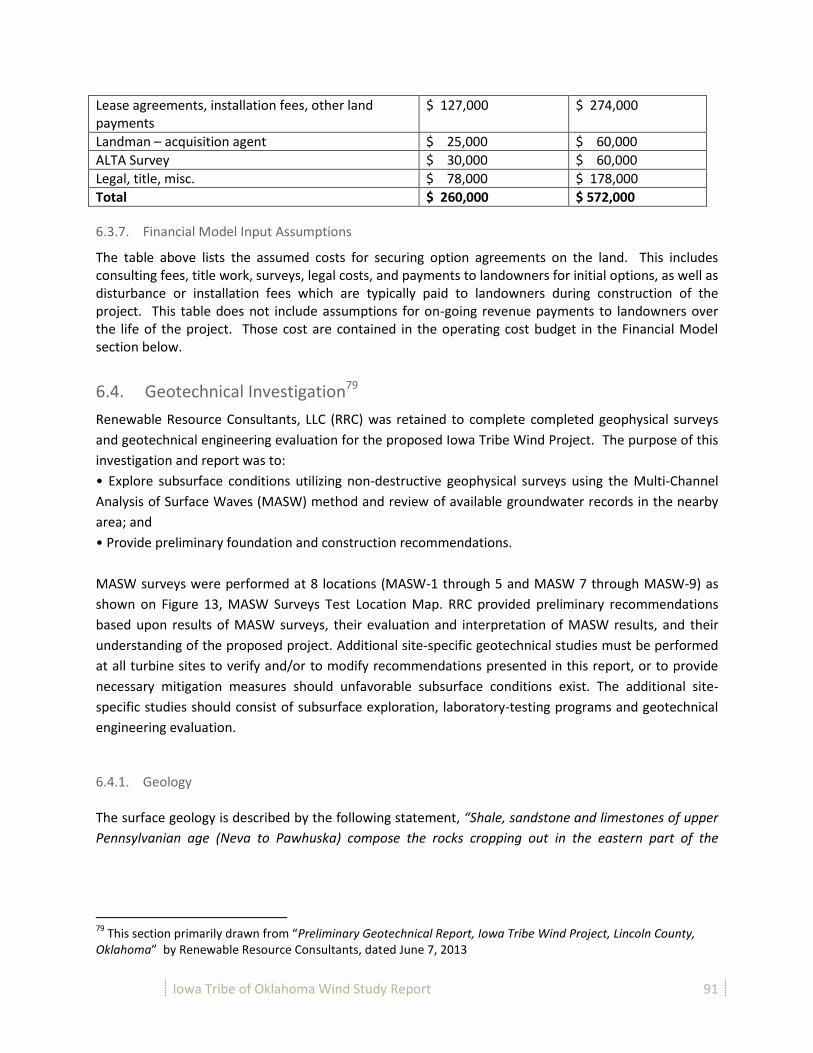
Iowa Tribe of Oklahoma Wind Study Report 91
Lease agreements, installation fees, other land payments
$ 127,000 $ 274,000
Landman – acquisition agent $ 25,000 $ 60,000
ALTA Survey $ 30,000 $ 60,000
Legal, title, misc. $ 78,000 $ 178,000
Total $ 260,000 $ 572,000
6.3.7. Financial Model Input Assumptions
The table above lists the assumed costs for securing option agreements on the land. This includes consulting fees, title work, surveys, legal costs, and payments to landowners for initial options, as well as disturbance or installation fees which are typically paid to landowners during construction of the project. This table does not include assumptions for on-going revenue payments to landowners over the life of the project. Those cost are contained in the operating cost budget in the Financial Model section below.
6.4. Geotechnical Investigation79
Renewable Resource Consultants, LLC (RRC) was retained to complete completed geophysical surveys
and geotechnical engineering evaluation for the proposed Iowa Tribe Wind Project. The purpose of this
investigation and report was to:
• Explore subsurface conditions utilizing non-destructive geophysical surveys using the Multi-Channel
Analysis of Surface Waves (MASW) method and review of available groundwater records in the nearby
area; and
• Provide preliminary foundation and construction recommendations.
MASW surveys were performed at 8 locations (MASW-1 through 5 and MASW 7 through MASW-9) as
shown on Figure 13, MASW Surveys Test Location Map. RRC provided preliminary recommendations
based upon results of MASW surveys, their evaluation and interpretation of MASW results, and their
understanding of the proposed project. Additional site-specific geotechnical studies must be performed
at all turbine sites to verify and/or to modify recommendations presented in this report, or to provide
necessary mitigation measures should unfavorable subsurface conditions exist. The additional site-
specific studies should consist of subsurface exploration, laboratory-testing programs and geotechnical
engineering evaluation.
6.4.1. Geology The surface geology is described by the following statement, “Shale, sandstone and limestones of upper
Pennsylvanian age (Neva to Pawhuska) compose the rocks cropping out in the eastern part of the
79
This section primarily drawn from “Preliminary Geotechnical Report, Iowa Tribe Wind Project, Lincoln County, Oklahoma” by Renewable Resource Consultants, dated June 7, 2013

Iowa Tribe of Oklahoma Wind Study Report 92
county, and shale and sandstones of basal Permian age (Stillwater Group) compose the surface rocks in
the western part.” The Geologic Map of Oklahoma80 indicates that the Garber sandstone is comprised
of the following formations or groups:
• Wellington Formation – Fallis sandstone member;
• Chase Group – Herington limestone;
• Council Grove Group – Cottonwood limestone; and
• Admire Group.
Figure 13- MASW Surveys Test Location Map
6.4.2. Subsurface Stratigraphy Stratigraphy refers to geological and archaeological layers that make up the soil subsurface. Exploratory
borings were not included in the scope of RRC due to the fact that final turbine locations were not
known and this was primarily a feasibility study. As such subsurface stratigraphy for the site was
estimated based on well logs obtained from the Oklahoma Water Resources Board website. The
references for this information can be found in the base report from which this content was derived.
Based on the well logs, top soil or surface soil ranges from about 1 to 3 feet overlying a red clay or sandy
80 Geologic Map of Oklahoma (1954). Miser, H.D., 1954. United State Geological Survey and Oklahoma Geological
Survey.

Iowa Tribe of Oklahoma Wind Study Report 93
clay layer ranging from 0 to 13 feet in thickness. Bedrock consists of sandstone and shale with estimated
depths ranging from about 1 to 15 feet below the ground surface.
6.4.3. Groundwater Conditions Groundwater conditions are most accurately determined when exploratory borings are performed for
the project. Since exploratory borings were not in the scope of this geotechnical study, RRC estimate
the groundwater conditions based on well logs obtained from the Oklahoma Water Resources Board
website. Based upon review of selected well logs, groundwater levels (first water zone indicated in the
well log) varies significantly from about 18 feet to greater than 300 feet below ground surface.
This is a wide variation in depth, however none of the water logs indicated surface water and so it is not
expected that buoyant foundations will be required for the site.
6.4.4. Geophysical Surveys
An (MASW) survey was performed by RRC at 8 selected turbine locations. MASW is a method of testing
the consistency and rigidity of soil matrices and rock masses. Data is collected using an active seismic
source, such as a sledgehammer impact, and a linear receiver array consisting of roll-along 24-channel
receivers to collect the surface wave arrival times. Surface waves, which propagate at the same velocity
as the shear waves, are recorded. The dispersion of the surface waves can then be inverted to a layer
model of shear wave velocity versus depth. The data is processed using the SurfSeis 3.0 computer
program.
6.4.5. Geotechnical Recommendations
Based on the MASW survey results and literature reviews of geology at and near the vicinity of the site,
RRC concluded that the proposed site appears suitable for the proposed construction of wind turbine
facilities, and that the use of spread foundation systems for support of the turbines was considered
acceptable. The turbine foundations will bear at a depth of about 7 to 10 feet below existing site grade.
RRC found several geotechnical conditions that will require special consideration in the design and
construction of the project.
The presence of shale and sandstone bedrocks at shallow depths at the site may require particular
attention in the design and construction. The use of heavy-duty excavation equipment will most
likely be required in most areas. Blasting may be required in areas where hard to very hard and
strongly cemented sandstone bedrock is encountered at shallow depths.
Areas where soft or loose soils may be encountered below foundation bearing elevation that may
require remedial measures prior to foundation construction. Remedial measures may consist of
partial over-excavation to suitable depths, moisture conditioning, and recompaction of the subgrade
soils, or replacement with structural fill materials. Subgrade soils generally can be moisture
conditioned with -3% to +2% of optimum moisture content and compacted to 97% of the maximum
dry density as determined by ASTM D 698.
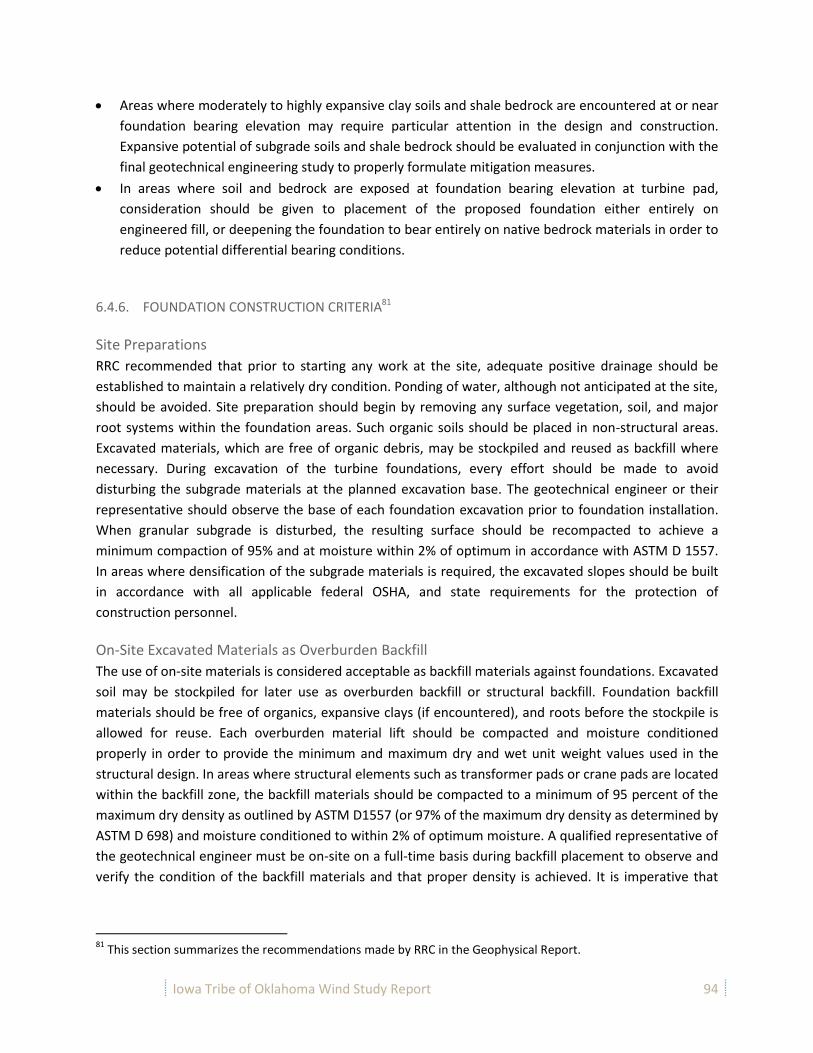
Iowa Tribe of Oklahoma Wind Study Report 94
Areas where moderately to highly expansive clay soils and shale bedrock are encountered at or near
foundation bearing elevation may require particular attention in the design and construction.
Expansive potential of subgrade soils and shale bedrock should be evaluated in conjunction with the
final geotechnical engineering study to properly formulate mitigation measures.
In areas where soil and bedrock are exposed at foundation bearing elevation at turbine pad,
consideration should be given to placement of the proposed foundation either entirely on
engineered fill, or deepening the foundation to bear entirely on native bedrock materials in order to
reduce potential differential bearing conditions.
6.4.6. FOUNDATION CONSTRUCTION CRITERIA81
Site Preparations
RRC recommended that prior to starting any work at the site, adequate positive drainage should be
established to maintain a relatively dry condition. Ponding of water, although not anticipated at the site,
should be avoided. Site preparation should begin by removing any surface vegetation, soil, and major
root systems within the foundation areas. Such organic soils should be placed in non-structural areas.
Excavated materials, which are free of organic debris, may be stockpiled and reused as backfill where
necessary. During excavation of the turbine foundations, every effort should be made to avoid
disturbing the subgrade materials at the planned excavation base. The geotechnical engineer or their
representative should observe the base of each foundation excavation prior to foundation installation.
When granular subgrade is disturbed, the resulting surface should be recompacted to achieve a
minimum compaction of 95% and at moisture within 2% of optimum in accordance with ASTM D 1557.
In areas where densification of the subgrade materials is required, the excavated slopes should be built
in accordance with all applicable federal OSHA, and state requirements for the protection of
construction personnel.
On-Site Excavated Materials as Overburden Backfill
The use of on-site materials is considered acceptable as backfill materials against foundations. Excavated
soil may be stockpiled for later use as overburden backfill or structural backfill. Foundation backfill
materials should be free of organics, expansive clays (if encountered), and roots before the stockpile is
allowed for reuse. Each overburden material lift should be compacted and moisture conditioned
properly in order to provide the minimum and maximum dry and wet unit weight values used in the
structural design. In areas where structural elements such as transformer pads or crane pads are located
within the backfill zone, the backfill materials should be compacted to a minimum of 95 percent of the
maximum dry density as outlined by ASTM D1557 (or 97% of the maximum dry density as determined by
ASTM D 698) and moisture conditioned to within 2% of optimum moisture. A qualified representative of
the geotechnical engineer must be on-site on a full-time basis during backfill placement to observe and
verify the condition of the backfill materials and that proper density is achieved. It is imperative that
81
This section summarizes the recommendations made by RRC in the Geophysical Report.

Iowa Tribe of Oklahoma Wind Study Report 95
proper drainage is maintained around the foundation structures to reduce the potential for water
infiltration and fine migration, and the potential for “nested” voids.
Structural Fill Specifications
On-site sands may be used beneath foundations where over-excavation and replacement of unsuitable
materials is performed. If gapping is a concern, the use of well graded granular materials or structural fill
meeting the specifications contained in the original report will be required. Structural fill material
beneath foundations, where required, should consist of a non-expansive, well-graded material with
sufficient binder for compaction purposes and must meet the Oklahoma Department of Transportation
Grading “B” or better.
Structural fill should be placed in lifts having a maximum loose lift thickness of 12 inches and should be
compacted to a minimum of 95% of ASTM D 1557. The structural fill should be moisture conditioned
with 2% of optimum moisture content.
On-Site Excavated Materials as Foundation Fill Specifications
On-site lean clay and sand soils could be reused beneath foundations where over-excavation and
replacement of unsuitable materials is performed. These reused materials should have a maximum
Plasticity Index of 25 and a maximum Liquid Limit of 40. If gapping is a concern, the use of well graded
granular materials or structural fill meeting the specifications outlined in RRC’s report will be required.
Shallow Foundation Construction
The following construction criteria and general guidance should be observed during foundation
construction:
All foundation construction should be observed by the Geotechnical Engineer or a qualified
representative to verify that the anticipated bearing material has been reached in accordance with
the recommendations given herein. The Geotechnical Engineer should also assess the need for
densification of any soft or disturbed subgrade materials.
Special care should be taken to protect the exposed soils and shale bedrock from being disturbed,
freezing or drying out prior to placement of the structural fill pad.
Foundation excavation should be accomplished with conventional excavation equipment to a depth
of about 12 inches below foundation bearing elevation. The foundation excavation should be sloped
sufficiently to create internal sumps for runoff collection and removal. Foundation excavations
subject to rainfall and possible deterioration from accumulated water should be protected using a
protective “mud-slab” (concrete) of not less than 2 inches in thickness. If surface runoff water or
groundwater seepage accumulates at the bottom of the foundation excavation, it should be
collected and removed and not allowed to adversely affect the quality of the bearing surface.
Foundation should be founded on uniform material. If inclined bedrock is encountered at
foundation excavation bottom, the excavation bottom should be over-excavated to generate a
uniform and competent bedding surface. The over-excavation can be filled with lean concrete to top
of mud mat grade, or compacted structural fill. To reduce the risk of differential foundation
settlement, the structural fill thickness below turbine foundation should be kept as uniform as
Iowa Tribe of Oklahoma Wind Study Report 96
possible (with no abrupt thickness change), with a total thickness difference of 24 inches or less
across the turbine foundation width.
The foundation excavations should be checked for size and cleaned of loose material and debris
prior to the placement of reinforcing steel. Precautions should be taken during the placement of
reinforcement and concrete to prevent loose excavated material from falling into the excavation.
Prior to the placement of concrete, any free water must be removed from the foundation
excavation.
Prompt placement of concrete in the excavation as it is completed, cleaned, and observed is
strongly recommended.
Open Excavations
Temporary construction slopes and/or permanent embankment slopes should be protected from
surface runoff water. Site grading should be designed to allow drainage at planned areas where erosion
protection is provided, instead of allowing surface water to flow down unprotected slopes. Surcharge
loads, either static or dynamic, should not be applied to an excavation slope. Construction equipment
should be prevented from traveling along or near the top of the excavation slope. Monitoring of
temporary slopes, trenches, and dewatering during construction should be undertaken by the
contractor to detect early signs of movement within slopes, structures, pavements, etc.
In all cases of excavations, sloped excavations and trench shields are recommended for excavations
greater than 4 feet in depth. OSHA and applicable state and local standards should be observed and
followed. Site safety is the responsibility of the contractor.
Drainage and Dewatering
Proper drainage should be provided away from the foundation elements during all phases of
construction and post-construction grading. Proper drainage is essential to the long-term stability of the
structure. Ponding of water near the foundation elements from improper drainage should not be
permitted.
Preliminary Access Roadways Design and Construction
Access roadways will be built for both construction and maintenance purposes. The final location of
those access roads will be determined when the final turbine locations are selected. At this time, the
recommendations in this section are generic for roads expected to be constructed for both construction
and long term project access. Traffic volume during construction is anticipated to be frequent with
heavy equipment utilizing the access roadways. Following the construction period, the traffic volumes
will be light and vehicles accessing the roadways will generally consist of pickup trucks and occasional
single and multi-unit truck traffic. The actual thickness and material characteristics of the gravel
roadways should be determined by the design/build contractor, keeping in mind the frequency, duration
and requirements of the turbine manufacturer. Aggregate base course materials used for surfacing of
the access roadways should be compacted to a minimum of 95% of the maximum dry density and within
2% of optimum moisture content as determined in accordance with ASTM D 1557. Prior to the
placement of the aggregate base course materials, stripping and removal of existing vegetation and

Iowa Tribe of Oklahoma Wind Study Report 97
other deleterious materials from the proposed access roadway alignment should be performed. Topsoil
and organics could be up to about 4 to 6 inches or more in thickness in some areas and should not be
allowed for use in structural areas or along the access roadway alignment.
The exposed subgrade should then be proof-rolled prior to the placement of the aggregate base course
materials to assess the presence of soft areas and the need for any remedial measures. The proof-roll
operations should be conducted with a fully loaded 4,800-gallon water truck or similar equipment (gross
weight of 50,000 pounds is required). In areas where excessive “pumping” of the subgrade is
encountered, partial removal of subgrade soils in these areas and re-compaction and/or replacement
with granular soils will be required. These subgrade areas should be scarified to a minimum depth of
about 6 to 12 inches, moisture conditioned within 2% of optimum moisture content and re-compacted
to a minimum of 95% of the maximum dry density as determined in accordance with ASTM D 1557.
It is imperative that proper drainage of the subgrade be provided in the construction of the roadways
and crane pads to enhance their performance. Post-construction proof-rolling of the subgrade materials
should be performed prior to re-opening the roadways for traffic after periods of heavy rainfall/snow
melt to assess stability of the roadway and the need for remedial measures. The proof-roll should be
accomplished with a fully loaded water truck or similar heavy equipment. Areas where remedial
measures are required should be re-worked and corrected prior to acceptance. It is also imperative that
periodic inspection of the access roadways be performed following periods of rainfall or snow-melt to
assess the condition of the roads and the need for remedial measures.
6.4.7. Limitations
The RRC report contained standard limitations including their field observations and limited testing. This
report was sufficient to determine that the proposed wind project, from a geotechnical perspective, was
feasible, and furthermore that spread foundations would be considered suitable for the site. It provided
recommendations for roadways and foundations. It provided information that buoyant foundations
would not be required.
6.5. Layout and Turbine Selection Financial Model Inputs
A detailed construction budget was developed for the project which includes all the proposed capital
expenditures for the project. A detailed development budget was also developed, which includes the
development costs for the project. That information is contained in the economic feasibility section of
the report in Section 7 below.
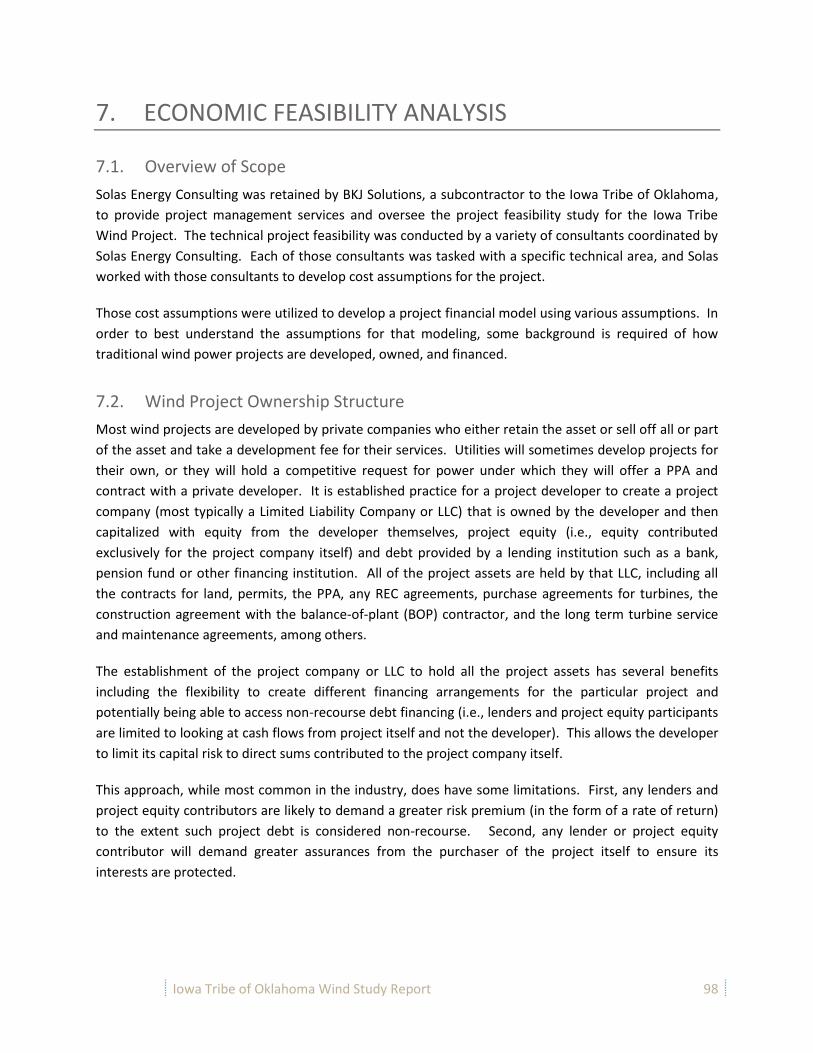
Iowa Tribe of Oklahoma Wind Study Report 98
7. ECONOMIC FEASIBILITY ANALYSIS
7.1. Overview of Scope
Solas Energy Consulting was retained by BKJ Solutions, a subcontractor to the Iowa Tribe of Oklahoma,
to provide project management services and oversee the project feasibility study for the Iowa Tribe
Wind Project. The technical project feasibility was conducted by a variety of consultants coordinated by
Solas Energy Consulting. Each of those consultants was tasked with a specific technical area, and Solas
worked with those consultants to develop cost assumptions for the project.
Those cost assumptions were utilized to develop a project financial model using various assumptions. In
order to best understand the assumptions for that modeling, some background is required of how
traditional wind power projects are developed, owned, and financed.
7.2. Wind Project Ownership Structure
Most wind projects are developed by private companies who either retain the asset or sell off all or part
of the asset and take a development fee for their services. Utilities will sometimes develop projects for
their own, or they will hold a competitive request for power under which they will offer a PPA and
contract with a private developer. It is established practice for a project developer to create a project
company (most typically a Limited Liability Company or LLC) that is owned by the developer and then
capitalized with equity from the developer themselves, project equity (i.e., equity contributed
exclusively for the project company itself) and debt provided by a lending institution such as a bank,
pension fund or other financing institution. All of the project assets are held by that LLC, including all
the contracts for land, permits, the PPA, any REC agreements, purchase agreements for turbines, the
construction agreement with the balance-of-plant (BOP) contractor, and the long term turbine service
and maintenance agreements, among others.
The establishment of the project company or LLC to hold all the project assets has several benefits
including the flexibility to create different financing arrangements for the particular project and
potentially being able to access non-recourse debt financing (i.e., lenders and project equity participants
are limited to looking at cash flows from project itself and not the developer). This allows the developer
to limit its capital risk to direct sums contributed to the project company itself.
This approach, while most common in the industry, does have some limitations. First, any lenders and
project equity contributors are likely to demand a greater risk premium (in the form of a rate of return)
to the extent such project debt is considered non-recourse. Second, any lender or project equity
contributor will demand greater assurances from the purchaser of the project itself to ensure its
interests are protected.

Iowa Tribe of Oklahoma Wind Study Report 99
7.2.1. Project Development
The cost for the full development of this project, in either the 20 MW or the 50 MW scenario, is
expected to be high. The typical project developer is willing to take a risk on the development capital
for the project if the project looks fairly feasible. The development costs are considered ‘at-risk’ capital,
and the developer takes a project fee during the sale of the project from a third party to take a
satisfactory rate of return on that development risk capital.
A development budget was developed for this project in both the 20 MW and the 50 MW scenarios.
The development budget includes the costs likely to be required to get the project ready for sale, and
includes additional wind monitoring, land acquisition, interconnection queue studies, project permitting,
preliminary engineering, legal, and consulting fees. The development budget was estimated to be as
follows:
Table 26: Project Development Budget
Task 20 MW 50MW
Land Work82 $ 260,000 $ 572,000
Meteorology83 $ 286,000 $ 416,000
Interconnection84 $ 175,000 $ 175,000
Permitting85 $ 440,000 $ 625,000
Engineering86 $ 240,000 $ 240,000
Legal Fees87 $ 500,000 $ 750,000
Consulting88 $ 120,000 $ 120,000
Total $2,021,000 $2,989,000
In discussions with the Iowa Tribe, it was indicated that the Tribe does not have the financial liquidity or
the desire to act as the developer on this project to front these funds for the development of the
project. An alternative to self-financing the development costs would be for the Iowa Tribe to seek a
developer partner for the project who would provide the development capital, or sell the project assets
in whole to a developer and just participate as a landowner. Under either scenario, the Iowa Tribe
would need to allow ownership of the project by the third party, however in the first scenario, the Tribe
would maintain a small portion of ownership.
82
Additional detail on the estimated land costs can be found in Table 25. 83
20 MW case assumes 2 met towers and 50 MW case assumes 4 met towers installed for additional wind speed verification. Includes finance level reports. 84
Additional detail on the estimated interconnection costs can be found in Table 6. 85
Additional detail on the estimated permitting costs can be found in Table 13. 86
Engineering costs assumes engineering support for developing specifications, plans and materials to bid the project to a design-build contractor. It also includes the cost for a full independent engineering review of the project, which is required under a project financing scenario. This cost is largely project size independent. 87
Legal fees are estimated based on a non-recourse project finance scenario. This would include the cost for support for the contracts and a project finance transaction. 88
This is the cost for additional consulting services to support the project.

Iowa Tribe of Oklahoma Wind Study Report 100
7.2.2. Co-Developer/Partner
An interesting method to use for development of this project would be for the Iowa Tribe to create a
project company LLC and then execute lease agreements between the tribal parcels held in fee simple
and also any private parcels owned by tribal members. The tribe could then assign all of the feasibility
work created pursuant to this report to that project company, and then do a competitive RFP for wind
power developers for the project assets. Combining lease agreements with the work performed to date
on the project provides some value to a developer as the initial high-risk activities have been completed.
The Tribe could set the development terms and conditions for the project, and find a developer best
suited to work with the tribe from both a commercial and compatibility perspective.
In this scenario, the tribe could serve as a co-developer with small capital obligations, and have an
expectation that a small portion (less than 10%) of the project ownership could be held by the tribe. In
addition to receiving rent from the use of the land, the Tribe could take a modest development fee (at
least the cost of this feasibility study, and perhaps greater), and also a modest income off of the long-
term operations of the project. It should be noted that the Tribe would have a minority interest and
little control over the development of the project. The tribe would also need to be realistic about the
value that it brings because the economics of the project are modest and onerous financial terms as a
co-developer could make the economics unfavorable.
7.2.3. Full Project Sale plus Project Landowner
Another avenue for the tribe which might be more attractive to project developers is if the tribe
conducted the same RFP process to find the best developer for the project, but did not retain any
interest in the project other than being a landowner with option payments and long-term revenues off
of the project. The initial stages would still be the same and the tribe would establish an LLC and
execute leases, but would sell the project and the development assets to a third party developer. This
would require no development capital from tribe, would provide a small payment for the sale of the
project company, and would provide the tribe with back-end revenue over the life of the project as a
landowner. This structure is expected to be more interesting to private developers and may ultimately
result in the greatest financial benefit to the Tribe.
In this scenario, the Tribe could still require non-tangible benefits to accrue to the tribe, such as job
creation, training of tribal members, utilization of tribal resources for avian studies and cultural studies,
and other benefits.
Ultimately the best structure for the project will be the one that is most financeable, whether the tribe
is a development partner or simple landowner, the developer who comes into the project will be
seeking financing for the project.
Several vehicles could be utilized for financing of the project by a developer/partner. Those financing
vehicles are discussed below.

Iowa Tribe of Oklahoma Wind Study Report 101
7.3. Financing Vehicles
7.3.1. Debt Financing Debt financing consists of traditional loan structures, but due to size of project can be structured in
various manners including:
Syndicated/Club Loans – Commercial loans spread amongst various financial institutions to minimize risk
Private Placements – Bond issuance to qualified institutional investors that avoid SEC registration
Different types of debt structures have various pros and cons. Commercial loans tend to be more
traditional and easier to process, as well as having more flexible terms as there are more entities that
compete to provide such financing. However, bond issuance can have less restrictive covenants, offer a
longer repayment term option and be issued at tax-exempt rates (for qualified projects) leading to a
lower effective borrowing cost.
7.3.2. Equity Financing Equity financing differs from debt financing in that the investing entity expects a negotiated return on
capital that will be based upon success of project and typically is well in excess of any debt financing
costs. This is because the debt financing has higher priority to revenue streams and is paid first in the
event of a default, so the subordinated equity position will require a premium for its risk capital.
Besides the equity contributed by the Iowa Tribe, equity financing can be obtained by soliciting investors
who wish to have a stake in the project. Such terms again would be bilaterally negotiated and can be
structured in any manner as long as done with full transparency and with recognition of the preferred
standing of any debt financing.
Below is one of the most common ways to obtain financing in large scale renewable projects.
7.3.3. Tax Equity Financing / Investment-Grade Sourcing Tax equity financing is one of the most common investment structures for renewable energy projects in
the United States. The US federal government has been offering a renewable production tax credit (PTC)
whereby the generator receives a one-for-one tax reduction benefit at a pre-determined rate for the
project, based on the generated MWh of the project. These tax incentives are valuable and useful for a
party who has a long-term known tax liability. The Iowa Tribe, however, does not pay federal taxes and
so this tax credit is not of value to the Tribe. This tax credit, if in effect at the time of the project
commissioning, could be sold to an equity investor.
The continuation of that particular tax incentive, however, is in question. The likely or actual expiration
of certain tax incentives (such as the production tax credit (PTC) and the 1603 cash grant program) have
created a financing void for many large scale developments. Tax equity financing presents the
opportunity for private investors – in this case corporations – to inject capital into the development of

Iowa Tribe of Oklahoma Wind Study Report 102
renewable energy projects, while transferring remaining tax incentives from the project developers,
who usually do not have enough profits to take advantage of them, to corporate investors with a larger
tax exposure to offset. The corporations investing in the project are also attributed a share of the future
revenues or equity stake in the asset.
Traditionally, financial corporations and banks have filled this investment pool, but corporations with
cash on hand and an appetite for tax incentives, such as Google, have stepped in to provide financing for
projects in exchange for tax abatement and for future revenues. In most cases, these transactions are
purely financial, with no green power attributes or physical delivery of renewable power flowing back to
the investor. However, the Iowa Tribe may want to consider investment that includes potential off take
of power or environmental attributes on an equity basis, once a project is operational.
7.3.4. Benefits
Investing corporations engage in the renewable energy marketplace in a manner that provides
liquidity and results in an ownership stake in a developed asset
Investors earn a return on their investment as projects come online and begin to generate
revenues from the sale of energy and/or environmental attributes
If structured to include off take of power and/or RECs once the project is operational, these
investments can provide for a single, flagship project of sufficient size to offset an entire
corporation’s grid-sourced power footprint.
7.3.5. Considerations
Tax equity financing requires significant outlay of capital for investors to buy into a project – for
example a 100 MW wind farm would require an investment of $25MM to $75MM from a single
investor to participate
Tax equity projects are typically structured as purely financial investments, and the additional
requirement of off take of power and renewable attributes would impact the anticipated ROI of such a
project (vs. monetizing those attributes and selling the power to the open market)
7.4. Incentive Analysis89
Incentives exist within the United States and the State of Oklahoma for investing in green energy, and
those incentives have in the past contributed substantial value to wind projects. The following is a list of
relevant government organizations that have funded wind development in the past:
US Department of Agriculture90
Department of Energy91
Oklahoma Department of Environmental Quality 92
89
This section drawn from the Schneider Electric Report. 90
http://www.rurdev.usda.gov/energy.html 91
http://www1.eere.energy.gov/financing/funding_award_process.html 92
http://www.deq.state.ok.us/

Iowa Tribe of Oklahoma Wind Study Report 103
Oklahoma Department of Commerce93
The government uses several tax-based policy incentives to stimulate the deployment of wind power.
Renewable Electricity Production Tax Credit (PTC)94
o PTC is a per KWh tax credit for electricity generated by qualified energy resources.
o The PTC was originally enacted in 1992 and has been extended several times. Most
recently it was extended as part of the American Taxpayer Relief Act in January 2013.
o Deadline for start of construction for PTC eligibility: December 31, 2013
o Credit amount: $0.023/kWh
o American Wind Energy Association is currently fighting for extension.95 The outlook is
not optimistic that it will be extended further.
Business Energy Investment Tax Credit (ITC) 96
o The American Recovery and Reinvestment Act of 2009 allows taxpayers eligible for the
federal renewable electricity production tax credit (PTC) to take the federal business
energy investment tax credit (ITC) instead of taking the PTC for new installations
o Equal to 30% of expenditures, with no maximum credit for small wind turbines placed in
service after December 31, 2008.
o Eligible small wind property includes wind turbines up to 100 kW in capacity.
Oklahoma Zero-Emission Facilities Production Tax Credit 97
o Facilities placed in operation on or after January 1, 2007 and before January 1, 2016
o $0.0025/kWh - $0.0075/kWh for 10 years; amount varies depending on when the
facility is placed in operation and when electricity is generated.
o Tax years beginning on or after January 1, 2003, a state income tax credit is available to
producers of electric power using renewable energy resources from a zero-emission
facility located in Oklahoma.
o Rated production capacity of one megawatt (1 MW) or greater
o The facility must be placed in operation after June 4, 2001, and the electricity must be
sold to an unrelated party.
o The construction and operation of the zero-emission facility must result in no pollution
or emissions that are or may be harmful to the environment, as determined by the
Department of Environmental Quality.
Oklahoma's business incentive program 98
93
http://okcommerce.gov/workforce-development/green-grant/ 94
http://dsireusa.org/incentives/incentive.cfm?Incentive_Code=US13F 95
http://www.awea.org/issues/federal_policy/ 96
http://www.dsireusa.org/library/includes/incentive2.cfm?Incentive_Code=US02F&State=federal%C2%A4tpageid=1&ee=1&re=1 97
http://dev3.okcommerce.gov/v2/Businesses-And-Employers/Reduce-Operating-Costs/Streamline-Operations/rc/Oklahoma-Is-Wind-Energy-Incentives 98
http://dev3.okcommerce.gov/v2/Libraries/Documents/2010-Oklahoma-Business-Incenti_170.pdf

Iowa Tribe of Oklahoma Wind Study Report 104
o Offers up to 5% cash back quarterly of new taxable payroll (Quality Jobs)
o Tax credit on investment or new jobs (Investment/New Jobs Tax Credit).
o 5-Year Ad Valorem Property Tax Exemption is available for qualifying manufacturing companies.
Oklahoma Freeport Inventory Benefits Law 99
o Exempts from taxation goods, wares, and merchandise that come from outside the state
o Goods, wares and merchandise must leave the state within nine months
o Goods, wares, and merchandise must be held for assembly, storage, manufacturing,
processing, or fabricating purposes within the state.
Property Tax Exemption for Wind Generators100
o The state of Oklahoma offers a five year ad valorem property tax exemption for certain
wind power generators.
o An initial investment of $250,000 and an addition of $250,000 in annual payroll in
counties with a population of 75,000 or less are required. If the company is located in a
larger county, an additional annualized payroll of $1 million is required to file for the
exemption. Wind power generators are exempt from the Oklahoma payroll requirement
if there is an increase of $2 million or more in capital improvements while maintaining
or increasing payroll.
o Property eligible to be exempt from tax may include land, buildings, improvements,
machinery, fixtures, and equipment used directly and exclusively in the process of wind
power generation on the facility site. Companies must apply for the exemption by
March 15th for each year.
Qualifying Advanced Energy Manufacturing Investment Tax Credit 101
o Maximum Incentive: $30 million, 30% of qualified investment
o The American Recovery and Reinvestment Act of 2009 established an investment tax
credit to encourage the development of a U.S.-based renewable energy manufacturing
sector
o Equipment and/or technologies used to produce energy from the sun, wind, geothermal
or "other" renewable resources
It should be noted that federal renewable production incentives are starting to wind down, most
notably the PTC, which had previously provided substantial economic benefits to projects. A shift has
occurred at the federal level from production incentives into research and development incentives.
Programs that are expiring are not likely to be renewed. The uncertainty of these incentives is high, and
the majority of the incentives are tax-based, which is not beneficial to the Tribe. None of these
incentives were considered in the financial modeling for the project because it was deemed that they
would provide optimistic projections.
99
http://dev3.okcommerce.gov/v2/Businesses-And-Employers/Reduce-Operating-Costs/Streamline-Operations/rc/Oklahoma-Is-Wind-Energy-Incentives 100
http://www.dsireusa.org/incentives/incentive.cfm?Incentive_Code=OK38F 101
http://www.dsireusa.org/incentives/incentive.cfm?Incentive_Code=US52F

Iowa Tribe of Oklahoma Wind Study Report 105
7.5. Native American Incentives
Oklahoma Department of Commerce American Indian Lands Tax Credit102
o Provides an accelerated federal property depreciation schedule (up to 40%)
o Federal employment tax credits of up to $4,000 per qualifying employee per year
Tribal Energy Program Grant 103
o Managed by the United States Department of Energy
o Program provides financial assistance, technical assistance, education and training to
tribes for the evaluation and development of renewable energy resources
o U.S. federal government sources of tribal energy project loans and loan guarantees.
Rural Energy for America Program Guaranteed Loans104
Rural Development Loan Assistance105
Electric Program Loans106
Business and Industry Guaranteed Loans107
Indian Affairs Division of Capital Investments108
Indian Home Loan Guarantee Program109
Tribal Housing Activities Loan Guarantee Program110
IRS Clean Renewable Energy Bonds (CREBs)111
o Bonds to fund clean renewable production.
o Primarily for public sector production. Tribal Government would qualify.
o Program expired but may be renewed in the future. Program ran from 2005-2010.
The tribal energy program grant is potentially an interesting incentive for the small wind project. An
application for this grant is being developed for submittal in June, 2013. That incentive is not as
applicable in the large wind scenario.
7.6. Economic Modeling Results
The project economics were developed and put into a financial model to determine what rates of return
one could expect with the project. Multiple cases were run on various revenue scenarios including
pricing for both brown and RECs, different capital project costs, operating costs, and the development
costs as detailed in Table 26. The economics were not found to be very favorable.
102
http://okcommerce.gov/location-or-expansion/incentives/american-indian-lands-tax-credit/ 103
http://apps1.eere.energy.gov/tribalenergy 104
http://www.rurdev.usda.gov/rbs/busp/9006loan.htm 105
http://www.rurdev.usda.gov/RD_Loans.html 106
http://www.rurdev.usda.gov/UEP_Loans_Grants.html 107
http://www.rurdev.usda.gov/rbs/busp/b&i_gar.htm 108
http://www.bia.gov/WhoWeAre/AS-IA/IEED/DCI/index.htm 109
http://portal.hud.gov/hudportal/HUD?src=/program_offices/public_indian_housing/ih/homeownership/184 110
http://portal.hud.gov/hudportal/HUD?src=/program_offices/public_indian_housing/ih/homeownership/titlev 111
http://www.irs.gov/pub/irs-tege/tc_and_stcb_q-a._09-07-10_1.5.pdf

Iowa Tribe of Oklahoma Wind Study Report 106
7.6.1. Project Conclusions
The forecast for power prices in SPP is not supportive of wind development at its current level. As
indicated above, the projected power rates in the SPP are much lower than in other markets, and this is
the primary reason why the project economics are not more robust. In other markets with slightly
higher pricing, the project would have favorable rates of return. A future increase in power prices, plus
the potential to reduce capital costs through advantageous turbine pricing could easily result in an
economically viable project.
It should also be noted that a 50 MW project is more easily justified economically then a 20 MW project.
Certain costs are fixed regardless of project size, including project financing transaction costs, which can
be substantial. Also, many construction costs are fixed, such as mobilization, making a larger project
with larger revenues helps to offset those costs.
7.6.2. Key Findings
Table 27: Financial Modeling Findings
Case Key Findings Recommended Follow-up Action
1 50 MW project could be economic at reduced turbine costs and increased revenues.
Investigate options for more favorable turbine pricing and seek opportunities for increased revenue.
2 Smaller projects are not likely to be economic.
Pursue 50 MW project unless SPP power prices increase.
7.7. Analysis
7.7.1. Summary
The analysis investigated the economics of a wind farm under two scenarios:
1) 29 turbines of 1.7 MW capacity each, for a total wind farm capacity of 49.3 MW.
2) 12 turbines of 1.7 MW capacity each, for a total wind farm capacity of 20.4 MW.
In each of these scenarios, several cases were analyzed for different revenue expectations and capital costs.
7.7.2. Key Findings
Table 28: Key Findings for both the 20 MW and 50 MW case
Key Findings Recommended Follow-up Action
1 Base Case economics are not favorable
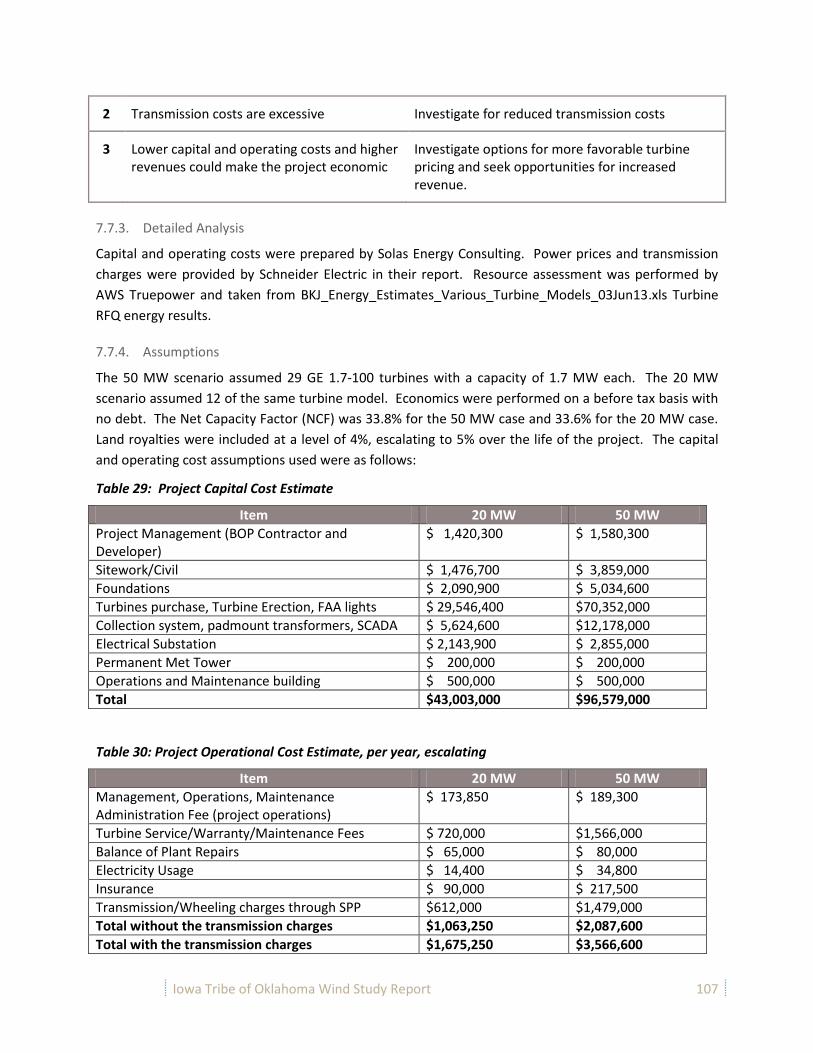
Iowa Tribe of Oklahoma Wind Study Report 107
2 Transmission costs are excessive Investigate for reduced transmission costs
3 Lower capital and operating costs and higher revenues could make the project economic
Investigate options for more favorable turbine pricing and seek opportunities for increased revenue.
7.7.3. Detailed Analysis
Capital and operating costs were prepared by Solas Energy Consulting. Power prices and transmission
charges were provided by Schneider Electric in their report. Resource assessment was performed by
AWS Truepower and taken from BKJ_Energy_Estimates_Various_Turbine_Models_03Jun13.xls Turbine
RFQ energy results.
7.7.4. Assumptions
The 50 MW scenario assumed 29 GE 1.7-100 turbines with a capacity of 1.7 MW each. The 20 MW
scenario assumed 12 of the same turbine model. Economics were performed on a before tax basis with
no debt. The Net Capacity Factor (NCF) was 33.8% for the 50 MW case and 33.6% for the 20 MW case.
Land royalties were included at a level of 4%, escalating to 5% over the life of the project. The capital
and operating cost assumptions used were as follows:
Table 29: Project Capital Cost Estimate
Item 20 MW 50 MW
Project Management (BOP Contractor and Developer)
$ 1,420,300 $ 1,580,300
Sitework/Civil $ 1,476,700 $ 3,859,000
Foundations $ 2,090,900 $ 5,034,600
Turbines purchase, Turbine Erection, FAA lights $ 29,546,400 $70,352,000
Collection system, padmount transformers, SCADA $ 5,624,600 $12,178,000
Electrical Substation $ 2,143,900 $ 2,855,000
Permanent Met Tower $ 200,000 $ 200,000
Operations and Maintenance building $ 500,000 $ 500,000
Total $43,003,000 $96,579,000
Table 30: Project Operational Cost Estimate, per year, escalating
Item 20 MW 50 MW
Management, Operations, Maintenance Administration Fee (project operations)
$ 173,850 $ 189,300
Turbine Service/Warranty/Maintenance Fees $ 720,000 $1,566,000
Balance of Plant Repairs $ 65,000 $ 80,000
Electricity Usage $ 14,400 $ 34,800
Insurance $ 90,000 $ 217,500
Transmission/Wheeling charges through SPP $612,000 $1,479,000
Total without the transmission charges $1,063,250 $2,087,600
Total with the transmission charges $1,675,250 $3,566,600
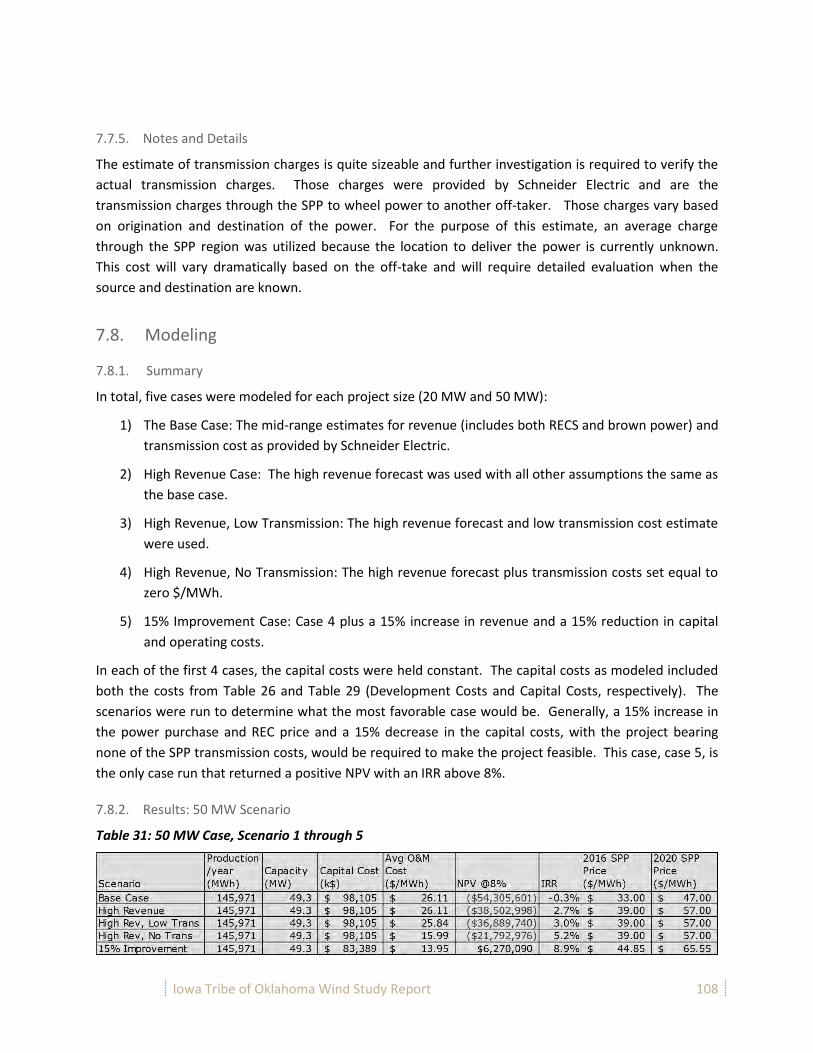
Iowa Tribe of Oklahoma Wind Study Report 108
7.7.5. Notes and Details
The estimate of transmission charges is quite sizeable and further investigation is required to verify the
actual transmission charges. Those charges were provided by Schneider Electric and are the
transmission charges through the SPP to wheel power to another off-taker. Those charges vary based
on origination and destination of the power. For the purpose of this estimate, an average charge
through the SPP region was utilized because the location to deliver the power is currently unknown.
This cost will vary dramatically based on the off-take and will require detailed evaluation when the
source and destination are known.
7.8. Modeling
7.8.1. Summary
In total, five cases were modeled for each project size (20 MW and 50 MW):
1) The Base Case: The mid-range estimates for revenue (includes both RECS and brown power) and
transmission cost as provided by Schneider Electric.
2) High Revenue Case: The high revenue forecast was used with all other assumptions the same as
the base case.
3) High Revenue, Low Transmission: The high revenue forecast and low transmission cost estimate
were used.
4) High Revenue, No Transmission: The high revenue forecast plus transmission costs set equal to
zero $/MWh.
5) 15% Improvement Case: Case 4 plus a 15% increase in revenue and a 15% reduction in capital
and operating costs.
In each of the first 4 cases, the capital costs were held constant. The capital costs as modeled included
both the costs from Table 26 and Table 29 (Development Costs and Capital Costs, respectively). The
scenarios were run to determine what the most favorable case would be. Generally, a 15% increase in
the power purchase and REC price and a 15% decrease in the capital costs, with the project bearing
none of the SPP transmission costs, would be required to make the project feasible. This case, case 5, is
the only case run that returned a positive NPV with an IRR above 8%.
7.8.2. Results: 50 MW Scenario
Table 31: 50 MW Case, Scenario 1 through 5
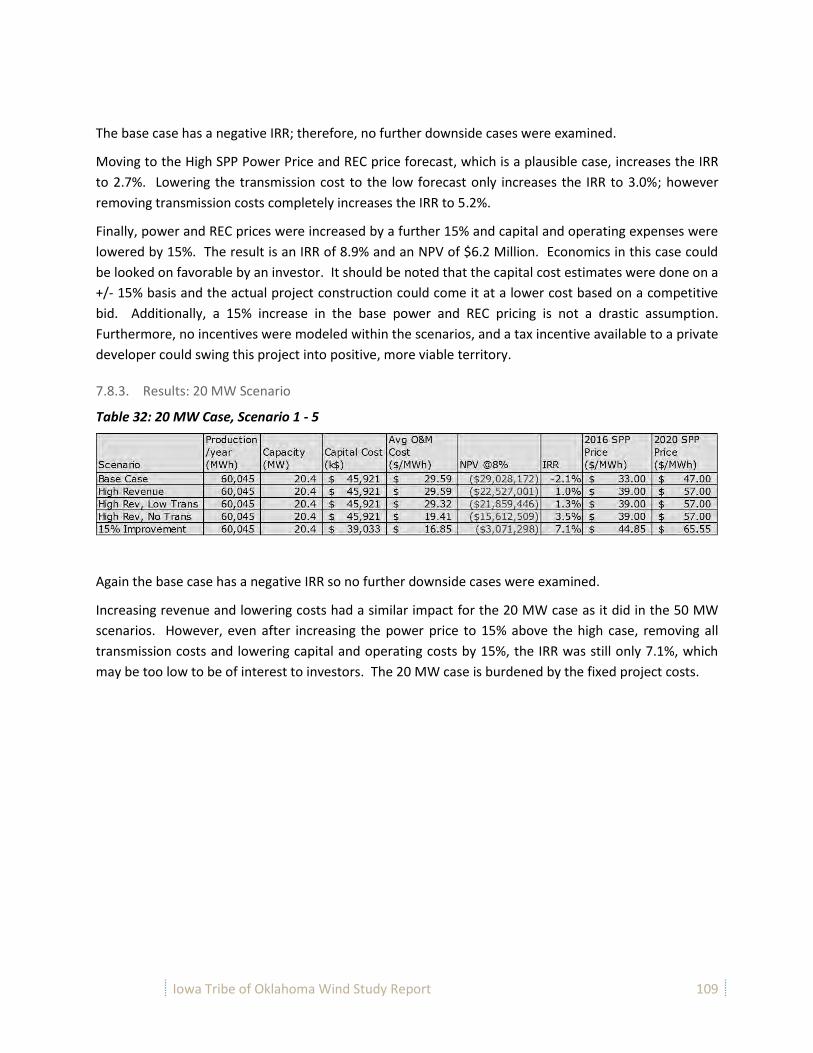
Iowa Tribe of Oklahoma Wind Study Report 109
The base case has a negative IRR; therefore, no further downside cases were examined.
Moving to the High SPP Power Price and REC price forecast, which is a plausible case, increases the IRR
to 2.7%. Lowering the transmission cost to the low forecast only increases the IRR to 3.0%; however
removing transmission costs completely increases the IRR to 5.2%.
Finally, power and REC prices were increased by a further 15% and capital and operating expenses were
lowered by 15%. The result is an IRR of 8.9% and an NPV of $6.2 Million. Economics in this case could
be looked on favorable by an investor. It should be noted that the capital cost estimates were done on a
+/- 15% basis and the actual project construction could come it at a lower cost based on a competitive
bid. Additionally, a 15% increase in the base power and REC pricing is not a drastic assumption.
Furthermore, no incentives were modeled within the scenarios, and a tax incentive available to a private
developer could swing this project into positive, more viable territory.
7.8.3. Results: 20 MW Scenario
Table 32: 20 MW Case, Scenario 1 - 5
Again the base case has a negative IRR so no further downside cases were examined.
Increasing revenue and lowering costs had a similar impact for the 20 MW case as it did in the 50 MW
scenarios. However, even after increasing the power price to 15% above the high case, removing all
transmission costs and lowering capital and operating costs by 15%, the IRR was still only 7.1%, which
may be too low to be of interest to investors. The 20 MW case is burdened by the fixed project costs.

Iowa Tribe of Oklahoma Wind Study Report 110
8. SUPPLEMENTAL ANALYSIS – SMALL WIND
The Tribe is currently spending in excess of $90,000 a year in electric utility bills and this feasibility study
for utility scale wind on tribal lands sparked a strong interest in exploring whether small wind could help
the Tribe not only reduce those third party utility costs, but also help to build a sustainable development
model for the future. As information was being collected and analyzed for the utility feasibility project,
additional information was collected and analysis was performed to determine the feasibility of self-
generation. This research included a detailed analysis of the Tribe’s electricity usage, the potential sizes
for a wind turbine installation, the regulations and requirements through the utility, as well as siting
information for a turbine. This supplemental analysis presents the findings of that research and analysis.
8.1. Energy Sustainability
Energy Sustainability is the concept that energy can be provided and consumed without impacting the
ability of future generations to meet their needs. Renewable energy is one avenue to sustainability;
however, energy efficiency is also an effective method and oftentimes faster and lower cost than
implementing renewable energy. The first step on the ladder to energy sustainability is understanding
the Tribe’s energy usage and identifying areas of waste and opportunities for shedding load or cutting
usage without impacting normal business, such as replacing light bulbs, aging appliances, windows, etc.
with more energy efficient options, and applying load shifting where possible. When normal operations
have been optimized, then alternatives need to be examined where small investments can create long
term energy savings, such as looking at processes and systems, and re-designing systems toward
sustainability.
Integrating Tribal renewable energy generation is an exciting and interesting way to reduce the Tribe’s
carbon footprint and move toward sustainability from an electricity perspective. It should be noted that
electricity is one aspect of energy usage –fuel in vehicles, LNG usage for heating and cool, and other
areas of energy use can also be considered. Non-electricity energy usage is outside the scope of this
study and is not discussed further.
Many renewable energy technologies focused on electricity generation are worth considering, including
small wind, ground-source heat pumps, solar PV, and solar thermal for heating and cooling. The scope
of this feasibility study is focused on wind power, and so this supplemental analysis will primarily focus
on the feasibility of small wind, however other technologies will be mentioned where appropriate.
8.2. Electricity Consumption and Load
The first step toward understanding whether renewable energy is a suitable option for the tribe is
determining the Tribe’s current energy usage. Both the profile of usage (seasonal load, time of day (or
diurnal) load, peak activities) and quantity of usage is important, as well as the actual cost of the
electricity consumed. The Tribe is serviced by two electric utilities – the Central Rural Electric
Cooperative (CREC), which has the bulk of the Tribe’s load, and Oklahoma Gas and Electric (OGE). The

Iowa Tribe of Oklahoma Wind Study Report 111
Tribe has approximately 24 accounts with CREC, which comprise the tribal complex and facilities south
of Perkins, and 3 accounts with OGE, all of which are located in Perkins. The utility bills for all of the
accounts were obtained and analyzed. Information for multiple years was obtained, and all information
reviewed was from the period January 2008 to June 2012, although data was not available for each of
the meters for this entire period. The billing is structured for both utilities with a fixed cost and a
variable cost based on electricity usage. CREC calls its fixed cost a “Service Availability Fee” and the
variable portion of the bill, based on the monthly kWh consumed is called the “Energy Charge”. OGE
has the same structure for one of the three accounts, however the fixed portion is titled the “Demand
Charge” and the variable portion is an “Energy Charge”.
8.2.1. Oklahoma Gas and Electric
OGE has a net metering program whereby residential customers can install up to a 25 kW system or any
other industrial or commercial customer can install up to a 300 kW system, so the Tribe has the option
of up to 300 kW of self-generation for its facilities within OGE. The customer is required to sign a
standard Interconnection Agreement for Net Metering Facilities with the Utility. Any excess generation
is credited back to the customer at the customer’s rate schedule until the close of a monthly billing
cycle, at which time any net excess generation credit expires. Any renewable energy credits created as a
result of the net metering belongs to the customer, and so the Tribe could sell those RECs to another
customer for an additional source of revenue.
The tribe holds three accounts with Oklahoma Gas and Electric. The service address for all three
accounts are off of Highway 33 in Perkins, at the street addresses of 425 Highway 33 and 501 Highway
33. The Tribe has clinic facilities and the Office of Environmental Services at 425 Highway 33. The
facilities at 501 Highway 33 include both a casino and an electric sign, which are metered separately. It
was also noted that a smoke-shop was co-located with these facilities, however a separate meter was
not identified for that facility. These two locations are in town and not ideal candidates for small wind
due to noise and visual impact issues, although both facilities are located on the outskirts of town and
may not have as much of an impact. The locations, however, may be suitable for a solar photovoltaic
installation. In looking at the utility bills, it was found that each account has a different rate structure,
which means that the rate paid for the electricity varies between the meters. A summary of the
accounts, rate structures, usage and pricing is as follows:
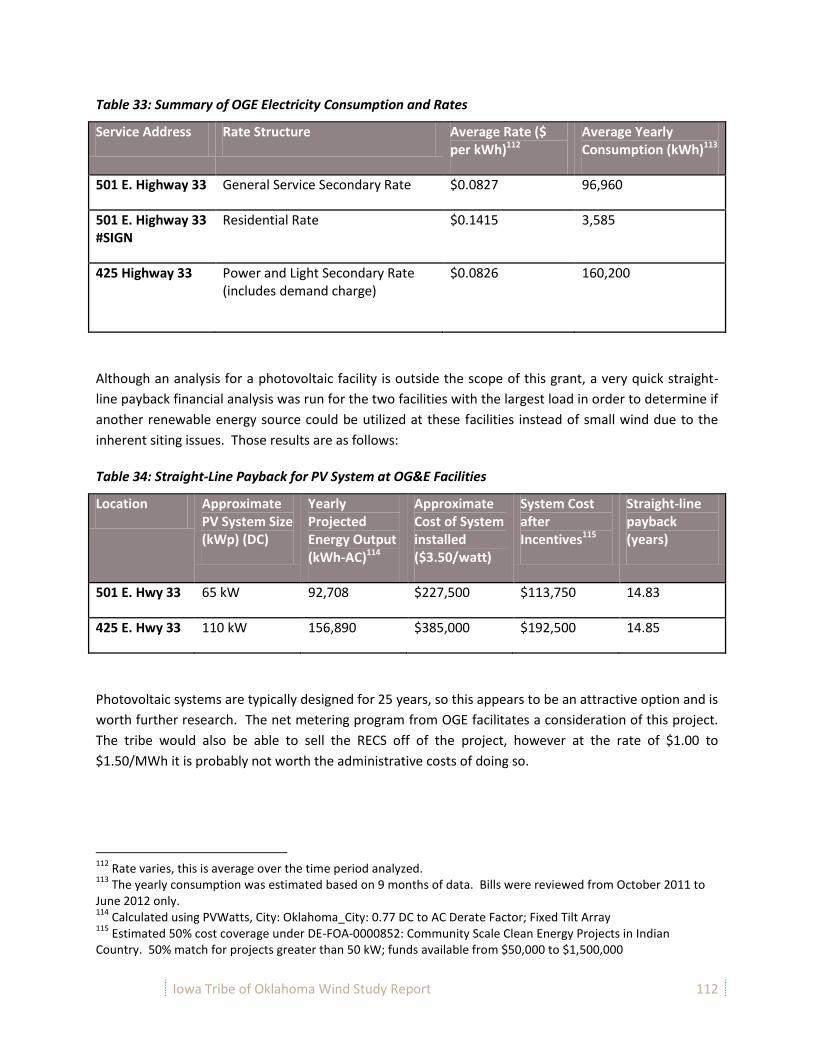
Iowa Tribe of Oklahoma Wind Study Report 112
Table 33: Summary of OGE Electricity Consumption and Rates
Service Address Rate Structure Average Rate ($ per kWh)112
Average Yearly Consumption (kWh)113
501 E. Highway 33 General Service Secondary Rate $0.0827 96,960
501 E. Highway 33 #SIGN
Residential Rate $0.1415 3,585
425 Highway 33 Power and Light Secondary Rate (includes demand charge)
$0.0826
160,200
Although an analysis for a photovoltaic facility is outside the scope of this grant, a very quick straight-
line payback financial analysis was run for the two facilities with the largest load in order to determine if
another renewable energy source could be utilized at these facilities instead of small wind due to the
inherent siting issues. Those results are as follows:
Table 34: Straight-Line Payback for PV System at OG&E Facilities
Location Approximate PV System Size (kWp) (DC)
Yearly Projected Energy Output (kWh-AC)114
Approximate Cost of System installed ($3.50/watt)
System Cost after Incentives115
Straight-line payback (years)
501 E. Hwy 33 65 kW 92,708 $227,500 $113,750 14.83
425 E. Hwy 33 110 kW 156,890 $385,000 $192,500 14.85
Photovoltaic systems are typically designed for 25 years, so this appears to be an attractive option and is
worth further research. The net metering program from OGE facilitates a consideration of this project.
The tribe would also be able to sell the RECS off of the project, however at the rate of $1.00 to
$1.50/MWh it is probably not worth the administrative costs of doing so.
112
Rate varies, this is average over the time period analyzed. 113
The yearly consumption was estimated based on 9 months of data. Bills were reviewed from October 2011 to June 2012 only. 114
Calculated using PVWatts, City: Oklahoma_City: 0.77 DC to AC Derate Factor; Fixed Tilt Array 115
Estimated 50% cost coverage under DE-FOA-0000852: Community Scale Clean Energy Projects in Indian Country. 50% match for projects greater than 50 kW; funds available from $50,000 to $1,500,000
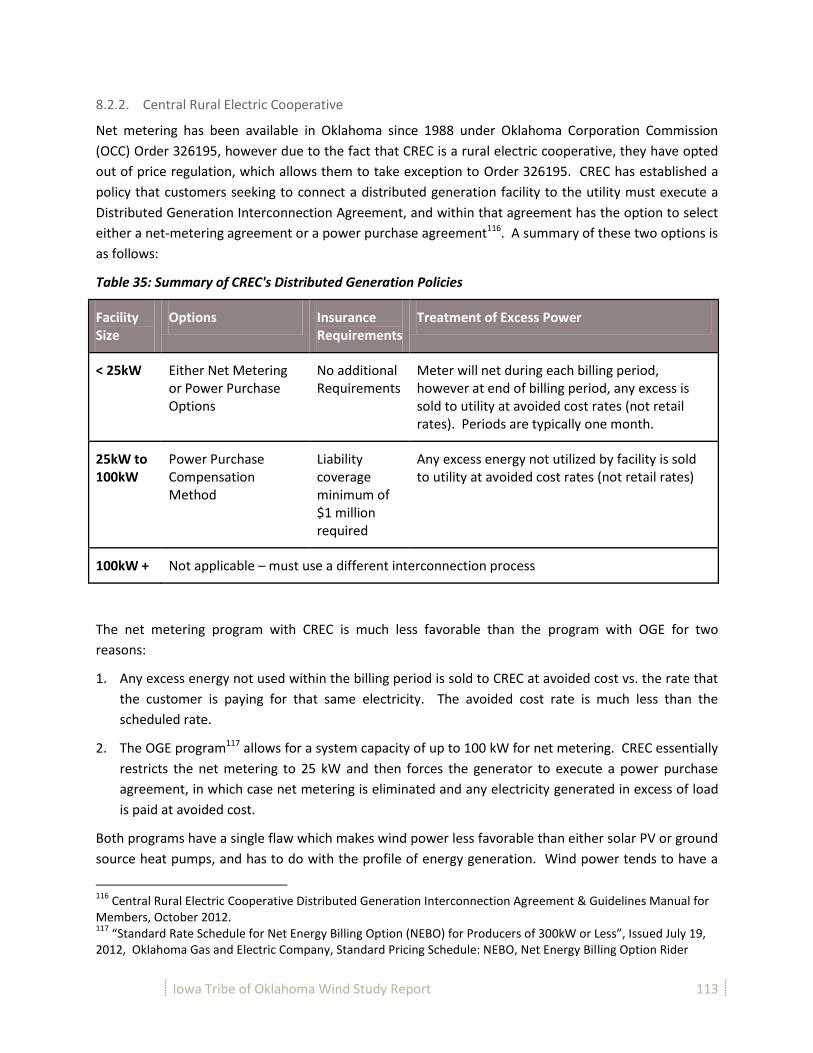
Iowa Tribe of Oklahoma Wind Study Report 113
8.2.2. Central Rural Electric Cooperative
Net metering has been available in Oklahoma since 1988 under Oklahoma Corporation Commission
(OCC) Order 326195, however due to the fact that CREC is a rural electric cooperative, they have opted
out of price regulation, which allows them to take exception to Order 326195. CREC has established a
policy that customers seeking to connect a distributed generation facility to the utility must execute a
Distributed Generation Interconnection Agreement, and within that agreement has the option to select
either a net-metering agreement or a power purchase agreement116. A summary of these two options is
as follows:
Table 35: Summary of CREC's Distributed Generation Policies
Facility Size
Options Insurance Requirements
Treatment of Excess Power
< 25kW Either Net Metering or Power Purchase Options
No additional Requirements
Meter will net during each billing period, however at end of billing period, any excess is sold to utility at avoided cost rates (not retail rates). Periods are typically one month.
25kW to 100kW
Power Purchase Compensation Method
Liability coverage minimum of $1 million required
Any excess energy not utilized by facility is sold to utility at avoided cost rates (not retail rates)
100kW + Not applicable – must use a different interconnection process
The net metering program with CREC is much less favorable than the program with OGE for two
reasons:
1. Any excess energy not used within the billing period is sold to CREC at avoided cost vs. the rate that
the customer is paying for that same electricity. The avoided cost rate is much less than the
scheduled rate.
2. The OGE program117 allows for a system capacity of up to 100 kW for net metering. CREC essentially
restricts the net metering to 25 kW and then forces the generator to execute a power purchase
agreement, in which case net metering is eliminated and any electricity generated in excess of load
is paid at avoided cost.
Both programs have a single flaw which makes wind power less favorable than either solar PV or ground
source heat pumps, and has to do with the profile of energy generation. Wind power tends to have a
116
Central Rural Electric Cooperative Distributed Generation Interconnection Agreement & Guidelines Manual for Members, October 2012. 117
“Standard Rate Schedule for Net Energy Billing Option (NEBO) for Producers of 300kW or Less”, Issued July 19, 2012, Oklahoma Gas and Electric Company, Standard Pricing Schedule: NEBO, Net Energy Billing Option Rider
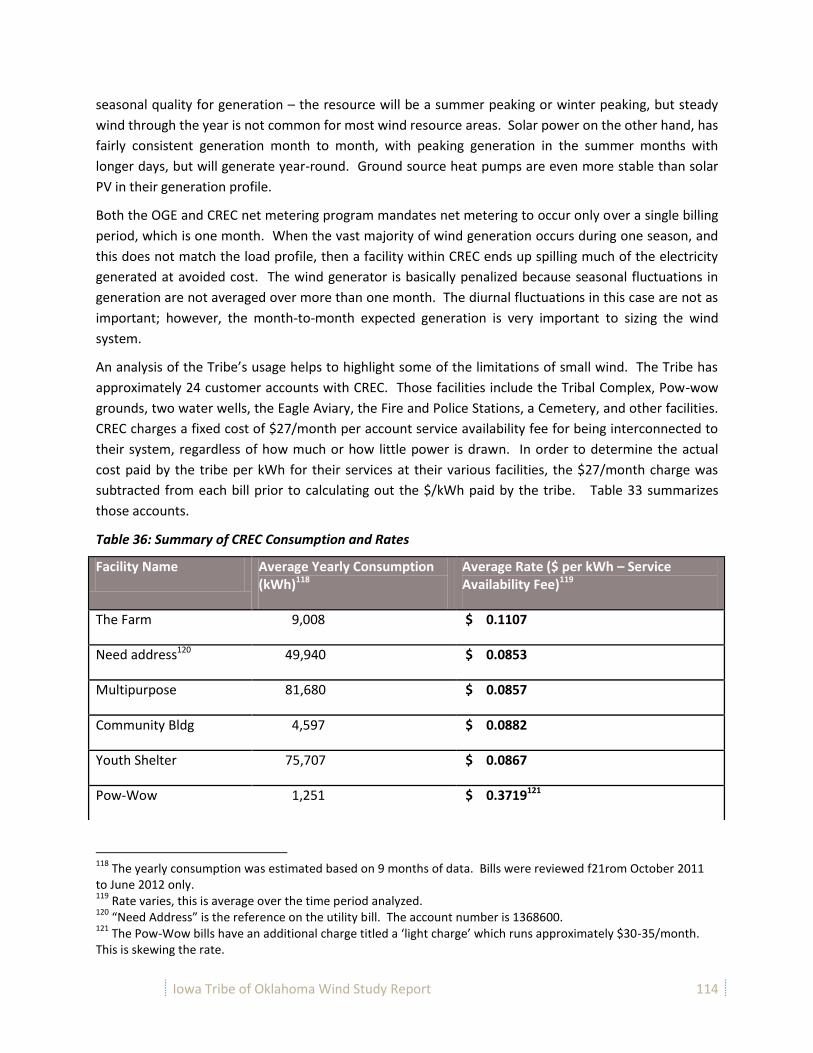
Iowa Tribe of Oklahoma Wind Study Report 114
seasonal quality for generation – the resource will be a summer peaking or winter peaking, but steady
wind through the year is not common for most wind resource areas. Solar power on the other hand, has
fairly consistent generation month to month, with peaking generation in the summer months with
longer days, but will generate year-round. Ground source heat pumps are even more stable than solar
PV in their generation profile.
Both the OGE and CREC net metering program mandates net metering to occur only over a single billing
period, which is one month. When the vast majority of wind generation occurs during one season, and
this does not match the load profile, then a facility within CREC ends up spilling much of the electricity
generated at avoided cost. The wind generator is basically penalized because seasonal fluctuations in
generation are not averaged over more than one month. The diurnal fluctuations in this case are not as
important; however, the month-to-month expected generation is very important to sizing the wind
system.
An analysis of the Tribe’s usage helps to highlight some of the limitations of small wind. The Tribe has
approximately 24 customer accounts with CREC. Those facilities include the Tribal Complex, Pow-wow
grounds, two water wells, the Eagle Aviary, the Fire and Police Stations, a Cemetery, and other facilities.
CREC charges a fixed cost of $27/month per account service availability fee for being interconnected to
their system, regardless of how much or how little power is drawn. In order to determine the actual
cost paid by the tribe per kWh for their services at their various facilities, the $27/month charge was
subtracted from each bill prior to calculating out the $/kWh paid by the tribe. Table 33 summarizes
those accounts.
Table 36: Summary of CREC Consumption and Rates
Facility Name Average Yearly Consumption (kWh)118
Average Rate ($ per kWh – Service Availability Fee)119
The Farm 9,008 $ 0.1107
Need address120 49,940 $ 0.0853
Multipurpose 81,680 $ 0.0857
Community Bldg 4,597 $ 0.0882
Youth Shelter 75,707 $ 0.0867
Pow-Wow 1,251 $ 0.3719121
118
The yearly consumption was estimated based on 9 months of data. Bills were reviewed f21rom October 2011 to June 2012 only. 119
Rate varies, this is average over the time period analyzed. 120
“Need Address” is the reference on the utility bill. The account number is 1368600. 121
The Pow-Wow bills have an additional charge titled a ‘light charge’ which runs approximately $30-35/month. This is skewing the rate.
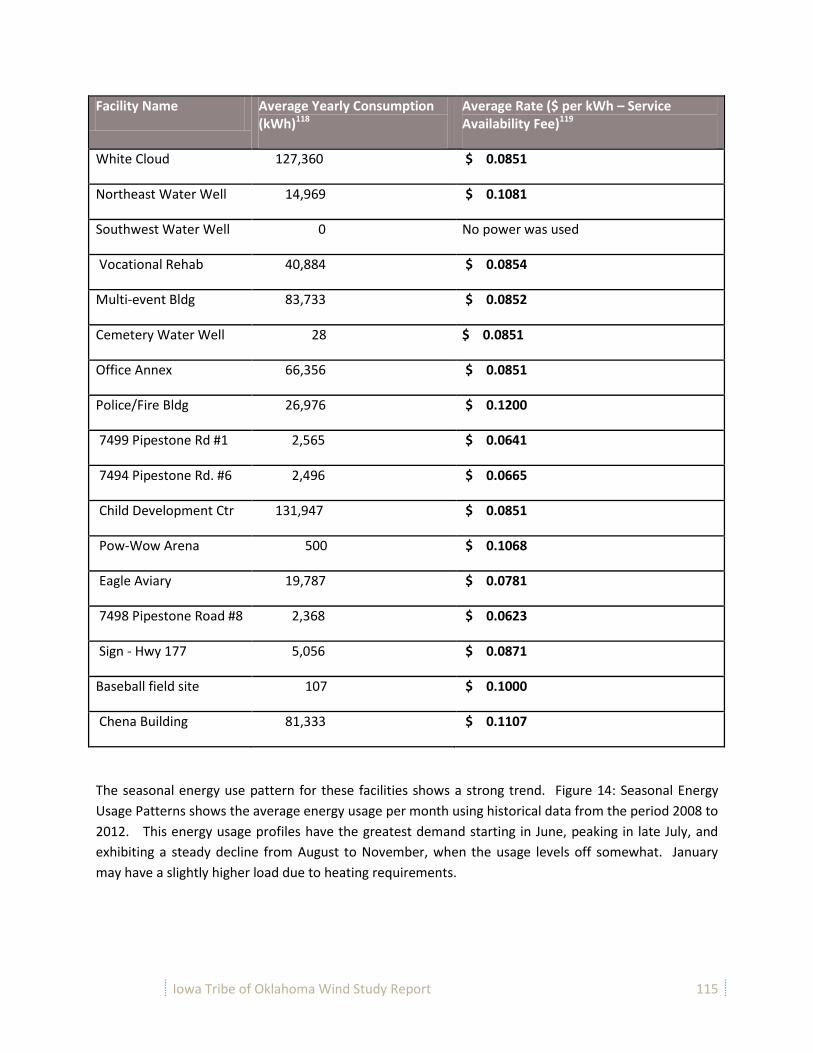
Iowa Tribe of Oklahoma Wind Study Report 115
Facility Name Average Yearly Consumption (kWh)118
Average Rate ($ per kWh – Service Availability Fee)119
White Cloud 127,360 $ 0.0851
Northeast Water Well 14,969 $ 0.1081
Southwest Water Well 0 No power was used
Vocational Rehab 40,884 $ 0.0854
Multi-event Bldg 83,733 $ 0.0852
Cemetery Water Well 28 $ 0.0851
Office Annex 66,356 $ 0.0851
Police/Fire Bldg 26,976 $ 0.1200
7499 Pipestone Rd #1 2,565 $ 0.0641
7494 Pipestone Rd. #6 2,496 $ 0.0665
Child Development Ctr 131,947 $ 0.0851
Pow-Wow Arena 500 $ 0.1068
Eagle Aviary 19,787 $ 0.0781
7498 Pipestone Road #8 2,368 $ 0.0623
Sign - Hwy 177 5,056 $ 0.0871
Baseball field site 107 $ 0.1000
Chena Building 81,333 $ 0.1107
The seasonal energy use pattern for these facilities shows a strong trend. Figure 14: Seasonal Energy
Usage Patterns shows the average energy usage per month using historical data from the period 2008 to
2012. This energy usage profiles have the greatest demand starting in June, peaking in late July, and
exhibiting a steady decline from August to November, when the usage levels off somewhat. January
may have a slightly higher load due to heating requirements.
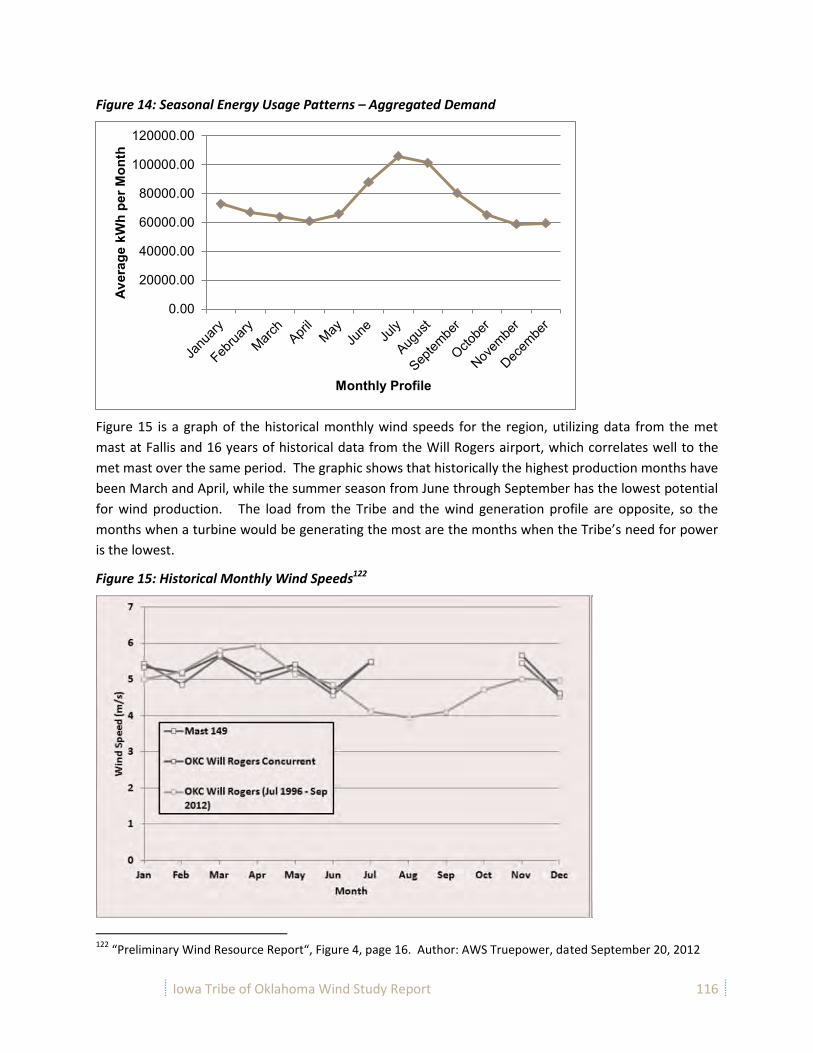
Iowa Tribe of Oklahoma Wind Study Report 116
Figure 14: Seasonal Energy Usage Patterns – Aggregated Demand
Figure 15 is a graph of the historical monthly wind speeds for the region, utilizing data from the met
mast at Fallis and 16 years of historical data from the Will Rogers airport, which correlates well to the
met mast over the same period. The graphic shows that historically the highest production months have
been March and April, while the summer season from June through September has the lowest potential
for wind production. The load from the Tribe and the wind generation profile are opposite, so the
months when a turbine would be generating the most are the months when the Tribe’s need for power
is the lowest.
Figure 15: Historical Monthly Wind Speeds122
122
“Preliminary Wind Resource Report“, Figure 4, page 16. Author: AWS Truepower, dated September 20, 2012
0.00
20000.00
40000.00
60000.00
80000.00
100000.00
120000.00Av
erag
e kW
h pe
r Mon
th
Monthly Profile

Iowa Tribe of Oklahoma Wind Study Report 117
In examining the utility costs, usage, and seasonal profiles, several conclusions can be drawn. The first is
that a self-generation program that utilizes net metering needs to take into account seasonal energy
use, and production profiles need to be layered onto the load profile to size the system such that base
energy usage in the lowest month is not significantly exceeded. If the resource follows the load, that
technology will have a strong advantage due to the fact that any excess generation in a particular month
is given to the utility for little compensation. Since wind power generation does not follow the load, the
wind turbine needs to be sized such that the maximum generation, which historically occurs in April
does not exceed the minimum load, which also occurs in April.
It should be clarified that the aggregation of the data for electricity usage is not entirely representative
of the actual situation and each of the 24 meters within CREC has its own yearly energy use patterns.
This analysis however has helped to frame the limitations and requirements for the selection of a site
and a turbine for the development of small wind. Those key finds are presented in Table 37.
Table 37: Key Findings - Electricity Consumption and Load
Key Findings
1 A key criteria for wind turbine selection is that the capacity should fall below the 25kW limitation for net metering within CREC.
2 Each of the 24 individual meters requires analysis to determine which location has the best seasonal load profile to match the generation.
3 The turbine should be sized such that the month for highest generation does not exceed the lowest expected monthly usage.
8.2.3. Additional Observations and Recommendations
In addition to the key findings provided in Table 37, several ideas for cost savings can be drawn from the analysis of the electricity usage and cost. The first is that there are several accounts where little or no power is being drawn, however the tribe is paying a flat rate of $27/month for the service availability, which is the equivalent of $324/year per account. Reviewing these accounts for usage is the first opportunity for cost savings.
Table 38: Specific Opportunities for Cost Savings
Facility Effective Rate of Electricity ($/kWh)
Comments
Southwest Water Well
$324/year for no benefit
No usage was experienced on this account for the period for which bills were reviewed. Research if this can be disconnected from service.
Cemetery Water Well
$11.66 per kWh Over the period researched, 28 kW were utilized. Research if this can be disconnected from service and an alternative method like a solar or hand pump can be utilized.
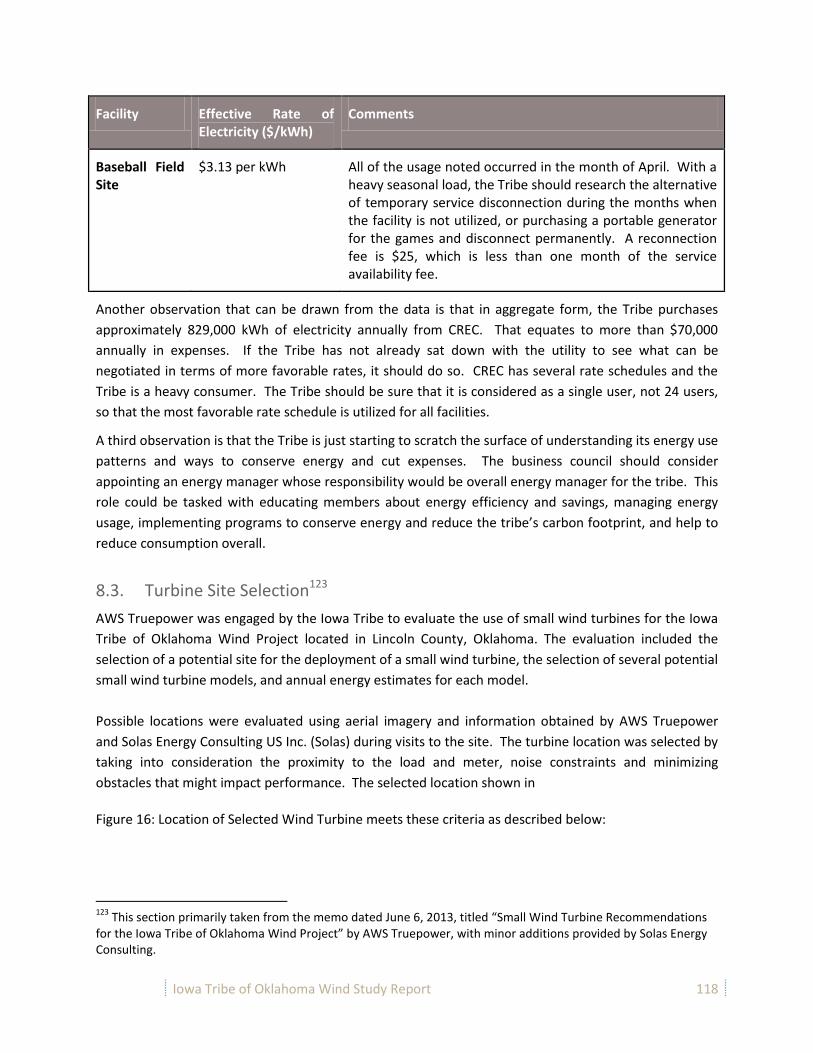
Iowa Tribe of Oklahoma Wind Study Report 118
Facility Effective Rate of Electricity ($/kWh)
Comments
Baseball Field Site
$3.13 per kWh All of the usage noted occurred in the month of April. With a heavy seasonal load, the Tribe should research the alternative of temporary service disconnection during the months when the facility is not utilized, or purchasing a portable generator for the games and disconnect permanently. A reconnection fee is $25, which is less than one month of the service availability fee.
Another observation that can be drawn from the data is that in aggregate form, the Tribe purchases
approximately 829,000 kWh of electricity annually from CREC. That equates to more than $70,000
annually in expenses. If the Tribe has not already sat down with the utility to see what can be
negotiated in terms of more favorable rates, it should do so. CREC has several rate schedules and the
Tribe is a heavy consumer. The Tribe should be sure that it is considered as a single user, not 24 users,
so that the most favorable rate schedule is utilized for all facilities.
A third observation is that the Tribe is just starting to scratch the surface of understanding its energy use
patterns and ways to conserve energy and cut expenses. The business council should consider
appointing an energy manager whose responsibility would be overall energy manager for the tribe. This
role could be tasked with educating members about energy efficiency and savings, managing energy
usage, implementing programs to conserve energy and reduce the tribe’s carbon footprint, and help to
reduce consumption overall.
8.3. Turbine Site Selection123
AWS Truepower was engaged by the Iowa Tribe to evaluate the use of small wind turbines for the Iowa
Tribe of Oklahoma Wind Project located in Lincoln County, Oklahoma. The evaluation included the
selection of a potential site for the deployment of a small wind turbine, the selection of several potential
small wind turbine models, and annual energy estimates for each model.
Possible locations were evaluated using aerial imagery and information obtained by AWS Truepower
and Solas Energy Consulting US Inc. (Solas) during visits to the site. The turbine location was selected by
taking into consideration the proximity to the load and meter, noise constraints and minimizing
obstacles that might impact performance. The selected location shown in
Figure 16: Location of Selected Wind Turbine meets these criteria as described below:
123
This section primarily taken from the memo dated June 6, 2013, titled “Small Wind Turbine Recommendations for the Iowa Tribe of Oklahoma Wind Project” by AWS Truepower, with minor additions provided by Solas Energy Consulting.
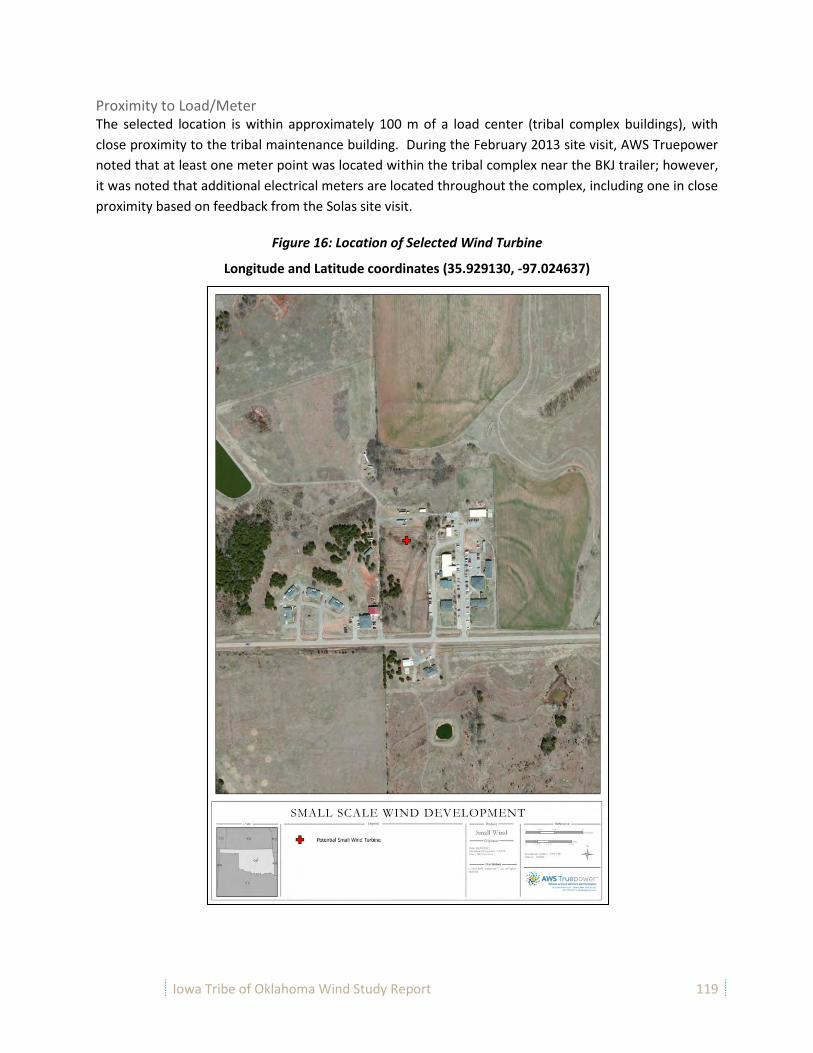
Iowa Tribe of Oklahoma Wind Study Report 119
Proximity to Load/Meter The selected location is within approximately 100 m of a load center (tribal complex buildings), with
close proximity to the tribal maintenance building. During the February 2013 site visit, AWS Truepower
noted that at least one meter point was located within the tribal complex near the BKJ trailer; however,
it was noted that additional electrical meters are located throughout the complex, including one in close
proximity based on feedback from the Solas site visit.
Figure 16: Location of Selected Wind Turbine
Longitude and Latitude coordinates (35.929130, -97.024637)
Iowa Tribe of Oklahoma Wind Study Report 120
Noise Constraints The nearest buildings include a tribal maintenance building, meeting and office building, and health
facilities. Noise from the turbine is not expected to be of significant impact to the facilities since they
are not routinely occupied at night and will be subject to normal office noise levels when occupied (60-
70 dB). The nearest sensitive receptors are the elder housing units located to the southwest of the
proposed turbine location. Based on the wind direction distribution (wind rose) for this site, the wind
primarily comes from the south (SSE to SSW) with occasional winds from the north-northwest and
north. Because of this wind direction distribution, it is expected that minimal noise impacts will be
experienced at the elder housing units.
Species and Habitat Assessment Atwell completed a Species and Habitat Assessment124 of the single wind turbine adjacent to the Iowa
Tribal complex as shown in Figure 16. It included an approximate 0.3 mile collection line to the point of
interconnection. A biologist visited the site on April 23 – April 25, 2013.
The project site lacks optimal habitat and provides limited potentially-suitable habitat for the least
tern, the piping plover, and the whooping crane. The piping plover, least tern and whooping crane
may pass within or adjacent to the project site as part of migration events, however their presence
is unlikely due to the limited wetland and other aquatic habitats located within and adjacent to the
project site. The potential presence of least terns on the nearby Cimarron River should not pose a
problem because their occurrence at this location is rare, and the riverine habitat is preferable to
habitat located within the project site. It is, therefore, unlikely that the proposed development
would have an increased adverse impact on the least tern, the piping plover, and/or the whooping
crane. Suitable habitat for the Texas horned lizard is available within the project site and harvester
ant mounds, the preferred prey item for this lizard, were observed within the project site;
additional informal coordination with the ODWC may be recommended to reduce potential adverse
impacts to this species. In addition, the implementation of Best Management Practices (BMPs)
within the project site is recommended during construction, operation, and maintenance activities
to further reduce potential concerns for the Texas horned lizard, the least tern, the piping plover,
and the whooping crane. If the project footprint is developed to impact the wetland feature
observed on-site, a formal wetland delineation is recommended to determine the precise location
of potentially-jurisdictional wetlands within the proposed construction footprint. Avoidance of
wetlands and watercourse, including associated riparian corridors and/or floodplains located within
the project site, is recommended to avoid potential permitting requirements through state and/or
federal agencies.
Cultural Resources
Atwell performed a Phase I Pedestrian Archaeological Survey125 for a single wind turbine adjacent to the
Iowa Tribal complex. The project area encompasses 22 acres of land and includes a two-acre wind
124
This section primarily taken from the report by Haas, Chris “Atwell Letter of Finding: Species and Habitat Assessment Iowa Tribe of Oklahoma Project, Single-Turbine Site Lincoln County Oklahoma” May 10, 2013

Iowa Tribe of Oklahoma Wind Study Report 121
turbine pad and approximately 4,388 linear feet of underground collection line, including a 200-foot
easement (100 feet on either side of centerline).
The Phase I archaeological survey conducted by Atwell was designed to identify and inventory cultural
resources within the project area in order to comply with Section 106 of the National Historic
Preservation Act (NHPA) and its implementing regulations (36 Code of Federal Regulations CFR Part
800).
A cultural resources records review conducted as part of this investigation did not identify previously-
documented archaeological sites within the project area, nor did it identify historic properties listed on
or eligible for listing on the National Register of Historic Places (NRHP) within one mile of the project
area. A single archaeological survey has been previously conducted within a small portion of the project
area.
The pedestrian archaeological survey indicated that the proposed turbine location is within a pasture
currently grazed by bison (Bison bison). Additionally, the survey indicated that the proposed collection
line routes have a large amount of previous disturbance. Archaeological or historic resources were not
identified within the project area. Therefore, Atwell recommends that the proposed project be allowed
to proceed as planned without further archaeological investigations, provided that 1) the project layout
is not altered beyond the area surveyed during this investigation, or 2) no archaeological discoveries are
made during project construction. It is possible, due to the nature of archaeological manifestations, that
buried cultural deposits could be encountered during construction. If that occurs, we recommend
construction should cease in the immediate area, the artifacts left in place, and the client’s
representative archaeologist be contacted immediately so that appropriate actions can be carried out as
soon as possible.
Minimize Upwind Obstacles126
The proposed location is in an open field with some scattered trees to the west and southwest and the
tribal complex buildings to the east. No nearby obstacles are located upwind of the turbine from the
prevailing or secondary wind directions discussed above.
8.4. Turbine Selection127
The selection criteria for choosing an appropriate small wind turbine for the site were split into two
main categories: the site limitations and technology requirements of the site, and the credibility and
capability of the small wind vendor.
As discussed in the Key Findings in Table 37: Key Findings - Electricity Consumption and Load, the
requirements of the Iowa Tribe of Oklahoma site limit the selection of the turbine technology to single
phase turbines that are rated at 25 kW or less. The 25 kW limit is due to the net metering restrictions of
125
Banks, Benjamin D. (Atwell) “Phase I Pedestrian Archaeological Survey with Shovel Testing for the Iowa Tribe of Oklahoma Wind Energy Project Wind Turbine Generator 1 Lincoln County, Oklahoma” April 24, 2013. 126
ibid 123 127
ibid 123
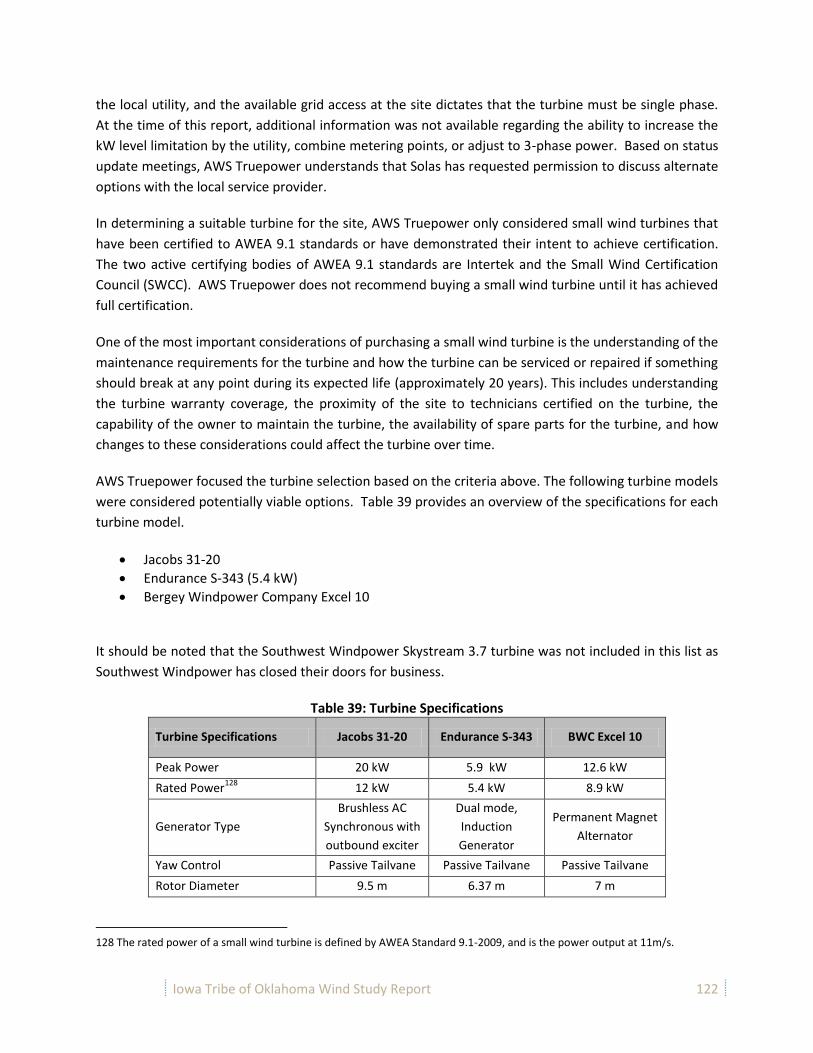
Iowa Tribe of Oklahoma Wind Study Report 122
the local utility, and the available grid access at the site dictates that the turbine must be single phase.
At the time of this report, additional information was not available regarding the ability to increase the
kW level limitation by the utility, combine metering points, or adjust to 3-phase power. Based on status
update meetings, AWS Truepower understands that Solas has requested permission to discuss alternate
options with the local service provider.
In determining a suitable turbine for the site, AWS Truepower only considered small wind turbines that
have been certified to AWEA 9.1 standards or have demonstrated their intent to achieve certification.
The two active certifying bodies of AWEA 9.1 standards are Intertek and the Small Wind Certification
Council (SWCC). AWS Truepower does not recommend buying a small wind turbine until it has achieved
full certification.
One of the most important considerations of purchasing a small wind turbine is the understanding of the
maintenance requirements for the turbine and how the turbine can be serviced or repaired if something
should break at any point during its expected life (approximately 20 years). This includes understanding
the turbine warranty coverage, the proximity of the site to technicians certified on the turbine, the
capability of the owner to maintain the turbine, the availability of spare parts for the turbine, and how
changes to these considerations could affect the turbine over time.
AWS Truepower focused the turbine selection based on the criteria above. The following turbine models
were considered potentially viable options. Table 39 provides an overview of the specifications for each
turbine model.
Jacobs 31-20
Endurance S-343 (5.4 kW)
Bergey Windpower Company Excel 10
It should be noted that the Southwest Windpower Skystream 3.7 turbine was not included in this list as
Southwest Windpower has closed their doors for business.
Table 39: Turbine Specifications
Turbine Specifications Jacobs 31-20 Endurance S-343 BWC Excel 10
Peak Power 20 kW 5.9 kW 12.6 kW
Rated Power128
12 kW 5.4 kW 8.9 kW
Generator Type
Brushless AC
Synchronous with
outbound exciter
Dual mode,
Induction
Generator
Permanent Magnet
Alternator
Yaw Control Passive Tailvane Passive Tailvane Passive Tailvane
Rotor Diameter 9.5 m 6.37 m 7 m
128 The rated power of a small wind turbine is defined by AWEA Standard 9.1-2009, and is the power output at 11m/s.
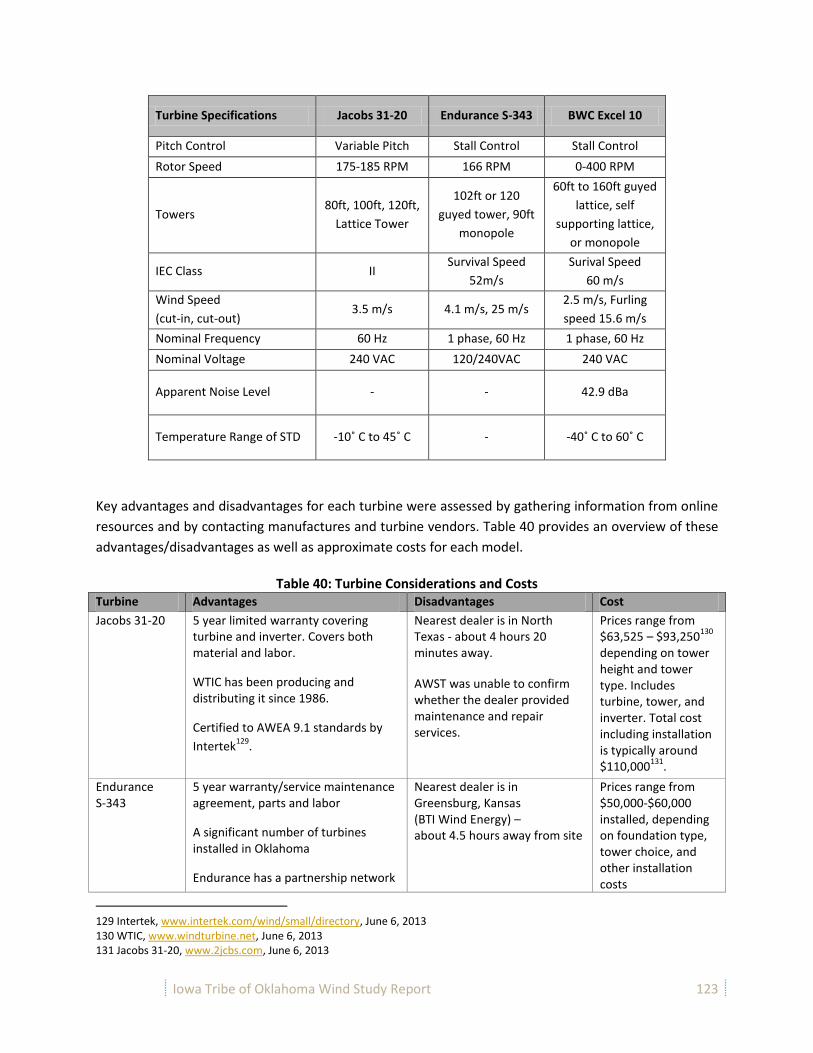
Iowa Tribe of Oklahoma Wind Study Report 123
Turbine Specifications Jacobs 31-20 Endurance S-343 BWC Excel 10
Pitch Control Variable Pitch Stall Control Stall Control
Rotor Speed 175-185 RPM 166 RPM 0-400 RPM
Towers 80ft, 100ft, 120ft,
Lattice Tower
102ft or 120
guyed tower, 90ft
monopole
60ft to 160ft guyed
lattice, self
supporting lattice,
or monopole
IEC Class II Survival Speed
52m/s
Surival Speed
60 m/s
Wind Speed
(cut-in, cut-out) 3.5 m/s 4.1 m/s, 25 m/s
2.5 m/s, Furling
speed 15.6 m/s
Nominal Frequency 60 Hz 1 phase, 60 Hz 1 phase, 60 Hz
Nominal Voltage 240 VAC 120/240VAC 240 VAC
Apparent Noise Level - - 42.9 dBa
Temperature Range of STD -10˚ C to 45˚ C - -40˚ C to 60˚ C
Key advantages and disadvantages for each turbine were assessed by gathering information from online
resources and by contacting manufactures and turbine vendors. Table 40 provides an overview of these
advantages/disadvantages as well as approximate costs for each model.
Table 40: Turbine Considerations and Costs Turbine Advantages Disadvantages Cost
Jacobs 31-20 5 year limited warranty covering turbine and inverter. Covers both material and labor.
WTIC has been producing and distributing it since 1986.
Certified to AWEA 9.1 standards by
Intertek129
.
Nearest dealer is in North Texas - about 4 hours 20 minutes away.
AWST was unable to confirm whether the dealer provided maintenance and repair services.
Prices range from $63,525 – $93,250
130
depending on tower height and tower type. Includes turbine, tower, and inverter. Total cost including installation is typically around $110,000
131.
Endurance S-343
5 year warranty/service maintenance agreement, parts and labor
A significant number of turbines installed in Oklahoma
Endurance has a partnership network
Nearest dealer is in Greensburg, Kansas (BTI Wind Energy) – about 4.5 hours away from site
Prices range from $50,000-$60,000 installed, depending on foundation type, tower choice, and other installation costs
129 Intertek, www.intertek.com/wind/small/directory, June 6, 2013 130 WTIC, www.windturbine.net, June 6, 2013 131 Jacobs 31-20, www.2jcbs.com, June 6, 2013
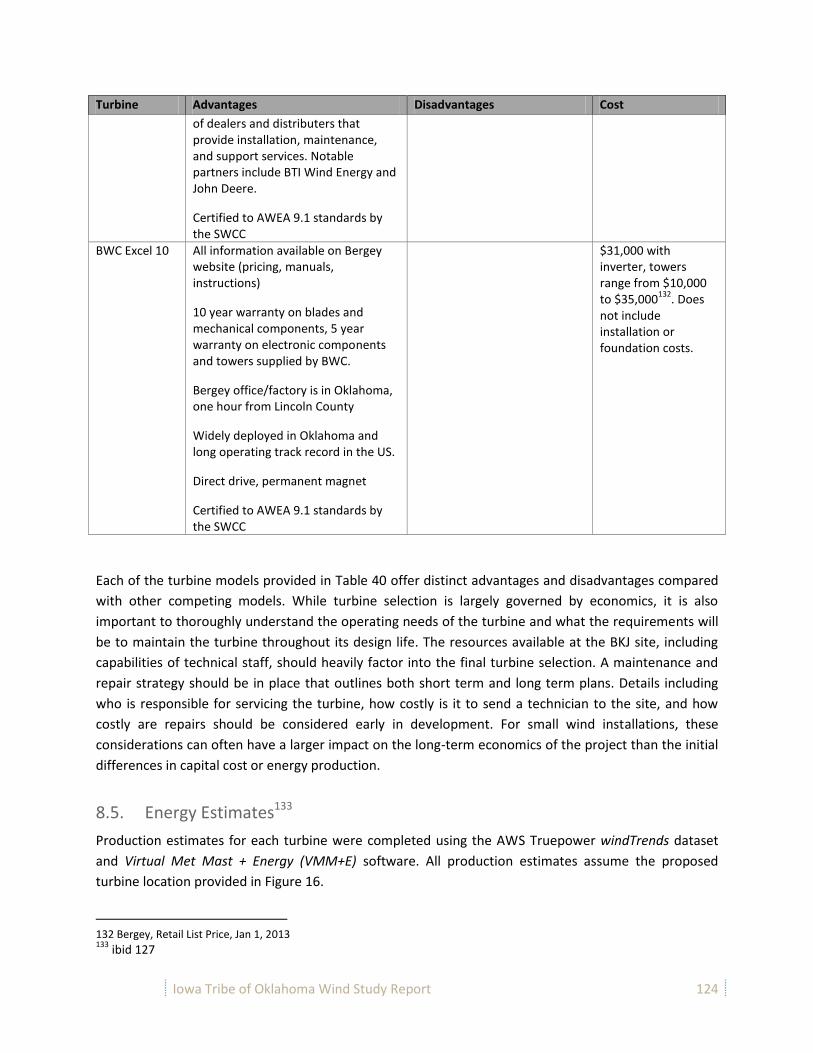
Iowa Tribe of Oklahoma Wind Study Report 124
Turbine Advantages Disadvantages Cost
of dealers and distributers that provide installation, maintenance, and support services. Notable partners include BTI Wind Energy and John Deere.
Certified to AWEA 9.1 standards by the SWCC
BWC Excel 10 All information available on Bergey website (pricing, manuals, instructions)
10 year warranty on blades and mechanical components, 5 year warranty on electronic components and towers supplied by BWC.
Bergey office/factory is in Oklahoma, one hour from Lincoln County
Widely deployed in Oklahoma and long operating track record in the US.
Direct drive, permanent magnet
Certified to AWEA 9.1 standards by the SWCC
$31,000 with inverter, towers range from $10,000 to $35,000
132. Does
not include installation or foundation costs.
Each of the turbine models provided in Table 40 offer distinct advantages and disadvantages compared
with other competing models. While turbine selection is largely governed by economics, it is also
important to thoroughly understand the operating needs of the turbine and what the requirements will
be to maintain the turbine throughout its design life. The resources available at the BKJ site, including
capabilities of technical staff, should heavily factor into the final turbine selection. A maintenance and
repair strategy should be in place that outlines both short term and long term plans. Details including
who is responsible for servicing the turbine, how costly is it to send a technician to the site, and how
costly are repairs should be considered early in development. For small wind installations, these
considerations can often have a larger impact on the long-term economics of the project than the initial
differences in capital cost or energy production.
8.5. Energy Estimates133
Production estimates for each turbine were completed using the AWS Truepower windTrends dataset
and Virtual Met Mast + Energy (VMM+E) software. All production estimates assume the proposed
turbine location provided in Figure 16.
132 Bergey, Retail List Price, Jan 1, 2013 133
ibid 127
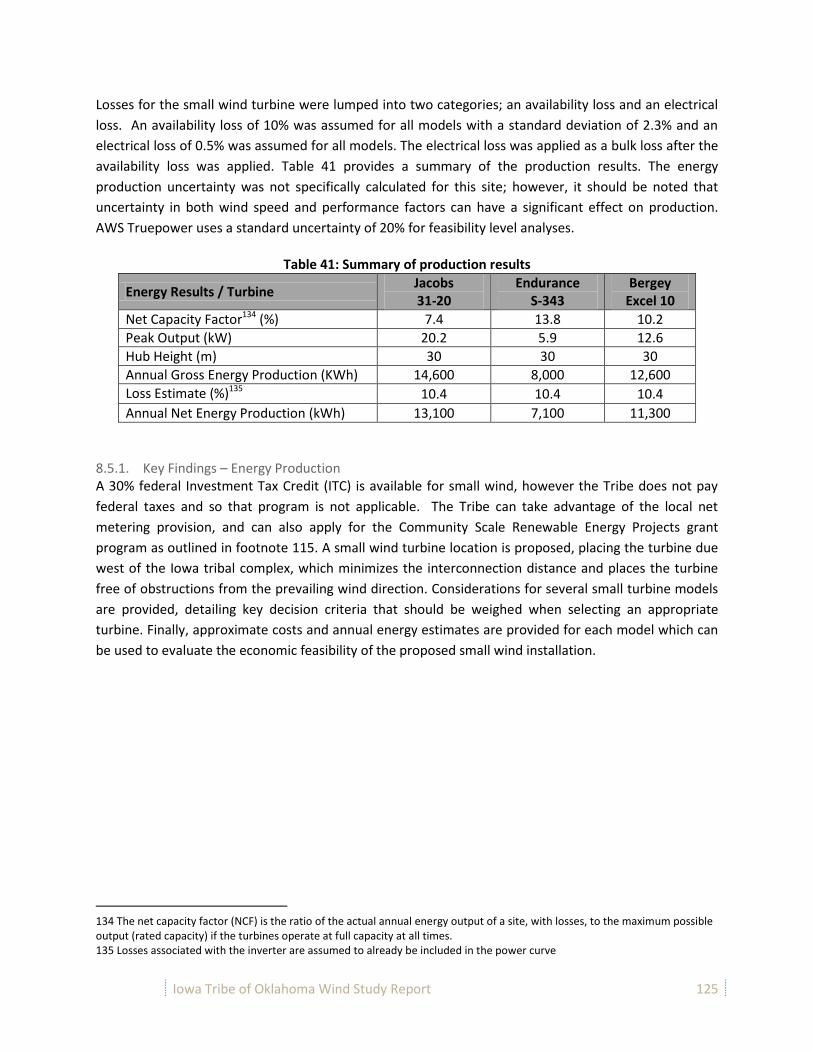
Iowa Tribe of Oklahoma Wind Study Report 125
Losses for the small wind turbine were lumped into two categories; an availability loss and an electrical
loss. An availability loss of 10% was assumed for all models with a standard deviation of 2.3% and an
electrical loss of 0.5% was assumed for all models. The electrical loss was applied as a bulk loss after the
availability loss was applied. Table 41 provides a summary of the production results. The energy
production uncertainty was not specifically calculated for this site; however, it should be noted that
uncertainty in both wind speed and performance factors can have a significant effect on production.
AWS Truepower uses a standard uncertainty of 20% for feasibility level analyses.
Table 41: Summary of production results
Energy Results / Turbine Jacobs 31-20
Endurance S-343
Bergey Excel 10
Net Capacity Factor134 (%) 7.4 13.8 10.2
Peak Output (kW) 20.2 5.9 12.6
Hub Height (m) 30 30 30
Annual Gross Energy Production (KWh) 14,600 8,000 12,600
Loss Estimate (%)135 10.4 10.4 10.4
Annual Net Energy Production (kWh) 13,100 7,100 11,300
8.5.1. Key Findings – Energy Production A 30% federal Investment Tax Credit (ITC) is available for small wind, however the Tribe does not pay
federal taxes and so that program is not applicable. The Tribe can take advantage of the local net
metering provision, and can also apply for the Community Scale Renewable Energy Projects grant
program as outlined in footnote 115. A small wind turbine location is proposed, placing the turbine due
west of the Iowa tribal complex, which minimizes the interconnection distance and places the turbine
free of obstructions from the prevailing wind direction. Considerations for several small turbine models
are provided, detailing key decision criteria that should be weighed when selecting an appropriate
turbine. Finally, approximate costs and annual energy estimates are provided for each model which can
be used to evaluate the economic feasibility of the proposed small wind installation.
134 The net capacity factor (NCF) is the ratio of the actual annual energy output of a site, with losses, to the maximum possible output (rated capacity) if the turbines operate at full capacity at all times. 135 Losses associated with the inverter are assumed to already be included in the power curve
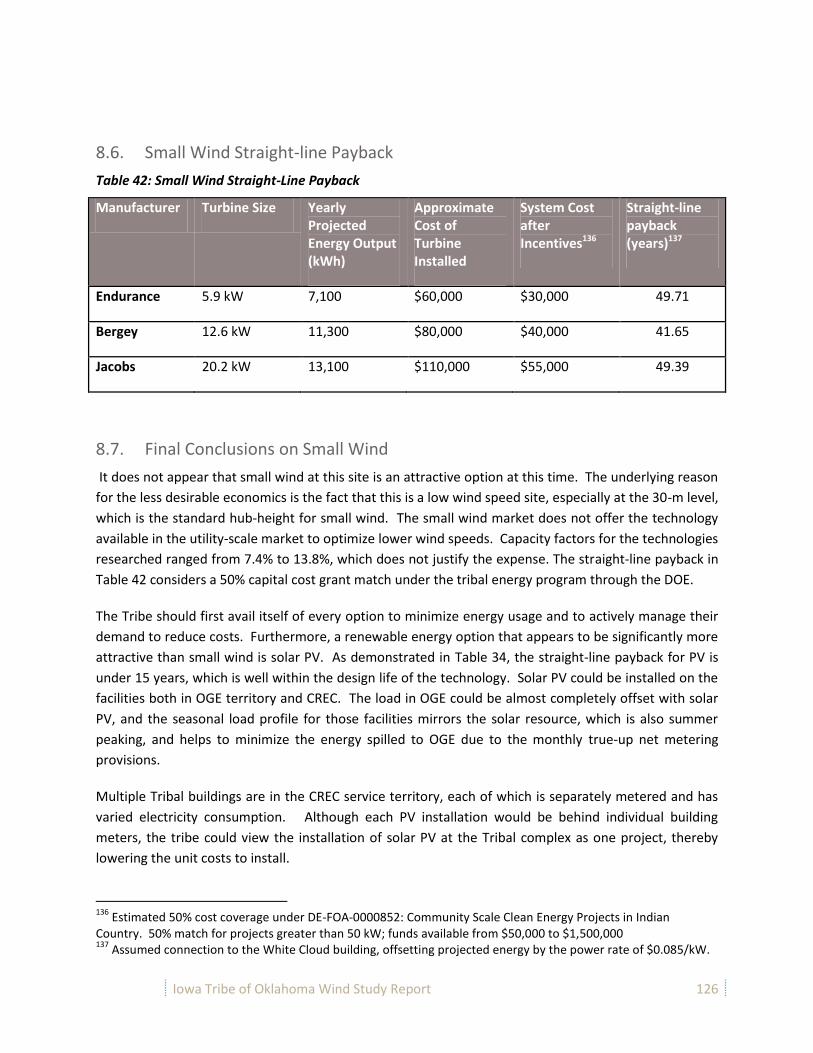
Iowa Tribe of Oklahoma Wind Study Report 126
8.6. Small Wind Straight-line Payback
Table 42: Small Wind Straight-Line Payback
Manufacturer Turbine Size Yearly Projected Energy Output (kWh)
Approximate Cost of Turbine Installed
System Cost after Incentives136
Straight-line payback (years)137
Endurance 5.9 kW 7,100 $60,000 $30,000 49.71
Bergey 12.6 kW 11,300 $80,000 $40,000 41.65
Jacobs 20.2 kW 13,100 $110,000 $55,000 49.39
8.7. Final Conclusions on Small Wind
It does not appear that small wind at this site is an attractive option at this time. The underlying reason
for the less desirable economics is the fact that this is a low wind speed site, especially at the 30-m level,
which is the standard hub-height for small wind. The small wind market does not offer the technology
available in the utility-scale market to optimize lower wind speeds. Capacity factors for the technologies
researched ranged from 7.4% to 13.8%, which does not justify the expense. The straight-line payback in
Table 42 considers a 50% capital cost grant match under the tribal energy program through the DOE.
The Tribe should first avail itself of every option to minimize energy usage and to actively manage their
demand to reduce costs. Furthermore, a renewable energy option that appears to be significantly more
attractive than small wind is solar PV. As demonstrated in Table 34, the straight-line payback for PV is
under 15 years, which is well within the design life of the technology. Solar PV could be installed on the
facilities both in OGE territory and CREC. The load in OGE could be almost completely offset with solar
PV, and the seasonal load profile for those facilities mirrors the solar resource, which is also summer
peaking, and helps to minimize the energy spilled to OGE due to the monthly true-up net metering
provisions.
Multiple Tribal buildings are in the CREC service territory, each of which is separately metered and has
varied electricity consumption. Although each PV installation would be behind individual building
meters, the tribe could view the installation of solar PV at the Tribal complex as one project, thereby
lowering the unit costs to install.
136
Estimated 50% cost coverage under DE-FOA-0000852: Community Scale Clean Energy Projects in Indian Country. 50% match for projects greater than 50 kW; funds available from $50,000 to $1,500,000 137
Assumed connection to the White Cloud building, offsetting projected energy by the power rate of $0.085/kW.

Commercial Alternative Energy Analysis
PREPARED FOR THE
August 1, 2014
Iowa Tribe of Oklahoma

2
Prepared by
Jeff Pollard, PE, VP of EngineeringRay Chambers, CEM, CEP, CEA, Commercial Energy AdvisorRandy Jarvis, VP of Corporate Development

3
ALTERNATIVEENERGYANALYSIS
1.0 Executive Summary
2.0 Scope of Work
This report was compiled for the Iowa Tribe of Oklahoma by Smart Energy Source LLC (SES) certifi ed energy professionals, Stillwater, Oklaho-ma. Information was provided to SES by the Iowa Tribe of Oklahoma in regard to the Iowa Tribe Wind Project Report prepared by AWS Truepower for Johnson Controls dated March 27, 2013 and the Wind Study Report for the Iowa Tribe of Oklaho-ma Wind Project provided to the Bureau of Indian Affairs by Solas Energy Consulting U.S. Inc. dated June 26, 2013. This information was used to com-
pare the economic viability of stand-alone and utili-ty grade wind and solar power generation systems when compared to the Iowa Tribe of Oklahoma connected meter loads as documented by Central Rural Electric Cooperative.
This report discusses the alternative energy systems as outlined in the scope of work. The information enclosed is intended to help the Iowa Tribe of Oklahoma achieve its energy effi ciency objectives of reducing overall energy use and allow for a de-fi ned strategic energy plan going forward.
The objective of this report is to defi ne the viabil-ity of alternative energy systems in relationship to the Iowa Tribe of Oklahoma’s historical electrical usage of individual meters and the aggregated load of all meters on the Central Rural Electric Coopera-tive’s electrical distribution grid.
SES utilized the information in the referenced re-ports in addition to billing data provided by CREC and cost estimates associated with potential system impacts. These resources were used to develop assessments on wind and solar projects.

4
ALTERNATIVEENERGYANALYSIS
AccountAccount Number
Map Location
Electric Rate
Annual kWh Use
Annual $ Spent
Transitional Living 3142800 42 19 16 SMC 4 0 $354.96Cemetery Water Well 2237100 42 14 08 SMC 4 63 $362.18Chena Building 3192600 42 30 12 SMC 4 660 $414.07Southwest Water Well 2194300 42 30 06 SMC 4 1,076 $442.55Pow Wow Arena 2448900 42 30 09 SMC 4 1,355 $473.98Pow Wow Area 1906500 42 30 04 SMC 4 2,227 $556.68Gate at Eagle Aviary 3231100 42 19 18 SMC 4 2,444 $567.45Sign-Hwy 177 2988600 42 30 10 SMC 4 2,632 $581.87Community Building 1764000 42 22 06 SMC 4 4,107 $708.56Fire Station 3217600 42 19 17 SMC 4 4,540 $733.64The Farm 414207 42 19 03 SMC 4 8,934 $1,134.67Northeast Water Well 2194100 42 30 05 SMC 4 13,837 $1,538.56Baseball Field Site 3072600 42 30 11 SMC 4 22,960 $2,325.01Vocational Rehab. 2202600 42 19 09 SMC 4 48,901 $4,586.49Need Address 1368600 42 19 04 SMC 4 53,379 $4,891.46Police/Fire Building 2281200 42 19 10 SMC 4 55,925 $5,224.13Offi ce Annex 2280800 42 19 11 SMC 4 62,566 $5,759.58Multi-event Building 2222200 42 30 07 SMC 4 62,800 $5,773.77Multipurpose Building 1623200 42 19 05 SMC 4 77,360 $7,088.79Eagle Aviary 2617100 42 19 15 SMC 4 79,120 $7,085.02Youth Shelter 1777000 42 19 06 SMC 4 86,564 $7,842.92White Cloud 1912100 42 19 08 SMC 4 135,520 $12,148.90Child Development Center 2427701 42 19 13 SMC 4 138,840 $12,267.97
Totals 865,810 $82,863.21
AccountAccount Number
Map Location
Electric Rate
Annual kWh Use
Annual $ Spent
607 E 116th St-Flea Market 2264103 41 01 11 SMC 4 476 $401.74607 E 116th St-Gallery 740405 41 01 05 SMC 4 927 $435.70Offi ce Building RV Site 3048700 41 01 13 SMC 4 6,072 $868.34607 E 116th St-RV Park 2373102 41 01 12 SMC 4 224,000 $19,504.47
Totals 231,475 $21,210.25
Iowa Tribe of Oklahoma Accounts
Facility Meter Data
Iowa Tribal Enterprises Accounts
The tables below show Iowa Tribe accounts with CREC. Annual kWh use and dollars spent are shown for each account.

5
ALTERNATIVEENERGYANALYSIS
InterpretationIn Figure 1, research from the National Renewable Energy Laboratory for the Department of Energy maps the Oklahoma annual wind power at 50-m height, which conclusively shows the Iowa Tribal Complex has poor to marginal wind resource potential.
Figure 1 – Courtesy the National Renewable Energy Laboratory for the Department of Energy

6
ALTERNATIVEENERGYANALYSIS
Figure 2 – Courtesy the National Renewable Energy Laboratory for the Department of Energy
InterpretationIn Figure 2, research from the National Renewable Energy Laboratory for the Department of Energy shows the Iowa Tribal Complex is located in an area where there is approximately 5 kWh/m2/day.
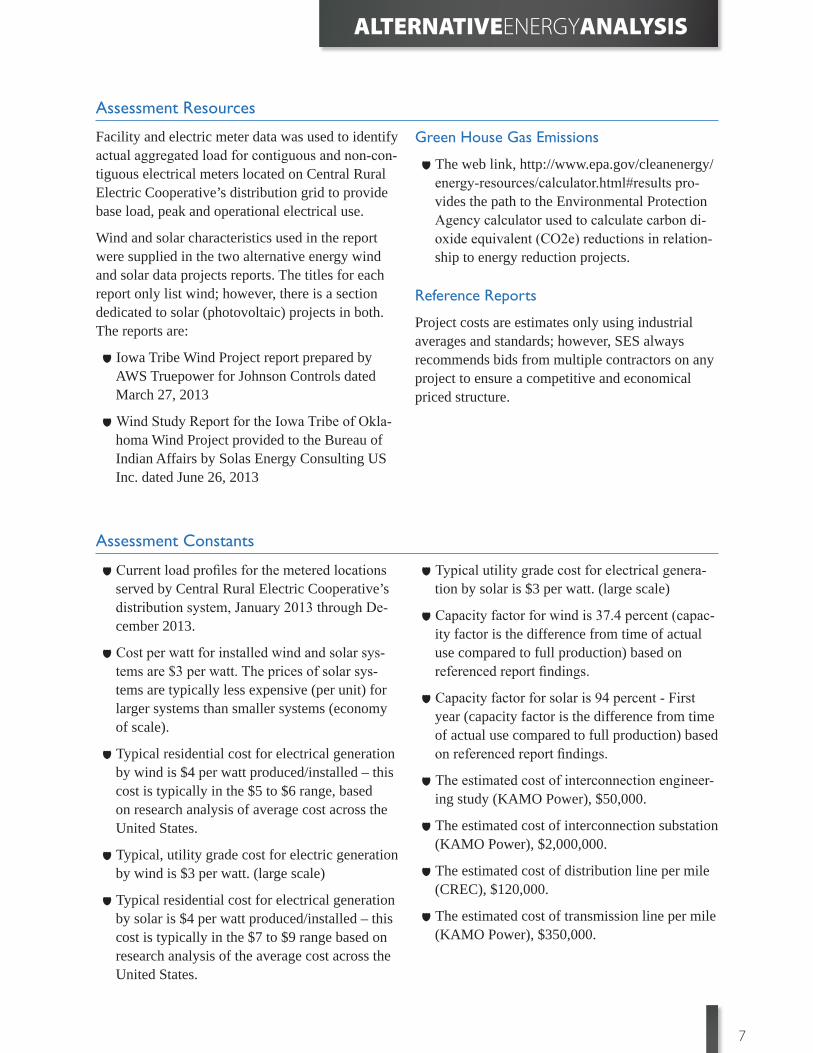
7
ALTERNATIVEENERGYANALYSIS
Assessment Resources
Assessment Constants
Facility and electric meter data was used to identify actual aggregated load for contiguous and non-con-tiguous electrical meters located on Central Rural Electric Cooperative’s distribution grid to provide base load, peak and operational electrical use.
Wind and solar characteristics used in the report were supplied in the two alternative energy wind and solar data projects reports. The titles for each report only list wind; however, there is a section dedicated to solar (photovoltaic) projects in both. The reports are:
Iowa Tribe Wind Project report prepared by AWS Truepower for Johnson Controls dated March 27, 2013
Wind Study Report for the Iowa Tribe of Okla-homa Wind Project provided to the Bureau of Indian Affairs by Solas Energy Consulting US Inc. dated June 26, 2013
Green House Gas Emissions
The web link, http://www.epa.gov/cleanenergy/energy-resources/calculator.html#results pro-vides the path to the Environmental Protection Agency calculator used to calculate carbon di-oxide equivalent (CO2e) reductions in relation-ship to energy reduction projects.
Reference Reports
Project costs are estimates only using industrial averages and standards; however, SES always recommends bids from multiple contractors on any project to ensure a competitive and economical priced structure.
Current load profi les for the metered locations served by Central Rural Electric Cooperative’s distribution system, January 2013 through De-cember 2013.
Cost per watt for installed wind and solar sys-tems are $3 per watt. The prices of solar sys-tems are typically less expensive (per unit) for larger systems than smaller systems (economy of scale).
Typical residential cost for electrical generation by wind is $4 per watt produced/installed – this cost is typically in the $5 to $6 range, based on research analysis of average cost across the United States.
Typical, utility grade cost for electric generation by wind is $3 per watt. (large scale)
Typical residential cost for electrical generation by solar is $4 per watt produced/installed – this cost is typically in the $7 to $9 range based on research analysis of the average cost across the United States.
Typical utility grade cost for electrical genera-tion by solar is $3 per watt. (large scale)
Capacity factor for wind is 37.4 percent (capac-ity factor is the difference from time of actual use compared to full production) based on referenced report fi ndings.
Capacity factor for solar is 94 percent - First year (capacity factor is the difference from time of actual use compared to full production) based on referenced report fi ndings.
The estimated cost of interconnection engineer-ing study (KAMO Power), $50,000.
The estimated cost of interconnection substation (KAMO Power), $2,000,000.
The estimated cost of distribution line per mile (CREC), $120,000.
The estimated cost of transmission line per mile (KAMO Power), $350,000.

8
ALTERNATIVEENERGYANALYSIS
Potentially, more costs could be associated with infrastructure upgrades depending on the results of the Interconnection Engineering Study.
The estimated avoided cost of power is $0.02 per kWh.
Wind and Solar Assessments
The methodology of any assessment will provide a base line of information, or experimental control point, which can be used to gauge any study or assessment in the future to present conditions. The analytical process for current or future projects will be measured against this base line to validate project economics, processes and feasibilities that allow decision makers to realize estimated and or target savings potential.
SES has developed four alternative energy assess-ments from information included in the referenced reports. Additional historical energy use data and estimated distribution and transmission system im-pact costs were provided by Central Rural Electric Cooperative. This data was used in the wind and solar net metering assessments.
The assessments include:
A. Wind – Utility Revenue Grade System
B. Wind – Net Metering Contract
C. Solar – Utility Revenue Grade System
D. Solar – Net Metering Contract
Each assessment has an evaluation followed by a calculation worksheet. Each assessment includes an estimated cost for the generator plant, utility related system impact costs, the total project cost, revenue when applicable, payback in years and a return on investment.

9
ALTERNATIVEENERGYANALYSIS
A. Wind - Utility Revenue Grade System - Cost Avoidance Contract
Evaluation
Calculation Worksheet
This assessment is based on the installation of 11 1.62MW GE1.6-100 turbines as specifi ed in the referenced reports. As a result of the local wind characteristics documented in the referenced reports, the system will operate at a 37.4 percent
production factor, and based on the production fac-tor the system will produce 57.6MWh per year. The system will have an estimated payback of 32 years with a ROI of 3.2 percent.
Project Description Cost/RevenueGenerator Plant Cost (equipment only at $1.83 per watt installed) $32,967,000Transmission Line Cost ($350,000 per mile – 2.5 miles) $875,000Interconnection Study (Impact to system) $50,000Interconnect Substation $2,000,000Maintenance and Operations (average per year is 1.7% of capital for 25 years) $560,439Total Project Cost $36,452,439Revenue (Cost avoidance contract, estimated at $0.02 per kWh) per year $ 1,151,657Payback = 32 yearsROI = 3.2%
A. WIND Count MWh kWh # miles $/mileGenerator Plant $ @ $1.85/watt 11 17,820 6,771,600 $32,967,000
37.4% of max kWh -> 6,665 6,664,680 Overhead cost for Line (Transmission) 2.5 $350,000 $875,000Interconnection study $50,000Plant substation $2,000,000Maint. & Ops (per year avg - 25 yrs ops) $560,439
Production factor = 37.4% Total $36,452,439kW 2,493 MWh GWh
kWh/yr 57,582,835 57583 57.6 Yrs ROI 3.2% Payback 32 $1,151,657 @ $0.02/kWh
GHG avoidance 15,466.7 Metric Tons of CO2e
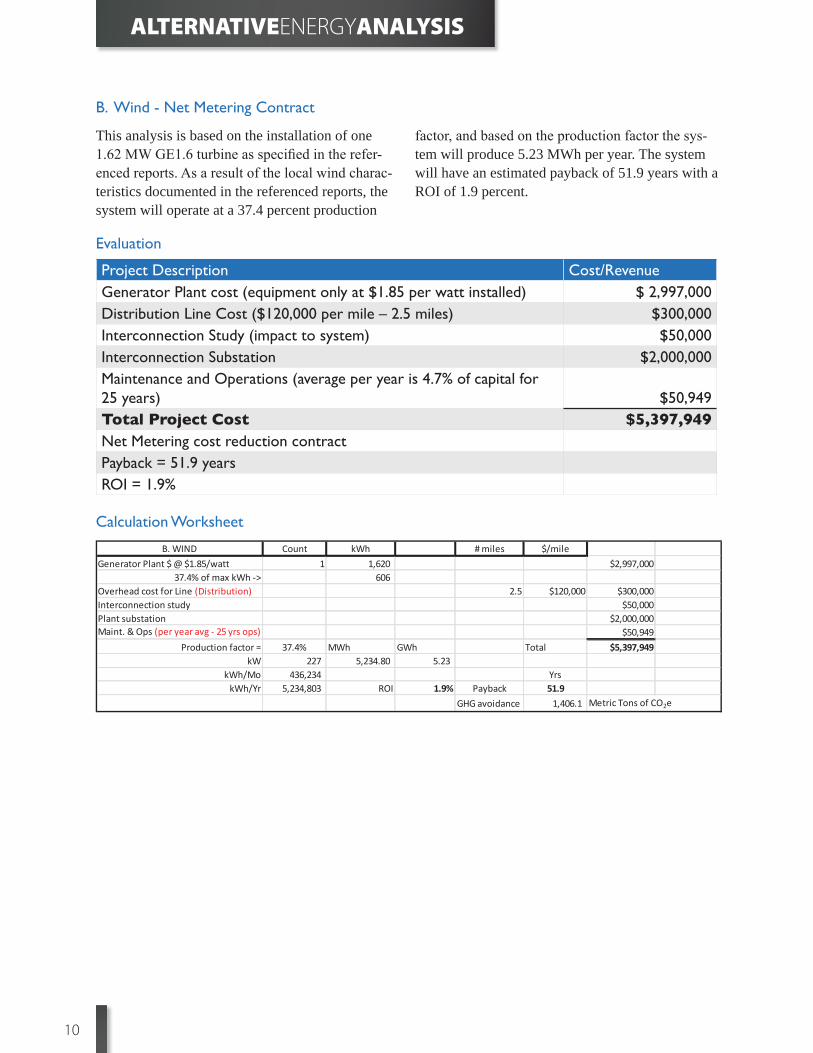
10
ALTERNATIVEENERGYANALYSIS
B. Wind - Net Metering Contract
Evaluation
Calculation Worksheet
This analysis is based on the installation of one 1.62 MW GE1.6 turbine as specifi ed in the refer-enced reports. As a result of the local wind charac-teristics documented in the referenced reports, the system will operate at a 37.4 percent production
factor, and based on the production factor the sys-tem will produce 5.23 MWh per year. The system will have an estimated payback of 51.9 years with a ROI of 1.9 percent.
Project Description Cost/RevenueGenerator Plant cost (equipment only at $1.85 per watt installed) $ 2,997,000Distribution Line Cost ($120,000 per mile – 2.5 miles) $300,000Interconnection Study (impact to system) $50,000Interconnection Substation $2,000,000Maintenance and Operations (average per year is 4.7% of capital for 25 years) $50,949Total Project Cost $5,397,949Net Metering cost reduction contractPayback = 51.9 yearsROI = 1.9%
B. WIND Count kWh # miles $/mileGenerator Plant $ @ $1.85/watt 1 1,620 $2,997,000
37.4% of max kWh -> 606 Overhead cost for Line (Distribution) 2.5 $120,000 $300,000Interconnection study $50,000Plant substation $2,000,000Maint. & Ops (per year avg - 25 yrs ops) $50,949
Production factor = 37.4% MWh GWh Total $5,397,949kW 227 5,234.80 5.23
kWh/Mo 436,234 YrskWh/Yr 5,234,803 ROI 1.9% Payback 51.9
GHG avoidance 1,406.1 Metric Tons of CO2e
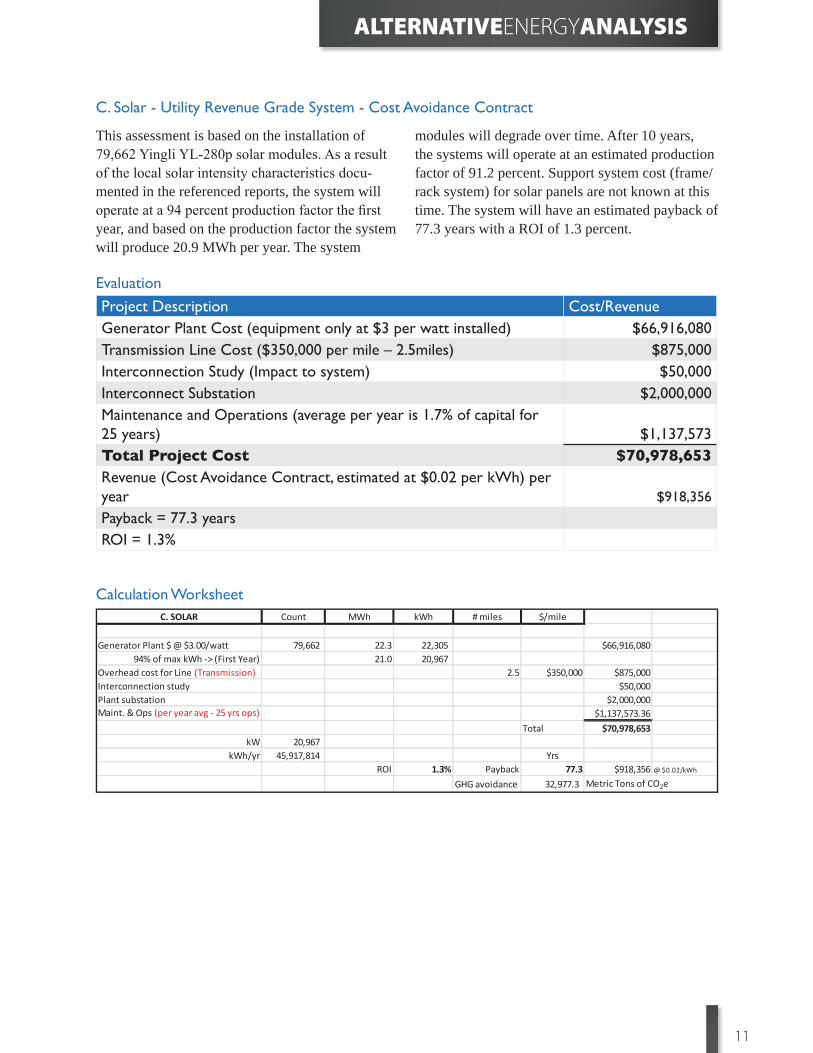
11
ALTERNATIVEENERGYANALYSIS
C. Solar - Utility Revenue Grade System - Cost Avoidance Contract
Evaluation
Calculation Worksheet
This assessment is based on the installation of 79,662 Yingli YL-280p solar modules. As a result of the local solar intensity characteristics docu-mented in the referenced reports, the system will operate at a 94 percent production factor the fi rst year, and based on the production factor the system will produce 20.9 MWh per year. The system
modules will degrade over time. After 10 years, the systems will operate at an estimated production factor of 91.2 percent. Support system cost (frame/rack system) for solar panels are not known at this time. The system will have an estimated payback of 77.3 years with a ROI of 1.3 percent.
Project Description Cost/RevenueGenerator Plant Cost (equipment only at $3 per watt installed) $66,916,080Transmission Line Cost ($350,000 per mile – 2.5miles) $875,000Interconnection Study (Impact to system) $50,000Interconnect Substation $2,000,000Maintenance and Operations (average per year is 1.7% of capital for 25 years) $1,137,573Total Project Cost $70,978,653Revenue (Cost Avoidance Contract, estimated at $0.02 per kWh) per year $918,356
Payback = 77.3 yearsROI = 1.3%
C. SOLAR Count MWh kWh # miles $/mile
Generator Plant $ @ $3.00/watt 79,662 22.3 22,305 $66,916,080 94% of max kWh -> (First Year) 21.0 20,967
Overhead cost for Line (Transmission) 2.5 $350,000 $875,000Interconnection study $50,000Plant substation $2,000,000Maint. & Ops (per year avg - 25 yrs ops) $1,137,573.36
Total $70,978,653kW 20,967
kWh/yr 45,917,814 Yrs ROI 1.3% Payback 77.3 $918,356 @ $0.02/kWh
GHG avoidance 32,977.3 Metric Tons of CO2e
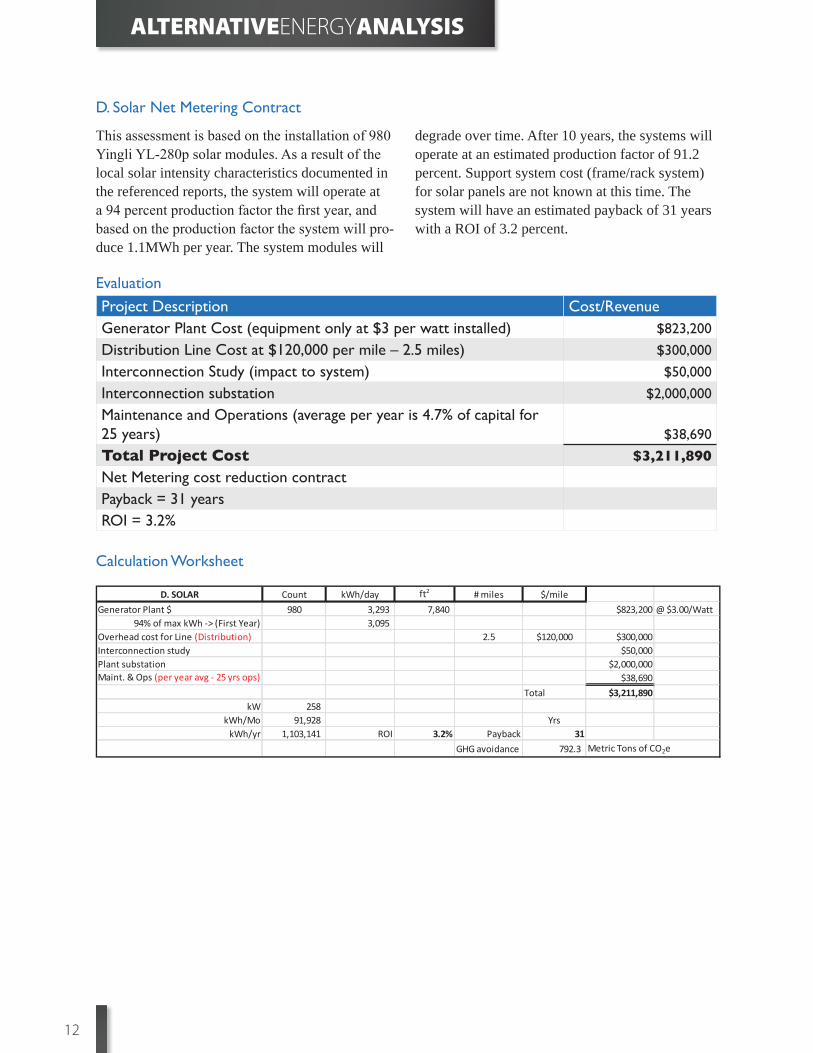
12
ALTERNATIVEENERGYANALYSIS
D. Solar Net Metering Contract
Evaluation
Calculation Worksheet
This assessment is based on the installation of 980 Yingli YL-280p solar modules. As a result of the local solar intensity characteristics documented in the referenced reports, the system will operate at a 94 percent production factor the fi rst year, and based on the production factor the system will pro-duce 1.1MWh per year. The system modules will
degrade over time. After 10 years, the systems will operate at an estimated production factor of 91.2 percent. Support system cost (frame/rack system) for solar panels are not known at this time. The system will have an estimated payback of 31 years with a ROI of 3.2 percent.
Project Description Cost/RevenueGenerator Plant Cost (equipment only at $3 per watt installed) $823,200
Distribution Line Cost at $120,000 per mile – 2.5 miles) $300,000
Interconnection Study (impact to system) $50,000
Interconnection substation $2,000,000
Maintenance and Operations (average per year is 4.7% of capital for 25 years) $38,690
Total Project Cost $3,211,890Net Metering cost reduction contractPayback = 31 yearsROI = 3.2%
D. SOLAR Count kWh/day ft2 # miles $/mileGenerator Plant $ 980 3,293 7,840 $823,200 @ $3.00/Watt
94% of max kWh -> (First Year) 3,095 Overhead cost for Line (Distribution) 2.5 $120,000 $300,000Interconnection study $50,000Plant substation $2,000,000Maint. & Ops (per year avg - 25 yrs ops) $38,690
Total $3,211,890 kW 258
kWh/Mo 91,928 YrskWh/yr 1,103,141 ROI 3.2% Payback 31
GHG avoidance 792.3 Metric Tons of CO2e

13
ALTERNATIVEENERGYANALYSIS
Considerations
The following items should be considered in de-termining the feasibility of alternative sources of power generation for the Iowa Tribe of Oklahoma.
Availablility of sustained wind at height of installation – The observed mean wind speed provided by the AWS Truepower Report, Iowa Tribe of Oklahoma, Johnson Controls, March 27, 2013 at their measurement location (WGS84, Zone 14 – Easting 669343, Northing 3958302), page 1.
Cost of electric grid infrastructure upgrades – Information and cost estimates provided by Jeff Pollard PE, System Engineer - Central Rural Electric Cooperative.
Initial cost of alternative energy projects – The information provided for estimating the cost per watt for alternative energy is from
the U.S. Energy Information Administration, “Levelized Cost of New Generation Resources in the Annual Energy Outlook 2013” published January 2013. http://www.eia.gov/forecasts/aeo/data.cfm
A key question must be answered by the collec-tive body of the Iowa Tribe of Oklahoma before moving forward with any project. Does the devel-opment of a wind farm or solar park agree with the Iowa Tribe of Oklahoma’s commitment to the environment?

14
ALTERNATIVEENERGYANALYSIS
Figure 3 – Central Rural Electric Cooperative distribution line that serves the Iowa Tribal Complex
Maps and Aerial Views
The following maps and aerial views show CREC infrastructure in comparison to Iowa Tribe facilities.

15
ALTERNATIVEENERGYANALYSIS
Figure 4 – Iowa Tribal Daycare Facility

16
ALTERNATIVEENERGYANALYSIS
Figure 5 – Iowa Tribal Police and Fire
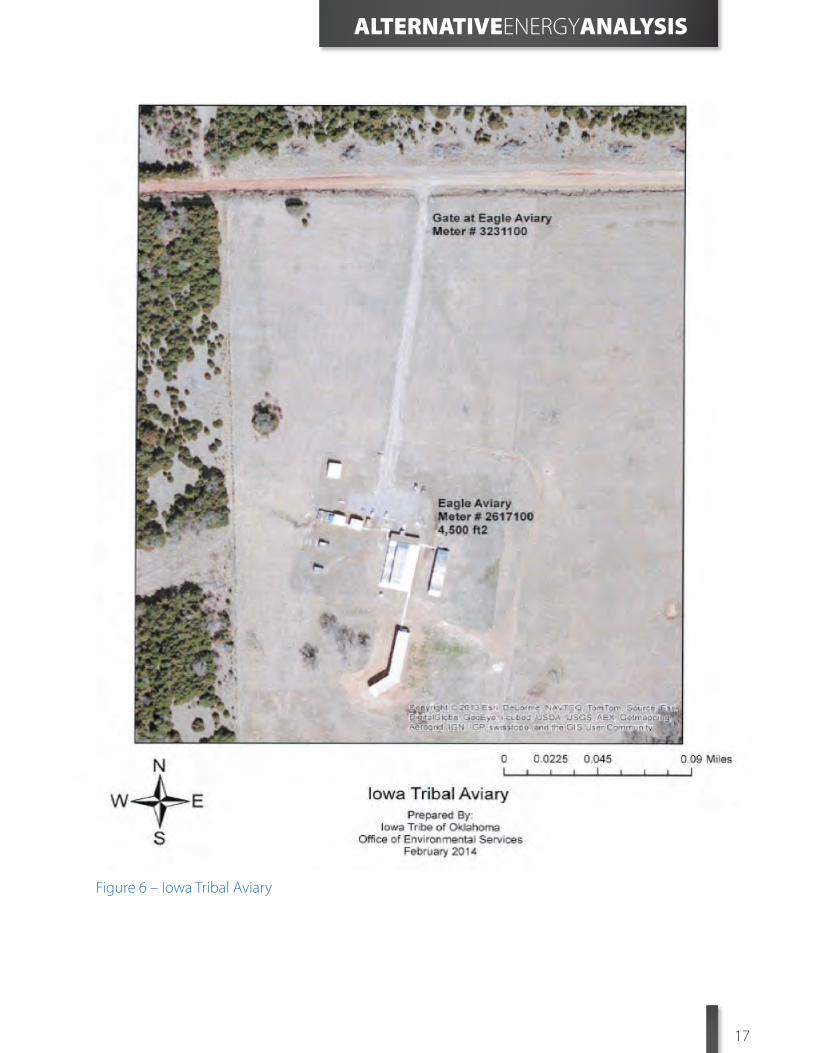
17
ALTERNATIVEENERGYANALYSIS
Figure 6 – Iowa Tribal Aviary

18
ALTERNATIVEENERGYANALYSIS
Figure 7 – Iowa Tribal Equine Barn

19
ALTERNATIVEENERGYANALYSIS
Figure 8 – Iowa Tribal Pow-wow & Chena

ORGANIZATION
Iowa Tribe of Oklahoma’s Assessment of Wind Resources on Tribal Land DOE’s Tribal Energy Program Review March 24-27, 2014 - Denver, CO

Overview Iowa Tribe of Oklahoma Iowa Tribe Long Term Energy Vision Historical Renewable Energy Timeline Project Objectives Wind Study Reports New Location Update Changes and Challenges Next Steps and Final Report

Iowa Tribe of Oklahoma
Tribal enrollment is over 780
Organized under the Oklahoma Indian Welfare Act, which authorized the adoption of a tribal constitution, by-laws and a Business Committee
Strong Commitment to Energy Efficiency & Renewables, Environmental Stewardship
Largest employer in the area with 2 casinos, smoke shop, RV park, art gallery/gift shop and tribal government employees

Bah-Kho-Je Meaning
“People of the Grey Snow” in Ioway language It derives its meaning from a translation over
many decades passed down from our “Old People” through our oral history
The fire-smoked grey snow covered villages in the winter
The state of Iowa takes its name from the Bah-Kho-Je people

Business Committee 2014
Bobby Walkup
Vice Chairman
Lisa Switch
Treasurer
Leslie Tanyan
Secretary
Renee Prince*
Councilperson
Gary Pratt
Chairman

Iowa Tribe of Oklahoma’s Traditional Jurisdictional Lands

Michelle L. Holiday
• The founder and president of Michelle Holiday and Associates, a Native woman-owned consulting company specializing in tribal energy and economic development, stakeholder relations, government relations/federal affairs, permitting and siting transmission projects, public affairs and communications, project management, and strategic planning
• Over 20 years of industry experience working for Edison International and Southern California Edison
• A new career direction as a consulting company but long term commitment working with and for tribes on energy matters
• Tribal member, former Tribal Development Director, 2000-2002, Tribal Representative with 4 prior Administrations
• Worked on the DOE Native American Anemometer Loan Program in 2001

Iowa Tribe’s Long Term Energy Vision Energy Self Sufficient
Core to Economic Development Environmental Philosophy Sustainable Energy Development Model Resource Development
Renewables Wind and Solar Land, Oil, & Minerals Energy Efficiency
EPA Grant Lighting Retrofits & Motion Sensors
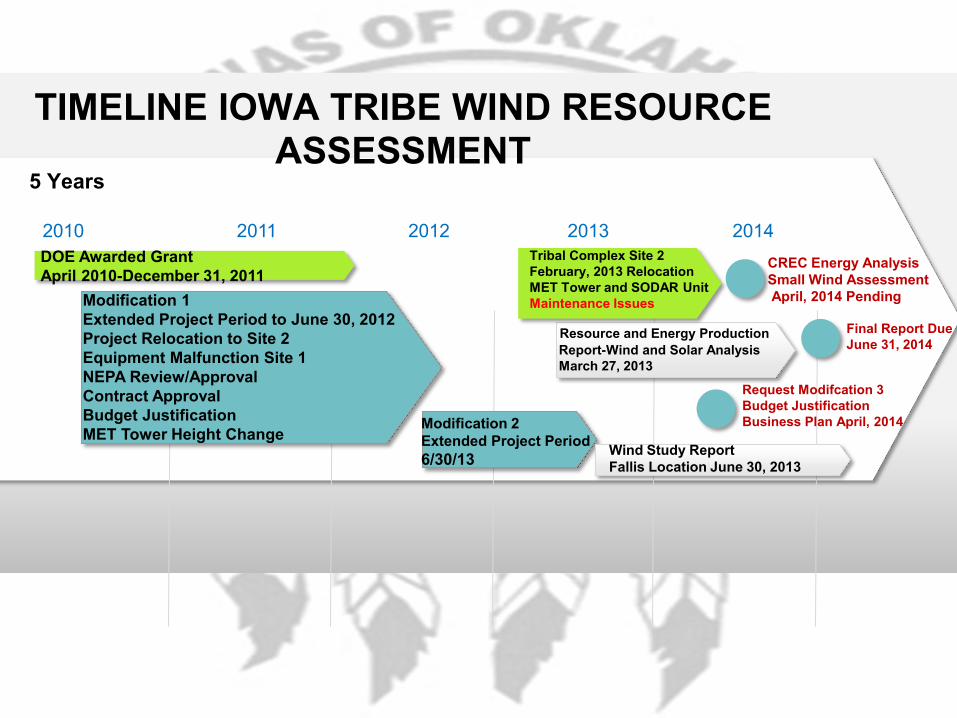
DOE Awarded Grant April 2010-December 31, 2011
Modification 2 Extended Project Period 6/30/13
2014 2012 2011 2010 2013
5 Years
TIMELINE IOWA TRIBE WIND RESOURCE ASSESSMENT
Resource and Energy Production Report-Wind and Solar Analysis March 27, 2013
Modification 1 Extended Project Period to June 30, 2012 Project Relocation to Site 2 Equipment Malfunction Site 1 NEPA Review/Approval Contract Approval Budget Justification MET Tower Height Change Wind Study Report
Fallis Location June 30, 2013
Request Modifcation 3 Budget Justification Business Plan April, 2014
Final Report Due June 31, 2014
CREC Energy Analysis Small Wind Assessment April, 2014 Pending
Tribal Complex Site 2 February, 2013 Relocation MET Tower and SODAR Unit Maintenance Issues

Statement of Project Objectives
The overall objective of the Assessment of Wind Resource on Tribal Land project is to conduct a wind resource assessment in order to quantify the wind resource potential available on the Iowa Tribe’s land. This information will be used to develop a commercial scale wind farm or distributed generation application, which will allow the Tribe to be energy independent and offer an additional revenue stream. • Objective 1: Identify and address technical issues concerning wind
energy development • Objective 2: Conduct an in-depth feasibility study of wind energy to
evaluate the actual value of wind • Objective 3: Identify and address environmental issues concerning
wind energy development and educate stakeholders about challenges of implementation

Lessons Learned From November Program Review 2012
Find the Best Area to Place Met Tower Land Use Existing Wind Data Transmission Opportunities
Use a Redundant System SODAR with Met Tower is a Great Combination Data Correlation / Redundancy Avoids Collection Disasters (Logger & SODAR)
Find the Best Resources Hire Expertise to Avoid Future Headaches
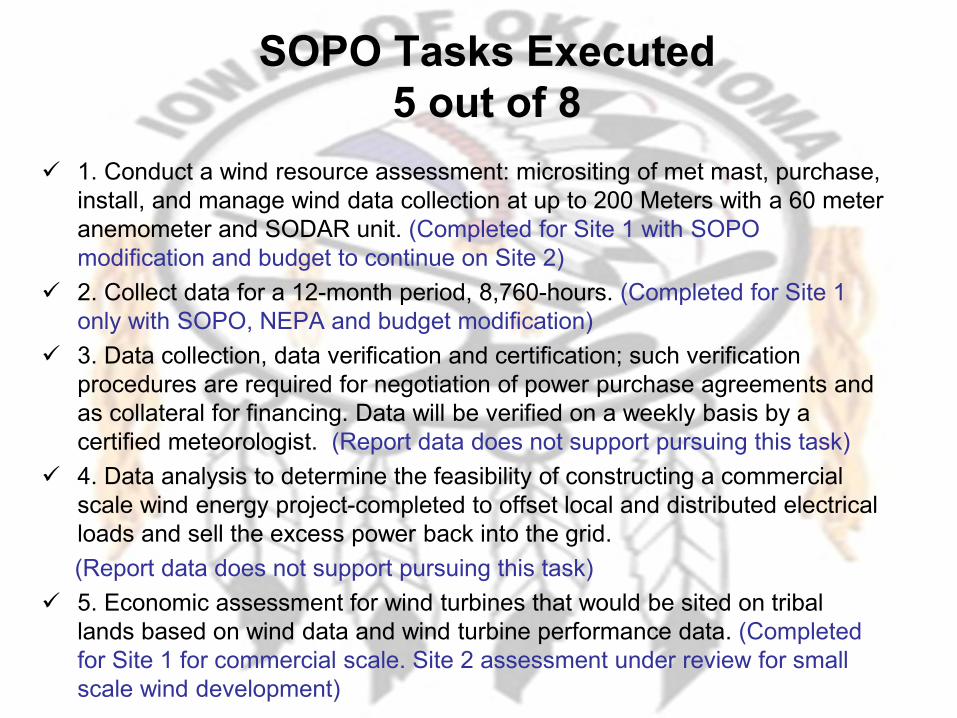
SOPO Tasks Executed 5 out of 8
1. Conduct a wind resource assessment: micrositing of met mast, purchase, install, and manage wind data collection at up to 200 Meters with a 60 meter anemometer and SODAR unit. (Completed for Site 1 with SOPO modification and budget to continue on Site 2)
2. Collect data for a 12-month period, 8,760-hours. (Completed for Site 1 only with SOPO, NEPA and budget modification)
3. Data collection, data verification and certification; such verification procedures are required for negotiation of power purchase agreements and as collateral for financing. Data will be verified on a weekly basis by a certified meteorologist. (Report data does not support pursuing this task)
4. Data analysis to determine the feasibility of constructing a commercial scale wind energy project-completed to offset local and distributed electrical loads and sell the excess power back into the grid.
(Report data does not support pursuing this task) 5. Economic assessment for wind turbines that would be sited on tribal
lands based on wind data and wind turbine performance data. (Completed for Site 1 for commercial scale. Site 2 assessment under review for small scale wind development)

Wind Study Report Energy Assessment Key Findings
Location: Fallis The wind resource in the vicinity of the installed met mast near Fallis
is not rigorous enough to support a commercial wind project. The wind resource in the new proposed project area is a class III,
low wind resource. The wind resource is in the outer bounds of feasibility and the economics will be driven largely by the achievable power price for the project.
A high degree of uncertainty regarding the wind resource exists at the proposed site and additional on-site information should be obtained to verify the projections of the report.
11 consultants prepared the extensive wind study report
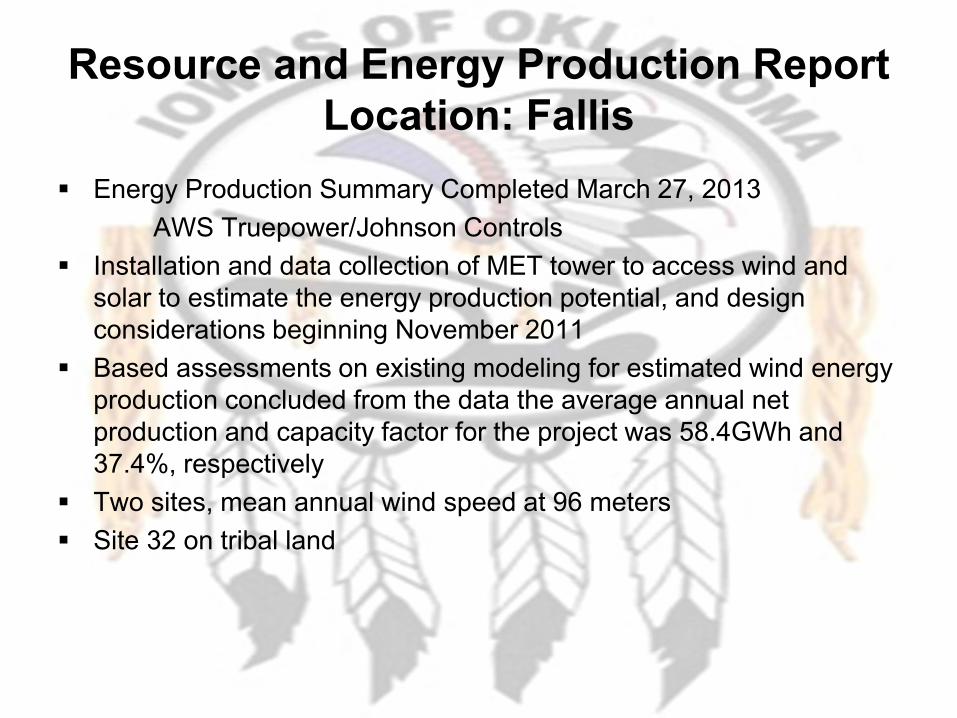
Resource and Energy Production Report Location: Fallis
Energy Production Summary Completed March 27, 2013 AWS Truepower/Johnson Controls Installation and data collection of MET tower to access wind and
solar to estimate the energy production potential, and design considerations beginning November 2011
Based assessments on existing modeling for estimated wind energy production concluded from the data the average annual net production and capacity factor for the project was 58.4GWh and 37.4%, respectively
Two sites, mean annual wind speed at 96 meters Site 32 on tribal land
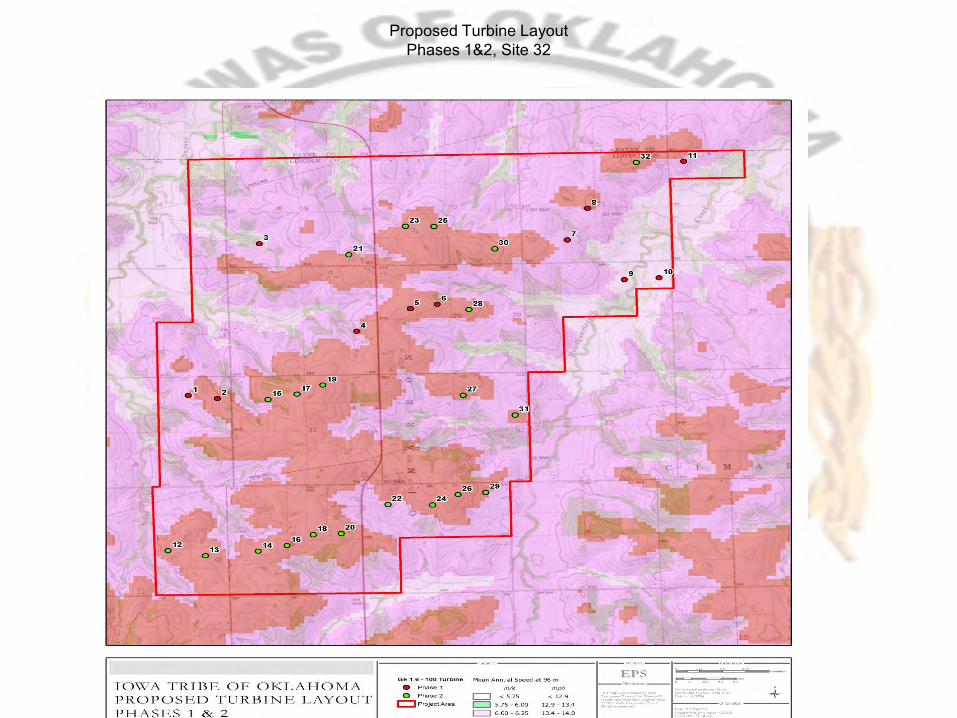
Proposed Turbine Layout Phases 1&2, Site 32
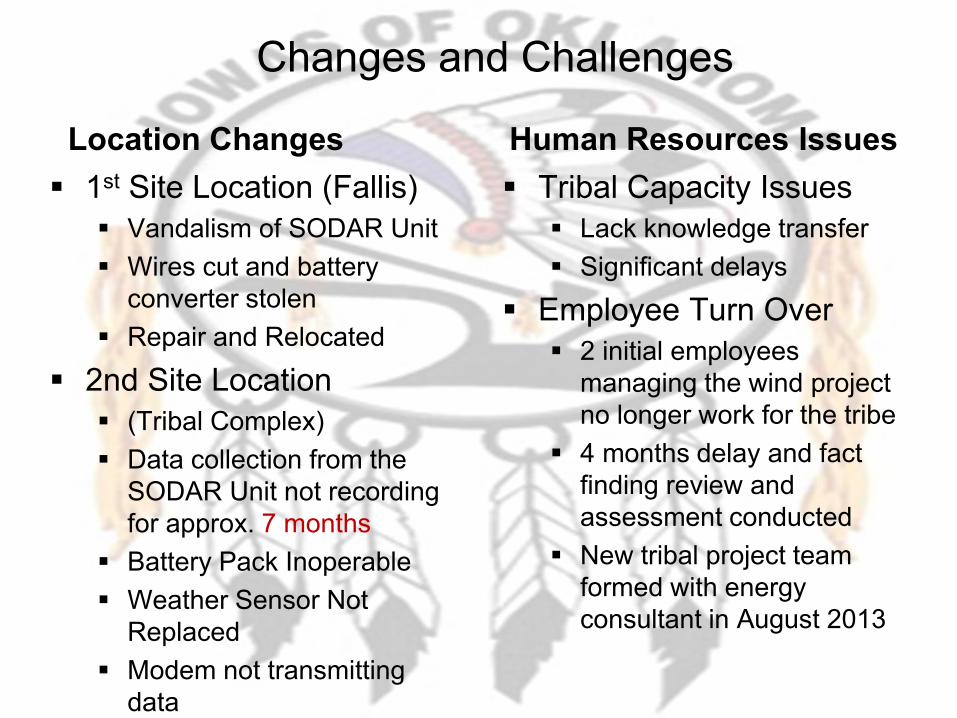
Changes and Challenges
Location Changes 1st Site Location (Fallis)
Vandalism of SODAR Unit Wires cut and battery
converter stolen Repair and Relocated
2nd Site Location (Tribal Complex) Data collection from the
SODAR Unit not recording for approx. 7 months
Battery Pack Inoperable Weather Sensor Not
Replaced Modem not transmitting
data
Human Resources Issues Tribal Capacity Issues
Lack knowledge transfer Significant delays
Employee Turn Over 2 initial employees
managing the wind project no longer work for the tribe
4 months delay and fact finding review and assessment conducted
New tribal project team formed with energy consultant in August 2013

Location of Selected Wind Turbine Small Scale Wind Development near the Iowa Tribe of Oklahoma’s Tribal Complex in Perkins, Oklahoma Longitude and Latitude coordinates (35.929130, -97.024637)
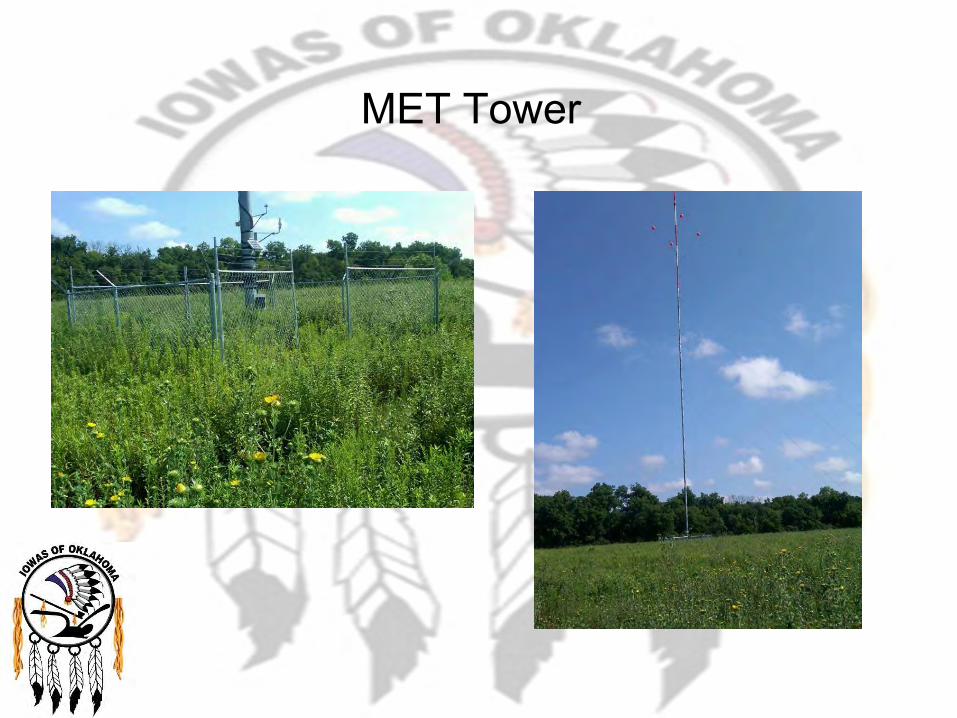
MET Tower

ASC SODAR Unit Solar Panel and Battery Pack

SODAR Solar Panels
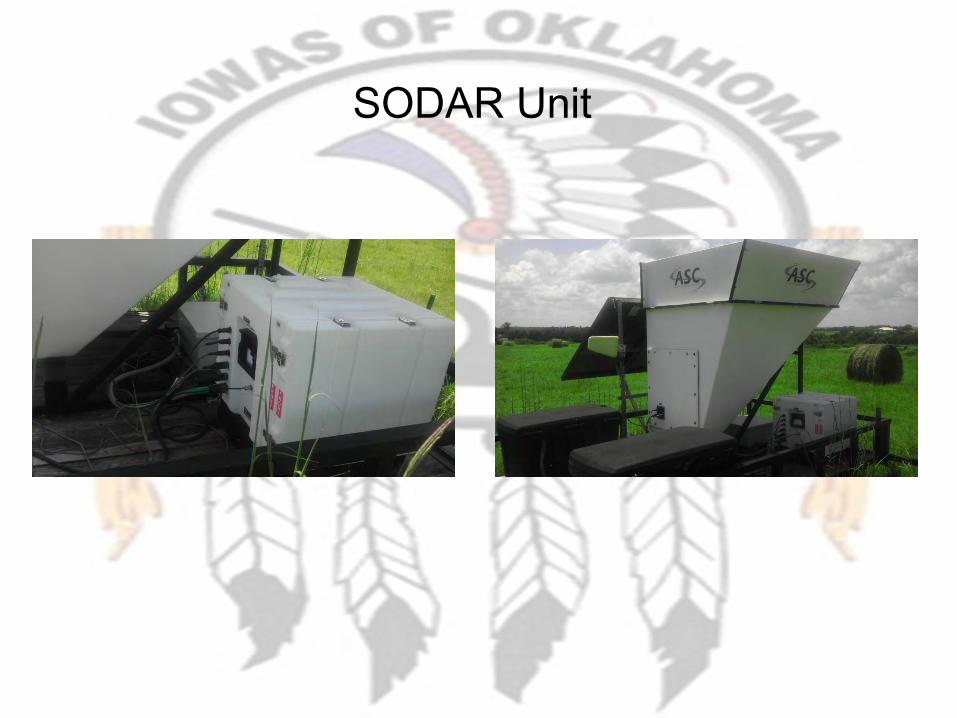
SODAR Unit

Next Steps for SOPO Completion The Iowa Tribe’s energy team will work closely with the DOE to amend the
modification to the Scope of Project Objectives: 6, 7 and 8 and include additional action items to complete the business plan.
6. Environmental assessment for cultural resources, natural resources and avian considerations that may be impacted by wind turbines’ noise and visibility. Work cooperatively with the Iowa Tribe’s Office of Environmental Services (OES) to obtain all necessary FAA and environmental permits and approvals.
7. Completion of business plan and model ready for submission to potential lenders. 8. Obtain letters of intent from local utilities for the sale of excess energy. Additional items to include in the modification and revised costs for the budget
justification: MET Tower Removal SODAR Data File Transfer Energy Analysis and Recommendations

Removal (1) 60m XHD Tower The Scope of Work includes the following: Transportation of Techs Transportation (mileage) of Crew/Installation Equip to Site Rent of Skid Steer Fastening materials (nuts, bolts, hardware, tape) Per Diem for techs Lodging accommodations for Techs Project Management Fee (per tower)

SODAR Data Files Transfer
Anemometry Specialists agrees to transfer data files for (1) ASC Sodar to the Iowa Tribe Transfer Files Include: Raw Wind Data Files for Period of Record in Native Format SoDar Commissioning Form (From Original Commissioning) Maintenance Records (If Performed by ASI) Any Available Photos Most Recent Data Files

CREC/SES Energy Assessment
Central Rural Electric Cooperative/Smart Energy Source Scope of Services
Assist in the analysis of electric wind generation equipment in regard to economic viability.
Provide an analysis of the electric load from tribal accounts with a detailed list of service points and buildings associated with each electric meter.
Provide analysis based on utility interconnection agreement options.

Cont. CREC Energy Assessment
Scope of Services All electric, natural gas, propane, water and sewer
consumption Thermal characteristics of the building envelop Lighting Heating ventilating and air condition systems Water heating Appliances Specialty equipment
CREC/SES Deliverables
Energy Assessment A comprehensive tool designed to empower the Iowa
Tribe to make informed decisions about energy use and implement energy efficiency measures.
Energy Efficiency Recommendations This report identifies the energy efficiency options
recommended by SES Energy Professional. These recommendations are intended to help the Iowa Tribe to achieve its energy efficiency objective of reducing overall energy use.

Final Report
90 Day Plan Receive Approval to Proceed with Revised
Modification of the Scope of Project Objectives Conduct Environmental Assessment Review Energy Analysis of the Iowa Tribe’s
Account Information Prepare Final Report with Recommendations