Embed Size (px)
Citation preview
WIND TUNNEL EVALUATION OF YF-12 INLET RESPONSE TO INTERNAL
AIRFLOW DISTURBANCES WITH AND WITHOUT CONTROL
Gary L. Cole, George H. Neiner, and Miles O. Dustin
Lewis Research Center
SUMMARY
Experimental responses of the inlet's terminal shock and subsonic duct
static pressures to internal airflow disturbances were obtained. The disturb-
ances were produced by the aft bypass or a specially designed disturbance gen-
erator located at the diffuser exit. Transient and frequency responses were
obtained from square wave and sinusoidal wave disturbances respectively. The
main objective of this program was to determine the inlet responses with the
inlet's duct-pressure-ratio control system active and to investigate ways of
improving those responses within the limitations of the flight actuation hard-
ware. Frequency response data were obtained first with inlet controls inactive.
This indicated the general nature of the inherent inlet dynamics, assisted in
the design of controls, and provided a baseline reference for responses with
active controls. In addition, the data helped to validate a NASA-Lewis small-
perturbation analysis of inlet dynamics.
All the control laws were implemented by means of a digital computer that
could be programmed to behave like the flight inlet's existing analog control.
The experimental controls were designed using an analytical optimization tech-
nique. The capabilities of the controls were limited primarily by the actu-
ation hardware. The experimental controls provided somewhat better attenuation
of terminal shock excursions than did the YF-12 inlet control. Controls using
both the forward and aft bypass systems also provided somewhat better attenu-
ation than those using Just the forward bypass. However, the main advantage of
using both bypasses is in the greater control flexibility that is achieved,
allowing the inlet to have a more efficient (i.e., lower drag) operating point.
INTRODUCTION
An efficient propulsion system will be a key factor in the development of
an economically viable commercial supersonic cruise aircraft. Propulsion
studies (ref. l) for the NASA supersonic cruise aircraft research (SCAR) pro-
gram have identified new variable cycle engine concepts that offer potential
performance gains over current engines. Studies also indicate that mixed-
compression inlets will be used for cruise Maeh numbers of about 2.2 and above.
Such inlets offer lower cowl drag and higher total pressure recovery than do
all external compression inlets. However, mixed-compression inlets are subject
to an undesirable phenomenon known as unstart, which would be unacceptable on a
157

commercial transport. Unfortunately, the chances of a disturbance induced un-
start increase as the inlet operates closer to its peak performance. Thus, a
challenging problem is to design a control system that will allow the inlet to
operate near its peak performance without unstart.
In general, control system design requires a dynamic model (measured ex-
perimentally or determined analytically) of the plant to be controlled. In the
case of an inlet, it is necessary to know the response of duct pressures and
terminal shock position to engine and atmospheric induced disturbances. Num-
erous experimental programs (e.g., refs. 2 to 14) have been conducted by NASA
and industry to obtain inlet dynamics and control information for both real and
simulated engine disturbances. Except for the program described in reference
14, the inlets were generally small scale and controls were implemented usinganalog computers.
Considerably less information is available relating to effects of
atmospheric-type disturbances on mixed-compression inlets. Simulation of at-
mospheric disturbances in supersonic wind tunnels is extremely difficult, but
some data have been obtained by oscillating flat plates and wedge shaped air-
foils upstream of inlets (refs. h and 8). A recent analytical study (ref. 15)
indicates that control of inlet terminal shock position against atmospheric
disturbances may be of more concern than control against engine disturbances.
As part of the NASA program to investigate scale and flight effects on the
steady-state and dynamic performance of the YF-12 aircraft inlet, a flight in-
let from a YF-12 aircraft was tested in the Lewis i0- by 10-Foot Supersonic Wind
Tunnel. The fact that the inlet was a flight article allowed the test to be
unique. It was the first time that the dynamic response characteristics of a
flight hardware mixed-compression inlet to simulated engine disturbances were
evaluated in a wind tunnel (ref. 16). It provided an opportunity to syste-
matically evaluate the bill-of-material inlet control system, including the
control laws and actuation hardware (ref. 17). For convenience the inlet con-
trol laws were programed on the digital system described in reference 18 rath-
er than in an analog mode like the actual aircraft system. With the trend
being toward the use of digital computers for control, this also provided an
opportunity to gain experience in the digital implementation of an actual flight
control system. The success of this program provided some impetus and justifi-
cation for the cooperative control program, planned for the YF-12 airplane
(ref. 19). In addition, the YF-12 inlet program provided a timely application
for a controller design method that uses the parameter optimization technique
described in reference 20. Results using experimental shock position con-
trollers and comparisons to results using the bill-of-material control aregiven in reference 21.
This paper summarizes the wind tunnel aspects of the YF-12 inlet dynamics
and control program as detailed in references 16, 17, and 21. Experimental
data, selected from those references, are presented showing the inlet normal
shock and subsonic duct static-pressure responses to simulated engine disturb-
ances, with and without control. For data shown in this paper the inlet angles
of attack and sideslip were zero degrees and the Mach number was either 2.956or 2. 474.
158

SYMBOLS
Values are given in SI units. The measurementsand calculations were madeinU.S. customary units.
DPR
E
duct-pressure ratio (PsD8/PpLM)
error signal between a set-point commanded signal and the
corresponding feedback signal, V
F
H
Kc
cost function
transfer function of feedback element H =
gain of shock-position controller
Is+ )c w C
s
MO0
NAR
Mach number measured at nose boom
normalized amplitude ratio,
II Output !
_[ Inputl fat input frequency.
[Output[_iInputl l-atlowestfrequenoyshown, without
control
Pp,A
P LMP
Ps,A'P "''' PSs,B' ,J
P Pss,L' ,Q
P D8s
throat total-pressure probe (see fig. 6)
external cowl pitot-pressure measurement for YF-12 air-
craft inlet DPR control signal, N/cm 2
static-pressure taps (see fig. 6)
static-pressure measurement for YF-12 aircraft inlet DPR
control signal, N/cm 2
Qn noise-penalty weighting factor used in controller-gain
optimization program
S
U
Laplace variable, i/sec
control bypass door area, cm 2
159
B_
c
Superscripts:
()
Subscripts:
D
V
angle of attack measured at nose boom, deg
angle of sideslip measured at nose boom, deg
controller corner frequency, rad/sec
mean value of ( )
derivative with respect to time
disturbance
random measurement noise
APPARATUS
Inlet Model
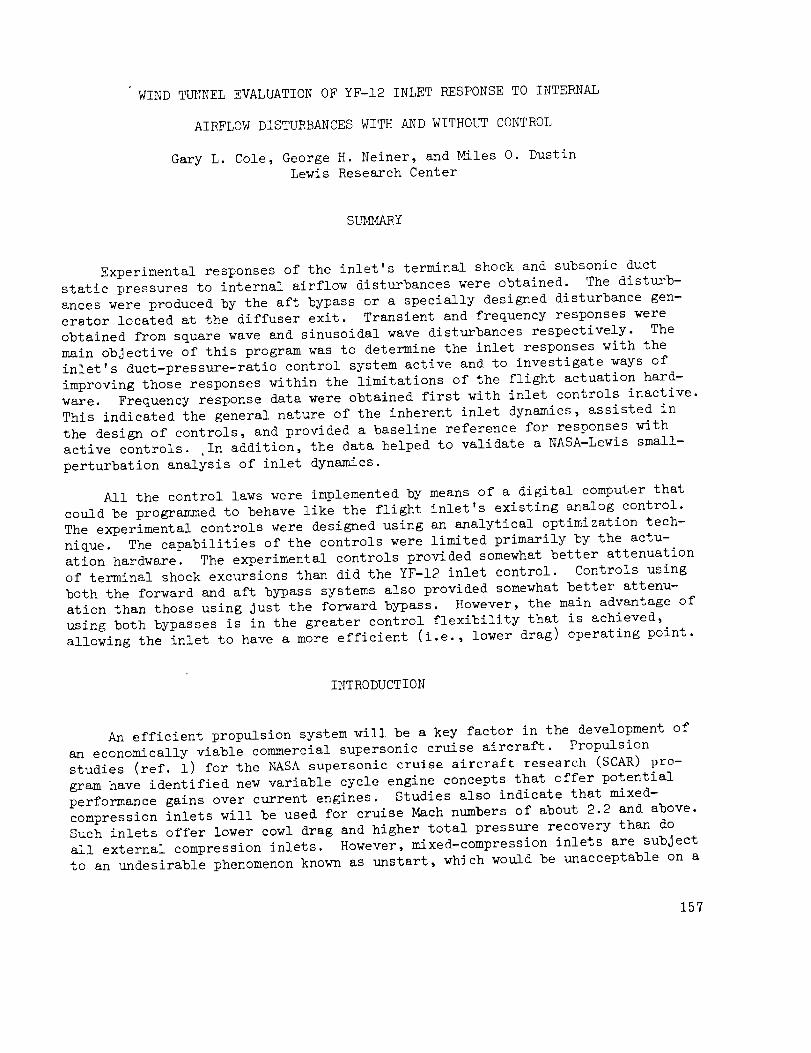
A flight inlet from a YF-12 aircraft was used for this investigation in
the i0- by 10-Foot Supersonic Wind Tunnel at Lewis Research Center. It is the
same inlet that was used in the steady-state inlet performance investigations
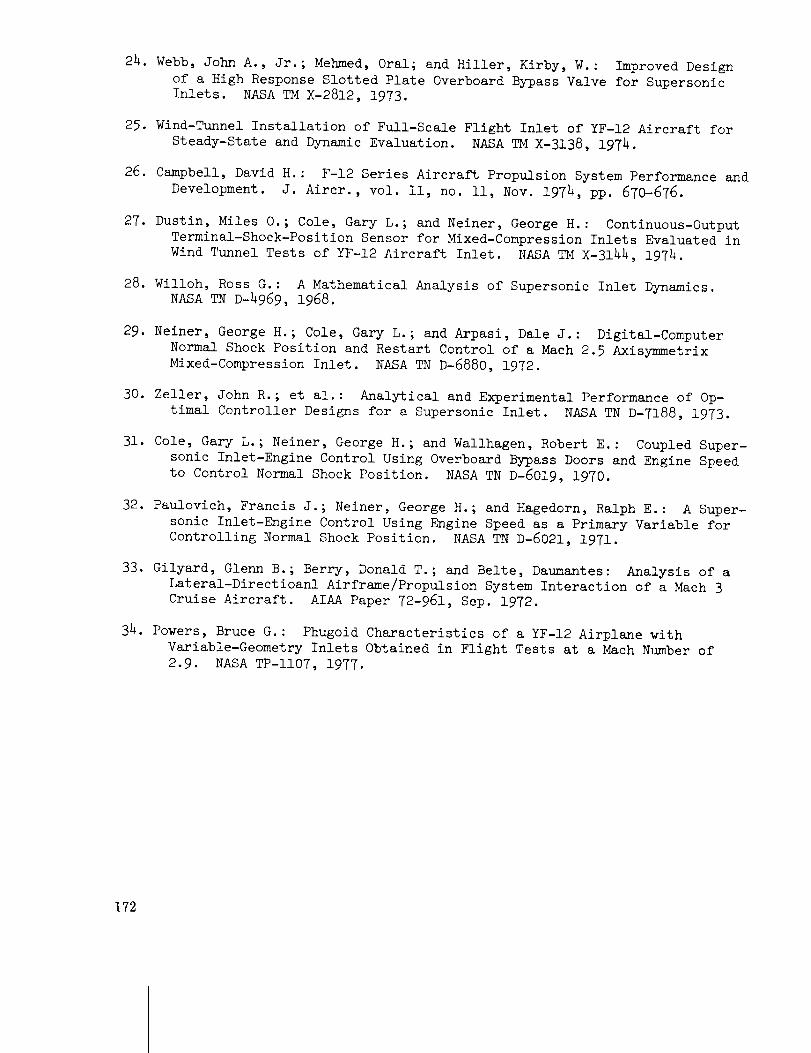
reported in references 22 and 23. Figure i is a schematic of the inlet showing
variable geometry features and locations of bleeds and bypasses. The inlet is
an axisymmetric, mixed-compression type and is sized at the design Mach number
of 3+ to supply a J58 afterburning turbojet engine. The spike translates for
inlet restart capability and operation at off-design Mach numbers.
Bleed regions for boundary layer control and shock stability are located
on both the spike and cowl. Spike boundary-layer bleed is accomplished by a
slotted surface on the spike. Cowl-boundary-layer bleed is provided by a com-
bination flush slot and ram scoop referred to as the shock trap.
The inlet has two bypass sytems. The forward bypass is used to position
the terminal shock by means of a duct-pressure-ratio (DPR) control, to be des-
cribed later. It is also used to bypass large amounts of airflow during an in-
let restart cycle. The aft bypass provides air for some engine cooling and
aids the forward bypass in matching the inlet airflow to the engine require-
ment at Mach numbers below 3.0. In flight, the aft-bypass is set by the pilot
at one of three discrete positions. For the wind-tunnel tests, the discrete
positioning mechanism was replaced with an electrohydraulic servomechanism to
provide continuous position control like that of the forward bypass. Frequency
responses of forward and aft bypass position to position commands are shown in
figure 2. The amplitude ratio responses were normalized by dividing by the
respective amplitude ratios at 0.I hertz.
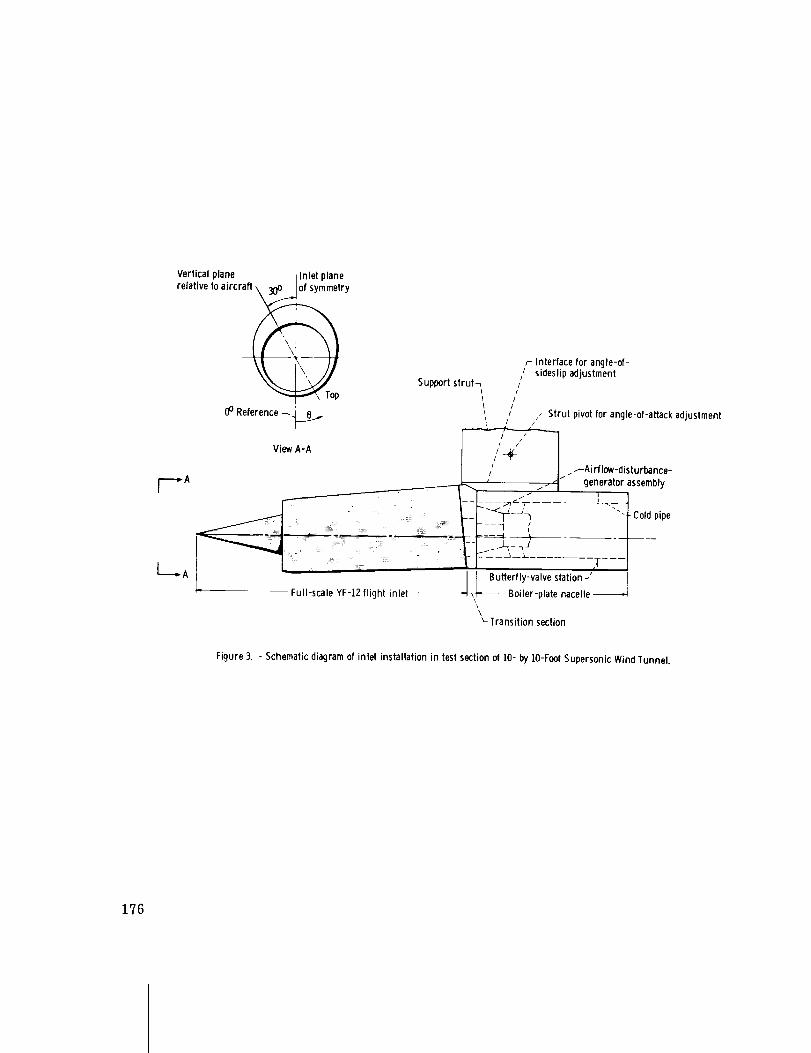
The inlet was attached to a boiler-plate nacelle and the complete assembly
was strut-mounted in the wind tunnel (fig. 3). Inside the nacelle was a cold-
160
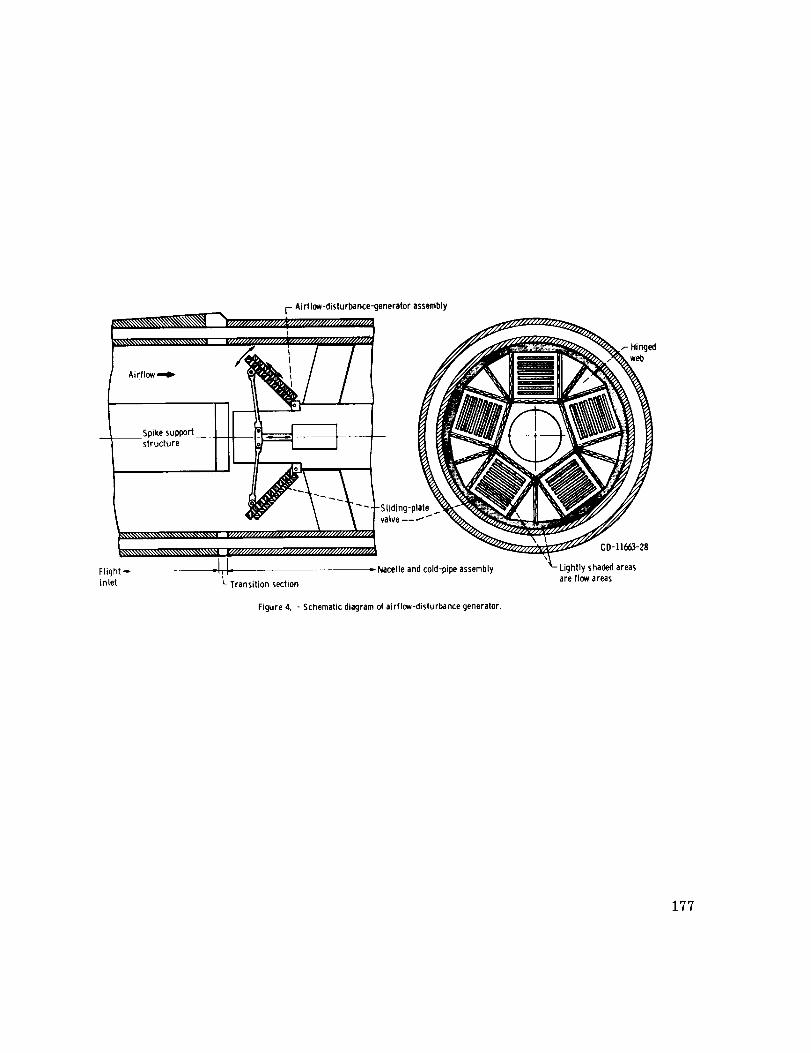
pipe assembly. An airflow-disturbance generator was strut-mounted in the cold
pipe near the diffuser exit (fig. 3). The assembly, shown in more detail in
figure 4, consisted of five sliding plate valves that were hinged so that they
could expand like an umbrella. The amount of assembly expansion and the posi-
tion of each sliding valve was remotely controlled by electrohydraulic servo-
mechanisms. Airflow across the assembly was choked. Thus, actuation of the
sliding plate valves provided a means of simulating perturbations in engine
corrected airflow. The frequency response of sliding-valve position to posi-
tion command is shown in figure 5. The amplitude response was normalized by
dividing by the amplitude at i hertz. Note that its response has a much wider
frequency range than that of the two bypass systems. Details of the sliding
valve servosystem design are given in reference 24.
Inlet angle of attack could be remotely adjusted by means of the strut
during a tunnel run. Inlet angle of sideslip could be adjusted only between
runs. The angles of attack and sideslip were 0° for all data shown in this
paper.
Additional details concerning the inlet systems and wind tunnel installa-
tion are given in reference 25. Reference 26 also gives additional informa-
tion regarding the F-12 series aircraft propulsion system.
Instrumentation
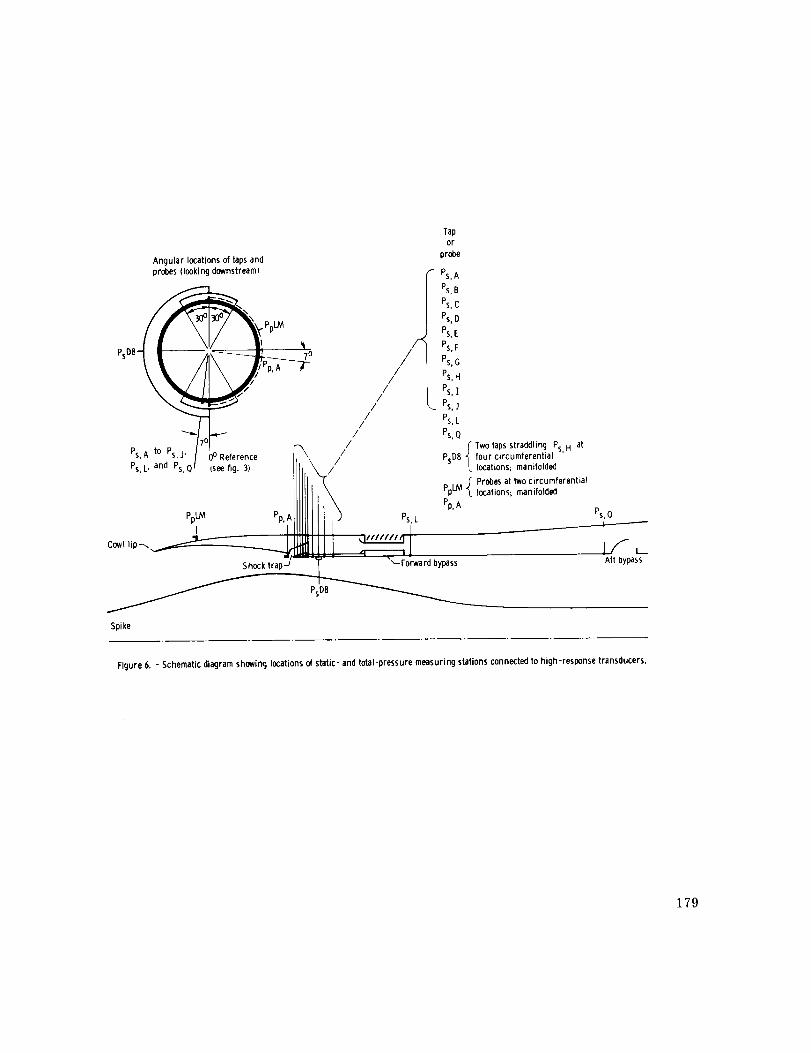
The pressure instrumentation consisted of high-response strain-gage pres-
sure transducers closely coupled to static taps and total probes located on
the inlet internal-cowl surface. Relative locations of the pressure measuring
stations are shown in figure 6. Exact axial locations are given in figure Ii
of reference 16. The response of each transducer and its connecting line was
flat within 0 to +0.5 decibel and had negligible phase shift in the frequency
range of 0 to i00 hertz.
Duct static pressure, PsD8, is a measurement of the pressure from eight
manifolded static-pressure taps, shown in figure 6. A high-response pressure
transducer of the type described previously also was used to measure the duct
static pressure. The duct static pressure is of interest because it is one of
two pressures used to determine duct pressure ratio DPR, the feedback signal
for the YF-12 forward bypass control. The DPR system was implemented so that
its response would be nearly identical to that of the flight YF-12 system.
However the ratio was computed electronically rather than by the aircraft mech-
anical sensor.
The outputs of the pressure transducers connected to static-pressure taps
Ps,A to Ps,J were used as inputs to an electronic terminal-shock-positionsensor. The shock sensor was used to obtain a measure of the response of inlet
terminal-shock position to airflow perturbations. The frequency response of
terminal-shock position as measured by the sensor to actual shock position was
found to be essentially flat with no more than 15 ° phase lag for frequencies in
the range of 0 to L0 hertz. A detailed description of the sensor design and
161
performance is given in reference 27. Additional details regarding instru-mentation are given in reference 25.
EXPERIMENTAL SETUP AND CONDITIONS
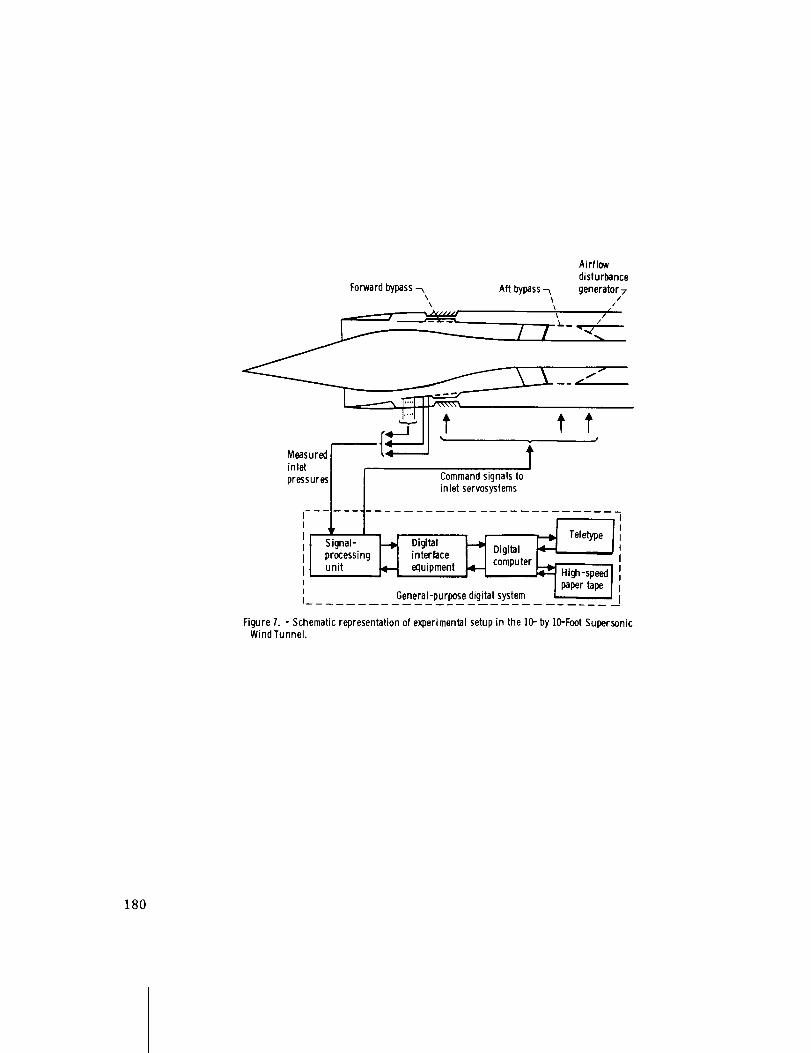
Figure 7 is a schematic of the wind-tunnel experimental setup. Shown are
the inlet, the flow paths of the command signals to the servomechanisms, the
flow paths of the measured inlet signals, and a general-purpose digital sys-
tem. The digital system was used to program both the aircraft and experimental
inlet terminal-shock-position controllers that will be described later. It
also controlled the sequencing of the experiment and performed calculations to
provide an immediate on-line display of results at the completion of each fre-
quency response test. Some characteristics and capabilities of the digital
computer system are given in table I and additional details of the overallsystem are provided in reference 18.
The inlet geometry configuration and terminal shock operating point were
generally about the same as those that would be set by the YF-12 aircraft
inlet-control system for corresponding flight conditions. Average free-stream
wind tunnel conditions, at which data shown in this paper were taken, were as
follows: Mach number, 2.956; total temperature, 373 K; Reynolds number per
meter, L.01xl06 or Mac_ number, 2.47h; total temperature, 310 K; Reynolds num-
ber per meter, 4.glxl0 _. The Reynolds numbers correspond to values within the
flight envelope of the aircraft.
RESULTS AND DISCUSSION
Responses without Inlet Control
Responses of several inlet variables to simulated engine airflow pertur-
bations without inlet control were obtained first. This indicated the general
nature of the inherent inlet dynamics, assisted in the design of controls and
provided a baseline reference for responses with active controls. In addition,
the data helped to validate a NASA-Lewis small-perturbation analysis of inletdynamic s.
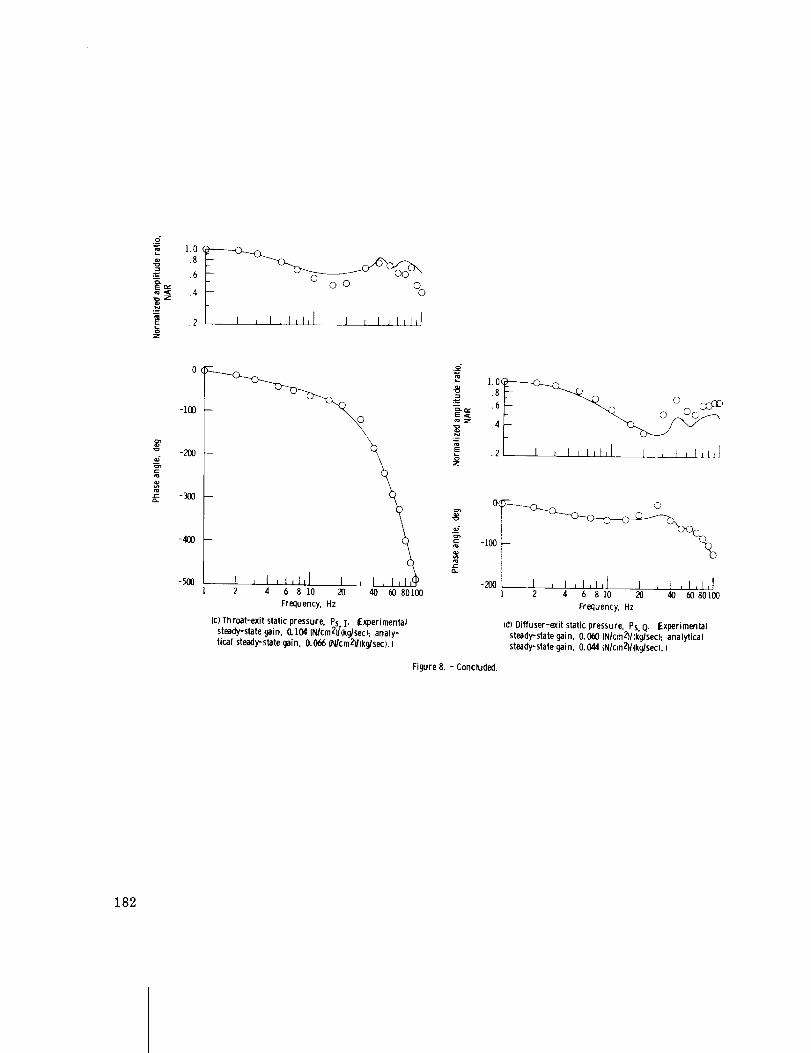
Experimental responses of terminal shock position and three subsonic duct
static pressures to the airflow disturbance generator, at the Mach 2.956 con-
dition, are shown in figure 8. Responses based on the small-perturbation
analysis of reference 28 are also shown for comparison. The equations govern-
ing terminal-shock position were derived by taking continuity, momentum, and
energy balances across the shock and accounting for a moving shock. The sub-
sonic duct is represented by sets of one-dimensional wave equations. In gen-
eral, the amplitude experimental responses have an initial rolloff followed by
one or more resonances. A particularly prominent peak occurs at about 40
hertz, except for PsD8. The greater attenuation of PsD8 is due to its
measuring system line and volume dynamics. The phase data are generally dom-
162

inated by a delay time. This was demonstrated in reference 16 which showed
phase angle to be linear with frequency above frequencies of 20 to h0 hertz,
depending on signal location. The characteristics of the YF-12 inlet are simi-
lar to those of the inlets of references 8, Ii, and 13. However, scale effects
on the dynamics of the inlets cannot be determined explicitly because none of
the inlets are the same geometrically. Also, overboard bypasses (holes in the
side of the subsonic duct) were not similarly located and disturbances occurred
at different locations which would modify the organ pipe frequency of the
ducts. In general, the rol!off of the YF-12 inlet is more rapid than for the
other inlets because of its greater subsonic-duct volume and it resonates at a
lower frequency because of its greater subsonic-duct length. Although corre-
sponding frequency response data were not available from flight for comparison,
the results would be expected to be the same for a corresponding inlet oper-
ating point condition, except for a modification due to temperature. In
flight, the stagnation temperature for the Mach 2.956 condition would be ap-
proximately 1.6 times the wind-tunnel value. Therefore, the duct delay and
fill times would be shorter in flight than in the tunnel because the speed of
sound is higher. The approximate inlet response expected for the flight condi-
tion can be determined by multiplying the tunnel disturbance frequencies by the
square root of the ratio of flight temperature to tunnel temperature. For ex-
ample, the resonant peak that occurs at 40 hertz in the tunnel should occur at
approximately 51 hertz in flight.
Before discussing the comparison of the analytical and experimental re-
sponses in figure 8, a few observations will be made concerning the inlet
analysis. Calculation of parameters used in the analysis can generally be
determined analytically with satisfactory accuracy. One exception is an area
parameter common to most inlet analyses. The parameter, A'/A, is defined as
the ratio of the axial rate of change of duct area A' to the duct area A,
evaluated at the shock operating point. The steady state gain of shock posi-
tion to an airflow disturbance in the subsonic duct is a strong function of
A'/A. It has been found that if the value of A'/A used in the analysis is
based on inlet geometry the analytical value of the gain is always higher tha_
the value measured experimentally. This is believed to be due to effects of
shock/boundary-layer interaction that are unaccounted for and to inadequate
modeling of the boundary layer bleed systems. By knowing the experimental
value of the gain, an effective value of A'/A can be calculated so that the
steady-state gains will match exactly. For the inlet of reference 8 the effec-
tive value of A'/A was found to range from 2 to h times the geometric value,
depending on the boundary-layer bleed configuration. For the case of figure 8,
the effective value was 2.5 times the geometric value.
A similar difficulty exists in matching the steady-state gains of static
pressures in the subsonic portion of the duct to the airflow disturbance. In
this case the analytically-determined value of the gain is lower if the analy-
sis is based strictly on inlet geometric areas. The major parameter affecting
this mismatch of gains is the duct Mach number at the pressure measuring sta-
tion. The duct Mach number, of course, depends on the boundary layer. Ex-
perimental steady state data can also be used to make the gains match. This
was not done in the case of figure 8. In general, the phase response data of
163
the terminal shock and the static pressures are not significantly affected by
these parameters.
The agreement between the experimental and analytical responses shown in
figure 8 is generally typical of that obtained with the smaller scale inlets
of references 8 and ll. Agreement in phase angle is usually excellent. Am-
plitude ratio agreement, although not as good as phase in an absolute sense
over the entire frequency range, is generally good in terms of the rolloff and
resonant frequencies.
Reference 16 also presents amplitude ratio data showing how YF-12 inlet
response varies with free-stream Mach number, angle of attack, shock operating
point and amount of forward bypass opening. The most significant variations
in initial rolloff and resonant frequency conditions were found at different
free-stream Mach number conditions. The different results are attributed to
combinations of changes in tunnel total temperature, spike position, forward
and aft bypass opening, terminal shock operating point, and simulated-enginecorrected airflow. The inlet also exhibited an extreme resonant condition
with the inlet operating at a higher than normal value of duct pressure ratio,
DPR. In that case the shock was near or in the shock trap, which acts in a
nonlinear manner. Also, this test may have excited a resonance in the sec-
ondary airflow duct (behind the shock trap).
Frequency responses of inlet signals to both the forward and aft bypasses
were also obtained. However, there is less confidence in those data because
bypass motion did not remain sinusoidal above a frequency of about 1 hertz.
Responses With Inlet Control
YF-12 aircraft inlet control system. - A simplified diagram of the YF-12
aircraft inlet control system is shown for normal started-inlet conditions in
figure 9. The system manipulates the spike and forward bypass positions. An
air data computer converts pressures measured at the airplane nose boom to air-
craft flight Mach number and angles of attack and sideslip. These flight
parameters are then used as inputs to the control system. The spike is trans-
lated to provide the necessary contraction ratio at each Mach number. The
purpose of the control that manipulates the forward bypass is to maintain the
terminal shock at the desired location. Shock position is sensed indirectly
by means of the duct-pressure-ratio, DPR. Both spike position and commanded
value of DPR are scheduled as functions of Mach number and both are biased by
angles of attack and sideslip and aircraft normal acceleration. In flight the
schedules are implemented by means of cams, and associated filtering and com-
pensation are accomplished electronically by analog equipment.
During the wind-tunnel program the inlet-control schedules and associated
filtering and compensation were implemented on the general purpose digital
system (fig. 7). This will also be done in the cooperative control program of
reference 19. Since an isolated inlet was tested, the airplane air data com-
puter and normal acceleration terms were unavailable. Therefore, the digital
system was also used to calculate the airplane flight conditions that would
164
correspond to the measured local inlet conditions. The calculations were
based on data obtained from the YF-12 flight program and from wind tunnel
tests of a YF-12 scale model. The acceleration term was omitted.
The digital computer program was performed on a priority-interrupt basis
at seven levels. About 25 percent of the time was spent checking the priority-
interrupt structure to determine what should be calculated next and where its
data should come from. About 50 percent of the time was spent calculating the
spike and DPR setpoints (commanded values) and the forward bypass control.
The remaining 25 percent of the time was spent on auxiliary routines, such as
frequency response calculations. Updates of the setpoint values and the for-
ward bypass control occurred every 9 milliseconds and 2 milliseconds, re-
spectively. The control update time was faster than necessary, since the for-
ward bypass can't respond to commands much beyond I hertz. According to
sampled-data theory, the setpoint update time of 9 milliseconds would allow
recognition of signals with frequency content of about 50 hertz or less. This
was more than adequate for the wind tunnel tests, since conditions were con-
stant. However, in flight, rapid variation of atmospheric conditions (e.g.,
ambient temperature and pressure and relative velocity due to gusts) can cause
an undesirable response of the inlet's terminal shock (ref. 15). Hence, a
more rapid update rate of the setpoint values to the control might be re-
quired. One consequence of inadequate sampling is that the bypass system will
drive the inlet shock at a frequency that is different from the disturbance
frequency (ref. 29). Controller dynamics were programmed using the advanced
Z-transform representation of the transfer-function.
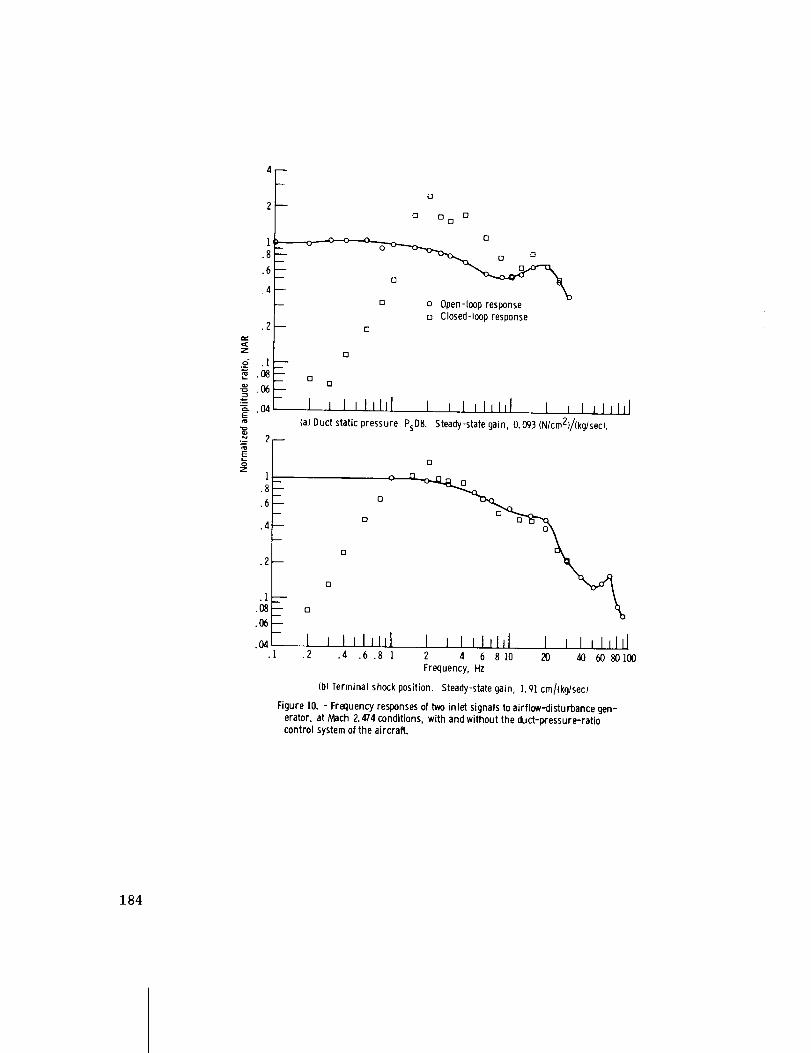
Closed-loop amplitude responses of PsD8 and the output of the terminal-
shock-position sensor to the airflow disturbance generator at Mach 2.L74 con-
ditions are compared to the open loop responses in figure 10. (The response
of DPR would be the same as that for PsD8, since PpLM was constant.) Theclosed-loop responses show that the control system is able to attenuate dis-
turbance induced shock motions, relative to the open-loop, for disturbances
frequencies only below 1 to 1.5 hertz. The control is limited primarily by
the speed of response of the forward bypass system. In the frequency range
of 1.5 to l0 hertz the PsD8 response shows considerable amplification rela-
tive to the open-loop, with a peak amplitude ratio of about 2.5 at 2 hertz.
This indicates that the control is reinforcing the disturbance. The extent of
the peaking can be reduced by decreasing the controller gain, but then the
attenuation at the low frequencies (0.2 Hz) would not be as great. Also the
speed of response would be slower. The closed-loop response eventually re-
Joins the open-loop response, indicating that the control system has become
ineffective. Closed-loop frequency responses were also obtained at higher
Mach numbers (ref. 17). The response at Mach 2.956 (ref. 17) showed very
little peaking above the open-loop response. Therefore, for the operating
conditions in the wind tunnel, the inlet closed-loop response was more stable
at Mach 2.956 than at Mach 2.47h.
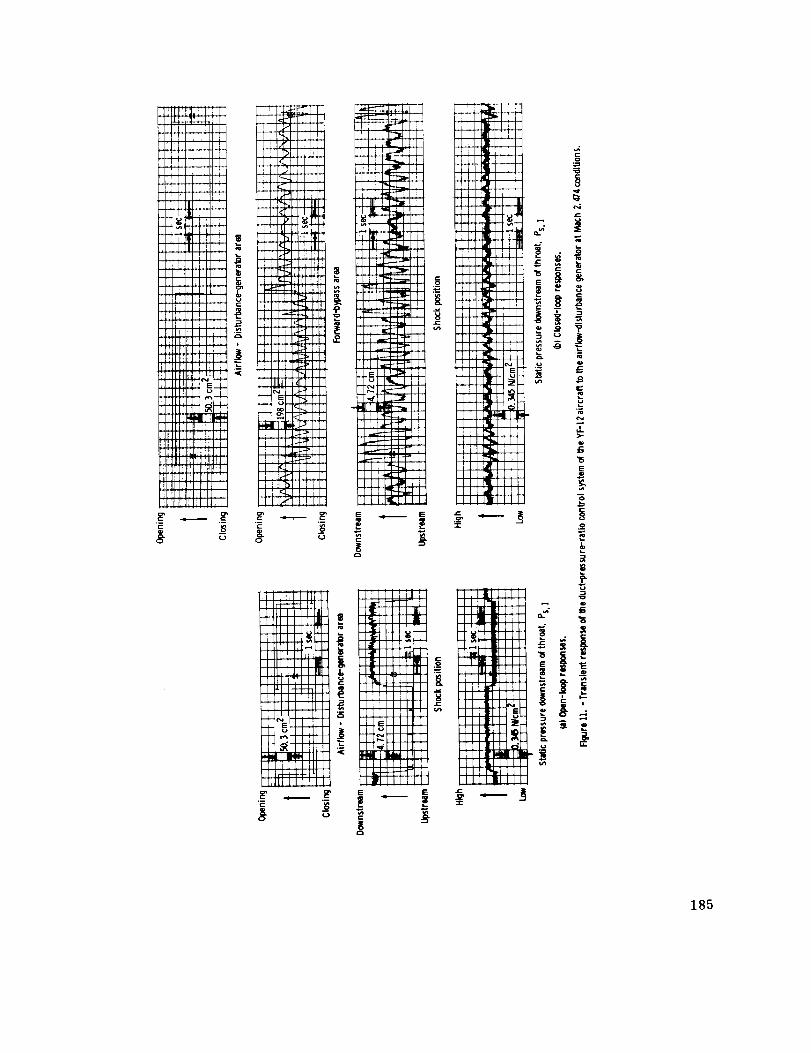
Open and closed-loop transient responses to a step change in the airflow
disturbance generator are shown in figure ll for the same operating condition
as that for the frequency response of figure 10. The uncontrolled change in
shock position (fig. ll(a)) is approximately 13.7 centimeters. The noise-free
165

portion of the shock sensor trace occurs when the shock has movedupstream ofpressure tap Ps,A (fig. 6). The shape of the response of pressure Ps,l isvery similar to the shock response. The closed-loop transient (fig. ll(b))showsthat the control system responds rather unstably to the disturbance. Theforward bypass oscillates at about 2 hertz with no evidence that the oscilla-tion will die out. The frequency of the oscillation corresponds to the fre-quency at which peaking occurs (fig. i0). After the disturbance occurs, thecontrol system drives the shock through somepeak-to-peak excursions that areactually greater (about 16 cm) than without control. This response is unde-sirable and indicates a need for a controller gain adjustment at the Mach2.h7hcondition.
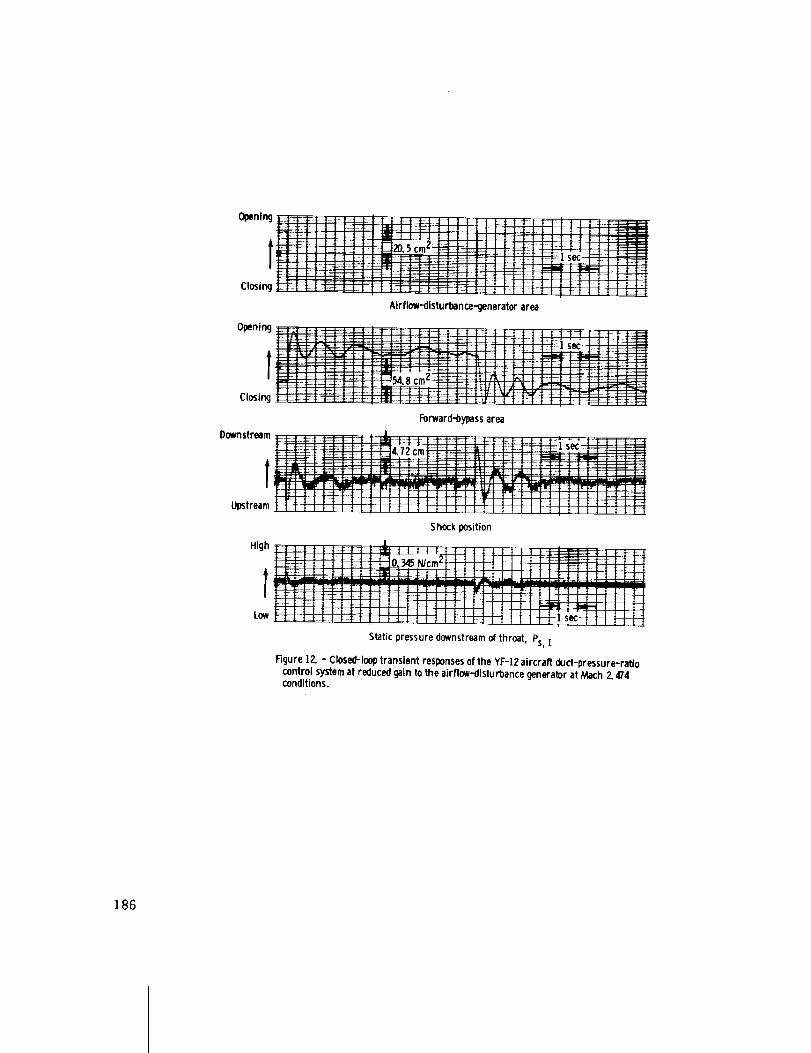
Figure 12 showsthe transient response at the Mach2.474 condition withthe loop gain reduced to about one-third of its value for the transient of fig-ure ii. The forward bypass still exhibits an overshoot followed by somering-ing which tends to die out, but the oscillations are not nearly as severe asfor the case of figure Ii. The forward bypass is seen to open more rapidlythan it closes - an observation not quite so apparent in figure ii. The systemwas designed that way to allow the inlet to movequickly away from an unstartcondition.
Transient responses were also obtained for the Mach2.956 condition andare shownin reference 17. The closed-loop transient response was similar tothat for the reduced gain case at Mach2.474, indicating a better choice ofgain for the Mach2.956 condition. However, the transient response was moreoscillatory than would have been expected from the closed-loop frequency re-sponse. This maybe due, in part, to nonlinearities in the system.
The frequency response and transient data Just discussed indicate thatboth types of testing are valuable. As will be discussed later, the open-loopfrequency response data can be used for designing controllers. However, theclosed-loop frequency response may not indicate potential problems that are re-vealed by transient tests. In simulating the control system, the actuationhardware should be accurately simulated including nonlinearities like hyster-esis and friction. Or better yet, actual flight hardware should be used.Care must be taken to be sure that closed-loop responses are sufficiently stableat all conditions.
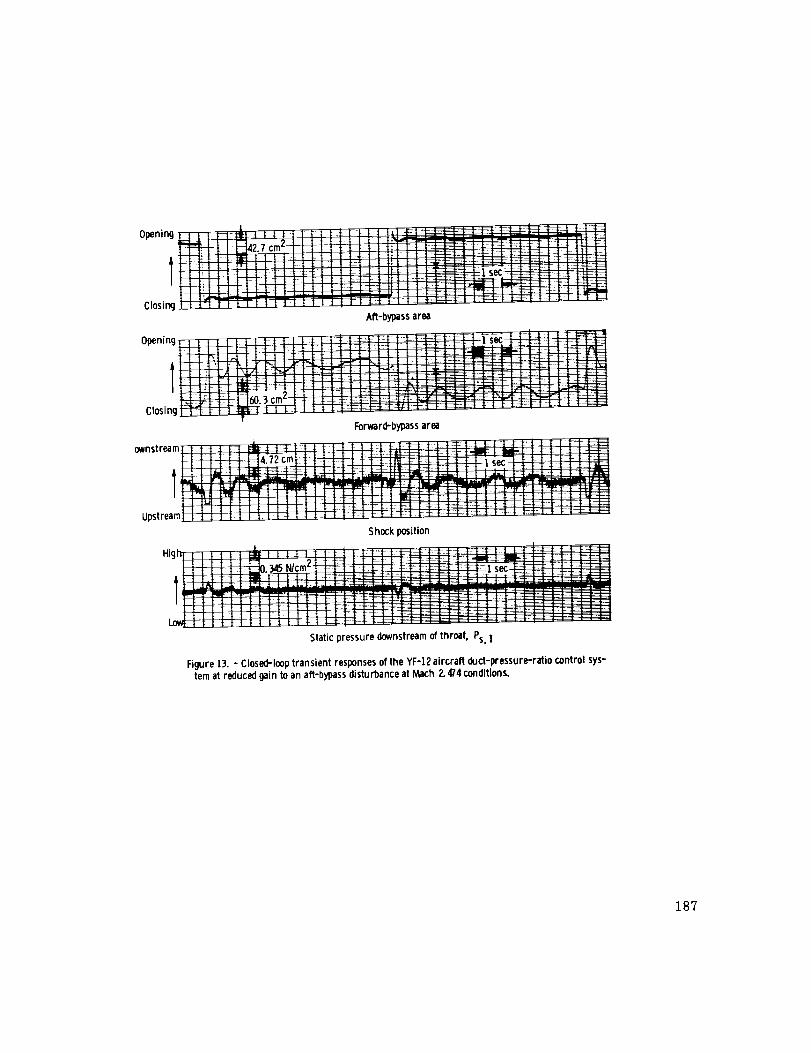
The closed-loop transient response of the inlet to an aft-bypass disturb-ance is shownin figure 13. The response is seen to be basically the sameasthat of figure 12. However, this transient revealed an oscillation of the aftbypass system that did not occur during transients whenthe DPRcontrol systemwas inactive. A similar action occurred at the Mach2.956 condition (ref. 17).This indicates that a coupling, although small, does exist between the aft-bypass servosystem and the DPRcontrol system. The origin of the coupling isunknown, but could be due to either an aerodynamic flow force or a structuralvibration. It should be kept in mind that the aft-bypass actuator used in thewind tunnel tests is not the sameas the standard one used on the aircraft.However, as will be discussed later, it maybe beneficial to use both overboardbypass and secondary bypass servo-driven systems for inlet control. Hence, thepotential for interaction exists that mayonly be revealed by experimental tests.
166

Experimental inlet control systems. - An investigation was conducted to
determine if control of the YF-12 inlet terminal shock could be improved by
improving the controller dynamics and/or by using the aft bypass system or
engine speed (simulated) to augment the forward bypass system (ref. 21). These
tests were all conducted at the Mach 2.956 condition.
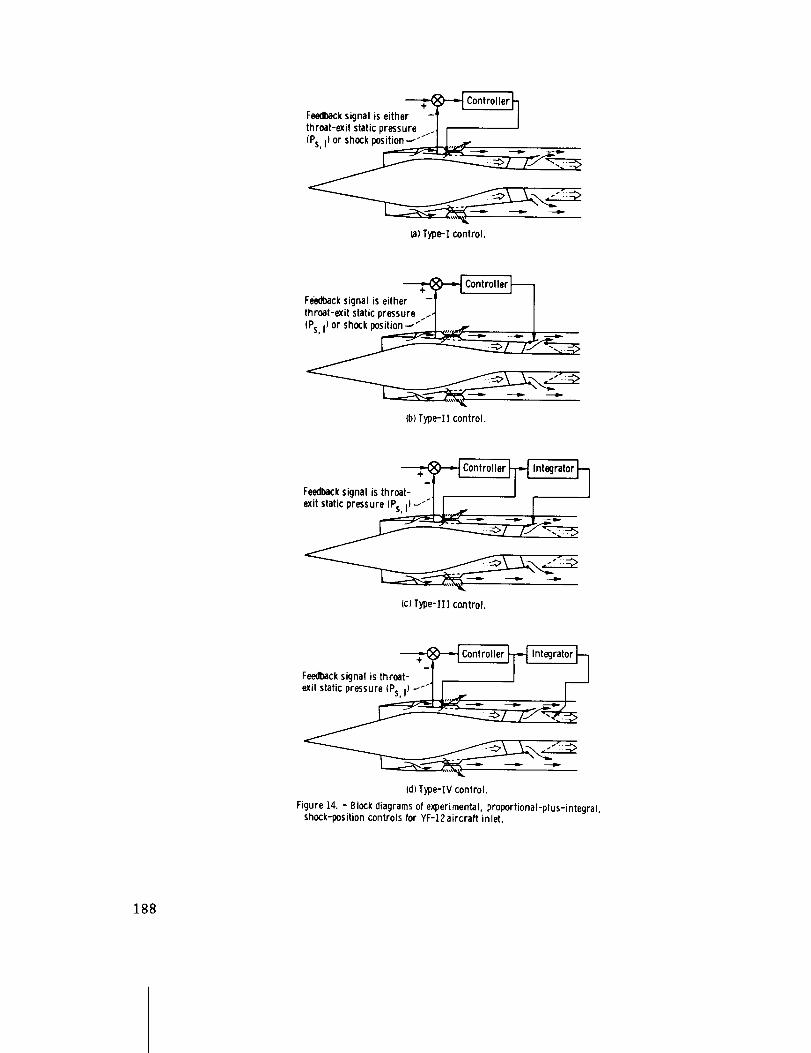
Figure lh shows block diagrams of the four types of experimental controls
that were tested. The type I system is like the aircraft inlet system except
that it uses a different feedback signal and controller. Types ! and !I used
either Ps,l or the shock-position sensor output as the feedback signal. Theclosed-loop responses using either variable were not significantly different,
so, unless noted otherwise, only results with Ps,l feedback will be shown.
Types III and IV controls used Ps,l as the feedback signal. For types Iiiand IV, a second loop causes reset action of the forward bypass by means of
either the aft-bypass or the sliding-valves of the airflow-disturbance gener-
ator. The action of the sliding valves was slowed down to simulate realistic
changes in engine speed. The controller for all four types was a proportional-
plus-integral filter function having the general form
H = Kc(_+ i)
s
Optimal fixed-form controller parameters (Kc and _c) were determined by using
a computerized frequency-domain technique described in reference 20 as opposed
to an optimal time-domain technique (e.g., ref. 30). The technique is based on
minimization of a cost function which included the system regulation error (ED)
due to the disturbance and the control power (0_) due to measurement noise.
The cost function can be stated in equation form as
F _-_ + Qn02= E D
where Qn is a noise-penalty weighting factor. The computer technique re-
quires as input the transfer function for the uncontrolled inlet dynamics and
actuation hardware dynamics. The computer then calculates the expected closed-
loop frequency response and the cost function while searching for the optimum
gains. The optimum controller gains, determined for various values of Qn,
were evaluated experimentally to find the most acceptable values of K c and
_c" This method provided a simpler and quicker means of arriving at controller
parameters than do the classical methods such as the root locus approach that
was used in reference 9. This would be especially true if more than two con-
troller parameters were involved. The optimization approach would be even more
useful in a case like the experimental program of reference 12 where the inlet
had a high response (i00 Hz) overboard bypass system and the control feedback
signals were very noisy due to an inlet instability.
A comparison of computed analytical and experimentally measured closed-
loop frequency responses for type-I controls are shown in figure 15. Results
are presented for a range of values of the noise-penalty weighting factor Qn.All of the results exhibit similar characteristics. The increase in amplitude
167

ratio with frequency below i hertz is expected because of the integral controlaction. As Qn decreases the noise penalty decreases and there is a corre-sponding increase in controller gain. Therefore the control loop-gain in-creases, accounting for the greater attenuation at disturbance frequencies ofabout 1.5 hertz and below. The agreementbetween analytical and experimentalresults is quite good except in the vicinity of 2 hertz, when Qn was 0.01.The samekind of discrepancy has been observed before when control system loopgains were high (e.g., ref. 9). This phenomenon was investigated more thor-
oughly in another test as shown in figure 16. In this case data were taken at
closer frequency intervals in the vicinity of a peak like the one that occurred
in figure 15. As for the results of figure 15, the sudden increase in ampli-
tude ratio occurred only when Qn was 0.01. The sudden change in the fre-
quency response is characteristic of a Jump resonance and indicates that the
loop gain finally became large enough so that nonlinearities in the system had
a significant effect on the closed-loop response. The inlet response is cer-
tainly not linear for large excursions of the terminal shock. A linearized
inlet model will predict higher allowable gains than can be achieved in the
real system. Thus, care must be exercised in interpreting control results
from a linearized inlet model, or alternately the system nonlinearities must
be accurately simulated.
Generally, it was found that a noise-penalty weighting factor, Qn, of 0.I
resulted in good performance for the type I and II controllers. The closed-
loop frequency responses generally showed good attenuation of disturbance in-
duced shock motion at the low end of the frequency scale. At the same time,
the jump resonance phenomenon of figures 15 and 16 was avoided. These con-
trollers were also tested with the reset action of the type III and IV controls.
These types of control had been investigated earlier using an actual engine
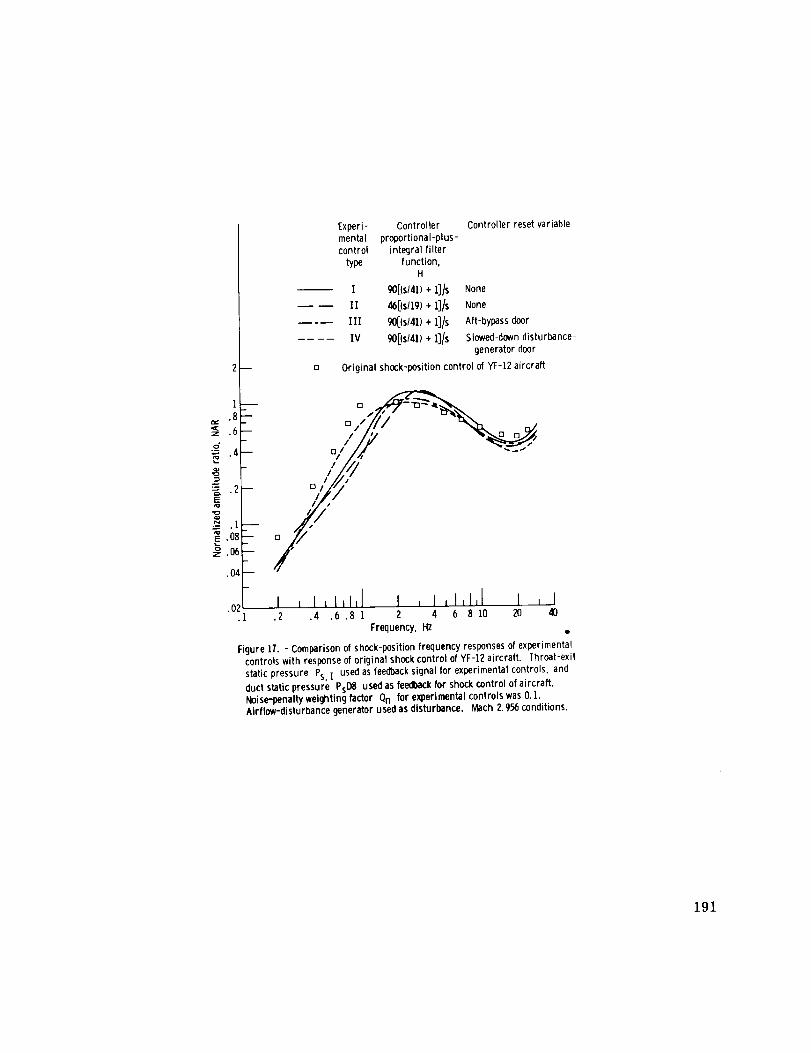
(refs. 31 and 32). Figure 17 shows a comparison of the closed-loop responses
for the four types of experimental control systems along with the YF-12 air-
craft inlet duct-pressure-ratio control. The results indicate that, although
the experimental controls gave somewhat better performance (greater attenuation),
the airplane control was pretty well optimized for the Mach 2.956 condition.
The optimization procedure couldn't produce a control that was significantly
better than the airplane control because the forward bypass actuation hardware
was the major limiting factor. Note that the addition of the reset action had
a stabilizing effect on the control as evidenced by the decrease in peaking at
the resonant frequency for the type IIl and IV controls. Additional frequency
response data are given in reference 21.
Transient responses were obtained for the type I, llI, and IV controls
(ref. 21). No significant differences between the type I and airplane controls
were observed. Figure 18 shows a transient response that illustrates the reset
action of the type III control system. Just after the disturbance occurs
(point i) the forward-bypass opens (point 2) to bring the shock back to its
desired position (point 3). The aft-bypass is then slowly opened by the con-
troller reset action (point 4), which allows the forward-bypass to go closed
again (point 5) to a lower drag condition. The same sequence of events occurs
(points 6, 7, 8, 9, and i0) when the disturbance-generator area opens. The
different rates of reset are due to the fact that the aft-bypass actuator moves
faster in the closing direction than in the opening direction. The action of
168

the type IV control system is similar except that the reset of the forward by-
pass was caused by a change in engine speed simulated by the airflow-
disturbance generator. Neither the type III or type IV control systems offer a
response that is much faster than the type I and II or airplane control systems.
The advantage is in the greater control flexibility that is achieved, allowing
the inlet to have a more efficient (i.e., lower drag) operating point. This
would be especially desirable for a commercial supersonic cruise aircraft.
Rapid reset of the forward bypass might also be used to minimize the effects of
propulsion system interaction with the lateral and longitudinal directional-control characteristics that have been noted in references 33 and 34. It is
hoped that this kind of control can be demonstrated during the cooperative
control flight program of reference 19.
SUMMARY OF RESULTS
The response of terminal-shock position and static pressures in the sub-
sonic duct of a YF-12 aircraft flight-hardware inlet to perturbations in simu-
lated engine corrected airflow were obtained with and without inlet control.
Both the YF-12 duct-pressure-ratio DPR control and experimental controls which
had optimal, fixed-form terminal-shock-position controllers were used. In some
cases the experimental controls reset the forward bypass to the desired posi-
tion by trading either aft-bypass area or a change in simulated engine speed
for forward-bypass area.
The open-loop frequency-response amplitude ratio data generally exhibited
a rolloff characteristic followed by one or more resonances. The results were
similar to those obtained for small scale inlets except that the rolloff and
first resonance occurs at lower frequencies for the YF-12 inlet. This is due
to the larger volume and greater length of the YF-12 inlet subsonic duct.
Phase data were found to be dominated by a delay time at frequencies above 20
to 40 hertz depending on signal location. The responses in in-flight should be
similar except for a shift in the frequency scale due to a difference in tem-
perature. Closed-loop frequency responses, calculated from open-loop transfer
functions of the individual components of the system, generally gave good
agreement with experimentally measured results. However, when controller gains
were too high, agreement was poor in the vicinity of a resonance because non-
linearities in the system had a large effect.
Frequency responses with the YF-12 DPR control system active showed at-
tenuation of disturbance-induced shock excursions for frequencies of about
i hertz and below. Above i hertz the control was either ineffective or made
the shock excursion worse. Both frequency and transient response data indi-
cated that the inlet closed-loop response was less stable at some Mach numbers
than at others. In cases where the aft bypass was used to disturb the inlet,
with the DPR control system active, an undesirable coupling of unexplained
origin caused the aft-bypass servosystem to oscillate. Although the aft-
bypass actuator used for these tests is not the same as the standard one used
on the airplane, it is important to recognize that the potential for such a
coupling does exist.
169

The experimental terminal-shock-position controls did not perform signifi-cantly better than the YF-12 DPRcontrol. In general, the speed of response ofthe forward bypass is a major limiting factor for all of the controls. Thecontrols that reset the forward bypass were found to operate more stably thanthe others. Another advantage of the controls with reset is the greater degreeof control flexibility, allowing the inlet to operate at a more efficient(i.e., lower drag) operating point.
REFERENCES
i. Willis, E.; and Welliver, A. D.: Variable-Cycle Engines for SupersonicCruise Aircraft. AIAA Paper 76-759, July 1976.
2. Chum,K. S.; and Burr, R. H.: A Control System Concept for an AxisymmetricSupersonic Inlet. J. Aircr., vol. 6, no. 4, July-Aug. 1969, pp. 306-311.
3. Schweikhardt, R. G.; and Grippe, R. P.: Investigations in the Design andDevelopmentof a BypassDoor Control System for an SSTAxisymmetric IntakeOperating in the External Compression_de. AIAA Paper 70-695, June1970.
4. Investigations of Supersonic Transport Engine Inlet Configurations. (LAC-603220, LockheedAircraft Corp.; NASAContract NAS2-2363.) NASACR-68399, 1965.
5. Inlet-Exhuast-Thrust Reverser Program for the CommercialSupersonic Trans-port. LAC-596884,LockheedAircraft Corp., Aug. 1964; ASDContract No.AF33(657)-I14!9 for FAA. AD-367328L.
6. Martin, Arnold W.; Kostin, Leonard C.; and Millstone, Sidney D.: DynamicDistortion at the Exit of a Subsonic Diffuser of a Mixed CompressionInlet. NASACR-164h, 1970.
7. Martin, Arnold W.; Beau_lieu, WarrenD.; and Kostin, Leonard C.: Analysisand Correlation of Inlet Unsteady Flow Data. NA-71-I146, NorthAmerican Rockwell Corp., 1971.
8. Wasserbauer, Joseph F.: DynamicResponseof a Mach2.5 Axisymmetric Inletwith Engine or Cold Pipe and Utilizing 60 Percent Supersonic InternalArea Contraction. NASATN D-5338, 1969.
9. Neiner, GeorgeH.; Crosby, Michael J.; and Cole, Gary L.: Experimental andAnalytical Investigation of Fast Normal ShockPosition Controls for aMach2.5 Mixed-CompressionInlet. NASATND-6382, 1971.
i0. Cole, Gary L.; Neiner, GeorgeH.; and Crosby, Michael J.: An AutomaticRestart Control System for an Axisymmetric Mixed-CompressionInlet.NASATN D-5590, 1969.
170

ii. Baumbiek, Robert J.; Neiner, George H.; and Cole, Gary L.: Experimental
Dynamic Response of a Two-Dimensional, Mach 2.7, Mixed-Compression Inlet.
NASA TN D-6957, 1972.
12. Cole, Gary L.; Neiner, George H.; and Baumbick, Robert J.: Terminal Shock
Position and Restart Control of a Mach 2.7, Two-Dimensional, Twin-Duct
Mixed-Compression Inlet. NASA TM X-2818, 1973.
13. Baumbick, Robert J.; Wallhagen, Robert E.; Neiner, George H.; and
Batterton, Peter G.: Dynamic Response of Mach 2.5 Axisymmetric Inlet
with 40 Percent Supersonic Internal Area Contraction. NASA TM X-2833,
1973.
14. Batterton, P. G.; Arpasi, D. J.; and Baumbick, R. J.: Digital Integrated
Control of a Mach 2.5 Mixed-Compression Inlet and an Augmented Mixed-
Flow Turbofan Engine. NASA TM X-3075, 1974.
15. Cole, Gary L.: Atmospheric Effects on Inlets for Supersonic Cruise Air-
craft. AIAA Paper 77-874, July 1977.
16. Cole, Gary L.; Cwynar, David S.; and Geyser, Lucille C.: Wind-Tunnel
Evaluation of the Response of a YF-12 Aircraft Flight Inlet to Internal
Airflow Perturbations by Frequency-Response Testing. NASA TM X-3141,
1972.
17. Neiner, George H.; Arpasi, Dale J.; and Dustin, Miles 0.: Wind-Tunnel
Evaluation of YF-12 Aircraft Inlet Control System by Frequency-Response
and Transient Testing. NASA TM X-31_2, 1975.
18. Arpasi, Dale J.; Zeller, John R.; and Batterton, Peter G.: A Genral Pur-
pose Digital System for On-Line Control of Air-breathing Propulsion
Systems. NASA TM X-2168, 1971.
19. Reukauf, Paul J.; Burcham, Frank W., Jr.; and Holzman, Jon K.: Status of a
Digital Integrated Propulsion/Flight Control System for the YF-12 Air-
plane. AIAA paper 75-1180, Sep. 1975.
20. Seidel, Robert C.; and Lehtinen, Bruce: Control System Design Using Fre-
quency Domain Models and Parameter Optimization, With Application to
Supersonic Inlet Controls. NASA TM X-3108, 1972.
21. Neiner, George H.; Seidel, Robert C.; and Arpasi, Dale J.: Wind-Tunnel
Evaluation of Experimental Controls on YF-12 Aircraft Flight Inlet by
Frequency-Response and Transient Testing. NASA TM X-3143, 1975.
22. Cubbison, Robert W.: Wind-Tunnel Performance of an Isolated, Full-Scale,
YF-12 Aircraft Inlet at Mach Numbers Above 2.1. NASA TM X-3139, 1978.
23. Cubbison, Robert W.: Effects of Angle of Attack and Flow Bypass on Wind-
Tunnel Performance of an Isolated, Full-Scale, YF-12 Aircraft Inlet at
Mach Numbers Above 2.075. NASA TM X-3140, 1978.
171
24. Webb, John A., Jr.; Mehmed, Oral; and Hiller, Kirby, W.: Improved Design
of a High Response Slotted Plate Overboard Bypass Valve for SupersonicInlets. NASA TM X-2812, 1973.
25. Wind-Tunnel Installation of Full-Scale Flight Inlet of YF-12 Aircraft for
Steady-State and Dynamic Evaluation. NASA TM X-3138, 1974.
26. Campbell, David H.: F-12 Series Aircraft Propulsion System Performance and
Development. J. Aircr., vol. ii, no. ii, Nov. 1972, pp. 670-676.
27. Dustin, Miles 0.; Cole, Gary L.; and Neiner, George H.: Continuous-0utput
Terminal-Shock-Position Sensor for Mixed-Compression Inlets Evaluated in
Wind Tunnel Tests of YF-12 Aircraft Inlet. NASA TM X-3144, 1974.
28. Willoh, Ross G.: A Mathematical Analysis of Supersonic Inlet Dynamics.NASA TN D-4969, 1968.
29. Neiner, George H.; Cole, Gary L.; and Arpasi, Dale J.: Digital-Computer
Normal Shock Position and Restart Control of a Mach 2.5 Axisymmetrix
Mixed-Compression Inlet. NASA TN D-6880, 1972.
30. Zeller, John R.; et al.: Analytical and Experimental Performance of Op-
timal Controller Designs for a Supersonic Inlet. NASA TN D-7188, 1973.
31. Cole, Gary L.; Neiner, George H.; and Wallhagen, Robert E.: Coupled Super-
sonic Inlet-Engine Control Using Overboard Bypass Doors and Engine Speed
to Control Normal Shock Position. NASA TN D-6019, 1970.
32. Paulovich, Francis J.; Neiner, George H.; and Hagedorn, Ralph E.: A Super-
sonic Inlet-Engine Control Using Engine Speed as a Primary Variable for
Controlling Normal Shock Position. NASA TN D-6021, 1971.
33. Gilyard, Glenn B.; Berry, Donald T.; and Belte, Daumantes: Analysis of a
Lateral-Directioanl Airframe/Propulsion System Interaction of a Mach 3
Cruise Aircraft. AIAA Paper 72-961, Sep. 1972.
34. Powers, Bruce G.: Phugoid Characteristics of a YF-12 Airplane with
Variable-Geometry Inlets Obtained in Flight Tests at a Mach Number of
2.9. NASA TP-II07, 1977.
172

TABLE I. - DIGITAL SYSTEM CAPABILITIES
Digital computer
Magnetic core memory size, words ................... 16 384
Word length, bits plus parity ....................... 16
Memory cycle time, nsec ....................... 750
Add time, _sec ............................. 1.5
Multiply time, _sec .......................... 4.5
Divide time, _sec .......................... 8.25
Load time, _sec ............................ 1.5
Indirect addressing ........................ Infinite
Indexing ............................ Total memory
Priority interrupts ................... 28 separate levels
Index registers ............................. 2
Interval timers ............................. 2
173
I1_ Main inlet flo_ Spike-bleed
Spike bleed flow exit Iouver._
Shock-trap flow Forward-bypass flow-., % /-Spike support strut_" % /
Forward-bypass flow , .,1,_ t / ///_//_ _//f __._.____Aft-bypass flow _ _ I I ------- I I ---"
aft-bypass flow _ l _ _ _ I /-- ,7
i 0 _ I ,,' .i I
__" i , _ All-bypass flowl I
Spike bleed _/ l
,.lo,_.ur,aco,-"1 1 _ Sp,.sup.rtsy.tem
.an,_a_ngspike--'_ ! I _
I_1 _"""_ "'_IP" ......... _ to engine
Shock trap J i _ %,,__k_tr_. Mixed shock-trap and aft-bypass /
Shock-traptube--' i'l'__ °_ t,owthrougha_oulustob,_d ;back-pressure butterfl_J valves ..J
Figure 1. - Schematic diagram of inlet geometry and location, of bleeds and bypasses.
174

2 --
l(
z .6
._o".4
:_ .1
.o_
z .06
.04
.02
0
-50
-I00
._ -150Q-
-2(30
-250
Aft-bypass door Oo_
I i I lilLJl I i I illii[ I I i
(aJAmplitude ratio.
_ "o\
• I J i I Iilil I I I lllll[ I I I.2 .4 .6 .8 1 2 4 6 8 I0 20 40
Frequency, Hz
(b)Phase angle.
Figure 2.- Frequency response offorward-and aft-bypasspositionto
command voltage. {Comrnanded peak-to-peakamplitude,10 percent
of maximum doorarea forforward--bypassand 20 percentforaft-
bypass.)
175
Vertical planerelative to
i Inlet plane
aircra_y
Top
0°Reference_.j A_
F-.._ A
L__.. A
View A-A
Full-scale YF-I2 flight inlet
r- Interface for angle-of-/ sideslip adjustment
/
Support strut-7 /
/
_ F Strut pivot for angle-of-attack adjustmentl / /
_-.-_,_ir_l_-disturbance-
" generator assembly
/ tj I----_-7 "-_- -1
"'i- Cold pipe
--- 't
._ Butterfly-valve station 2
s+-_--- Boiler-plate nacelle_
"-Transition section
Figure 3. - Schematic diagram of inlet installation in test section of lO- by lO-Foot Supersonic Wind Tunnel.
176
I- Airflow-disturbance-_
"__//. "MJMJ/VJJ_fJ/..'J/,_i
_JJfJfffJffJJffJfff_ "/_
-Spike support.....
structure
_\_\\\\\\\\\\\\\\\\\\\\\\\\\\_ _/J/f////IZ//////fffA
_\\\\\\\\\\\\\\\\\\_
Flightinlet L Transition section
:nerator assembly
_r Hinged
CD-11_--28
Nacelle and cold-pipe assembly Lightly shaded areasare flm._areas
Figure 4. - Schematic diagramof airflow-disturbance generator.
177

d
E.¢z
z
.8
.6
.4
.2
.i
-- 0 0 0 0 0 0 0 0 0000- 0
- \o, ,, ,,,,,I , , ,,,,,,I ,
$
Q-
O(
-25
-50
-75
-i00
-125
-150
-1/5
-200
-225
)- 0 0 0 00
-- 00
-- 0
0
0
0
-- 0
0
-- 00
_ 000
t I °I , I *I,I, l , I i l,ll I
2 4 6 8 10 20 40 60 80 tO0 200Frequency,Hz
Figure 5. - Frequency response of airflow-disturbance-generatorsliding-plate valve (disturbance door) position to position com-mand voltage. ICommandedpeak-to-peakamplitude, lO percentof maximum valve area. )
178
Angular locations of tapsandpro0es dooking downstream_
/ _PpLM
Ps,At° ince ,Z
Ps, L, and Ps,QI Iseefig. 31 III, \
Shock trap J
//
//
//
/ .._/
//
//
//
Tapor
probe
Ps, A
Ps, B
Ps, C
Ps, D
Ps, E
Ps, F
Ps, G
PS,H
Ps,I
Ps, J
PS,L
Ps, Q
PsD8 I Two tapsstraddling Ps H atfour circumferential '
locations; manifolded
__ L"--Forwardbypass
PsD8
Probes at twocircumferentiallocations; manifolded
Ps,Q
Aft bypass
Spike
Figure 6. - Schematic diagram showing locations of static- and total-pressure measuring stations connected to high-response transducers.
179
Airflow
disturbance
Forward bypass --x Aft bypass -x generator 7\ x /\ X / /
-II,.J,t t t
pressuresl I Command signals to
1----1- " inlet servosystemsI I
i l'! Signal- J--_ Digital _ ..... I
J processing J-J interface I1 Ulgllal _ III
I I unit _ equipmentI_ computerJ:_l gh-v IIHi s_eedl', / _r tope/ II_ General-purpose digital system | J I
Figure 7. - Schematic representation of experimental setup in the ]0- by lO-Foot SupersonicWind Tunnel.
180

d:.=,
_o z
E
z
1.0,
.8
.6
.4
.2
.i
0 0
i t
00
I, i,l,I
0 O00 0
0000 00
, I , l,l,I
o
m
].01
.8
.6
.4
.2
-300
li
O Experimental data
Analysis Iref. 28)
- _ oO
I A I ,l,lll t I J
I , I ,I,ILI I I I2 4 6 810 20 40
Frequency, Hz
_a) Shock-sensor output. Experimental
and analytical steady-state gains.2.513 cnV(kg/sec).)
-I00
-_0 --
-_(]0 -
-4_0 --
E
-600 -
-700 --
-800 --
-9_(}
00
00
0
0
0
0
0
0
0
0
I , ,,,,J,l i , j,j,j, 2 4 6 8 lO 20 40 60 80 lO0
Frequency, Hz
(b) Duct static pressure, PsDS. Experimental steady-
state gain, O,IT/ (Nlcm2)l(kg(sec).)
Figure 8. - Inlet signal responses to airflow-disturbance generator at Mach 2. 956 conditions.
181
d
.6 o oo oo
'_ .2 I L I _l,tlJo
-10o
-200
-300
-4OO
-500
D
-- O
2 4 6 8 10 20 40 60 80100
Frequency, Hz
Ic)Throat-exit static pressure, Ps I. Experimentalsteacly-state gain, 0.104 (N/cm2)i'(kg/sec); analy-
tical steady-state gain, 0.066 (N/cm_ikglsec).)
.8 O
_ 0 O0 cO@DE_
z .4
z
ff
g.
-lO0
-'tOO2 4 6 8 10 20 40 60 80100
Frequency, Hz
_d) Diffuser-exit static pressure, Ps Q. Experimental
steady-state gain, 0.060 IN/cm21/(k_sec);. analyt cal
steady-state gain, 0.644 iN/cm2_likg/sec).)
Figure 8. - Concluded.
182

• . _ i . DPR J , command
_J-_ J Sch_o,_l _? _ ControllerI
_°re,_:_,,on_-_Figure9. - Schematic ofYF-12 aircraftinletcontrolsystem.
183
Z
.o"
E
Z
1 I
.8
.6
.4
,2
.I.0_
.06
0
0 0 0O
[3
0 0
_ o o Open-loop responseo Closed-loop response
-- m
n
00
- I I I IIl{l[ I I I Illlll I I I llll_l
(a) Duct static pressure PsD8. Stea6y-state gain, 0.093 (NIcm2)/(kglsec).
1.8
.6
.4
.2--
.i•08
.D4.i
0
-- _ []
---- O O n
D
[]
D
0
I i ijlJl_] I J I ll_l_l I I I_l_ll].2 .4 .6 .8 1 2 4 6 810 20 40 60 80100
Frequency, Hz
{b} Terminal shock position. Steady-stategain, 1.91 cm]lkg/sec)
Figure 10. - Frequency responsesof two inlet signals to airflow-disturbance gen-erator, at Mach 2. 474conditions, with and withoutthe duct-pressure-ratiocontrol systemof the aircraft.
184
Ill _ ii_l!ll ]
!iiIII
, r r]li
il,,[711] I
17I ilIilili!i_llii I̧ !![Hi:filli
I!ii/_il;II:,i,Ii _
I111;I]]111iii ¸¸
:. I!:1:l_'i!i ii] i!'] I!
I :]i l!!lil ;I ili
(-1
E _ S
:__ ___
i:: E
iiiil"bl _
ir
IIBII
'-'- .i
o
,..., ?:g -o
!d-
E
o
§
N
g
185
-_2_I I I i__ _ i l _120 5cmZ:L L :
_: _;::_-_-_ "_::'_,_-_--T_:- ": ' _: | i I I
Air flow-distu rbance-generator area
Opening _ I,:_-_-_M_:
_ IL_I_ l-_r;_ -_:
/ _IFK _-I 1:i_:_:_
Shock position
High l:_i :_ _:I _11 I _I_ I I I I I__
K:_t_f:l t _ I f • t t I t f I I I t t I I t t t It t" : ft:I I ] t | t
LowHIIJIIMI! I,:L,,,,, , IIIIIIIIIIStatic pressure downstream of throat, Ps, I
Figure 12, - Closed--Iooo transient responses of the YF-12 aircraft duct-pressure-ratio
control system at reduced gain to the airflow-disturbance generator at Mach 2. 474conditions.
_:t:]:t::t t f ! t! _ t tJ:f t:t t
{_ IIIIIl-I
186
Opening
Closing
o o,og ]lJlLFIIiiI)IIIt I f.f TI t_FA (_t:t ') g_ t Ft_
Aft-bypass area
Forward-bypass area
Upstreamf f i i i i i i I I i_ t. :t I:l I _:r_:-
Shock position
Hight t i ! _ ! I i_ i _ I i I t t-t_-i -t _=I _i:H_±_!_:_:_ _
Static pressure downstream of throat, Ps, I
Figure ]3. - Closed-loop transient responses of the YF-12 aircraft duct-pressure-ratio control sys-
tem at reduced gain to an aft-bypass disturbance at Mach 2. 474 conditions.
187
Feedback signal is either -_ _
throat-exit static pressure, t (
(Ps ')°r shock position_'" I I _-
_a) TyPe'-I control.
Feedback signal is either -_ _
throat-exit static pressure _.'1 I
(Ps,,) or shock pos____. --._
(bl T_e-[I control.
Feedback signal is throat_ I _ ,.J
_c)Type-IfIcontrol.
exitstaticpressure (Ps,I) _'11, ,__.,.. --..- ----.-I,,
IcllType-IV control.
Figure 14. - Blockdiagrams ofexperimental,2roportional-plus-integral,
shock-position controls for YF-12 aircraft inlet.
188

4 --
2 -
i--.8"-
.6--
.4--
.2 -
.08
.06
.04
.02.l
Analyticaldata
----O-- --
/
Experimental Noise-penaltydata weighting
factor,On
1.0.1.01
I , 1,1,1,1 I L ]2 4 6 8 10 20 4_
Frequency, Hz
Figure 15. - Analytical and experimental closed-loopfrequency responsesof throat-exit staticpressure Ps,I for type-! controller with Ps, I asfeedoacksignal for _erious valuesof noise-penalty weightingfactor Qn"Mach 2. 956conditions.
189

z 1
_- .4Ee_
o.1
• 08
.06
.04.2
Noise-penalty Controller
weighting proportional-plus-
factor, integral filter
Qn function,H
1.0 29_s1128) + 1]/S
• i 54[(S/54) + l]/s
.01 99_S/34) + l]/s
I
.4 .6 .8 1 2 4 6 8 lO 20
Frequency, Hz
Figure 16. - Experimental closed-loop frequency responses of
throat-exit static pressure Ps, I for various va!ues ofnoise-penalty weighting factor Qn showing effect of non-
IJnearJty. Type-I control system• Mach 2.956conditions.
I4O
190
1 --
.8
<_ .6-
.4
.2
E
N .1
.1
Experi- Controller Controller reset variable
mental proportional-plus-
control integral filter
type function,H
I 90[(sl41) + 1]/s None
II 46[(s119) + 1]/s None
Ill _)_(sI4D+ l]/s Aft-bypassdoor
IV 90[Is/4l) + ]]/s Slowed-down disturbance-
generator door
co Original shock-position control of YF-12 aircraft
,'/2' "_J,
I , I,l,l,I i , I,l,l,I I , I.2 .4 .6 .8 1 2 4 6 8 10 20 40
Frequency, Hz
Figure ]7. - Comparison of shock-position frequency responses of experimental
controls with response of original shock control of YF-]2 aircraft. Throat-exit
static pressure Ps, I used as feedback signal for experimental controls, and
duct static pressure PsD8 used as feedback for shock control of aircraft.
Noise-penalty weighting factor Qn for experimental controls was 0.1.Airflow-disturbance generator used as disturbance. Mach 2. 956 conditions.
191

L¢__c___IDI_ _4_y___._7__, ___ _, , _ . - _ :. !_: " _- i._
• i_- ! t _1_: _ _-_=_--7_-_- _-IL F_-_T I:_ _:_ T _-_l_q_l_
(,losing _t ! I i ! t _ l= _ t/_:_-l-_ _-_ i_,_p_ _-_I-L_ _--_--]-_'_t
A)r flo_--disturbance-generator area
f_',_-._. _ .... _--_I _:_ I=;T_T_: _-- ___
I
__:i: - ...
Closing t t l:i f¢:t I- i_i t I t l:-t I_: t I t-t t::t i:ur=t=t=_t: t _ttt: _={_-_t__z_:4_t
Forward-bypass area
Closing
Opening -- -_-_ - I I I I i=I: :--__ := ":_-
Aft-bypass area
IL _.tlll-_lj" Lf _,_ .I, _ ib..J,.t_,{,.J =L 2,., i ,a. i Ii_;._t -_.;{-i_ _ i_t__]i=J_I_li- ml-r'l ]
Ill I't l'i t I 1 } I t t'l'l l _ I t t { t I I l t I ] l t tq I_J PI It titbit
___ I | I t t l I t t t , t t f 1 t t t t_t _,Upstream i i I I I I I I I i I I I i i I _={ l t:l
Shock position
High i{ I i I I" I I i 1 s_. ii 1f It tI I! 111t r! 1l 11I[ :f_" !-_r-tl}!i' lt_tll,, __....-.-...cmZitt:-i_ :t:_1-_:___t_-_t-;l_-t._:! _
/ t i I I t I I I { { f t t t f I t t t I I tl t l._ { l=tlt t t t==It,t:=ti__
]_ I" f'i t't t=t I "l _ t t t f t t-t I ,t _ I tI _t=4.i:t I | f t t:;t_;_:I t f t _Wi=l
{ | I | | I f t t t t I t t I t t t f 1 f I ttl t [ i t | I t I t I- I t I t t t:t'_=F_t__1 t t-I 11 t f l f t I t i t] | I I i" : I l } lt4 _-lCt
Low I III tit I I t Itt <1 tllit 11t I IllIlll Ill l-,,,,_t _H
Throat-exit static pressure, Ps, I
Figure 18. - Transient responses of type-lit experimental shock-pesilion c_ntroI. Controller
proportional-plus-integral filter function H was 90. 4[(s/40. 8) + l]/s. Mach 2. _ conditions.
192


![,];yhkpaj; jkpo; ,yf;fpaq;fspy; jkpo; ,yf;fpaq;fspd; nry;thf;F](https://img.pdfslide.net/doc/110x75/61d15799147c9e66fd0cd8fb/yhkpaj-jkpo-yffpaqfspy-jkpo-yffpaqfspd-nrythff.jpg)

![-. @f ]dk Yf](https://img.pdfslide.net/doc/110x75/5b077e5b7f8b9a5c308e6ddb/-f-dk-yf-m-mkl-zd-ciml250xcomciml250xcomarchivemarxengelsgermanengelsbriefeanaugustaj.jpg)