Embed Size (px)
Citation preview

Wind Tunnel Revitalization Project
Work term 3 Fall 2006
Hossein Nabipour
MUN # 200355337
Mechanical Engineering

Wind Tunnel Revitalization Project Fall 2006
1
Wind Tunnel Revitalization Project
Introduction
This project aims to fully put the wind tunnel of Memorial University back into service
which requires equipping the tunnel with its old force balance and flow visualization
equipment. The major part of the project will be the calibration and modernization of the
force balance for force and moment measurements on the test model. The balance will be
equipped with a data acquisition system and a computer to monitor and analyze the test
results simultaneously. Also there will be some flow measurements across the test section
and finally the smoke generator needs to be prepared and installed in the tunnel.
Acknowledgements
This project was completed on the wind tunnel of Memorial University under the
guidance of Dr. Stephen Bruneau and with the help of the data acquisition technician,
Tom Pike as well as with the cooperation of the lab manager, Darryl Pike. Thank you!

Wind Tunnel Revitalization Project Fall 2006
2
Table of contents
1- Pyramidal Force Balance ……………………………………………………...…….4
Introduction………………………………………………………………………….4
Force and moment concepts…………………………………………….....6
Components and load cells configuration.............................................…...7
1.1 Dusting and cleaning……………………………………...…………………….8
1.2 Collecting information on its physical and mechanical structure……...……….8
1.3 Providing a data acquisition system to replace the old electronic one……...….9
1.4 Testing all the six load cells for functionality…………………………..……...9
1.5 Preparing and erecting a calibration rig in the test section …………….……..10
1.6 Installing the balance under the tunnel……….……………………………….11
1.7 Calibration…………………………...……………..………………………….12
Introduction…………………………………………………...………….12
Configuring the NI Measurement & Automation Explorer……………...13
2- Smoke Generator…………………………………………………...…………….…21
Connecting and sealing the missing fluid transfer lines………………………...…21
Appendix A.......................................................................................................................23
Lift and side force calibration data points.
Appendix B………………………………………………………………...……………25
Flow control mechanism
Appendix C…………………………………………………………….………………..26

Wind Tunnel Revitalization Project Fall 2006
3
Smoke generator’s manual
Appendix D……………………………………………………………………...………32
Vane anemometer’s manual

Wind Tunnel Revitalization Project Fall 2006
4
1- Pyramidal Force Balance
Introduction
Quote from: http://www.nasatech.com/Briefs/Oct03/LAR16020.html
“…A force balance is a complex structural spring element instrumented with strain
gauges for measuring three orthogonal components of aerodynamic force (normal, axial,
and side force) and three orthogonal components of aerodynamic torque (rolling,
pitching, and yawing moments). Force balances remain as the state-of-the-art instrument
that provides these measurements on a scale model of an aircraft during wind tunnel
testing. Ideally, each electrical channel of the balance would respond only to its
respective component of load, and it would have no response to other components of
load. This is not entirely possible even though balance designs are optimized to minimize
these undesirable interaction effects. Ultimately, a calibration experiment is performed to
obtain the necessary data to generate a mathematical model and determine the force
measurement accuracy.”
There is an external 6 component pyramidal balance manufactured by Aerolab in the
wind tunnel which is capable of measuring all the forces and moments on the test model.
It is equipped with 6 load cells for Measuring:
1- Drag: The force Parallel to the wind flow and to the tunnel’s walls
2- Lift: Upward/Downward force normal to Drag and Side force
3- Side force: Applied to the sides of the test model and normal to Drag and Lift
Wind Tunnel Revitalization Project Fall 2006
5
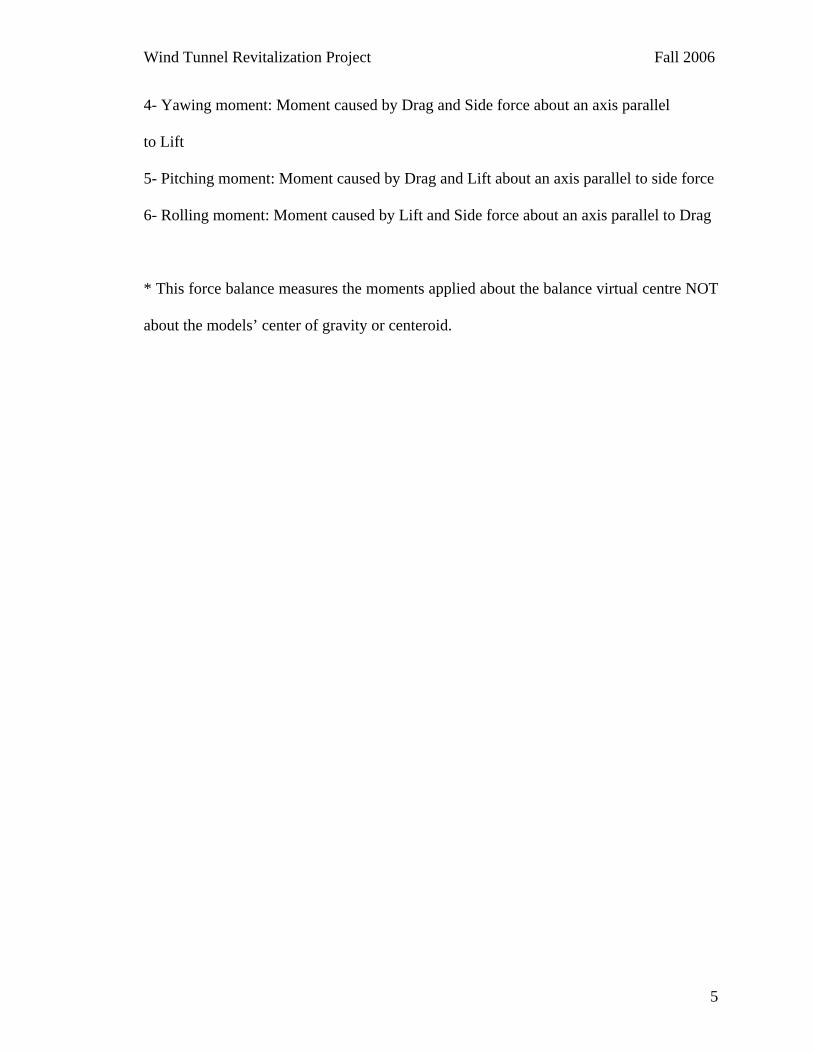
4- Yawing moment: Moment caused by Drag and Side force about an axis parallel
to Lift
5- Pitching moment: Moment caused by Drag and Lift about an axis parallel to side force
6- Rolling moment: Moment caused by Lift and Side force about an axis parallel to Drag
* This force balance measures the moments applied about the balance virtual centre NOT
about the models’ center of gravity or centeroid.

Wind Tunnel Revitalization Project Fall 2006
6
Force and moment concepts
Figure 1
Figure 2

Wind Tunnel Revitalization Project Fall 2006
7
Components and load cells configuration Figure 3
Figure 4

Wind Tunnel Revitalization Project Fall 2006
8
1.1 Dusting and cleaning
The balance seemed to have not been used for a long time and as a result it was dusted
and dirty. I dusted and cleaned it thoroughly with cleaners and ensured that all the joints
are clear of any dust or dirt as they would adversely affect the performance and precision
of the balance. Extreme care was taken in handling the balance.
1.2 Collecting information on its physical and mechanical structure
Since there was no manufacturer’s manual or any brochures available on the balance, I
searched the web and looked up pages containing any information on it. There are a few
websites which have some information on this type of balance which I found very
helpful. Also the text book: Low-speed wind tunnel testing / Jewel B. Barlow, William H.
Rae, Alan Pope, 3rd edition 1999 available at the QEII library is very helpful. There are
some Aerodynamics books which are helpful too when studying the wind tunnel. The
Aerolab webpage has very little info on their products and as I inquired, a hard copy of
the manual would cost us $110 USD to order, which we did not. The manufacturer also
has a new National Instrument’s DAQ software and hardware as well as the LabView for
upgrading the balance.
As you see in Figure 3 and figure 4, there is a point called “Balance virtual center” at
which all four inclined struts meet. This is the point about which all the three moments
are measured. The structure of the balance needs to be sturdy and rigid to dampen any

Wind Tunnel Revitalization Project Fall 2006
9
vibrations created during the testing; therefore it is quite heavy and needs at least to
persons to handle it. The rods, beams, and joints used in the balance are flexure types
which are designed to transfer forces and moments with minimal friction and to avoid
“hysteresis effect” in the system. The hysteresis effect would lower the accuracy of the
readings from the load cells.
1.3 Providing a data acquisition system to replace the old electronic one
The electronic part of the balance, which has become obsolete, was a box containing all
those small electronic parts plus a few analog meters with knobs and switches on both the
front and the back panels. We upgraded the balance with a NI signal conditioning board
(SC- 2043) and a NI DAQmx PCI 6024E board with an external 10V DC power supply.
The DAQ system requires a fast computer to process all the data read from the 6 load
cells, unfortunately all the PC’s available in the lab were slow and could not support the
DAQ system. We got a 1700 MHz Pentium 4 that can process this vast amount of data
read from the balance. It took us about a week to configure and debug the NI DAQ
system.
1.4 Testing all six load cells for functionality
There was a little doubt as to whether or not the balance was still functional, therefore we
tested all load cells for functionality by sending an excitation voltage to them and
observing the response while pushing or pulling on the respected one. All 6 were

Wind Tunnel Revitalization Project Fall 2006
10
responding good, however, we were not sure about their accuracy, so I erected a
temporary calibration apparatus with a few pulleys and some strings to test them by
applying some known loads and observing the responses and it turned out all 6 were
working.
1.5 Preparing and erecting a calibration rig in the test section
We needed a rigid structure to mount the pulleys on and to hang loads of up to 25 lbs
during the calibrations process. So I came up with the following structure (figure 5) and
with some modifications we could have a rigid rig. The rig needs to be aligned with the
tunnel’s side walls and balanced as well.

Wind Tunnel Revitalization Project Fall 2006
11
Figure 5
1-6 Installing the balance under the tunnel
The calibration has to be very precise and accurate; accordingly we installed the balance
underneath the tunnel right at the test section. As for the external balances, it is strongly
recommended that the calibration be completed with the balance in place. This would
ensure the alignment of the balance with the tunnel and consequently having more
accurate results, therefore the balance must be aligned and balanced horizontally at all
times.

Wind Tunnel Revitalization Project Fall 2006
12
1.7 Calibration
Introduction
Calibration is simply applying some known loads to a load cell and recording the voltage
responses from it, by doing so, we can get a linear curve of the response voltage versus
applied load from the data points (this could be conveniently done in Microsoft Excel).
The plot’s equation can then be used for determining any unknown loads by just knowing
the response voltage from the load cell.
Quote from page 258 of the book: Low-speed wind tunnel testing / Jewel B. Barlow,
William H. Rae, Alan Pope, 3rd edition 1999
“… Let us start by making clear the immensity of a wind tunnel balance calibration: with
a competent crew the first calibration of a new balance will take three months at least.
This time frame supposes that adequate shop facilities for all sorts of changes are
available and recognizes that the first “calibration” will almost inevitably involve many
adjustments. Many balances have, however, subsequently served very well for decades
with modest additional calibration efforts.”
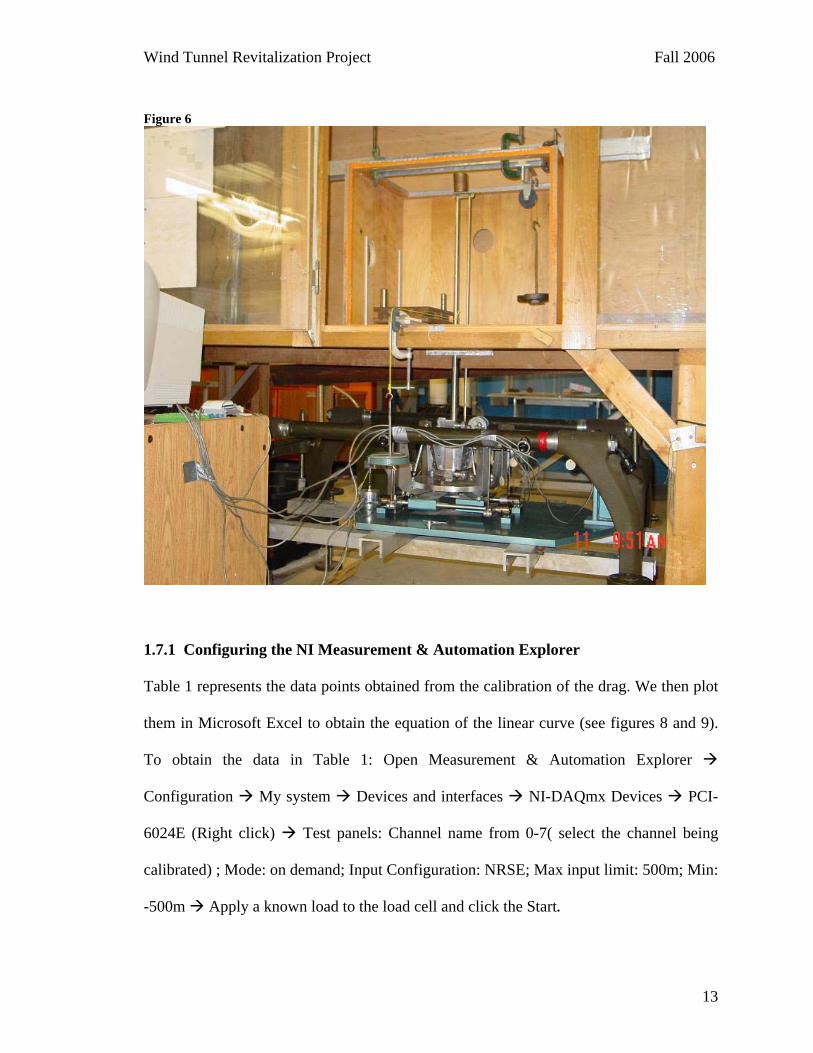
Figure 6 shows the balance and the calibration rig in the tunnel.
Wind Tunnel Revitalization Project Fall 2006
13
Figure 6
1.7.1 Configuring the NI Measurement & Automation Explorer
Table 1 represents the data points obtained from the calibration of the drag. We then plot
them in Microsoft Excel to obtain the equation of the linear curve (see figures 8 and 9).
To obtain the data in Table 1: Open Measurement & Automation Explorer
Configuration My system Devices and interfaces NI-DAQmx Devices PCI-
6024E (Right click) Test panels: Channel name from 0-7( select the channel being
calibrated) ; Mode: on demand; Input Configuration: NRSE; Max input limit: 500m; Min:
-500m Apply a known load to the load cell and click the Start.

Wind Tunnel Revitalization Project Fall 2006
14
Figure 7
The reading ‘Value’ from figure 7 is the response voltage from the load cell which is
proportionate to the applied known load. Repeat this procedure to have a set of data
points like those of the Table 1.

Wind Tunnel Revitalization Project Fall 2006
15
Table 1
Calibration of Drag Applied load (lb) Response voltage (V) Applied load (N)
0 0.000244 0.00 0.44 0.000977 1.96
0.878 0.00195 3.91 1.316 0.00269 5.86 1.754 0.00366 7.81 2.192 0.00439 9.77 2.648 0.00537 11.80 0.444 0.000977 1.98 2.652 0.00537 11.81 4.866 0.00977 21.68 5.444 0.0107 24.25 7.652 0.0152 34.09 9.866 0.0195 43.95
10.444 0.021 46.53 10.882 0.0215 48.48
11.32 0.0226 50.43 11.759 0.0234 52.39 12.198 0.0243 54.34 14.406 0.0287 64.18 15.444 0.0308 68.80
Figure 8
Calibration of Drag y = 2563.7x - 0.1567
R2 = 0.9999
0.0010.0020.0030.0040.0050.0060.0070.0080.00
0 0.005 0.01 0.015 0.02 0.025 0.03 0.035Response voltage (V)
App
lied
load
(N)

Wind Tunnel Revitalization Project Fall 2006
16
Figure 9
Calibration of Drag y = 504.76x - 0.0574R2 = 0.9999
05
10
1520
0 0.005 0.01 0.015 0.02 0.025 0.03 0.035Response voltage (V)
App
lied
load
(lb)
The equations obtained form figure 7 and 8 are then used in the NI Measurement &
Automation Explorer to create a scale for the respected load cell (see figure 10).
Figure 10

Wind Tunnel Revitalization Project Fall 2006
17
In the VI Logger Task My VI Logger task 1 Task Attributes Acquisitions
settings NI-DAQmx Task Name Create new Analog input Voltage
Choose a Channel ( channels are from 0 -7 on the SC-2043 board).
Figure 11
After that, in the VI Logger Task Task Attributes Acquisitions settings NI-
DAQmx Task Name Edit task Voltage Input Setup Settings Input Range (
-100 to +100 for a typical force in newtons). Terminal Configuration NRSE and the
Custom scaling Choose the desired scale Save task. Refer to figure 12 and figure
13.

Wind Tunnel Revitalization Project Fall 2006
18
Figure 12
Figure 13

Wind Tunnel Revitalization Project Fall 2006
19
Back to: VI Logger Task My VI Logger task 1 Real Time Data Run task (wait a
few seconds). See figure 14.
Figure 14
To configure and make changes to the display screen, simply right click on the graph
properties Display Settings Apply OK. See figure 15.

Wind Tunnel Revitalization Project Fall 2006
20
Figure 15
*Note: During testing it is observed that there are some noises interfering with the
readings, making them to fluctuate rapidly and as a result errors appear in readings. Since
the response voltage is very small then that small amount is multiplied by a large number
(i.e. 2500) to be converted to force in pounds or newtons, a small amount of noise or
unwanted fluctuations would convert into a significant amount of error in readings.
Therefore, the user should take the average of the data as a stable reading is impossible to
obtain. To eliminate this problem, one solution could be refurbishing the balance with a
new set of load cells which would cost at least $3000.

Wind Tunnel Revitalization Project Fall 2006
21
2- Smoke Generator
In the Aerolab smoke generator, the smoke-producing fluid (paraffin oil) is forced
through an electrical heater which turns the liquid into vapour or ‘smoke’. The device is
hooked up to the air pressure as well as to a power supply. The air pressure can be
adjusted by turning a screw located on top of the air tank to regulate the pressure. An
operating pressure of about 40-50 psi is recommended by the manufacturer.
Connecting and sealing the missing fluid transfer lines
After dusting and cleaning the device, I provided the device with two fluid lines which
were missing, a 12 m long hose for air and a 1.5 m small diameter tubing for the fluid
transfer line.
How to operate
1- Open the main air pressure valve
2- Adjust the pressure to 40-50 psi
3- Open the fluid valve (located on the fluid reservoir) until fluid starts dripping
from the tip of the smoke probe
4- Turn the power switch to 2 or 3 (3 for normal operation, see Appendix C)
5- Turn the power on
6- Make necessary adjustments to increase or decrease the fluid flow
7- To safely shut the machine down, ensure power is turned off first, then the fluid.
8- Shut the main air pressure valve off
*During testing, wear protective gloves as the probe tends to get too hot.

Wind Tunnel Revitalization Project Fall 2006
22
Figure 16 and 17 show the flow visualization on the test model using the smoke
generator.
Figure 16
Figure 17
Wind Tunnel Revitalization Project Fall 2006
23
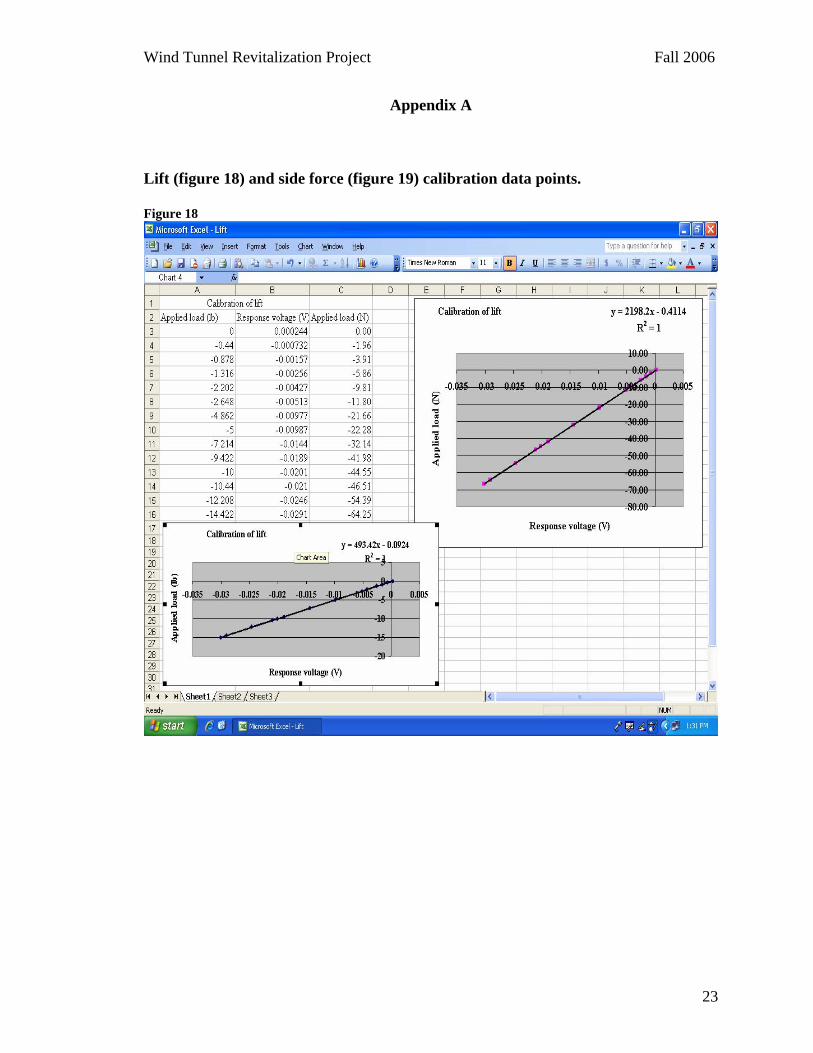
Appendix A
Lift (figure 18) and side force (figure 19) calibration data points.
Figure 18

Wind Tunnel Revitalization Project Fall 2006
24
Figure 19

Wind Tunnel Revitalization Project Fall 2006
25
Appendix B
Flow control mechanism

Wind Tunnel Revitalization Project Fall 2006
26
Appendix C
Smoke generator’s manual

Wind Tunnel Revitalization Project Fall 2006
27

Wind Tunnel Revitalization Project Fall 2006
28

Wind Tunnel Revitalization Project Fall 2006
29

Wind Tunnel Revitalization Project Fall 2006
30

Wind Tunnel Revitalization Project Fall 2006
31

Wind Tunnel Revitalization Project Fall 2006
32
Appendix D
Vane anemometer’s manual

Wind Tunnel Revitalization Project Fall 2006
33

Wind Tunnel Revitalization Project Fall 2006
34


![BC Environmental Assessment Revitalization...BC Environmental Assessment Revitalization REVIEW OF REVITALIZATION DISCUSSION PAPER TERRITORIAL STEWARDSHIP DEPARTMENT, JULY 2018 “[IT]](https://img.pdfslide.net/doc/110x75/5f0f98117e708231d444ef9e/bc-environmental-assessment-revitalization-bc-environmental-assessment-revitalization.jpg)