Embed Size (px)
Citation preview
1
Wind tunnel tests of a non-typical stadium roof
G. Bosak1, A. Flaga
1, R. Kłaput
1 and Ł. Flaga
1
1Wind Engineering Laboratory, Cracow University of Technology, 31-864 Cracow, Poland.
Abstract
The paper summarizes results of wind tunnel tests of a non-typical stadium roof. Aerodynamic
laboratory studies were accomplished in a boundary layer wind tunnel. The main objective of the
research was referred to the three topics: 1. Determination of mean wind net pressure coefficient
distribution on the stadium surface roof; 2. Determination of envelopes of local wind pressure;
3.Recognizing of the stadium playing field ventilation phenomenon. Results of the research were used
in designing of the stadium roof.
1 Description of the structure
There were the three reasons in support of an aerodynamic analysis of the stadium roof structure.
Firstly, the stadium roof was open in the north-west direction (comp. Fig.1). Unfortunately, in the
considered geographical region of the structure built-side the strong winds appear from these
directions. Secondly, the large oval sport-event hall was placed in the nearest surroundings of the
structure (comp. Fig.1b). It could be effective of the significant influences of an aerodynamic
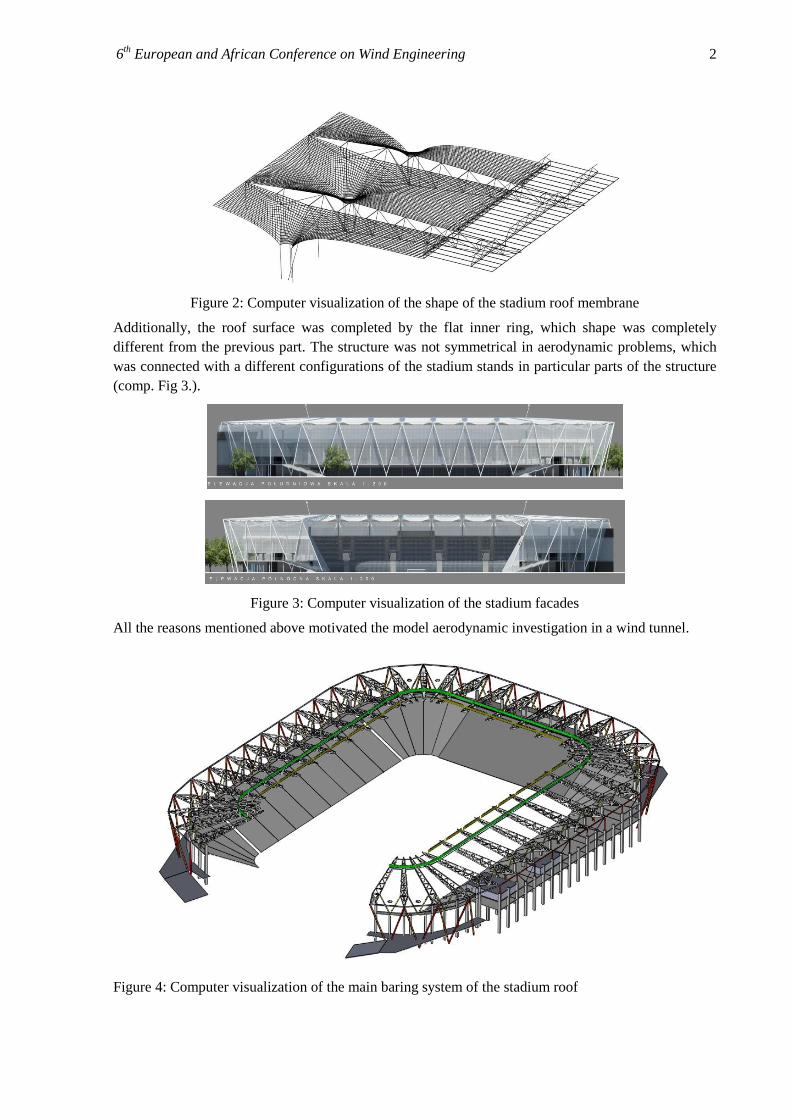
interference on the wind action on the stadium roof. Finally, the shape of the roof membrane was
similar to a funnel (comp. Fig.2), which could cause the complex wind pressure distribution on the
roof surfaces and as a result difficulty to predict of the wind action distributions on the main bearing
steel frames (comp. Fig 4.).
a)
b)
Figure 1: Computer visualization: a) of the stadium, b) of the stadium with the nearest surroundings
6th European and African Conference on Wind Engineering 2
Figure 2: Computer visualization of the shape of the stadium roof membrane
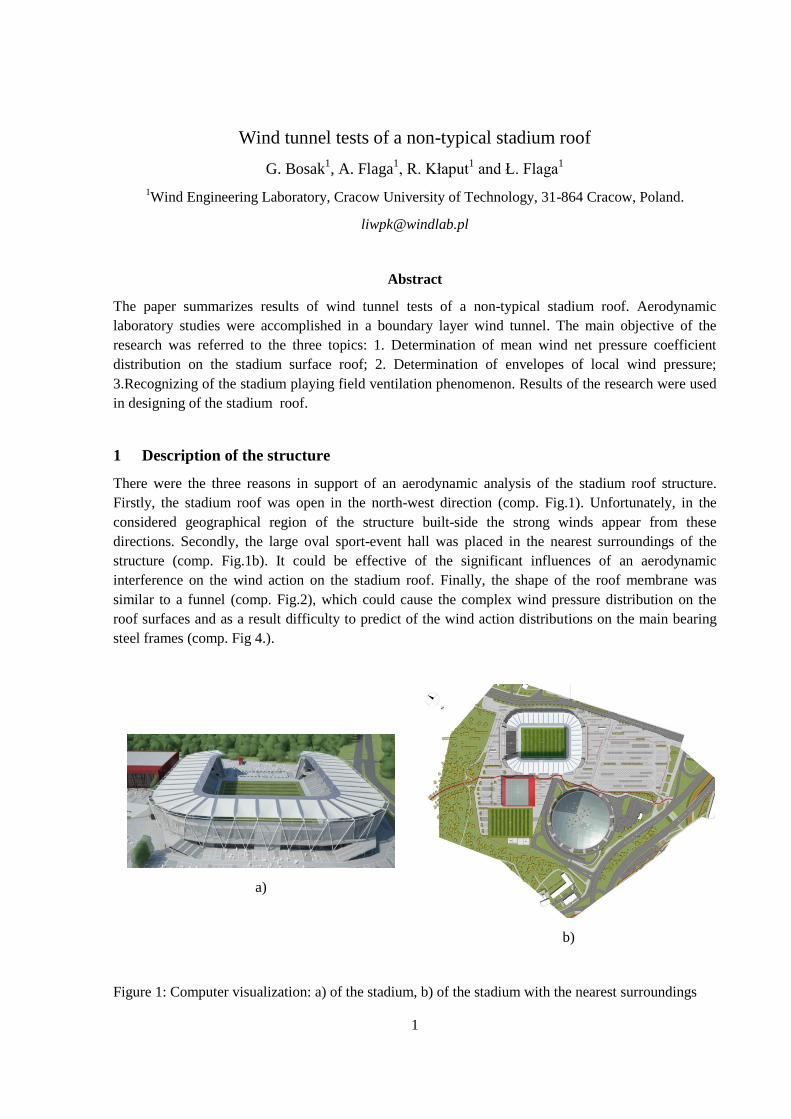
Additionally, the roof surface was completed by the flat inner ring, which shape was completely
different from the previous part. The structure was not symmetrical in aerodynamic problems, which
was connected with a different configurations of the stadium stands in particular parts of the structure
(comp. Fig 3.).
Figure 3: Computer visualization of the stadium facades
All the reasons mentioned above motivated the model aerodynamic investigation in a wind tunnel.
Figure 4: Computer visualization of the main baring system of the stadium roof
6th European and African Conference on Wind Engineering 3
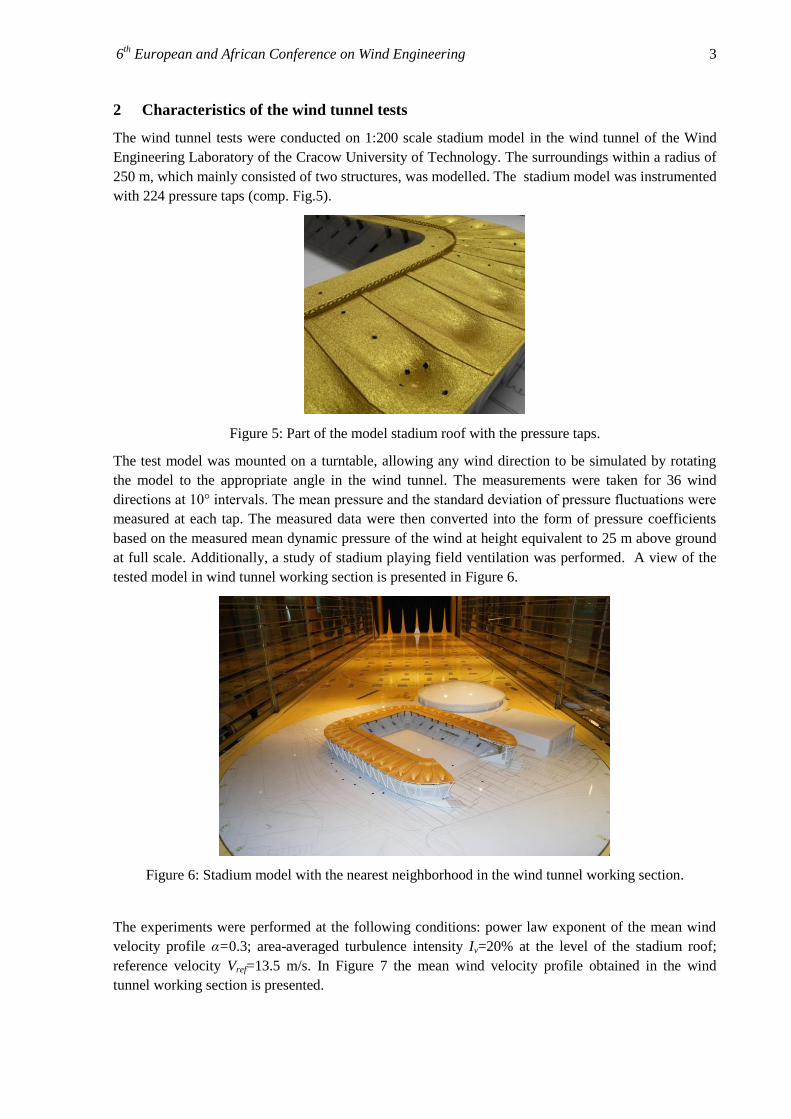
2 Characteristics of the wind tunnel tests
The wind tunnel tests were conducted on 1:200 scale stadium model in the wind tunnel of the Wind
Engineering Laboratory of the Cracow University of Technology. The surroundings within a radius of
250 m, which mainly consisted of two structures, was modelled. The stadium model was instrumented
with 224 pressure taps (comp. Fig.5).
Figure 5: Part of the model stadium roof with the pressure taps.
The test model was mounted on a turntable, allowing any wind direction to be simulated by rotating
the model to the appropriate angle in the wind tunnel. The measurements were taken for 36 wind
directions at 10° intervals. The mean pressure and the standard deviation of pressure fluctuations were
measured at each tap. The measured data were then converted into the form of pressure coefficients
based on the measured mean dynamic pressure of the wind at height equivalent to 25 m above ground
at full scale. Additionally, a study of stadium playing field ventilation was performed. A view of the
tested model in wind tunnel working section is presented in Figure 6.
Figure 6: Stadium model with the nearest neighborhood in the wind tunnel working section.
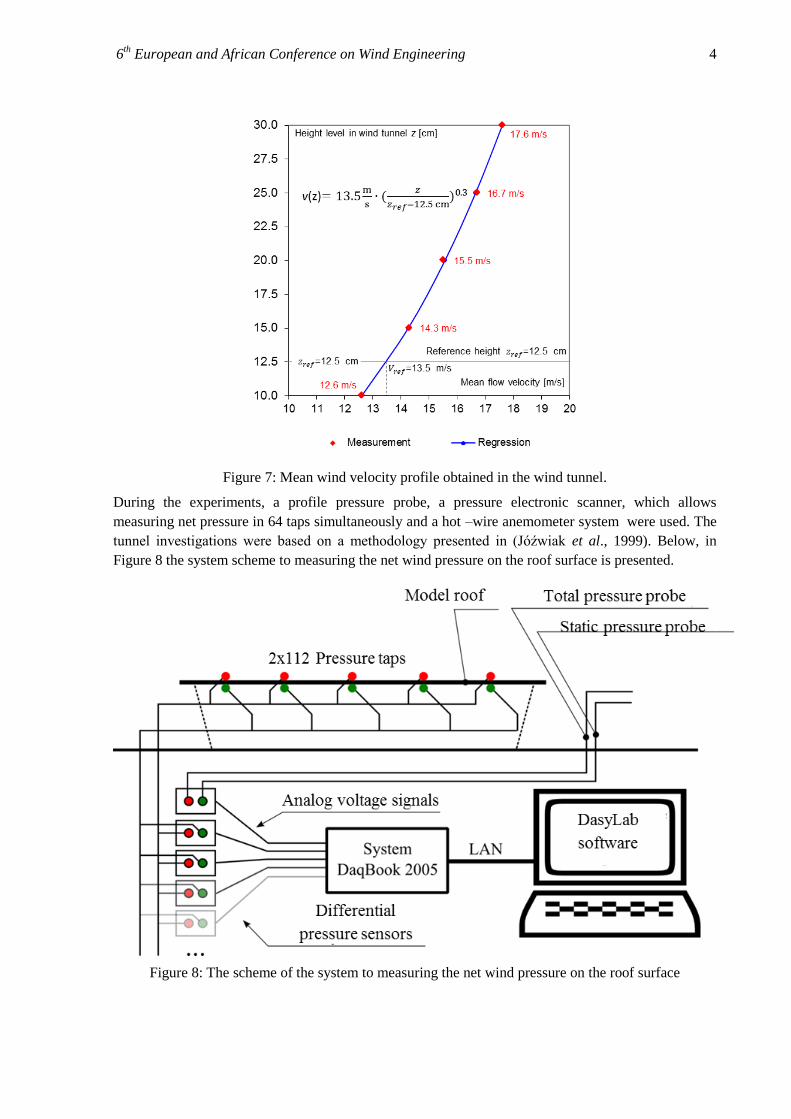
The experiments were performed at the following conditions: power law exponent of the mean wind
velocity profile α=0.3; area-averaged turbulence intensity Iv=20% at the level of the stadium roof;
reference velocity Vref=13.5 m/s. In Figure 7 the mean wind velocity profile obtained in the wind
tunnel working section is presented.
6th European and African Conference on Wind Engineering 4
Figure 7: Mean wind velocity profile obtained in the wind tunnel.
During the experiments, a profile pressure probe, a pressure electronic scanner, which allows
measuring net pressure in 64 taps simultaneously and a hot –wire anemometer system were used. The
tunnel investigations were based on a methodology presented in (Jóźwiak et al., 1999). Below, in
Figure 8 the system scheme to measuring the net wind pressure on the roof surface is presented.
Figure 8: The scheme of the system to measuring the net wind pressure on the roof surface
6th European and African Conference on Wind Engineering 5
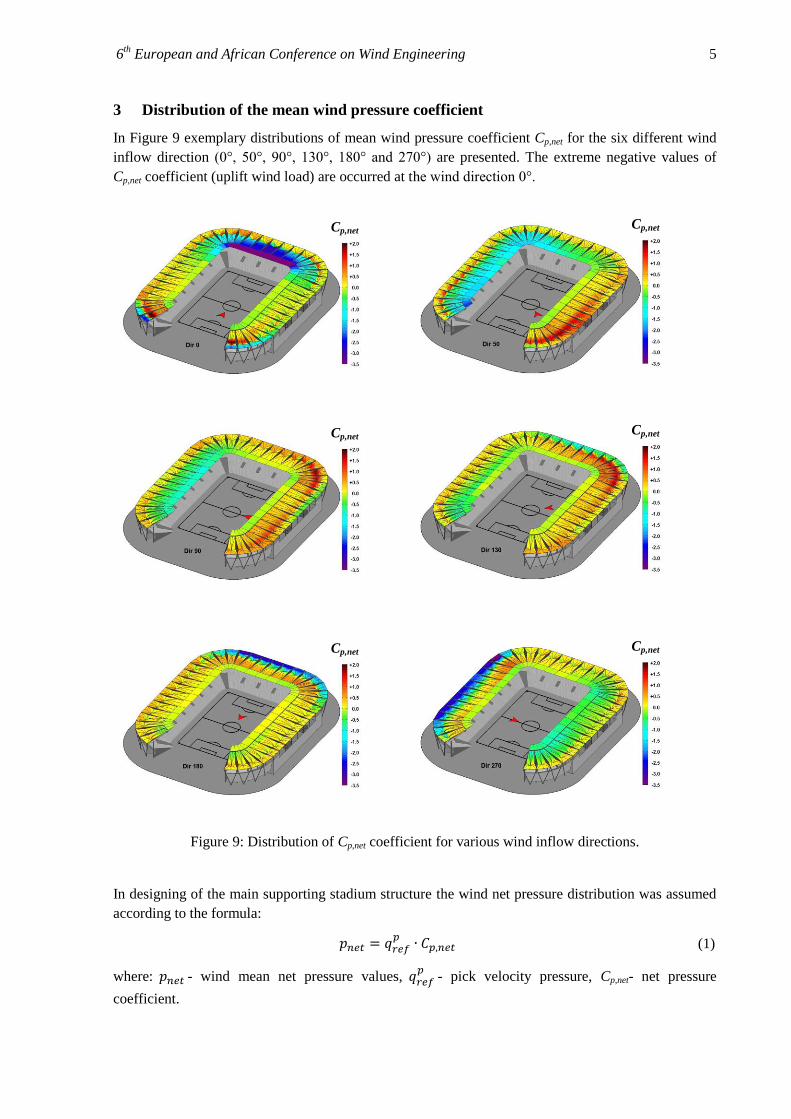
3 Distribution of the mean wind pressure coefficient
In Figure 9 exemplary distributions of mean wind pressure coefficient Cp,net for the six different wind
inflow direction (0°, 50°, 90°, 130°, 180° and 270°) are presented. The extreme negative values of
Cp,net coefficient (uplift wind load) are occurred at the wind direction 0°.
Cp,net
Cp,net
Cp,net
Cp,net
Cp,net
Cp,net
Figure 9: Distribution of Cp,net coefficient for various wind inflow directions.
In designing of the main supporting stadium structure the wind net pressure distribution was assumed
according to the formula:
(1)
where: - wind mean net pressure values,
- pick velocity pressure, Cp,net- net pressure
coefficient.
6th European and African Conference on Wind Engineering 6
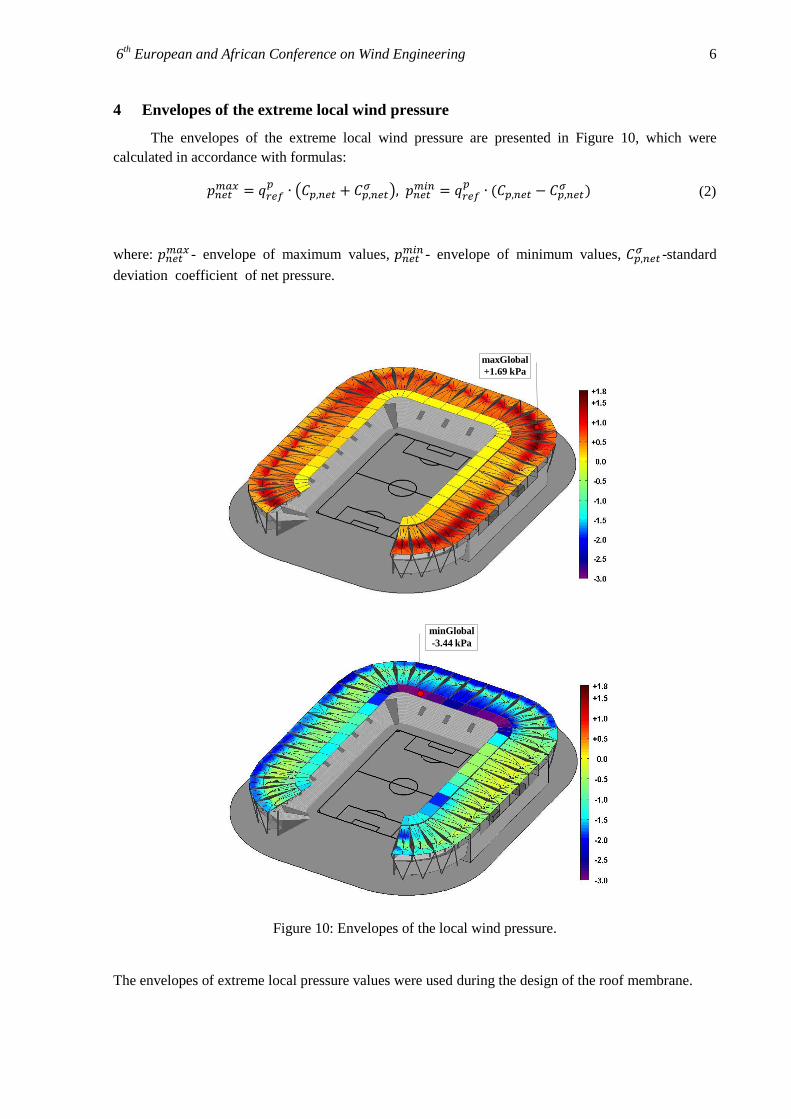
4 Envelopes of the extreme local wind pressure
The envelopes of the extreme local wind pressure are presented in Figure 10, which were
calculated in accordance with formulas:
(
)
(2)
where: - envelope of maximum values,
- envelope of minimum values, -standard
deviation coefficient of net pressure.
maxGlobal
+1.69 kPa
minGlobal
-3.44 kPa
Figure 10: Envelopes of the local wind pressure.
The envelopes of extreme local pressure values were used during the design of the roof membrane.
6th European and African Conference on Wind Engineering 7
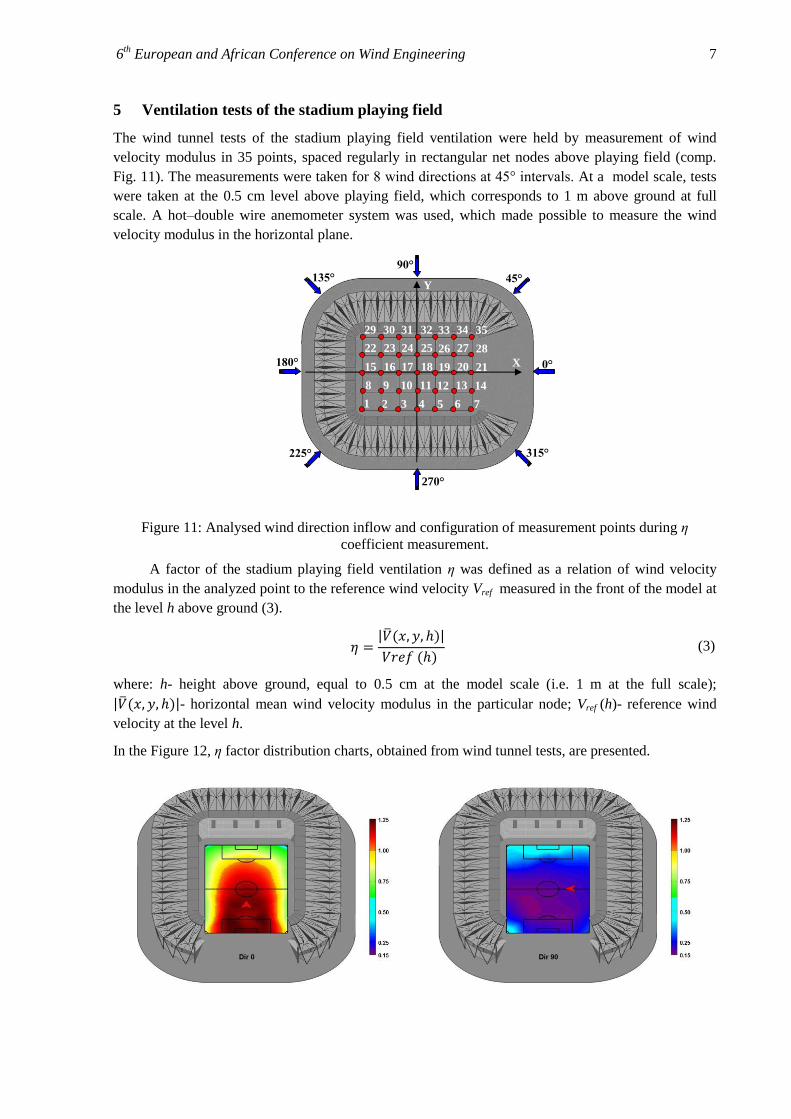
5 Ventilation tests of the stadium playing field
The wind tunnel tests of the stadium playing field ventilation were held by measurement of wind
velocity modulus in 35 points, spaced regularly in rectangular net nodes above playing field (comp.
Fig. 11). The measurements were taken for 8 wind directions at 45° intervals. At a model scale, tests
were taken at the 0.5 cm level above playing field, which corresponds to 1 m above ground at full
scale. A hot–double wire anemometer system was used, which made possible to measure the wind
velocity modulus in the horizontal plane.
1 2 3 4 5 6 7
8 9 10 11 12 13 14
15 16 17 18 19 20 21
22 23 24 25 26 27 28
29 30 31 32 33 34 35
X
Y
0°
45°
90°
135°
180°
225°
270°
315°
Figure 11: Analysed wind direction inflow and configuration of measurement points during η
coefficient measurement.
A factor of the stadium playing field ventilation η was defined as a relation of wind velocity
modulus in the analyzed point to the reference wind velocity Vref measured in the front of the model at
the level h above ground (3).
| ̅ |
(3)
where: h- height above ground, equal to 0.5 cm at the model scale (i.e. 1 m at the full scale);
| ̅ |- horizontal mean wind velocity modulus in the particular node; Vref (h)- reference wind
velocity at the level h.
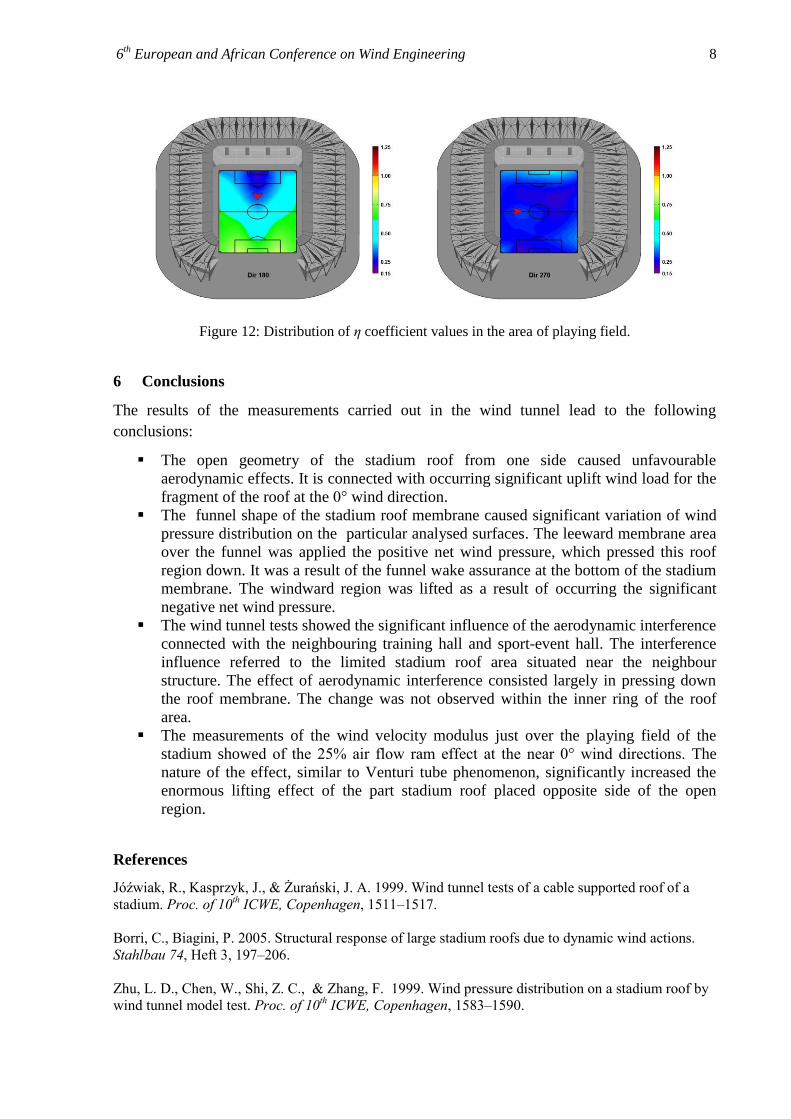
In the Figure 12, η factor distribution charts, obtained from wind tunnel tests, are presented.
6th European and African Conference on Wind Engineering 8
Figure 12: Distribution of η coefficient values in the area of playing field.
6 Conclusions
The results of the measurements carried out in the wind tunnel lead to the following
conclusions:
The open geometry of the stadium roof from one side caused unfavourable
aerodynamic effects. It is connected with occurring significant uplift wind load for the
fragment of the roof at the 0° wind direction.
The funnel shape of the stadium roof membrane caused significant variation of wind
pressure distribution on the particular analysed surfaces. The leeward membrane area
over the funnel was applied the positive net wind pressure, which pressed this roof
region down. It was a result of the funnel wake assurance at the bottom of the stadium
membrane. The windward region was lifted as a result of occurring the significant
negative net wind pressure.
The wind tunnel tests showed the significant influence of the aerodynamic interference
connected with the neighbouring training hall and sport-event hall. The interference
influence referred to the limited stadium roof area situated near the neighbour
structure. The effect of aerodynamic interference consisted largely in pressing down
the roof membrane. The change was not observed within the inner ring of the roof
area.
The measurements of the wind velocity modulus just over the playing field of the
stadium showed of the 25% air flow ram effect at the near 0° wind directions. The
nature of the effect, similar to Venturi tube phenomenon, significantly increased the
enormous lifting effect of the part stadium roof placed opposite side of the open
region.
References
Jóźwiak, R., Kasprzyk, J., & Żurański, J. A. 1999. Wind tunnel tests of a cable supported roof of a
stadium. Proc. of 10th ICWE, Copenhagen, 1511–1517.
Borri, C., Biagini, P. 2005. Structural response of large stadium roofs due to dynamic wind actions.
Stahlbau 74, Heft 3, 197–206.
Zhu, L. D., Chen, W., Shi, Z. C., & Zhang, F. 1999. Wind pressure distribution on a stadium roof by
wind tunnel model test. Proc. of 10th ICWE, Copenhagen, 1583–1590.