Embed Size (px)
Citation preview
NREL is a national laboratory of the U.S. Department of Energy Office of Energy Efficiency and Renewable Energy operated by the Alliance for Sustainable Energy, LLC
Wind Turbine Spacing in Wind Farms and Sound
BLM WEATS Workshop
September 1, 2010
Patrick Moriarty, NREL
National Renewable Energy Laboratory Innovation for Our Energy Future
Why is noise an issue?
Objectionable noise is an impediment to deployment– Complaints by residents threaten permitting– Projects must comply with established community noise
standards (40 – 45 dBA is typical)Noise reduced operation (NRO)
– Energy also lost

National Renewable Energy Laboratory Innovation for Our Energy Future
Sound Pressure LevelMost common noise measurement (in Decibels – dB)
r = observer distanceDoubling distance = -3 dB in SPLDoubling intensity = +3 dB in SPLHuman ear detects around 3 dB change+10 dB = subjective doubling of perceived loudness
Sound Power Level
=
=
refref pp
IISPL 1010 log20log10
21r
I ∝r
p 1∝
=
010log10
WWLW
21010 log (2 )WSPL L rπ≈ −
National Renewable Energy Laboratory Innovation for Our Energy Future
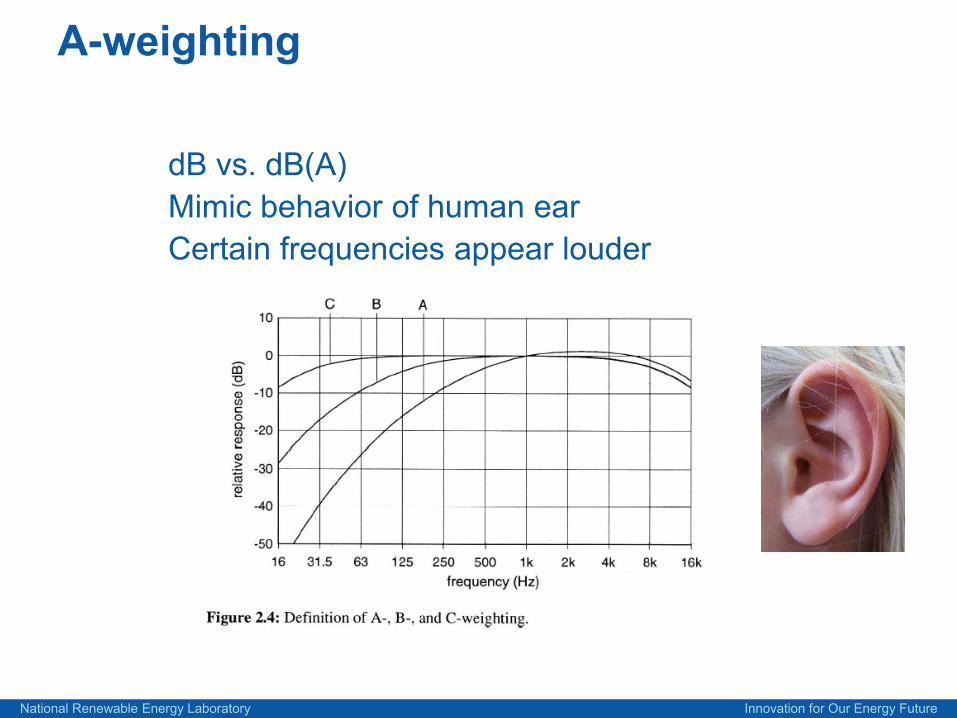
A-weighting
dB vs. dB(A)Mimic behavior of human earCertain frequencies appear louder
National Renewable Energy Laboratory Innovation for Our Energy Future
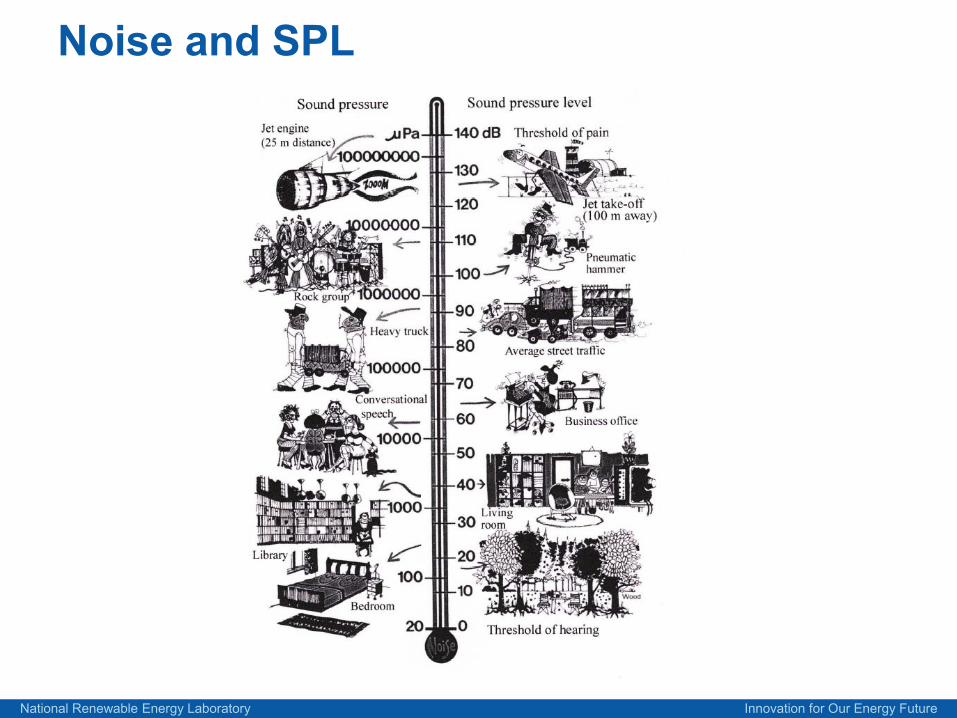
Noise and SPL
National Renewable Energy Laboratory Innovation for Our Energy Future
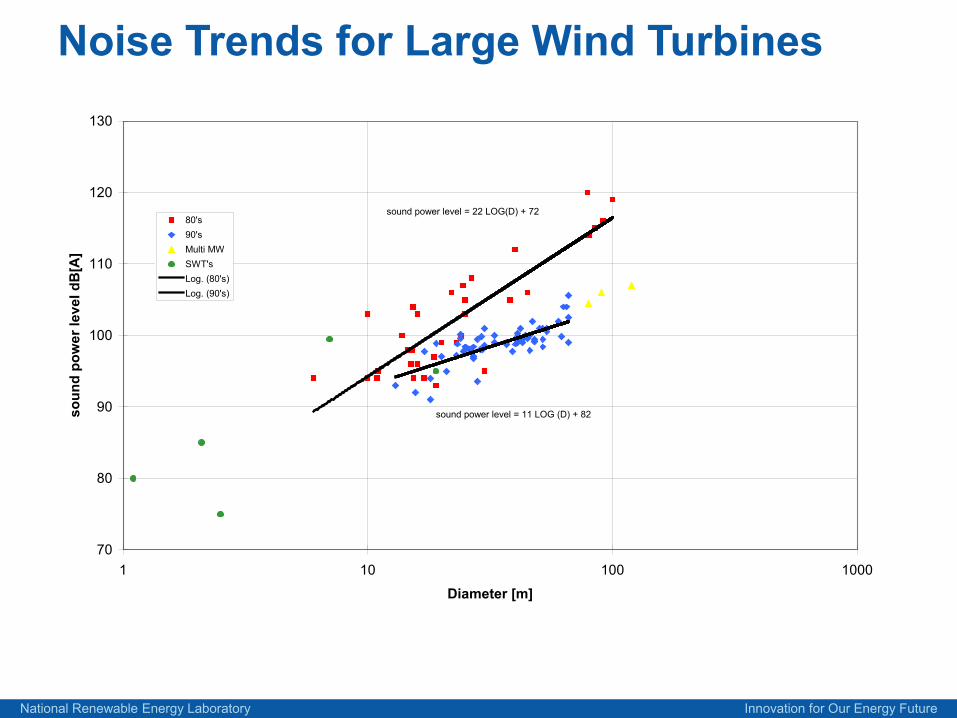
Noise Trends for Large Wind Turbines
sound power level = 22 LOG(D) + 72
sound power level = 11 LOG (D) + 82
70
80
90
100
110
120
130
1 10 100 1000
Diameter [m]
soun
d po
wer
leve
l dB
[A]
80's90'sMulti MWSWT'sLog. (80's)Log. (90's)
National Renewable Energy Laboratory Innovation for Our Energy Future
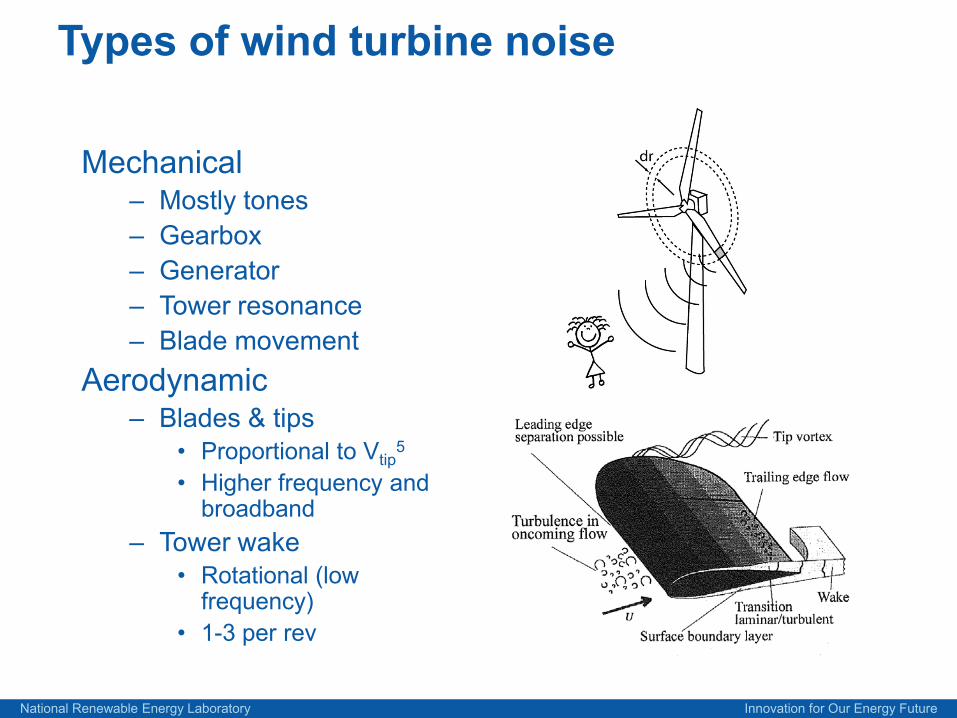
Types of wind turbine noise
Mechanical– Mostly tones– Gearbox– Generator– Tower resonance– Blade movement
Aerodynamic– Blades & tips
• Proportional to Vtip5
• Higher frequency and broadband
– Tower wake• Rotational (low
frequency)• 1-3 per rev
National Renewable Energy Laboratory Innovation for Our Energy Future
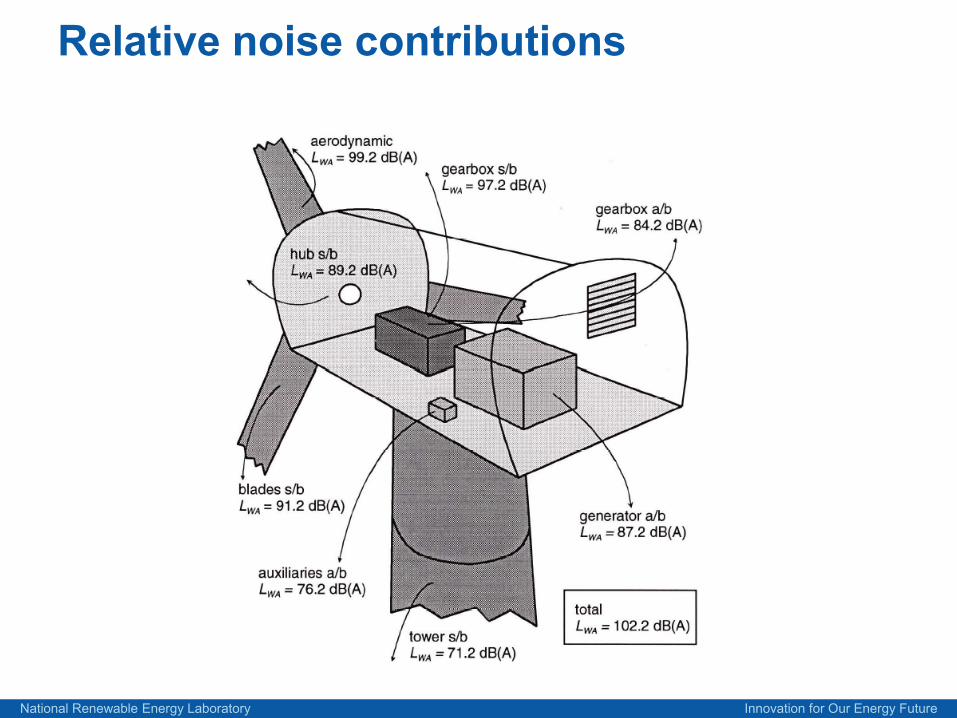
Relative noise contributions
National Renewable Energy Laboratory Innovation for Our Energy Future
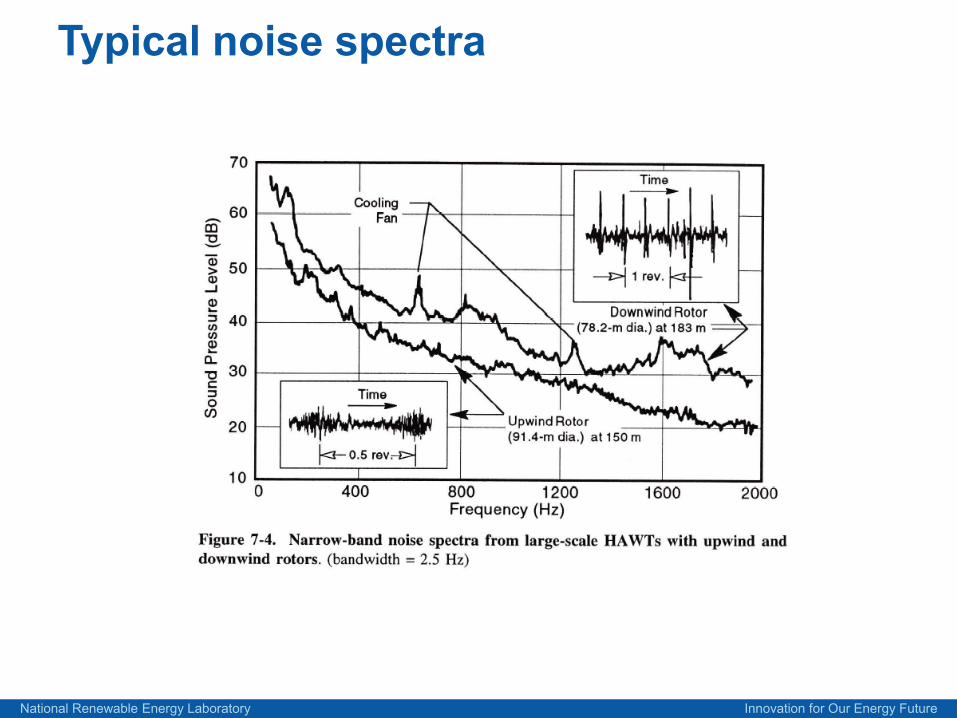
Typical noise spectra
National Renewable Energy Laboratory Innovation for Our Energy Future
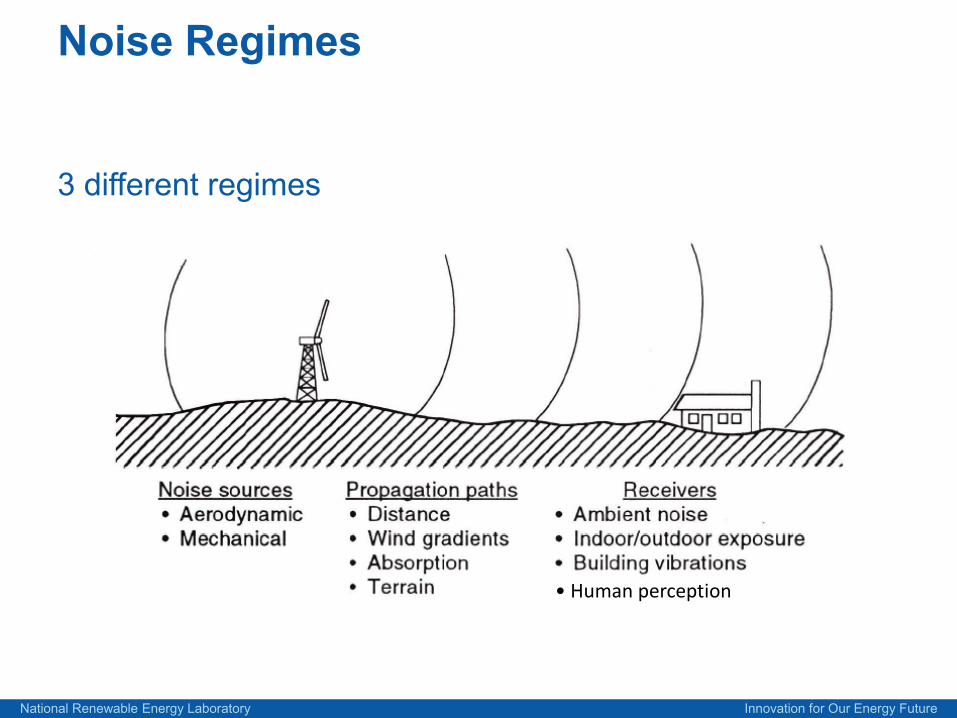
Noise Regimes
3 different regimes
• Human perception
National Renewable Energy Laboratory Innovation for Our Energy Future
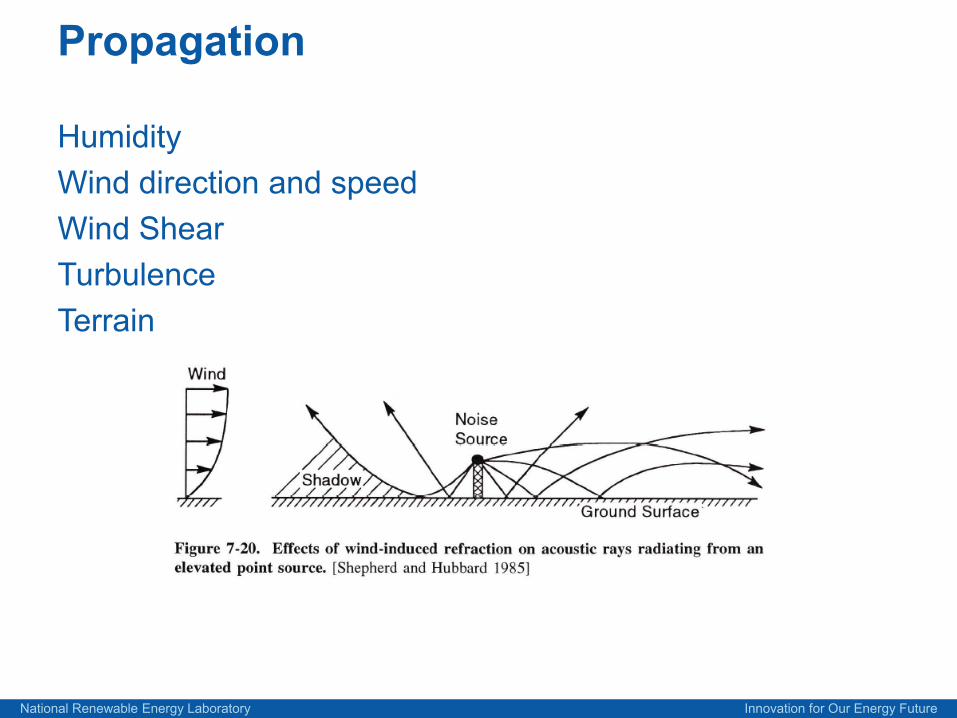
Propagation
HumidityWind direction and speedWind ShearTurbulenceTerrain
National Renewable Energy Laboratory Innovation for Our Energy Future
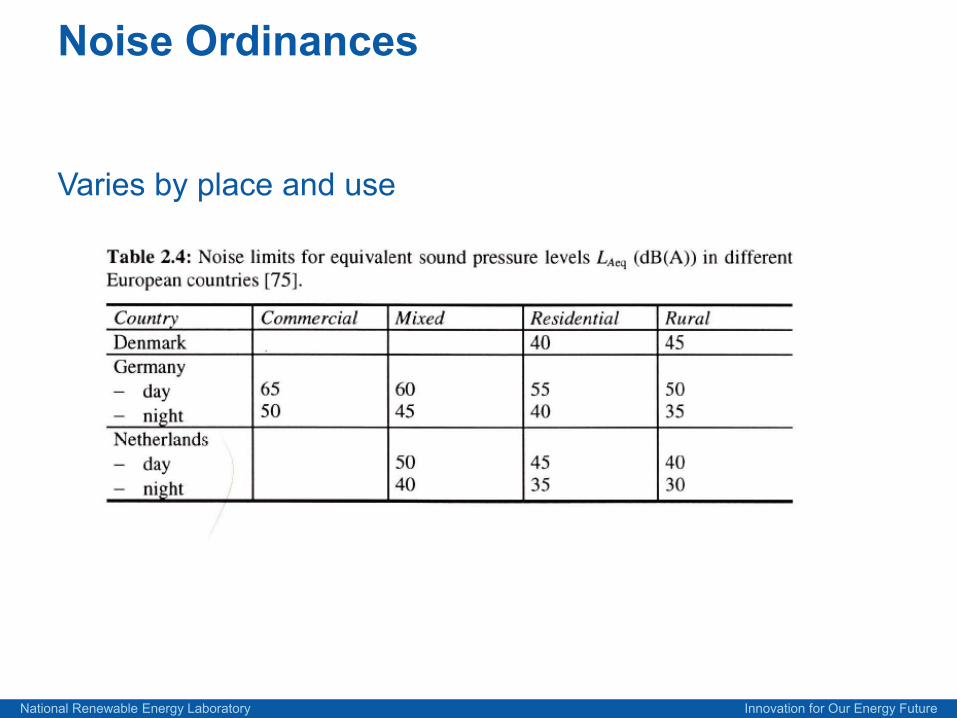
Noise Ordinances
Varies by place and use
National Renewable Energy Laboratory Innovation for Our Energy Future
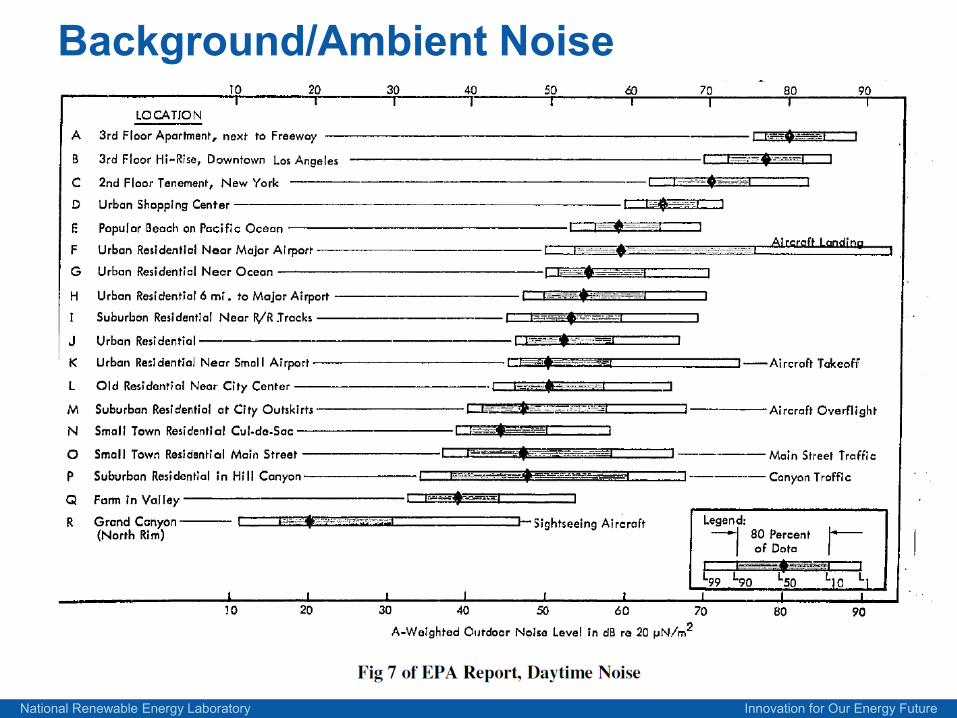
Background/Ambient Noise
National Renewable Energy Laboratory Innovation for Our Energy Future
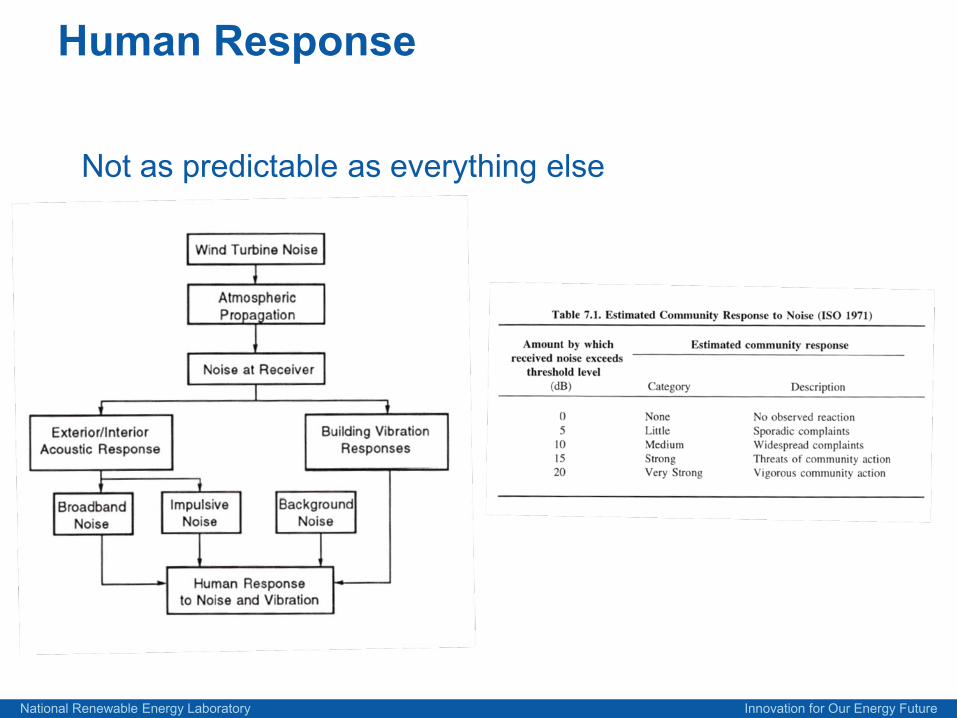
Human Response
Not as predictable as everything else
National Renewable Energy Laboratory Innovation for Our Energy Future
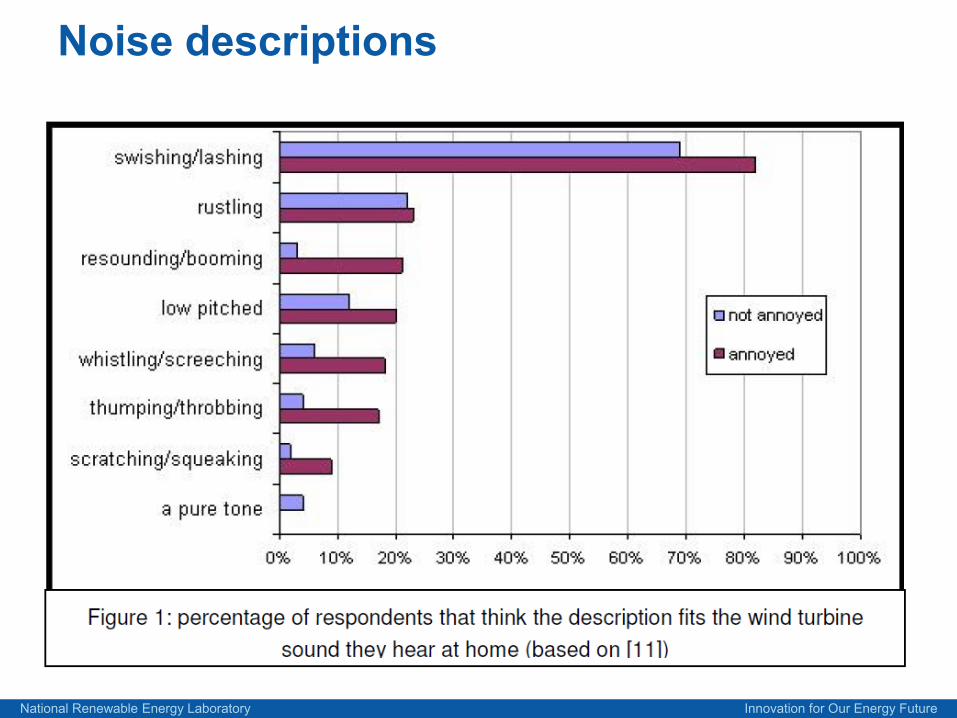
Noise descriptions
National Renewable Energy Laboratory Innovation for Our Energy Future
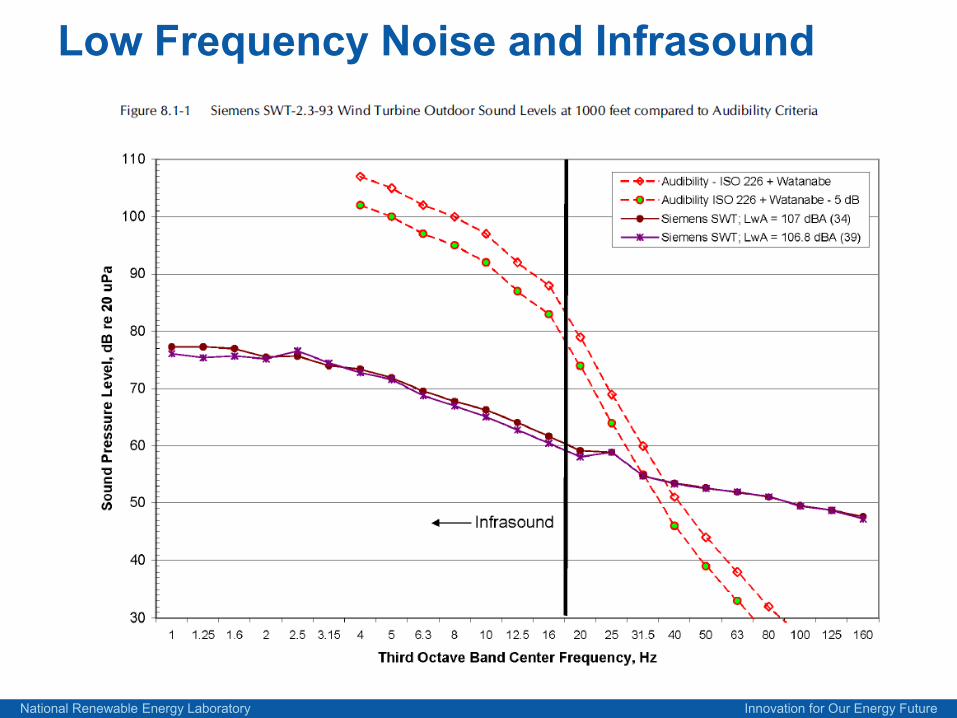
Low Frequency Noise and Infrasound
National Renewable Energy Laboratory Innovation for Our Energy Future
Noise reduction
Move turbines farther away– Offshore– Low frequencies travel farther
Mechanical– Isolation– Insulation
Aerodynamic– Lower tip speed (Noise Reduced Operation)– Modify Blade Shape
• Sharp trailing edges
National Renewable Energy Laboratory Innovation for Our Energy Future
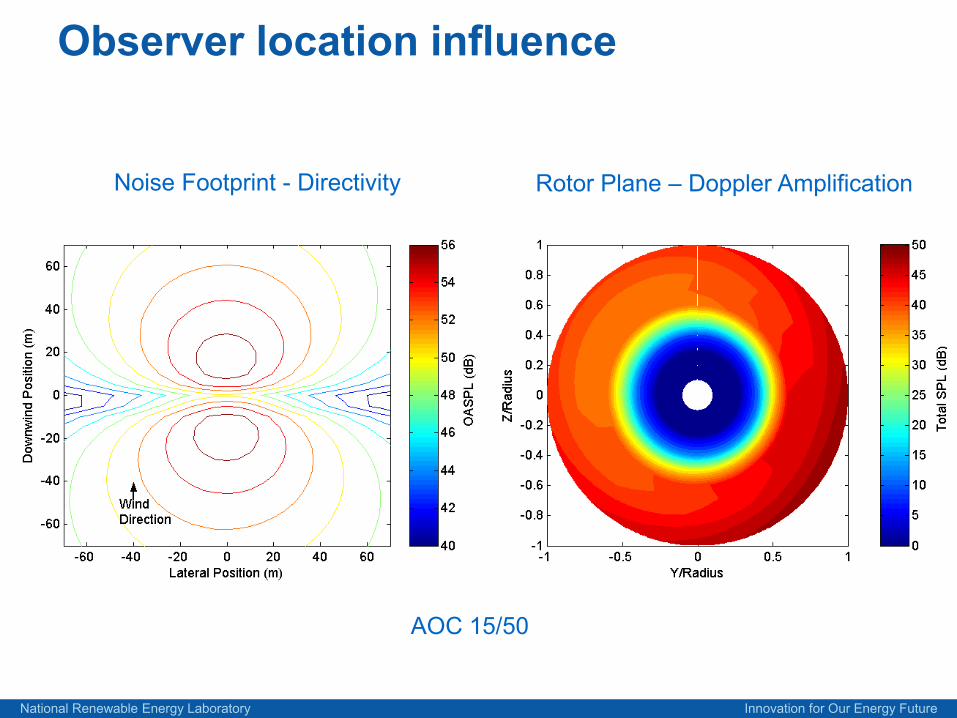
Observer location influence
Noise Footprint - Directivity Rotor Plane – Doppler Amplification
AOC 15/50

National Renewable Energy Laboratory Innovation for Our Energy Future
Wind Plant Noise Footprint
National Renewable Energy Laboratory Innovation for Our Energy Future
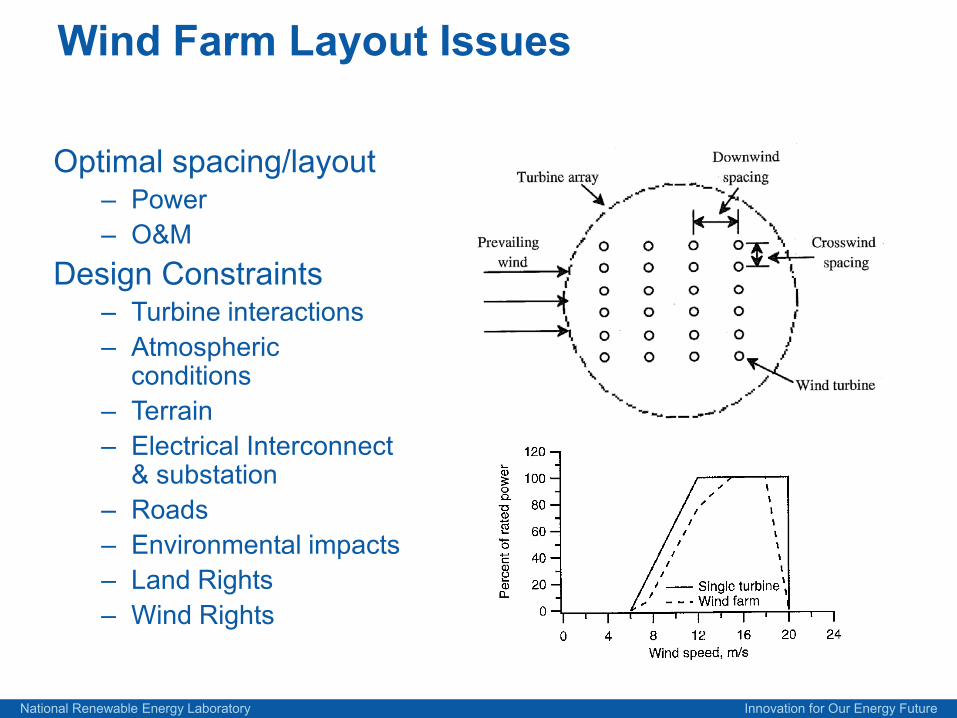
Wind Farm Layout Issues
Optimal spacing/layout– Power– O&M
Design Constraints– Turbine interactions– Atmospheric
conditions– Terrain– Electrical Interconnect
& substation– Roads– Environmental impacts– Land Rights– Wind Rights

National Renewable Energy Laboratory Innovation for Our Energy Future
Why is layout design important?
Optimal power production– Example
• 200 - 2 MW wind turbines• 1.26 x 10⁹ kWh/year (36% capacity factor)• 5 ¢/kWh• 1% change in efficiency OR• ~0.1 m/s change in annual wind speed • = $630k/year = $12.6 million/farm lifetime
– 10% underproduction for existing farms is common ($$!)
O&M costsNear-term forecasting
– Pricing– Load matching

National Renewable Energy Laboratory Innovation for Our Energy Future
Wind Farm Wakes
National Renewable Energy Laboratory Innovation for Our Energy Future
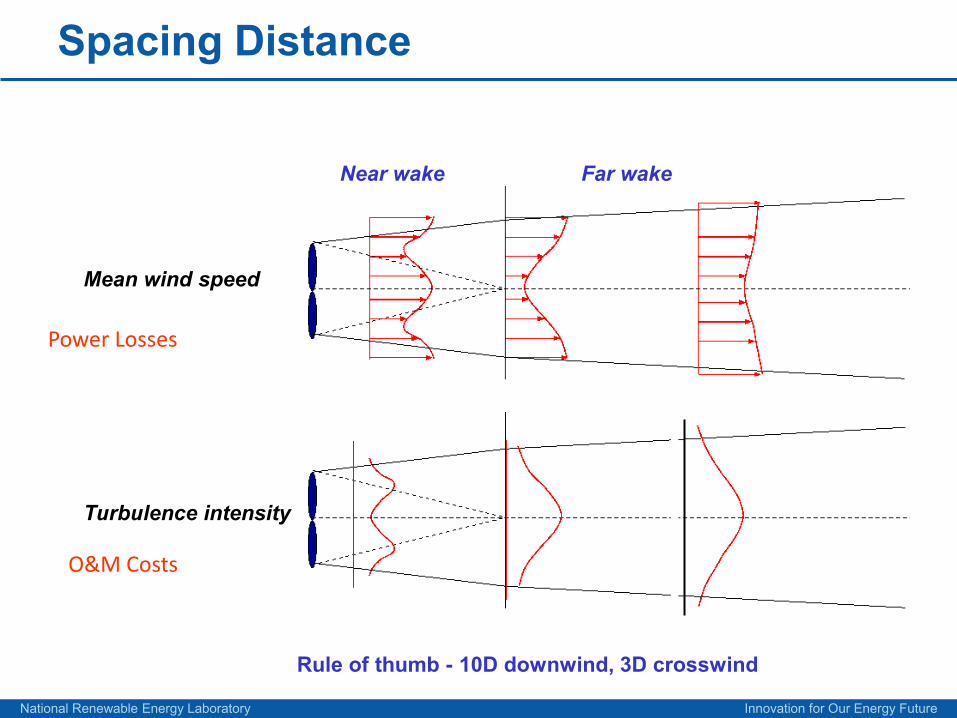
Spacing Distance
Mean wind speed
Turbulence intensity
Near wake Far wake
Power Losses
O&M Costs
Rule of thumb - 10D downwind, 3D crosswind
National Renewable Energy Laboratory Innovation for Our Energy Future
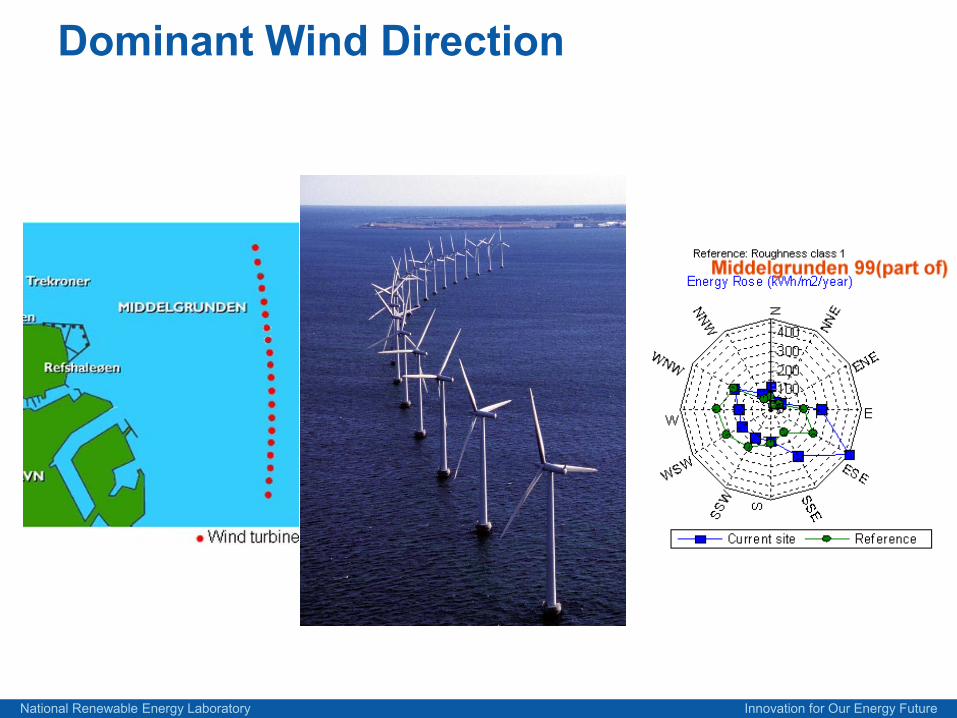
Dominant Wind Direction
National Renewable Energy Laboratory Innovation for Our Energy Future
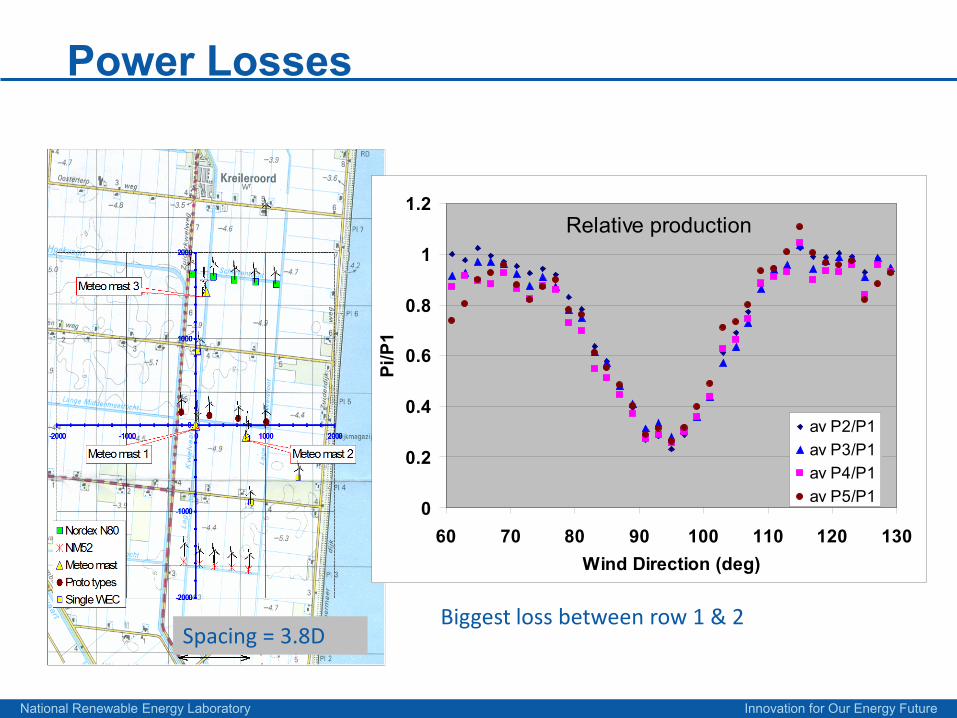
Power Losses
Relative production
0
0.2
0.4
0.6
0.8
1
1.2
60 70 80 90 100 110 120 130Wind Direction (deg)
Pi/P
1
av P2/P1av P3/P1av P4/P1av P5/P1
Spacing = 3.8DBiggest loss between row 1 & 2
National Renewable Energy Laboratory Innovation for Our Energy Future
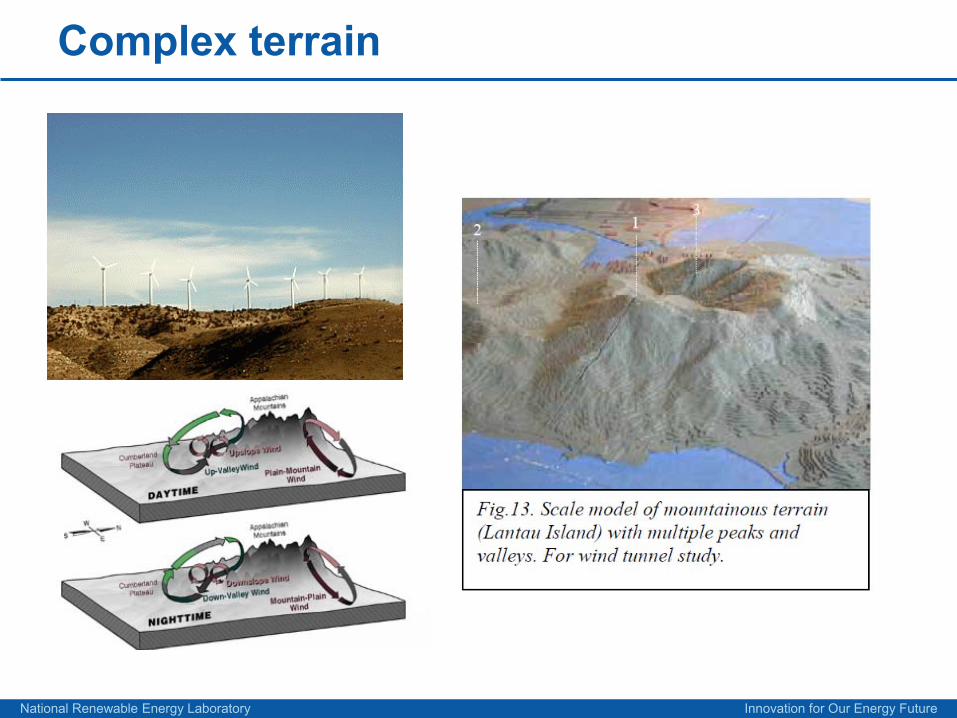
Complex terrain
National Renewable Energy Laboratory Innovation for Our Energy Future
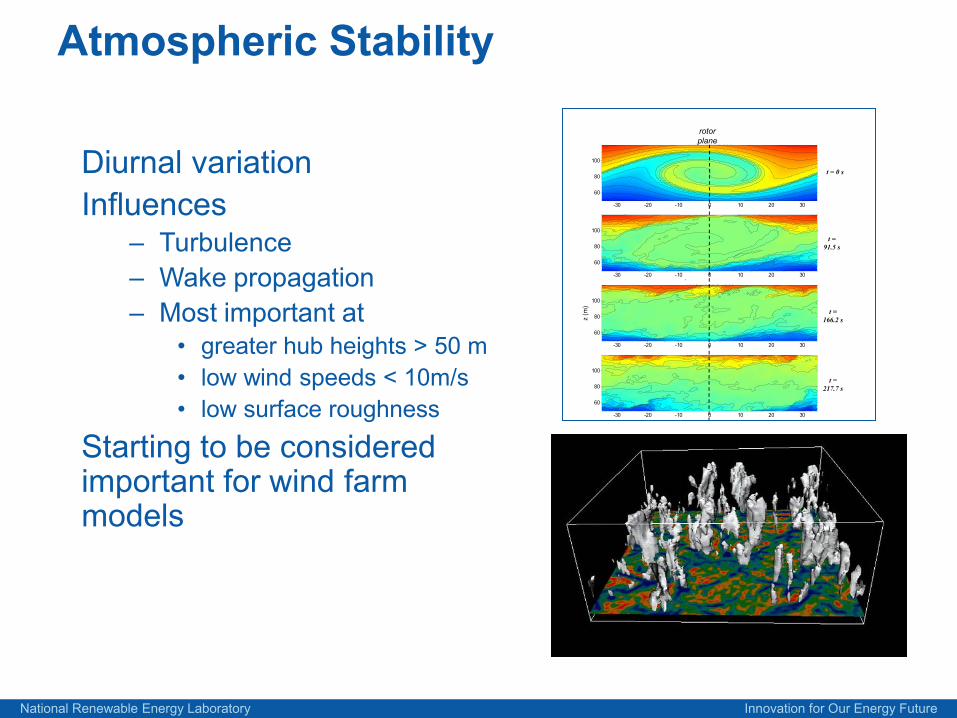
Atmospheric Stability
Diurnal variationInfluences
– Turbulence– Wake propagation– Most important at
• greater hub heights > 50 m• low wind speeds < 10m/s• low surface roughness
Starting to be considered important for wind farm models
-30 -20 -10 0 10 20 30
Time Record 566
60
80
100
-30 -20 -10 0 10 20 30
Time Record 2500
60
80
100
-30 -20 -10 0 10 20 30
Time Record 4000
60
80
100
z (m
)
-30 -20 -10 0 10 20 30
Time Record 5000
60
80
100
Ti R d 6000
t = 0 s
t = 91.5 s
t = 166.2 s
t = 217.7 s
rotorplane
National Renewable Energy Laboratory Innovation for Our Energy Future
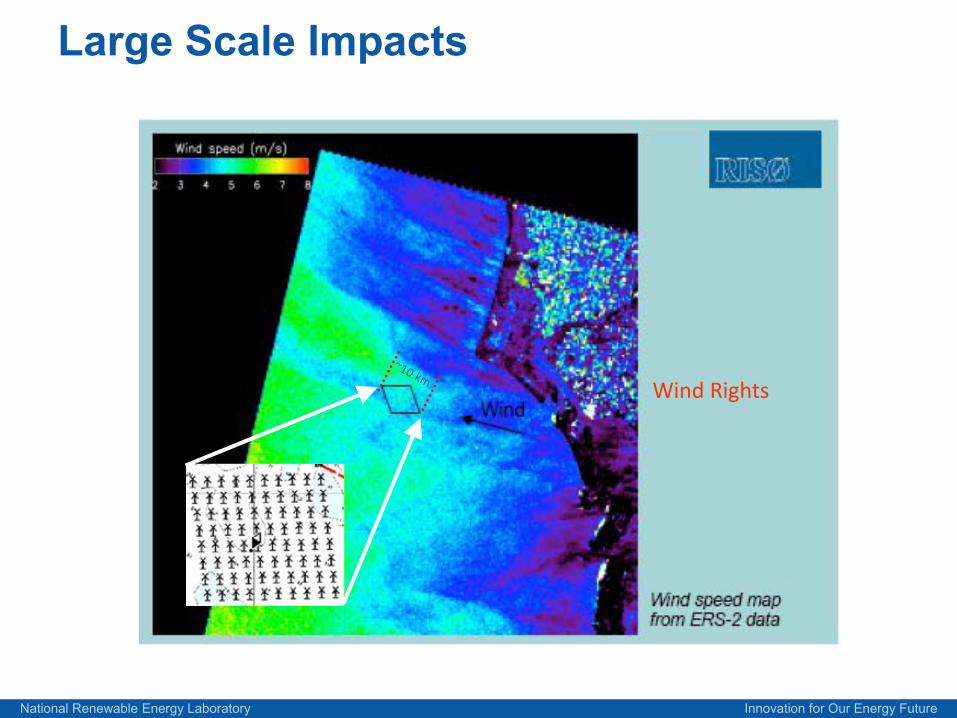
Large Scale Impacts
Wind Rights
National Renewable Energy Laboratory Innovation for Our Energy Future
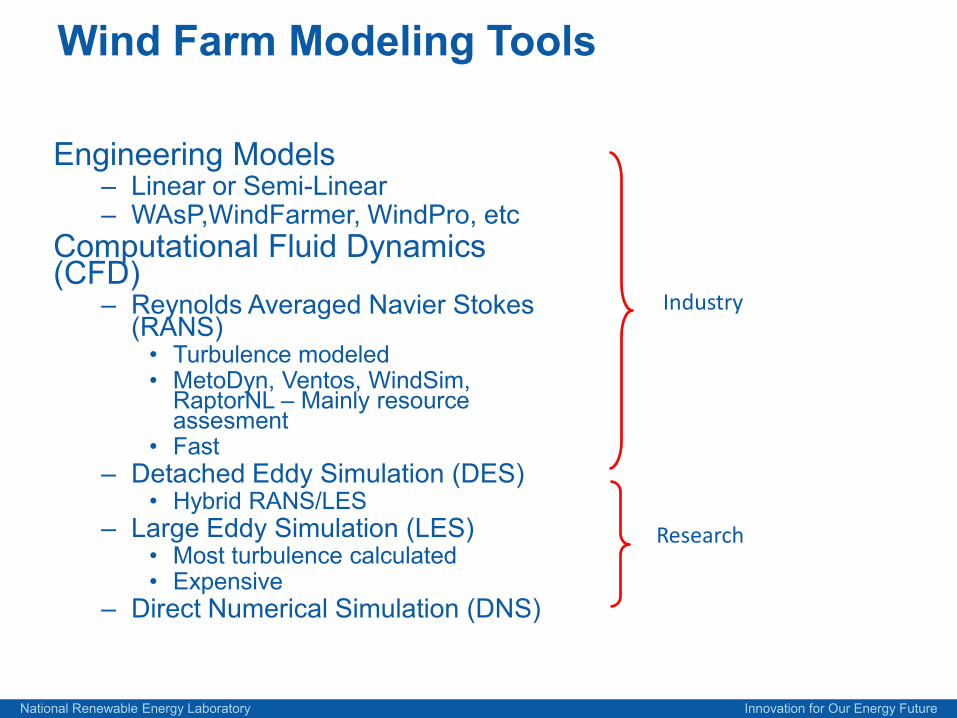
Wind Farm Modeling Tools
Engineering Models– Linear or Semi-Linear – WAsP,WindFarmer, WindPro, etc
Computational Fluid Dynamics (CFD)
– Reynolds Averaged Navier Stokes (RANS)• Turbulence modeled• MetoDyn, Ventos, WindSim,
RaptorNL – Mainly resource assesment
• Fast– Detached Eddy Simulation (DES)
• Hybrid RANS/LES– Large Eddy Simulation (LES)
• Most turbulence calculated• Expensive
– Direct Numerical Simulation (DNS)
Industry
Research
National Renewable Energy Laboratory Innovation for Our Energy Future
Questions?