Embed Size (px)
Citation preview

Wind Turbine WakeMeasurements in the OperatingRegion of a Tail Vane
January 2001 � NREL/CP-500-29132
S. Larwood
Presented at the 39th American Instituteof Aeronautics and Astronautics, Inc. (AIAA)Aerospace Sciences MeetingReno, NevadaJanuary 8�11, 2001
National Renewable Energy Laboratory1617 Cole BoulevardGolden, Colorado 80401-3393NREL is a U.S. Department of Energy LaboratoryOperated by Midwest Research Institute •••• Battelle •••• Bechtel
Contract No. DE-AC36-99-GO10337

NOTICEThe submitted manuscript has been offered by an employee of the Midwest Research Institute (MRI), acontractor of the US Government under Contract No. DE-AC36-99GO10337. Accordingly, the USGovernment and MRI retain a nonexclusive royalty-free license to publish or reproduce the publishedform of this contribution, or allow others to do so, for US Government purposes.
This report was prepared as an account of work sponsored by an agency of the United Statesgovernment. Neither the United States government nor any agency thereof, nor any of their employees,makes any warranty, express or implied, or assumes any legal liability or responsibility for the accuracy,completeness, or usefulness of any information, apparatus, product, or process disclosed, or representsthat its use would not infringe privately owned rights. Reference herein to any specific commercialproduct, process, or service by trade name, trademark, manufacturer, or otherwise does not necessarilyconstitute or imply its endorsement, recommendation, or favoring by the United States government or anyagency thereof. The views and opinions of authors expressed herein do not necessarily state or reflectthose of the United States government or any agency thereof.
Available electronically at http://www.doe.gov/bridge
Available for a processing fee to U.S. Department of Energyand its contractors, in paper, from:
U.S. Department of EnergyOffice of Scientific and Technical InformationP.O. Box 62Oak Ridge, TN 37831-0062phone: 865.576.8401fax: 865.576.5728email: [email protected]
Available for sale to the public, in paper, from:U.S. Department of CommerceNational Technical Information Service5285 Port Royal RoadSpringfield, VA 22161phone: 800.553.6847fax: 703.605.6900email: [email protected] ordering: http://www.ntis.gov/ordering.htm
Printed on paper containing at least 50% wastepaper, including 20% postconsumer waste

1
WIND TURBINE WAKE MEASUREMENTS IN THE OPERATING REGION OF A TAIL VANE
Scott LarwoodNational Wind Technology Center
National Renewable Energy LaboratoryGolden, Colorado
ABSTRACT
In conjunction with the National Renewable EnergyLaboratory�s (NREL�s) Unsteady AerodynamicsExperiment (UAE) at NASA Ames, we measured thewake of an upwind 10-meter (m) diameter wind turbinein the typical region of a tail vane. The experiment wasperformed in a 24.4-by-36.6-m wind tunnel. We placedtwo sonic anemometers 0.58 rotor diameters downwindof the rotor at hub height. One was positionednominally behind the nacelle at 9% radius and thesecond was placed 2-m outboard at 49% radius. Thetunnel wind speed was varied from 5 to 25 meters persecond (m/s) and the turbine rotor speed was held at 72revolutions per minute (rpm). We varied yaw from 0ºto 60º. The data showed unsteadiness in the wake dueto the nacelle wake. Also, the unsteadiness increasedwith the onset of blade stall. The axial induction factorin the wake showed that the turbine was operatingwithin the windmill brake state of actuator diskmomentum theory. Little variation in unsteadiness wasshown under yawed conditions. We also discovered thatlateral velocity behind the nacelle was negative andwould result in an unfurling normal force on a tail vane.The vertical velocity was shown to change sign underyawed conditions, conceivably as a result of theopposing blade root vortex.
INTRODUCTION
Besides providing the best position for a company�slogo, the tail vane has been serving as a passive controldevice on wind turbines for more than a century. Smallturbines manufactured today continue to incorporate thetail vane as a means of aligning the rotor to maximizeenergy capture. The tail vane delays furling by keepingthe rotor aligned with the wind until the furling momenton the rotor is sufficient to overcome the gravitypreload on the tail vane hinge. Researchers at NREL�sSmall Turbine Program have displayed new interest inthe physics of furling.
This material is declared a work of the U.S. Government and is notsubject to copyright protection in the United States.
Small Turbine Program
The United States Department of Energy (DOE)embarked on a program in 1995 to stimulate theapplication of advanced technology in the portion of theindustry that serves markets requiring wind turbines in5- to 40-kilowatt range.1 All of the prototype designs inthis program use furling as a passive control mechanismto minimize overshoots in both power and loads at highwind speeds. Furling occurs when the rotor yaws out ofthe wind with the tail remaining nominally in theundisturbed wind direction. The yawed rotor presents areduced effective area, thus lowering rotor speed andpower.
Experiments under the Small Turbine Program wereperformed in the past few years to correlate field-testdata with models of turbine furling.2 Researchersintended to use these models to assist in furling turbinedesign, and to determine loads for potential certificationunder International Electrotechnical Commissionstandards. One area of uncertainty in these models wasin tail vane aerodynamics.
Tail Region Aerodynamic Modeling
Tail aerodynamic models found in the literature aresimplified adaptations of momentum theory.3 Beloware three models of the velocity in the region of the tail:
1. Ackerman,4 near wake approximation:)1( aUUwake −×=
2. Chen,5 undisturbed wind speed: UUwake =3. Eggers,2 far wake: )21( aUUwake ×−×=where:
Uwake = the axial velocity of the wakeU = the undisturbed wind speeda = the axial induction factor at the
rotor disc

2
These models only determine the axial velocity. Weobtained the axial induction factor at the rotor disk fromthe rotor aerodynamic model.
Model comparisons with small turbine yawing andfurling field-test data showed discrepancies in the tailnormal-force predictions. We suggested, based on thesediscrepancies and due to a lack of wake data, thatvelocity measurements be made in the region of a tailvane to help with aerodynamic modeling efforts.
Wake Measurement Studies
Past wake studies have focused either on correlationwith rotor aerodynamic models or on wake impacts onturbine array operations. For rotor aerodynamicmodeling efforts, measurements were made within twochord lengths of the rotor. For array studies,measurements were obtained in the region greater thantwo rotor diameters downstream. These measurementsare out of the typical range of a tail vane, usually placed0.5 to 0.7 diameters downwind of the rotor. However,some of these data in the literature can be of qualitativeuse in the study of tail aerodynamics. Whereappropriate, data from this study will be compared towake studies in the literature.
Wake Measurement Objectives
The objective of the wake measurement test was tomeasure the average and time-varying three-dimensional velocity components in the wake of a windturbine rotor in the locations representative of tail vanepositions for small turbine rotors.
This paper describes the experimental setup used toobtain these wake measurements. Results will bepresented that show rotor-dependent features of thewake and characteristics that will influence tailoperation.
EXPERIMENTAL SETUP
Unsteady Aerodynamics Experiment
The measurements were made in the spring of 2000during NREL�s Unsteady Aerodynamics Experiment(UAE) in the NASA Ames Research Center 24.4-by-36.6-meter wind tunnel. One day of tunnel testing wasallotted to obtain the wake measurements. Moreinformation on the UAE test program can be found at:http://wind2.nrel.gov/amestest/.
Specifications for the UAE turbine are as follows:
• Upwind operation• 10.06-meter diameter rotor• 0.061 rotor solidity• 72-rpm constant rotor speed (1.2 hertz [Hz])• Two-bladed• Rigid rotor with 0º coning• Rotor plane 1.40 meters upwind of yaw axis• 12.19-meter (40-ft) hub height (tunnel centerline)
The turbine and wake measurement setup is shown inFigure 1. In this figure, the blades rotate in a counter-clockwise direction. The azimuth angle is 0º with theblack instrumented blade at top dead center. The yawdirection is clockwise as viewed from the top. With theblack blade at 90º azimuth (or 9 o�clock position, asshown in Figure 1), the blade tip will be pointingdownwind with respect to the white blade at positiveyaw.
The two wake measurement anemometers wereinstalled on a tower 0.58 diameters (5.84 meters)downstream from the rotor plane. Anemometer 1 wasthe most inboard at 9% radius. Anemometer 2 wasoutboard 2 meters from Anemometer 1 at 49% radius.Figure 2 shows a downstream view of theanemometers. The axial (U) components of theanemometers were positioned at hub height. The twopositions of the anemometers were such that the tailangle measured from the yaw axis to the center of the�U� measurement would be 6º and 29º relative to theundisturbed wind direction (see Figure 3).
For this series of tests, a yaw restraint was placed on theturbine to limit the yaw to ±65º in the event of a yawbrake failure. At +65º yaw, the rotor plane wasapproximately 1 foot from the outboard anemometer.
Sonic Anemometers
Two Applied Technologies Inc.6 type K anemometers(see Figure 4) were used to acquire the wakemeasurements in three axes. The anemometer measuresthe acoustic velocity along the 15-cm path length. Theinstrument samples at 200 Hz, and outputs a non-overlapping block average of 20 samples at 10 Hz. The10-Hz rate corresponded to 43.2º of rotor azimuth peraverage, with 8.3 averages per rotor revolution.
The two anemometers were connected to an ATI PAD-002 Data Packer. The data packer combined theanemometer outputs into a single string with no phasedifference. The data packer output string was read on a

3
laptop computer via an RS-232 link. The laptop wasused to store 30-second files, which corresponded tofiles acquired simultaneously with the turbine dataacquisition system. The 30-second recordcorresponded to 36 rotor revolutions.
Test Matrix
Table 1 below shows the test matrix for wakemeasurement. Tunnel speed range (Uw) varied from 5to 25 meters per second (m/s). This range correspondedto a tip-speed ratio (TSR) range of 7.5 to 1.5. Theturbine yaw range varied from 0º to 60º, with higheryaw resolution between 0º and 30º. The yaw was heldin position with a yaw brake. The yaw range wasconstrained at the higher speeds due to turbine loadlimits established in previous testing.
Table 1. UAE wake measurement test matrix
Uw TSR Yaw Angle(m/s) 0 5 10 15 20 25 30 40 50 605.0 7.5 X X X X X X X X X X6.0 6.3 X X X X X X X X X X7.0 5.4 X X X X X X X X X X8.0 4.7 X X X X X X X X X X9.0 4.2 X X X X X X X X X X10.0 3.8 X X X X X X X X X X11.0 3.4 X X X X X X X X X X12.0 3.1 X X X X X X X X X X13.0 2.9 X X X X X X X X X X14.0 2.7 X X X X X X X X X X15.0 2.5 X X X X X X X X X X16.0 2.4 X X X X X X X17.0 2.2 X X X X X X X18.0 2.1 X X X X X19.0 2.0 X X X X X20.0 1.9 X X X21.0 1.8 X X X22.0 1.7 X X X23.0 1.6 X24.0 1.6 X25.0 1.5 X
Uncertainty Estimates
Estimates of the experimental uncertainty wereperformed using the methods outlined in AIAA S-071-1995.7 The combined bias and precision error resultsare as follows:
• Wind Tunnel Velocity: ± 0.1 m/s• Anemometer U, V, and W: ± 0.23 m/s• Anemometer Angular Alignment: ± 1º
An additional, but unknown, uncertainty can occur inthe anemometer output as a result of aliasing of theinput spectrum. The ATI manual6 describes aliasingdue to the -5/3-power law of atmospheric turbulence;however, the wind tunnel and turbine wake spectrum isunknown. Therefore, the aliasing error is unknown inthis application.
In addition to potential aliasing error, the anemometerhas a frequency response caused by spatial averaging ofthe 15-cm path length and the 10-Hz block-averagingprocess. Due to the roll-off in the amplitude response,care needs to be exercised if the three components ofwind speed are to be summed together.8 For thepurposes of this current work, the three velocitycomponents will be reported separately.
Experimental Constraints
Listed below are constraints on the experiment resultingin differences with the normal environment of a smallwind turbine.
• Inflow turbulence would not be simulated and theturbine would be fixed in yaw position. Turbinesin the field are subject to atmospheric turbulenceand dynamic yaw. These turbulence and dynamicyaw constraints were not considered criticalbecause the initial model correlation would bemade with steady conditions.
• The effects of the nacelle wake are unknown. TheUAE nacelle has a lower frontal area compared totypical small turbine generator housings. However,the nacelle wake was deemed acceptable becauseall tail vanes operate within blockage of some sort.
• The effects of turbine boom components such ascamera and instrumentation boxes (see Figure 1)upstream of the hub are unknown.
• The UAE turbine was designed with a limited TSRrange. Small turbines can run up to a TSR of 11 atrated wind speed and when unloaded, and the wakecan enter into the vortex ring state. The data fromthis experiment probably cannot be reliablyextrapolated to higher tip-speed ratios. To addressthis constraint, future tests would have to beconducted with a turbine capable of higher tip-speed ratios.
• The sonic anemometers had a limited bandwidth ofless than 5 Hz, with a flat amplitude responsebelow 1 Hz. Small structures in the wake cannotbe resolved with this instrument. This constraintwas not considered critical because the currentmodels only address the average wake velocity,which can be determined accurately with thisinstrument.
4
RESULTS AND DISCUSSION
Example Time Series at 0º Yaw
Figures 5 and 6 show example time series for the twoanemometers at 9 m/s wind tunnel speed and 0º-yawangle. The averages and standard deviations are shownin the plot legends. The standard deviation ofAnemometer 1 (inboard) is much higher than forAnemometer 2. This unsteadiness could be a result ofthe nacelle wake. Also, the average of the vertical (W)component is 1 m/s for both anemometers, whichshows, as expected, that the wake is rotating oppositethe rotor rotation. Figure 7 shows the time series forboth axial (U) velocity components at the abovecondition, expanded to show four seconds.
Example Spectra at 0º Yaw
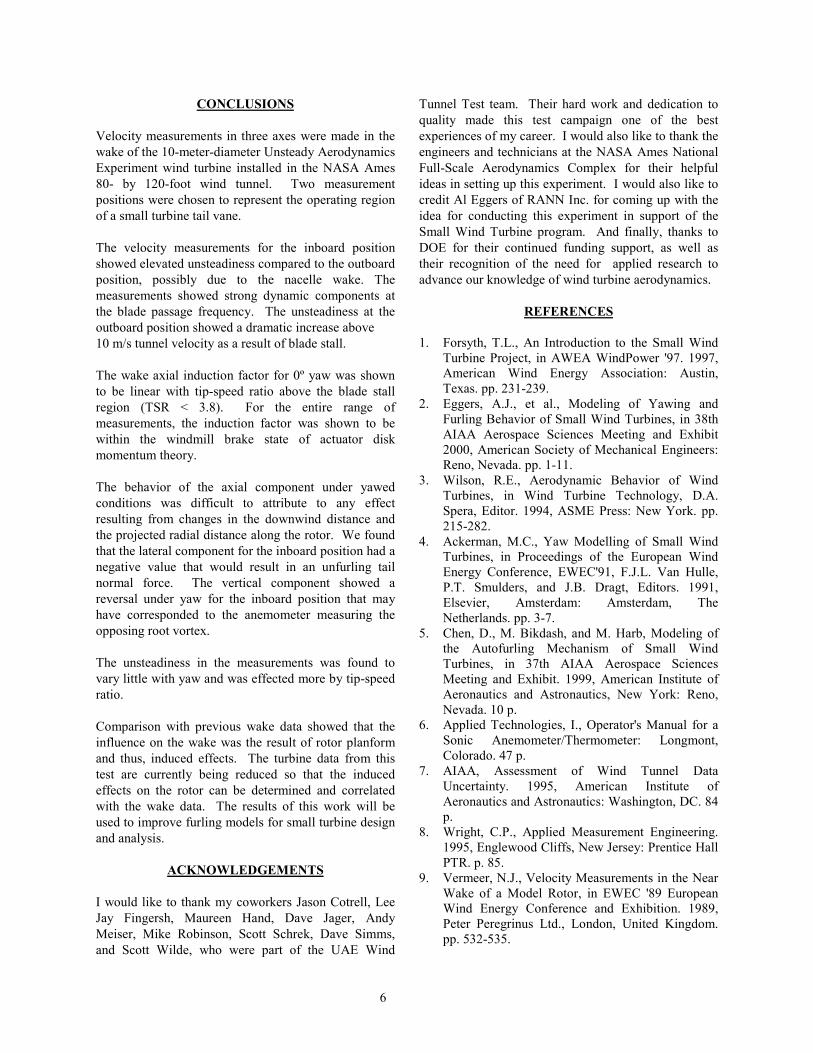
Figure 8 shows power spectral densities for the abovetime series. Peaks occur in Anemometer 1 at therotational harmonics up to 4/rev (at 1.2 Hz, 2.4 Hz, 3.6Hz, and 4.8 Hz frequencies, respectively). Theprominent peak is at the blade passage frequency of2/rev or 2.4 Hz. The spectra for Anemometer #2 showprominent peaks in all velocity components at 2/rev(2.4 Hz) and a peak in the vertical (W) component at4/rev (4.8 Hz). The 1/rev and 3/rev peaks ofAnemometer 1 are not apparent in Anemometer 2.
The prominent peaks for both anemometer spectra atthe 2/rev blade passage frequency may represent thepassage of the shed vorticity. This periodicphenomenon was also shown in near-wakemeasurements conducted by Vermeer.9 The 4/revcomponent might be a harmonic of coherent structuresat 2/rev. Mechanical components on theinstrumentation boom upstream of the rotor shown inFigure 1 are probable causes of the 1/rev (boomcamera) and 3/rev (three instrumentation boxes onboom), because the 1/rev and 3/rev components do notappear in Anemometer #2�s spectrum.
Wake Axial (U) Velocity at 0º Yaw
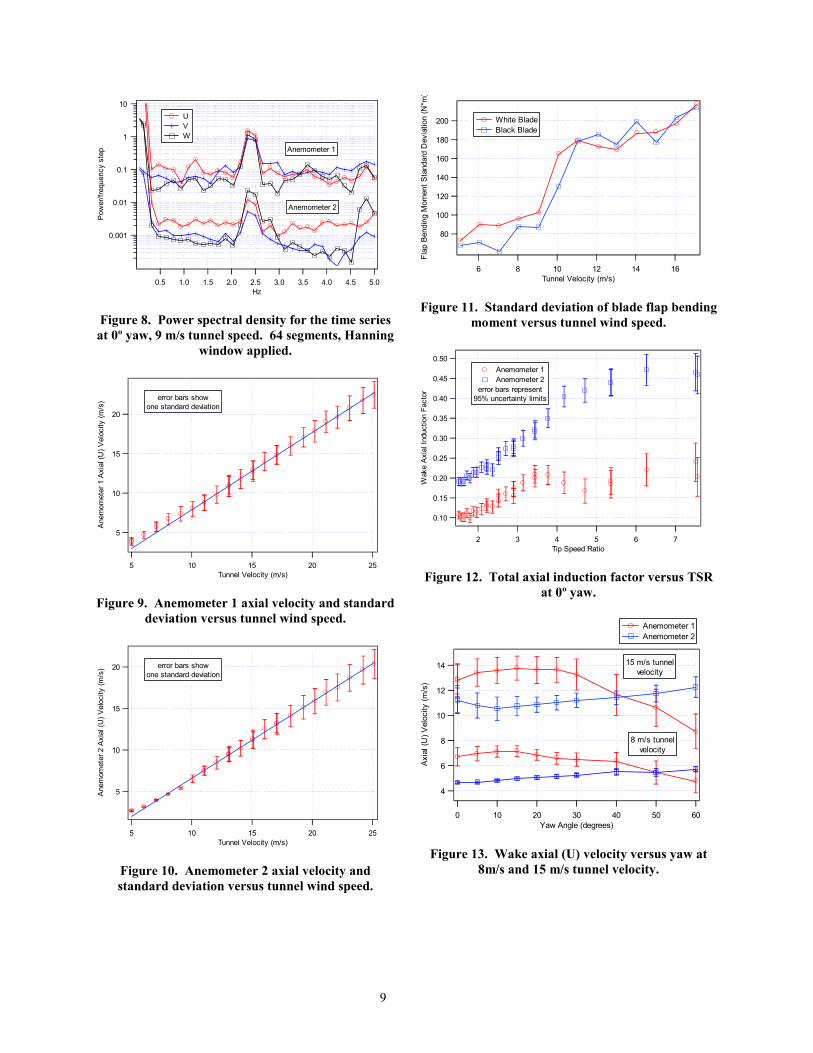
Figures 9 and 10 show the measured wake axialvelocities for both anemometers at 0º yaw over thetunnel velocity range. A linear least-squares fit isshown from 10 to 25 m/s tunnel velocity. This fitillustrates a strong linear relationship between tunnelvelocity and average wake velocity in this tunnel speedrange.
The axial velocity standard deviation for Anemometer 2(see Figure 10) increased substantially above 10 m/stunnel velocity. This increase in unsteadiness wasattributed to blade stall, which was confirmed in theturbine data (see Figure 11) by the abrupt increase at 10m/s in blade flap bending moment standard deviation.Vermeer10 also experimentally showed correlationbetween blade stall and wake unsteadiness.
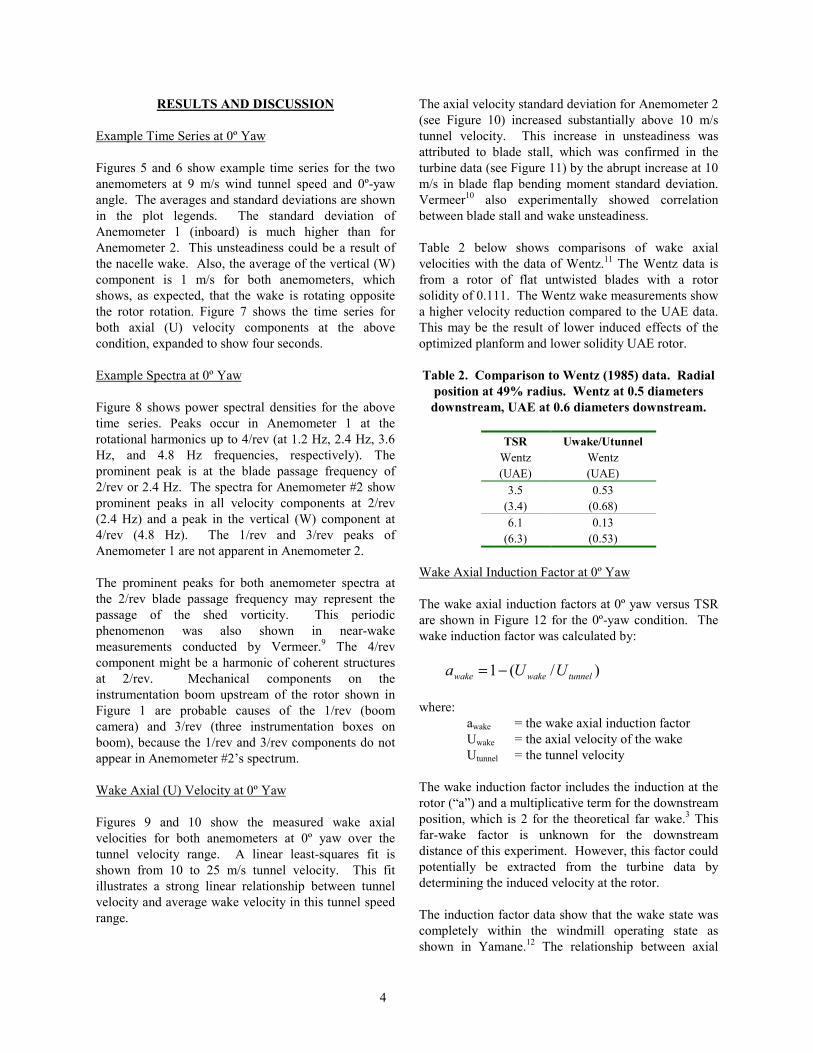
Table 2 below shows comparisons of wake axialvelocities with the data of Wentz.11 The Wentz data isfrom a rotor of flat untwisted blades with a rotorsolidity of 0.111. The Wentz wake measurements showa higher velocity reduction compared to the UAE data.This may be the result of lower induced effects of theoptimized planform and lower solidity UAE rotor.
Table 2. Comparison to Wentz (1985) data. Radialposition at 49% radius. Wentz at 0.5 diametersdownstream, UAE at 0.6 diameters downstream.
TSRWentz(UAE)
Uwake/UtunnelWentz(UAE)
3.5(3.4)
0.53(0.68)
6.1(6.3)
0.13(0.53)
Wake Axial Induction Factor at 0º Yaw
The wake axial induction factors at 0º yaw versus TSRare shown in Figure 12 for the 0º-yaw condition. Thewake induction factor was calculated by:
)/(1 tunnelwakewake UUa −=
where:awake = the wake axial induction factorUwake = the axial velocity of the wakeUtunnel = the tunnel velocity
The wake induction factor includes the induction at therotor (�a�) and a multiplicative term for the downstreamposition, which is 2 for the theoretical far wake.3 Thisfar-wake factor is unknown for the downstreamdistance of this experiment. However, this factor couldpotentially be extracted from the turbine data bydetermining the induced velocity at the rotor.
The induction factor data show that the wake state wascompletely within the windmill operating state asshown in Yamane.12 The relationship between axial

5
induction and TSR is fairly linear at both wakepositions up to TSR = 3.8 (10 m/s tunnel velocity).Also, the induction factor at the inboard position showsa dip between TSR of 4 and 5. This might indicate anacelle aerodynamic phenomenon that is dependent onReynolds number.
Yawed Conditions
Data under yawed conditions are compared usingtunnel velocities of 8 and 15 m/s. The 8m/s velocitywas chosen because the rotor would be mostlyunstalled. The 15 m/s condition was chosen because itwas the maximum velocity that had a full yaw sweep to60º (see Table 1). The error bars in the followingfigures (Figures 13, 15, 16, 18, and 19) represent onestandard deviation of the data.
Yawed Conditions-- Axial (U) Velocity
Figure 13 shows the wake axial velocity versus yaw forboth anemometers at wind tunnel velocities of 8 m/sand 15 m/s wind tunnel velocity. Anemometer 1 showsa sharp decline after 30º. Anemometer 2 shows asteady increase with yaw above 10º. Because theanemometer positions are fixed, the relative radialpositions and downstream distances change with yawangle. Table 3 below shows these positions normalizedto the blade radius (shown schematically in Figure 14):
Table 3. Downstream distance and projected radialposition from anemometers to rotor plane
normalized by rotor radius (5.029 m)
Anemometer 1 Anemometer 2
Yaw Angle
Normalized Downstream
Position
Normalized Radial
Position
Normalized Downstream
Position
Normalized Radial
Position0 1.16 0.09 1.16 0.495 1.15 0.07 1.12 0.4710 1.15 0.04 1.08 0.4515 1.14 0.02 1.04 0.4320 1.15 0.00 1.00 0.4225 1.15 -0.03 0.96 0.4130 1.15 -0.05 0.92 0.4040 1.16 -0.09 0.84 0.4050 1.21 -0.12 0.73 0.4360 1.28 -0.15 0.59 0.49
Note: Negative values in radial position represent theopposite side of the hub.
For Anemometer 2, the distance to the rotor planedecreases with increasing yaw. The relative radialposition is moving inboard except at 50º and 60º yaw.Schepers13 showed that the wake axial velocityincreases with decreasing radial position for the
downwind portion of a yawed rotor. Figure 13 showsan increase for Anemometer 2; however, this increasecan also be attributed to closer rotor proximity resultingin a lower wake induction factor.
Yawed Conditions-- Lateral (V) Velocity
Figures 15 and 16 show the wake lateral velocitycomponent versus yaw for 8 and 15 m/s tunnelvelocities, respectively. Anemometer 2 average valuesare relatively low and in the positive direction asexpected, because the wake should be conveyed in thedirection on the side that the turbine yaws towards. Theaverage lateral velocity at Anemometer 1, however, isnegative. It is uncertain whether this is the result of thenacelle wake or the root vortex. For a tail vane in thisposition, the apparent angle of attack would result in anormal force towards the unfurled position. This isshown schematically in Figure 17. For the UAE turbineconfiguration, the tail normal force would be zero at apositive yaw offset. This result may depend on thedirection of rotor rotation.
Yawed Conditions-- Vertical (W) Velocity
Figures 18 and 19 show the wake vertical velocitycomponent versus yaw for 8 and 15 m/s tunnelvelocities, respectively. Anemometer 1 is initiallypositive but changes sign between 20º and 30º. Thisresult correlates well with the relative radial positionfound in Table 3. The radial position for Anemometer1 crosses over to the opposite blade between 20º and25º yaw, and the anemometer conceivably measures theroot vortex rotating in the opposite direction.Anemometer 2 is positive and peaks around 30º.
Wake Unsteadiness
The small variation of wake velocity standard deviationwith yaw angle suggests that the unsteadiness in thewake is unaffected by yaw angle. The majority of thevariation in standard deviation is with wind speed andTSR. Also, it is uncertain what role the unsteadinesswould have on the tail operation. For the measurementbandwidth of this experiment, the tail would see time-varying velocities with length scales greater thanpossible tail lengths. It is uncertain whether thesevelocity changes would be coherent in the threedirections.
6
CONCLUSIONS
Velocity measurements in three axes were made in thewake of the 10-meter-diameter Unsteady AerodynamicsExperiment wind turbine installed in the NASA Ames80- by 120-foot wind tunnel. Two measurementpositions were chosen to represent the operating regionof a small turbine tail vane.
The velocity measurements for the inboard positionshowed elevated unsteadiness compared to the outboardposition, possibly due to the nacelle wake. Themeasurements showed strong dynamic components atthe blade passage frequency. The unsteadiness at theoutboard position showed a dramatic increase above10 m/s tunnel velocity as a result of blade stall.
The wake axial induction factor for 0º yaw was shownto be linear with tip-speed ratio above the blade stallregion (TSR < 3.8). For the entire range ofmeasurements, the induction factor was shown to bewithin the windmill brake state of actuator diskmomentum theory.
The behavior of the axial component under yawedconditions was difficult to attribute to any effectresulting from changes in the downwind distance andthe projected radial distance along the rotor. We foundthat the lateral component for the inboard position had anegative value that would result in an unfurling tailnormal force. The vertical component showed areversal under yaw for the inboard position that mayhave corresponded to the anemometer measuring theopposing root vortex.
The unsteadiness in the measurements was found tovary little with yaw and was effected more by tip-speedratio.
Comparison with previous wake data showed that theinfluence on the wake was the result of rotor planformand thus, induced effects. The turbine data from thistest are currently being reduced so that the inducedeffects on the rotor can be determined and correlatedwith the wake data. The results of this work will beused to improve furling models for small turbine designand analysis.
ACKNOWLEDGEMENTS
I would like to thank my coworkers Jason Cotrell, LeeJay Fingersh, Maureen Hand, Dave Jager, AndyMeiser, Mike Robinson, Scott Schrek, Dave Simms,and Scott Wilde, who were part of the UAE Wind
Tunnel Test team. Their hard work and dedication toquality made this test campaign one of the bestexperiences of my career. I would also like to thank theengineers and technicians at the NASA Ames NationalFull-Scale Aerodynamics Complex for their helpfulideas in setting up this experiment. I would also like tocredit Al Eggers of RANN Inc. for coming up with theidea for conducting this experiment in support of theSmall Wind Turbine program. And finally, thanks toDOE for their continued funding support, as well astheir recognition of the need for applied research toadvance our knowledge of wind turbine aerodynamics.
REFERENCES
1. Forsyth, T.L., An Introduction to the Small WindTurbine Project, in AWEA WindPower '97. 1997,American Wind Energy Association: Austin,Texas. pp. 231-239.
2. Eggers, A.J., et al., Modeling of Yawing andFurling Behavior of Small Wind Turbines, in 38thAIAA Aerospace Sciences Meeting and Exhibit2000, American Society of Mechanical Engineers:Reno, Nevada. pp. 1-11.
3. Wilson, R.E., Aerodynamic Behavior of WindTurbines, in Wind Turbine Technology, D.A.Spera, Editor. 1994, ASME Press: New York. pp.215-282.
4. Ackerman, M.C., Yaw Modelling of Small WindTurbines, in Proceedings of the European WindEnergy Conference, EWEC'91, F.J.L. Van Hulle,P.T. Smulders, and J.B. Dragt, Editors. 1991,Elsevier, Amsterdam: Amsterdam, TheNetherlands. pp. 3-7.
5. Chen, D., M. Bikdash, and M. Harb, Modeling ofthe Autofurling Mechanism of Small WindTurbines, in 37th AIAA Aerospace SciencesMeeting and Exhibit. 1999, American Institute ofAeronautics and Astronautics, New York: Reno,Nevada. 10 p.
6. Applied Technologies, I., Operator's Manual for aSonic Anemometer/Thermometer: Longmont,Colorado. 47 p.
7. AIAA, Assessment of Wind Tunnel DataUncertainty. 1995, American Institute ofAeronautics and Astronautics: Washington, DC. 84p.
8. Wright, C.P., Applied Measurement Engineering.1995, Englewood Cliffs, New Jersey: Prentice HallPTR. p. 85.
9. Vermeer, N.J., Velocity Measurements in the NearWake of a Model Rotor, in EWEC '89 EuropeanWind Energy Conference and Exhibition. 1989,Peter Peregrinus Ltd., London, United Kingdom.pp. 532-535.

7
10. Vermeer, L.J. and W.A. Timmer, Identification ofOperational Aerofoil State by Means of VelocityMeasurements, in 1999 European Wind EnergyConference, E.L. Petersen, et al., Editors. 1999,James & James (Science Publishers) Ltd, London,UK: Nice, France. pp. 168-171.
11. Wentz, W., et al., Horizontal Axis Wind TurbineWake and Blade Flow Studies from Model Tests,in The Eighth Annual Energy-Sources TechnologyConference and Exhibition, A.H.P. Swift, Editor.1985, The American Society of MechanicalEngineers, New York: Dallas, Texas. pp. 235-244.
12. Yamane, T., Y. Tsutsui, and T. Orita, TheAerodynamic Performance of a Horizontal-AxisWind Turbine in Large Induced-Velocity States, inFourth International Symposium on Wind EnergySystems. 1982, BHRA Fluid Engineering,England: Stockholm, Sweden. pp. 85-100.
13. Schepers, J.G., An Engineering Model for YawedConditions, Developed on Basis of Wind TunnelMeasurements, in 37th AIAA Aerospace SciencesMeeting and Exhibit. 1999, American Institute ofAeronautics and Astronautics, New York: Reno,Nevada. pp. 164-174.
FIGURES
Figure 1. UAE Turbine with downwind wakemeasurement installation in 80- by 120-foot wind
tunnel
Figure 2. Downstream view of wake measurementtower. The turbine in this photo represents the
downwind configuration at 180º yaw. The upwindturbine configuration is shown in Figure 1.

8
Figure 3. Tail angles based on distance from yawaxis to anemometer positions
Figure 4. ATI Sonic Probe
8
6
4
2
0
Anem
omet
er 1
Wak
e Ve
loci
ty (m
/s)
302520151050Duration (sec)
Component (average ± std. dev.) U ( 7.38 ± 0.91 m/s) V ( 0.16 ± 0.82 m/s) W ( 1.01 ± 0.76 m/s)
Figure 5. Anemometer 1 (inboard) time series at 0ºyaw, 9 m/s tunnel speed
8
6
4
2
0
Anem
omet
er 2
Wak
e Ve
loci
ty (m
/s)
302520151050Duration (sec)
Component (average ± std. dev.) U ( 5.41 ± 0.12 m/s) V ( 0.17 ± 0.08 m/s) W ( 1.05 ± 0.12 m/s)
Figure 6. Anemometer 2 (outboard) time series at 0ºyaw, 9 m/s tunnel speed
10
9
8
7
6
5
4
Axi
al (U
) Win
dspe
ed (m
/s)
43210Duration (sec)
Anemometer 1 (inboard) Anemometer 2 (outboard)
Figure 7. Expanded time series for axial (U)component at 0º yaw, 9 m/s tunnel speed
9
0.001
0.01
0.1
1
10Po
wer
/freq
uenc
y st
ep
5.04.54.03.53.02.52.01.51.00.5Hz
U V W
Anemometer 1
Anemometer 2
Figure 8. Power spectral density for the time seriesat 0º yaw, 9 m/s tunnel speed. 64 segments, Hanning
window applied.
20
15
10
5
Ane
mom
eter
1 A
xial
(U) V
eloc
ity (m
/s)
252015105Tunnel Velocity (m/s)
error bars showone standard deviation
Figure 9. Anemometer 1 axial velocity and standarddeviation versus tunnel wind speed.
20
15
10
5Anem
omet
er 2
Axi
al (U
) Vel
ocity
(m/s
)
252015105Tunnel Velocity (m/s)
error bars showone standard deviation
Figure 10. Anemometer 2 axial velocity andstandard deviation versus tunnel wind speed.
200
180
160
140
120
100
80
Flap
Ben
ding
Mom
ent S
tand
ard
Dev
iatio
n (N
*m)
1614121086Tunnel Velocity (m/s)
White Blade Black Blade
Figure 11. Standard deviation of blade flap bendingmoment versus tunnel wind speed.
0.50
0.45
0.40
0.35
0.30
0.25
0.20
0.15
0.10
Wak
e Ax
ial I
nduc
tion
Fact
or
765432Tip Speed Ratio
Anemometer 1 Anemometer 2
error bars represent95% uncertainty limits
Figure 12. Total axial induction factor versus TSRat 0º yaw.
14
12
10
8
6
4
Axia
l (U
) Vel
ocity
(m/s
)
6050403020100Yaw Angle (degrees)
Anemometer 1 Anemometer 2
15 m/s tunnelvelocity
8 m/s tunnelvelocity
Figure 13. Wake axial (U) velocity versus yaw at8m/s and 15 m/s tunnel velocity.
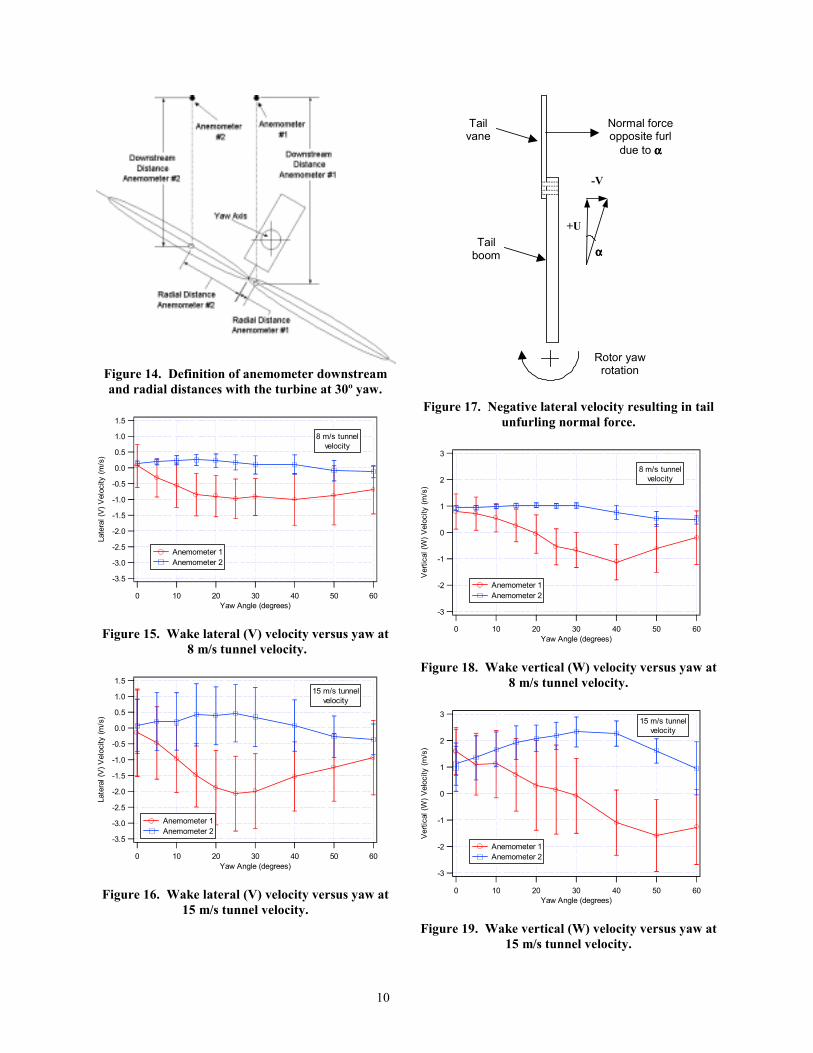
10
Figure 14. Definition of anemometer downstreamand radial distances with the turbine at 30º yaw.
-3.5
-3.0
-2.5
-2.0
-1.5
-1.0
-0.5
0.0
0.5
1.0
1.5
Late
ral (
V) V
eloc
ity (m
/s)
6050403020100Yaw Angle (degrees)
Anemometer 1 Anemometer 2
8 m/s tunnelvelocity
Figure 15. Wake lateral (V) velocity versus yaw at 8 m/s tunnel velocity.
-3.5
-3.0
-2.5
-2.0
-1.5
-1.0
-0.5
0.0
0.5
1.0
1.5
Late
ral (
V) V
eloc
ity (m
/s)
6050403020100Yaw Angle (degrees)
Anemometer 1 Anemometer 2
15 m/s tunnelvelocity
Figure 16. Wake lateral (V) velocity versus yaw at15 m/s tunnel velocity.
-V
Rotor yawrotation
Tailvane
Tailboom
Normal forceopposite furl
due to αααα
+U
αααα
Figure 17. Negative lateral velocity resulting in tailunfurling normal force.
-3
-2
-1
0
1
2
3
Ver
tical
(W) V
eloc
ity (m
/s)
6050403020100Yaw Angle (degrees)
Anemometer 1 Anemometer 2
8 m/s tunnelvelocity
Figure 18. Wake vertical (W) velocity versus yaw at8 m/s tunnel velocity.
-3
-2
-1
0
1
2
3
Verti
cal (
W) V
eloc
ity (m
/s)
6050403020100Yaw Angle (degrees)
Anemometer 1 Anemometer 2
15 m/s tunnelvelocity
Figure 19. Wake vertical (W) velocity versus yaw at15 m/s tunnel velocity.