Embed Size (px)
Citation preview

WINDOW AIR-LEAKAGE PERFORMANCE
AS A FUNCTION OF DIFFERENTIAL
TEMPERATURES AND ACCELERATED AGING D. Kehrli ASHRAE Member
ABSTRACT
The cu~rent industry standard for measuring air leakage of windows, curtain walls, and doors is ASTM E283. This test measures the ability of fenestration products to resist air leakage under ideal laboratory conditions which usually are at standard atmospheric conditions i.e., 29.98 in. hg. and 68 F on both the internal and external surfaces of these products. There are many national performance standards, private and governmental building performance specifications, and product certification programs that reference this ASTM standard.
This paper will focus on the shortfalls of this air leakage standard for fenestration products. The paper will also establish the nature and scope of the problems associated with this standard as they relate to near and long term performance characteristics of these products under service conditions. The development of two new proposed ASTM standards for the evaluation of window performance under differential temperatures in the laboratory and the effects of short term accelerated temperature aging on window air leakage performance, also in the laboratory, will be reviewed.
Testing procedures will be described, along with test results procedures. Results will be correlated with various window components. refinement summary will be offered.
INTRODUCTION
of windows using these And finally, a product
The field performance of fenestration products, particularly aluminum, vinyl, and wood residential and commercial, prime and replacement windows is due in large part to their components of assembly. There are, in the finished product, literally dozens of components manufactured from almost as many different materials. These materials all react very differently to environmental elements which are termed degradation factors. These degradation factors can cause substantial changes in the behavior of windows within a very short time after their installation in the building envelope.
Windows are currently tested for their ability to resist air and water leakage, structural integrity, ease of operation (open and close), thermal performance (U-value, conductance, condensation resistance, shading coefficients), and sound transmission loss. These and other various tests determine the products' ability to perform under static conditions. These controlled laboratory tests are most often performed on new products which mayor may not be of production line quality. The tests are carried out under ideal parameters and always under
David Kehrli is the Technical Services Manager for the Building Products Division, Schlegel Corporation, and is Chairman of ASTM E6.22.02 and E6.S1.04 Task Groups.
872

steady state conditions. The effects of environmental degradation interactions with time are not included in these testing procedures, and indicate the ability of these products to perform in the field under environmental conditions.
factors and their test results do not dynamic, in-serviee
one of the major areas of concern with window performance is air leakage. Studies have indicated higher laboratory air leakage of windows when tested under non-standard temperature conditions (Fleury, Thomas, 1972). One study indicated that the field performance of various types of windows when tested over the course of one year had considerably higher leakage rates than when the windows were first tested in the laboratory (Weidt, 1980).
This performance concern is misleading, and perhaps misunderstood, in the following areas:
1. Trade association certification programs for fenestration performance. These programs are all based on air leakage testing using ASTM E283, and in none of them is there any provision for field performance or performance durability.
2. Net heat. transfer rates of windows are based on two independent and separate tests. These are the U-value tests performed at 68 F and 18 F (50 FAT), and the air leakage test performed at 68 F on both sides of the test window, (0
~T). The total heat transfer of the window due to conduction and infiltration then becomes:
= +
QT is the total heat transfer BTU/HR
Qc is the heat transfer due to conduction, BTU/HR
QI is the heat transfer due to infiltration, BTU/HR
(1)
Heat t.ransfer due to infiltration, however, may be a falsely stated value in this equation, due to greater amounts of air leakage of fenestration products at differential temperatures; and, thus, the value for QT may be significantly understated.
3. Maintainability of window performance in the field over time. The overall performance of windows as they relate to air leakage can be questioned, because component materials have a tendency to change with time. Mathematical models such as Arrhenius and Eyring, inverse power law, and superposition principles can be used to describe the change in materials and, correspondingly, the changes in window performance.
The assumption that new windows tested in the laboratory under ideal conditions will perform similarly in the building envelope under non-standard environmental conditions and over the design life of the product can be very misleading to the product specifier and to the consumer.
With more demand than ever before being placed on the window manufacturer by builders, architects, owners and lending institutions, to prove installed performance, requirements for detailed and accurate testing that simulates dynamic field conditions are being forced on the fenestration industry. The National Program Plan (ORNL 1982) for the Thermal Performance Of Building Envelope Systems And lIaterials focuses on these issues. Specifically called for are "improved analytical models for evaluating the performance of fenestration components and accessories, ... the development of improved laboratory procedures for measuring single mode and combined heat transfer rates under a range of simulated conditions and promulgate consensus
873

standards. and conduct research ... on performance characteristics such as ... durability ... n
The development of new testing procedures that more closely simulate the field conditions to Which fenestration products are exposed is currently underway by ASTM. The scope of these tests pertains only to environmental degradation factors and does not take into account physical cycling, operator intervention, or misuse and abuse on the longevity of performance.
Momentum in the fenestration industry is shifting to installed field testing with the advent of new ASTH test procedures for field air and water infiltration tests. New procedures from the American Architectural Manufactures Association (AAHA) for production line testing and physical cycling of windows and their components are also nearing completion.
FIELD PERFORMANCE OF WINDOWS
In a study conducted by the Minnesota Energy Agency for the United States Department of Energy and Lawrence Berkeley Laboratories (Weidt, 1980) the researchers concluded that there were three particulat' causes for the average decline of 291. in air leakage performance of the 192 windows investigated in the TWin cities area. These were:
1. Weather seal discontinuity.
2. Sash fit.
3. Hardware seal.
The researchers concluded that 401. of all the windows tested had higher air leakages than the nationally accepted standard of 0.5 CFM/LFC.
In all three areas the weather seal's ability to make good, solid contact with the mating surface was the underlying cause for the increased air leakage. Weather seal discontinuity refers to seal shrinkage and loss of functional height. The sash fit refers to how the sash mates and aligns with the head, sill and jambs, and is a function of weather seal compression set, or loss of functional height on the seal. Hardware seal refers to how tightly the interlocking stiles and the interface between the jamb, sill, and head stiles fit, which again comes back to weather seal compression ratio. This ratio is calculated by the window manufacturer during the product design stages and often does not take into account:
1. Squareness of sash and frame in field installations;
2. Expansion and contraction of the head, sill, jambs and sasb stiles due to elevated or depressed environmental temperatures;
3. Thermal bowing effects which are also attributable to environmental temperature extremes;
4. Loss of weather seal height from compression set, a function of the sealts material of construction.
other areas in window assembly that may contribute to increased field air leakage are: tightness of corner assemblies; glazing seals; corner seals, if used; sill seals; and permanent deflection of the structural members.
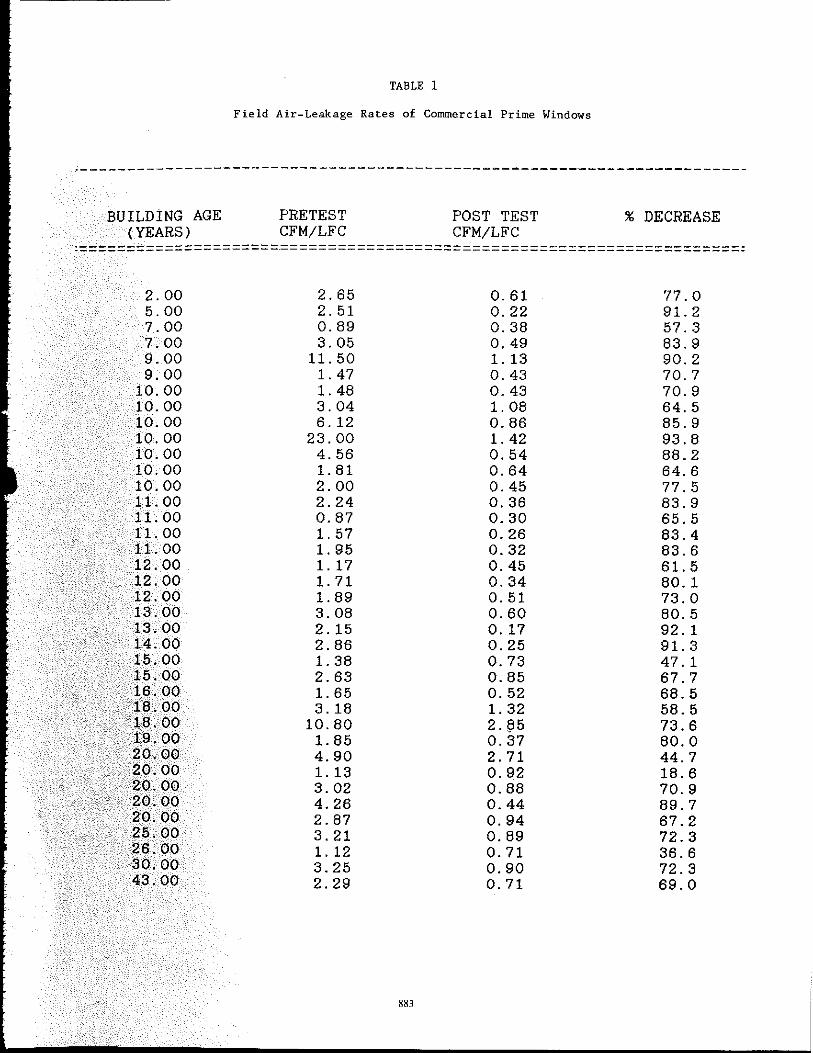
Air leakage data obtained on windows installed in commercial buildings in the upstate New York and Washington, D.C. regions of the country are shown in Table 1. The air leakage of the windows was measured using a portable air leakage apparatus and following the procedure outlined
874

in ASTH E783-84 "Standard Method for Field Measurement of Air Leakage Through Installed Exterior Windows and Doors." The field test procedure was performed in the following manner. The air leakage pre-test was made on a sampling of windows in each building. The windows were then retrofitted with new weather seals as well as recaulking of the frame/wall interface. The windows were then post-tested for air leakage. In every case, the air leakage of the tested units decreased. The data in Figure 1 indicates that as the age of the building/windows increases the relative air leakage rates also increase. The range in building/window age is from two years to forty-three years. There bas been no attempt to correlate the increase in air leakage as a function of material of construction or window type due to the generic performance concept for window standards that is currently being developed and promulgated in the fenestration industry today. This approach is based on window performance in their end use t i.e .• field performance, ratber than on the materials and type of construction and operation. This generic concept is illustrated in the new ASTH standard E10l7-a5 "Standard Specification For Generic Performance Requirements For Exterior Residential Window Assemblies. tt (AAMA is currently developing its own version of a generic window performance standard.)
It becomes readily apparent that when a window is installed in a building envelope and exposed to environmental elements, its performance over time can change substantially. The retrofit data indicate that with new weather seals and limited caulking, the air leakage of the windows can be reduced substantially. In many eases, window performance is actually brought back into line with current industry standards for new window air leakage performance.
-,The question now arises as to the cause for window perfonnance deg["adation in the field and why 'indications of failure are not detectable in the laboratory using currently acceptable test methodologies. The rest of this paper will focus on the current methods used to evaluate window air lea1cage pe["formance in the laborato["y, accelerated aging tests for windows in the laboratory and tests that are used to evaluate weather seal perfonnance.
CURRENT TEST METHODOLOGIES
The current laboratory test for evaluating fenestration air leakage is ASTM E283-85, "standard Method Of Test To Determine The Rate Of Air Leakage Through Exterior Windows, curtain Walls, And Doors.'" In this procedure the specimen is stabilized to the laboratory temperature of approximately 70 F. The window is then installed into an apparatus similar to the one in Figure 2 (ASTII-1985). The apparatus is then pressurized and the air flow into the chamber is measured and recorded. The specimen's air leakage is the flow into the chamber minus extraneous non-specimen leakage. Both the exterior and interior surfaces of the specimen are at the same temperature: laboratory temperature. The specimen leakage is corrected to standard atmospheric conditions and reported as cubic feet per minute per linear foot of operable crack length (CFM/LFC) .
'This method was initially developed to rate air leakage performance of window and doo[" systems against an arbitrary performance level contained in a window standard or established by an architect, specifier, government agency, etc. Shortfalls of this test are:
1. Test results should not be used for building energy consumption analysis because the temperatures at which the window air leakage rate is tested are not the same temperatures at which rate of heat transfer (U-value) tests are performed.
2. Test specimens are new and many times are manufacturers' prototypes and do not necessarily represent production quality.
3. The test is performed at relatively warm laboratory temperatures differential temperatures across the specime-n which is an unnatural rarely. if ever, seen in the field under in-service conditions.
875
with no condition

PROPOSED DIFFERENTIAL TEMPERATURE AIR LEAKAGE TEST
A modified version of ASTM E283-85 is currently being developed at ASTII in the E6. 51. 04 Task Group. This proposed method will allow for multiple differential test temperatures and pressures across the specimen.
In this method the window is mounted into a thermal buck similar to the one used for window heat transfer tests. The thermal buck with specimen is then placed into the divider wall of a thermal test facility similar to the one in Figures 3 and 4 (AAl!A-1980). The exterior face of the test specimen is sealed off with a sheet of 4 mil plastic taped to the frame. This allows for extraneous leakage measurements later in the test. The plastic is applied before the temperature conditioning begins. Five thermocouples are mounted to the interior face of the specimen with tape. These are used during the test to indicate steady state conditions of the specimen. Steady state for this procedure occurs when each surface thermocouple is within ± 2 F of the setpoint for five consecutive readings at ten minute intervals. With a differential temperature across the specimen and steady state conditions having been met, the exterior side of the test apparatus is pressurized to the specified set-point, and the mass flow of air into the chamber is recorded. This quantity represents the extraneous air leakage of the chamber and the buck. The specimen is then opened, the plastic cover removed, and the specimen is closed and locked. The specimen is again temPerature stabilized per the conditions stated above. The chamber is then repressurized to the same set-point, and the mass flow of air is recorded again. This represents the total leakage associated with the chamber and the test specimen. The specimen air leakage is total air leakage minus any extraneous leakage.
The mass flow into the chamber is given by:
II (2)
where
H is the mass flow rate, Ibm/min
Dl is the air density at the flowmeter, lbm/cu.ft.
Q is the volumetric air flow through the flowmeter, cu.ft./min.
The specimen air leakage is thus given by:
Q (3)
Q is the specimen air leakage, cu.ft./min.
M is the mass flow of air into the chamber, Ibm/min.
02 is the density of air at the specimen, lbm/cu.ft.
The density of the air flowing through the specimen is not the same as the density of air flowing through the flowmeter if the apparatus is a pressurized air system. The flowmeter air will be laboratory air at approximately 70 F. The specimen's external ambient air can be any temperature; the data presented in this paper was obtained with the external air temperatures ranging from 0 F to 180 F. The equations above simplify to;
QS = (01 x QF) 102 (4)
876

QS is the specimen air leakage, cu.ft./min.
01 is the flowmeter air density, lbm/cu. ft.
QF is the volumetric air flow through the flowmeter, cu.ft./min.
02 is the air density at the specimen, lbm/cu.ft.
This equation further simplifies to:
QS (TS/TF) x QF (5)
TS is the absolute air temperature flowing through the specimen, R
TF is the absolute air temperature flowing through the flowmeter, R
The difference in air leakage perfonnance of fenestt"ation products using the current ASTM 8283-85 procedure and the modified method is as follows. Elevated or depressed air temperature soaking of the exterior surface of the specimen causes the' materials of construction to expand or contract accordingly. The interior surface of the specimen is maintained at approximately room temperature. The crack perimeter, the location in operable windows and doors where a sliding surface meets a stationary surface and is sealed with weatherstripping, undergoes changes in dimension due to temperatures. This location is also referred to as the mounting distance for the weather seal; design compression ratios for weather seals are direct functions of mounting distance.
Therefore, when the structural members of the specimen change in length due to expansion or contraction and thermal bowing, the mounting distance is correspondingly enlarged or reduced. This causes a change in the effective leakage area of the specimen which alters the air leakage according to whatever the differential temperature is. Therefore the coefficient of thermal expansion of materials used in construction of the window plays a major role in how it will perform in the field under real world conditions. Figure 5 illustrates the changes that occurred in crack perimeter width of an aluminum tilt-out double-hung window. The exterior air temperature of the window ranged from 0 F to 180 F. The interior temperature remained at approximately 12 F. The mounting distance had a measured maximum change of 0.026 inches on the top sash and 0.065 inches on the bottom sash between the temperature extremes. Figure 6 illustrates the mounting distance location of a double-hung tilt-out window, weather seal terminology and the crack perimeter width locations on the same window type.
Figure 7 illustrates the effect of external air temperature on window air leakage. As the external air temperature increases, air leakage decreases due to the decrease in the mounting distance caused by thermal expansion. The effects of differential air temperatures on window air leakage has been further substantiated by (Bersey and Green 1970). Their research concludes that this relationship is a linear function in the form:
I (6)
I is infiltration rate at specified ~ T, cfm/lfc
10 is the infiltration rate at 0 F t. T, cfm/lfc
S is a constant for given window types, leakage vs. temperature
877

~ T is the differential air temperature, F
The researchers also suggest a modified version of the overall coefficient of heat transfer based on conduction and infiltration.
(7)
Ht is the measured heat flow, btu/hr.
Ut is the apparent heat transfer based on specimen air leakage and conductive heat transfer, (BTU/Hr-Ft2-F)
A is the gross area of the specimen, Ft2
Ti is the inside air temperature, F
TO is the outside air temperature, F
The current industry standards for the methodology for heat transfer measurements of fenestration products, AAHA 1503.2 and ASTH C236 and C976, does not take into account air leakage associated with specimens during the test. The differential pressure across the specimen is balanced to 0.000 inches of water colUmn (in. w.c.) during the test. This eliminates the mass transfer effects and, in essence, provides a lower overall coefficient of heat transfer, i.e., the test specimen appears to be better at reducing heat flow than it actually is, regardless of the type of material of which the window is constructed.
A more realistic approach is to have a differential air pressure across the specimen at the time of the heat transfer test. This will account for the heat loss (or gain) due to conduction and infiltration and will provide a more useful test and resultant data to the architect or specifier.
WINDOW FIELD PERFORMANCE OVER TIHE
As was shown earlier, window air leakage performance in the field can be substantially different from values obtained in the testing laboratory. The same window can also change radically in air leakage performance as the window ages in the building envelope. Newly installed windOWS, windows that are one year old and windows ten years old all can have very different air leakage rates associated with them. There is currently no performance standard or test procedure against which window manufacturers can evaluate or certify their products for service life performance. In order to address the problem of performance durability for fenestration products, a reliable and repeatable test method must be readily available to the industry.
ASTH is currently in the process of developing a test procedure that will simulate the types of temperature cycling that fenestration produ~ts experience during their lifetimes. The ASTH E6.22.02 task group is using the ASTH E632, "Standard Practice For Developing Accelerated Tests To Aid The Prediction Of The Service Life Of Building Components And Hateria1s," standard to develop a short-term accelerated temperature aging test for windows. The recommended procedure for using E632 is shown in Figure 8 along with a list of environmental degradation factors that effect building components and materials, Table 2. The accelerated aging concept (Hartin 1982) can mathematically be stated as follows:
F So e(T;s,o) (8)
878

FSi (t) is the life distribution of the accelerated stress level
Fso is the life at the in-service stress level
e(T;s,o) are time transformation functions.
This model is usually applied to physical properties of materials. The ASTH task group, however, is applying the model to the problem of window performance degradation over time.
The first step in developing the accelerated aging test was to determine the range of temperatures that may be encountered in the field by fenestration products of various colors. This was accomplished through data that was obtained from the National Oceanic and Atmospheric Administration (NOAA). Weather data for the continental United states for a 30 year period was obtained. This data includes the highest and lowest temperatures on record. The high is 119 F and the lowest is -52 F. The next step was to determine the amount of solar heat build-up on various colored materials, typically aluminum, vinyl and wood.
Research information and test data from ASTH (Koppes 1982), The Society of Plastics Industry, Inc. (SPI 1985), B.F. Goodrich Co. (Rabinovitch, QUisenberry, Summers, 1983), and PPG (1984) were combined to produce the chart shown in Table 3. This chart shows the relative temperatures that are to be added to the ambient temperatures to obtain the worst case surface temperatures of various colored materials. Based on this chart, the test temperatures for 'painted bronze aluminum and white vinyl windows were obtained. The test data in this paper on elevated and depressed differential temperature ail' leakage and accelerated aging were obtained at exterior ail' temperatures of 180 F for the dark colored windows and 145 F for the lighter colored windows (bronze and white). The low exterior temperature for all tests was 0 F. The interior air temperatures were maintained at room conditions, approximately 70-75 F.
The second step in developing this test was to determine a test cycle short enough to allow ma~ufacturers to use the procedure realistically with minimal laboratory time and expense, but 1911genough to obtain meaningful data.
In accelerated age testing the application of the degradation mechanisms should be intensified to obtain rapid failure without causing shock or destruction. The time of natural eXposure is shortened in the laboratory to allow for multiple cycling of the degradation lli.eeh,an~sms~ Four cycle rates were evaluated, and these are illusrated in Figure 9. Each test produ,(:.ed the same relative results; that is, the air leakage of the windows gradually increased, fr;o!". the start of the test when they were new to the end of the test after multiple temperature ·¢teling. The ail' leakage of the windows in many of the tests exhibited initial values that were at.or below the nationally accepted standard of 0.5 cfm/lfc. At the termination of the tests, "aWever. the same windows were above the acceptable threshold, and some were substantially in 'excess, ,of this standard. In some of the tests, air leakage was measured at various cycles and at; vadous differential ail' temperatures. Ail' leakage during the accelerated aging test ,~Pdi~;lted, the same general increase in overall specimen air leakage from start to termination of ,the test« However, the air leakage vs. temperature profile that was exhibited in earlier tests "revailed.
Figure 10 and 12 illustrate the dramatic change in window ail' leakage as a function of .tempet:ature extremes and cycling (time). The degradation in window ail' leakage is, however, not e.cont~nuous function. All of the tests performed by the task group illustrate that the effects
879

of increased air leakage over time leveled off after a given number of cycles. This plateauing of window air leakage is attributable to the weather seals and other thermoplastic materials used in the window assembly. The weather seals have taken a compression set from the high temperature and change in mounting distance. Other plastic materials have been stress relieved and, therefore, shrinkage has occurred. This leveling off of the window air leakage indicates that the tests do not have to be very long in duration to achieve the desired results. In order to determine the influence that weather seal compression set has on the overall performance degradation of window air leakage, the original weather seals were replaced with a control set at the end of one of the tests. Air leakage was remeasured. Figure 11 indicates that fully 49% of the total air leakage degradation can be attributed to the weather seals. The remaining 51% is due to glazing sealants and corner tightness. The apparatus used to perform the differential temperature air leakage test and the accelerated aging tests can be one and the same. Existing thermal testing facilities in the United states can easily accommodate these types of tests. The insulated glass test apparatus that is referenced in the ASTM E773 standard was also used to perform one of the accelerated aging tests.
DISCUSSION
Two hypotheses have been presented as the cause for the discrepancies in the field performance of fenestration products, namely windows and doors, with respect to air leakage measurements obtained in the laboratory. The first is that the current laboratory test method for air leakage measurements of windows and doors does not account for differential temperatures across the specimen when these products are exposed to varying environmental temperatures; the expansion and contraction of structural members change the effective leakage area, resulting in an increase or decrease in air leakage rates.
Seasonal and diurnal exterior ambient temperature swings are the causes for the dimensional changes in fenestration products of various colors; the darker the color of the product. the higher the exterior surface temperature, due to the effects of solar heat gain. The heat capacity of the material of construction of the product, its ability to dissipate heat (conductance), and the exterior/interior space temperatures all contribute to a temperature gradient across the product. High temperature gradients will produce more thermal stresses on the structural members, thereby creating conditions of thermal bowing. This effect will change the dimensional interrelationships between these members causing changes in the weather seal mounting distances.
The majority of the weather seals used in residential and commercial windows in the United states are a multifilament polypropylene fiber seal generically known as pile weatherstripping. These products are manufactured in increments of 0.010 inch in height. Therefore, the amount of change in weather seal mounting distance need not be very great to affect adversely the weather seal's ability to maintain a design compression ratio.
The second hypothesis deals with the design life of fenestration products and their ability to maintain performance over this period. The conditions associated with the hypothesis will affect the materials of construction of the products over their lifetime. If the materials are adversely affected by environmental elements, they will be major contributors to the loss of the product's ability to perform as originally designed. Durability performance of building materials and components is crucial, since products that are designed to perform specific functions in the building structure and then fail or fall short of expected performance will affect the rest of a building's performance. The interrelationships of the performance functions of building components and systems are complex in nature and cannot be taken lightly if the building is to operate as it was designed. As can be seen in the temperature cycling data for aluminum and vinyl windows, the time necessary for a noticeable change in these products' abilities to maintain original air leakage values is not a long one, less than 200 hours. This does not correlate with a definite time period for in-service use in the field, nor is it intended so. The purpose behind the development of new tests for fenestration products is
880

to allow manufacturers the ability to evaluate components without having to go through the long and sometimes very expensive field testing process that is currently used today. with these new tests, window designers can test their designs for performance longevity, threshold limitations and product failure in the laboratory, before assembly line manufacture begins.
PRODUCT REFINEMENT SUMMARY
The graph in Figure 13 indicates the results in air leakage performance when various samples of weather seals lose their functional height. Two tests Were used to create the data for this graph.
The first test is a compression set test for weatherstripping. In this test, a sample of the weather seal is placed into a steel fixture that compresses the seal to 50% of its height. The fixture is then placed into a convective hot air oven at 158 F for 22 hours. At the end of that timet the fixture is removed from the oven, and the seal removed from the fixture and allowed to recover at laboratory temperature for one half hour. The height of the seal is measured and compared to its original height. The loss of height is recorded as the percent compression.
The second test is an air leakage test for weather seals. The seal is placed into a fixture that measures its ability to resist air leakage at a given pressure. The leakage is recorded as cfm/linear foot. To produce the data in this graph, the weather seals were tested for air leakage rates at 10, 20, 30 and 40 percent compression of their functional heights. The seals were then removed from the air leakage apparatus and placed into the compression set fixture and into the oven for 22 hours. The seals were then removed from the oven, allowed to recover and their compression sets recorded. The seals were then placed back into the air leakage apparatus under the same compression values. The air leakages were recorded again as the increase due to compression set. The data were plotted and the results are as follows: each seal exhibited a loss of functional height. This is the nature of thermoplastic materials. The air leakage increased as the seals lost their height and their ability to maintain contact with the mating surface in the fixture. The three seal specimens were:
1. Multifilament polypropylene pile;
2. Multifilament polypropylene pile with appurtenance;
3. Polyethylene-clad polyurethane foam.
The seal that showed the least amount of compression set and, therefore, the lesser amounts of increased air leakage was the polyethylene clad polyurethane foam seal; the next was the pile with appurtenance. The hypothesis for the seal's performance says that the polyurethane foam is a thermoset material, and therefore, affected by compression and temperature to a lesser degree than the thermoplastic materials. It is the polyethylene film of the third seal that is thermoplastic and the reason for the slight amounts of compression set of this seal. It appears, however, that the performance of this seal is primarily governed by the characteristics of the polyurethane foam.
CONCLUSION
The air leakage performance (and indirectly water and dust penetration, and sound transmission) of fenestration products in the laboratory is based on a single test pressure and temperature. These same products when installed in the building envelope are not likely to perfonn with similar results. The range of envirorunental temperatures and pressures encounted in the field will have significant impact on the near and long term performance of these products.
881

Differential air temperatures imposed on these products in the laboratory indicate a loss of performance (increased air leakage) in very short time spans. Further testing has indicated that most of the performance degradation is attributable to the weather seals; in particular multifiliment polypropylene pile seals with integral polyethylene fin.
The current test method for measuring the air leakage of fenestration products, E283-85, is being modified to allow for the effects that differential temperatures have on air leakage.
A second test is also being developed at ASTM that will measure the short-term effects of temperature cycling on the air leakage performance of windows. This test method simulates diurnal and seasonal temperatures on windows in the laboratory. Test data gathered to date using this proposed test method indicate rapid increases in window air leakage, and sometimes window failures based on the air leakage exceeding the acceptable .370 CFM/LFC threshold. The data obtained from the accelerated temperature aging test will be an indicator of aging but cannot be correlated to a number of years of field service use at this time until experience is gained through industry use of this test. The selection of proper materials in fenestration products is extremely important if such products are to maintain design performance levels and remain within industry threshold standards for new products.
REFERENCES
AAMA, 1980 "Voluntary test method for thermal transmittance of windows. doors. and glazed wall sections," AAMA, 1503.1-1980.
ASTM, 1985 "Building Seals and Sealants; Fire Standards; Building construction" Vol. 04.07.
Bursey. T .. and Green, G.H. 1970 "Combined thermal and air leakag.e performance of double hung windows" ASHRAE Mtg. Kansas City, MO. June 28 July 1, 1970.
Fleury. G .. Thomas. H., 1972 "Variations to window air permeability according to outside temperature." Cahiers Du Centre Seientifique et Technique Du Batiment, No. 132, Cahier 1129, Air Infiltration Centre.
Koppes, W.F. 1972, Design considerations ASTM STP 552 pp. 20-30.
Hartin, J.W. 1982 "Time transformation functions commonly used in life testing analysis" Durability of Building Materials, Vol. 1, No.2, July.
Oak Ridge National Laboratories (ORNL) 1982 "The national program plan for the thermal performance of building envelope SYstems and materials" DOE, Oakridge National Laboratory.
PPG, letter to AAMA Thermal Break Systems Task Group, July 17, 1984, "Metal Surface Temperatures. n
Rabinovitch, E.B.; Quisenberry, J.G.' and Sununet"s, J.W. 1983 "Predicting heat buildup due to the sun's energy" Journal of. Vinyl Technology, Vol. 5, No.3.
Weidt. J .• Weidt, J., 1980 "Air leakage of newly installed residential windows," Lawrence Berkeley Laboratory, LBL-IIIII, 46-94d, EEB-W, 80-12, W-68.
882
BUILDING AGE (YEARS)
TABLE 1
Field Air-Leakage Rates of Commercial Prime Windows
PRETEST CFM/LFC
POST TEST CFM/LFC
% DECREASE
:=====================.================================================:
2.00 2.65 0.61 77.0 5.00 2.51 0.22 91. 2 7.00 0.89 0.38 57.3 7.00 3.05 0.49 83.9 9.00 11.50 1. 13 90.2 9.00 1. 47 0.43 70.7
10.00 1. 48 0.43 70.9 10.00 3.04 1. 08 64.5 10.00 6.12 0.86 85.9 10.00 23.00 1. 42 93.8 10.00 4.56 0.54 88.2 10.00 1. 81 0.64 64.6 10.00 2.00 0.45 77.5 11.00 2.24 0.36 83.9 11. 00 0.87 0.30 65.5 11.00 1. 57 0.26 83.4 11.00 1. 95 0.32 83.6 12.00 1. 17 0.45 61. 5 12.00 1. 71 0.34 80.1 12.00 1. 89 0.51 73.0 13.00 3.08 0.60 80.5 13.00 2.15 0.17 92.1 14.00 2.86 0.25 91. 3 15.00 1. 38 0.73 47.1 15.00 2.63 0.85 67.7 16.00 1. 65 0.52 68.5 18.00 3.18 1. 32 58.5 18.00 10.80 2.85 73.6 19.00 1. 85 0.37 80.0 20.00 4.90 2.71 44.7 20.00 1. 13 0.92 18.6 20.00 3.02 0.88 70.9 20.00 4.26 0.44 89.7 20.00 2.87 0.94 67.2 25.00 3.21 0.89 72.3 26.00 1. 12 0.71 36.6 30.00 3.25 0.90 72.3 43.00 2.29 0.71 69.0
883

TABLE 2
Degradation Factors Affecting the Service Life of Building Components and Materials
Weathering Factors RedsHoD
Solar Nuclear Thermal
Temperature Elevated Depressed Cycles
Water Solid (sueh as, snow, ice) Liquid (such as. rain. condensation. standing water) Vapor (such as, higb relative humidity)
Hormal Air Constituents Oxygen and ozone Carbon dioxide
Air Contaminants Gases (such as, oxides of oitogen and sulfur) Mists (such as, aerosols, salt, acids, and alkalies dissolved in water)
Freeze-thaw Wind
BioloRical Factors Microorganisms Fungi Bacteria
Stress Factors stress, sustained Stress, periodic
Physical action of water, as rain, hail, sleet, and snow Physieal action of wind Combination of physical action of water and wind Movement due to other factors, such as settlement or vehicles
Incompatibility Factors Chemical Physical
Use Factors Design of system Installation and maintenance procedures Normal wear and tear Abuse by the user
TABLE 3
Surface Temperature Heat Build-Up of Colored Materials
MATERIAL COLOR DELTA F
PVC BLACK 74 GREEN 50 BLUE 56 GREY 49 IVORY 45 WHITE 45 BROWN 52 RED 49 TAN 45 GOLD 50 OLIVE 50 YELLOW 36
FIELD MEASUREMENTS ALUMINUM BRON2E 105 150
BLACK 150 191 WHITE 112 145
BLACK 175 NOTE, DELTA F IS THE TEMPERATURE TO BE ADDED TO THE AMBIENT AIR TEMPERATURE
TO OBTAIN THE MAXIMUM SURFACE TEMPERATURE OF EXTERIOR EXPOSED PVC,
884
a

i1 " "-~ $ w
~ w 0 < < ~ " • <:
0
0 AIR CHAMBER 0
0
TEST SPECIMEN
0 0
3 0 0 0 0 0 + 0
fLOW METER + 0 0 0 LEAKAGE
0 0
o 0 0 0 0 0
0 0 o ~ 0 BLOWER + +
0 0
0 + 0 + ,
1 +
+ + + + + t lip + * + + + +
0 MANOMETER n 4 , 12 16 20 24
BUILDING AGE (YEARS) PRETEST AIR lEAKAGE + POST TEST LEAKAGE
Figure 1. Field retrofit test data Figure 2. ASTM E283-85 air-leakage test apparatus
IJE ATH~P /Nt, p.oo~ WARM ROOM
Air Flow 15 MPH
NOTE
DISCHARGE PLENUM l '" Total Pressure Sensor on Pitot Tube
Overall Chamber Length Hay Vary
1. Thermocouples and shields on warm side movable to maintain 3" spacing to test sample.
Figure 3. AAMA thermal test chamber (differential temperature airleakage chamber)
885
Warm Room T.e. & Shield
HOl'iz. Test Sample
Note 1

!>'-o~
0.220
0.200
0.180
0.160
" w 0.140 I
U , 0.120
I
E • 0.100
" ~ 0.080
OC 0
0.060
0.040
0,020
0.000
Figure 4.
180.0
~ B.S./BOnOM
JZ:Zl e..~./TO p
e '01. ,:>AI-J CE.D EOL.'(uR:E'fH.A~
\1o.J$UI.,J:rt,,"TIC""
"N !:.onwOOD PA.lloJ,i'ii:C \<o.o\A.iie. \N"'I"~
Test mask and test sample assembly
ALUMINUM PRIME TILT OUT WINDOW
~
69.5 17.5
EXTERNAL AIR TEMPERATURE ( F ) ~ T.S.;ToP
~ B. s../ .... 'OOL.'E.
3.2
~ T.S./MIOOLI
~ T.S./'OoTTO"'\
Figure 5. crack perimeter width variations
886
l .I
1 I 1 'j
1
j
1

CRACK PERIMETER WIDTH
Design Sketchbook Double hung tilt-replacement
with thermal break These pages show efficient use of pile weather· stripping in a variety of door and window types. The actual designs shown were commissioned by Schlegel Corporation from an independent well-known designer, They are not intended to represent any particular manufacturer's products, and any similarity to windows or doors currently on the market is coincidental.
Pile Profile
Weatherstrip width
Backing
thlckn ...
Pile
Retaining Groove Total groove depth
--+l I-
-I t-Groove height
T.S'/ToY
T.S/MIDDLE -_-f'I
T.S./eOlToM---"'- ~=-::!::::::.=£:;~I;;.;.t_ 'O.s.j-rop
5.S.jtv\\ODLE.
---.J~~=ft~~- B. S/bOlTOtvl
Figure 6. Weatherstrip terminology pile profile
887
Opposing surface

T-"-'--r_~, ~.~ 111 i, i Q' Wi $f"" iii WU; ;=4 2$'
1.000 Q(f)=OELTA T.
0.900
U 0.800 c " '-. ,
0.700 c !0-w ~ 0.600 ~
w u 0.500 ~ ~ ~ w
0.400 " ~
" 3 0.300 0 0 z 0.200 ~
0.100
0.000
~ ~ ~ ~ ~ ~ " ~~ ~ ~ ~ ~ ~ ~ ~
~ ~ ~ ~ ~ ~ ~ ~ ~ .". ~
); ~ ~ ~ ~ :\ ~ ~ V7 ~ ~ ~ ~ ~ ~ ~ /j ~ ~ ~ ~ ~ % ~ ~ ~ % ~ % S: ~ ~ t% ~ ~ ~ ~ ~ ~ ~ ~ ~ ~ ~ r; ~ ~ ~ ~ ~ ~ ~ j; ~ ~ ~ ~ ~ ~ ~
o 20 70
EXTERIOR AIR TEMPERATURE ( F )
[Z2J SEAL TYPE 1 iSS) SEAL lYPE 2 t22ZI SEAL lYPE 3
FiguJ:e 7. Window ail: leakage
7." ~ ~ ); S: ~ ~ /j ~ ~ ~ ~ S: ~ ~
180
~ SEAL TYPE 4
,-P'ROBLEM DEFINITION Sec,ion t>
SeCllon 7
befone In-U~ performancc requIre_ ments Ind ailer;a
Charl(lcrizeihe componca' or material
7.l.lndenU!) crillai performanee characleri~liC$ and propc::nie~ ,hal an serve .~ dClI:fldalion indIcator'
Idemi!) the upc::cled type:: and ran,.e Idenlif) po!<siblt of dc[!.radalion fletors includin,. Ihrn.e L,m"",h.,.""ism,,.., _, ___ _ relateu 10 wcalherinr:. bioloJical. stress, ineompltibiHly. and usc fae-Inn. t 7.1.1
Sec:tron II
Section 9
Sec:tions 10 and II Design and perform prelim,na,) aecckrated ";,,g lC'st\ 10 dC'monSITalc rapid failurc, cau~d b} ind"'idually applied C'~ITeme dC'gn.dallon '.clor\ and 10 eonllrm degradalion mecha-Ini~ms I
--'ii.:rEsTING-------- f- -------------U.2iDesign and perform predictive seT- 13.] De,ilm and perform 10ng-lC'rrn
vic:e JilC' lests using 1he dC'r.radation tC'SIS under Sl:r~ICC condition, laCion of imponanee 10 determine the dC'rendC'ncC' of Ihe rate of deg.a_ dalion on n sure eondilions
13.3
..J:.. QUESTlOi'o', Art IhC' chan~C" in_
<du~d h} rrcd,cl"" ''''''icc hf" 1",1, >-----+ ferrc!>C:nlal"" of lho-c ohl."""d m·
i\C''''c,,'.' ~
y",
N"~ IV -INTERPREI A TlO~ Ai'o'O REPORTING 01- DA 1 A
ScCilon 15
Sc::t:lion If>
ScCiion 17
SecI;nn III
Figure 8.
RCI'C>TI the d~I"
Recommended procedures for developing predictive service life tests
00 00 00

------------------------------------------------------------------------------------------------------------------------------------
TEST MODE NUMBER Of CYCLES
ELEVATED TEMP. SOAK Tm
(HRS. )
ELEVATED TEMP.
(f)
DEPRESSED Tm. DEPRESSED Tm. TEST DURATION SOAK Tm
(HRS.) (fl (HRS.) ====================================================================================================================================
A
C
o
0 • J
"-> , 0
" ~ w
~ ~ J
• < • 0 Q z •
2.000
1.900
1.800
1.700
1.600
1.500
1.400
1.300
1.200
1.100
1.000
0.900
0.800
0.700
0.600
0.500
0.400
0.300
0.200
0.100
0.000
56
18.6
8
6 (2
24 48 96
2
6
21
180 145
180 145
180 145
180 (45
6
2
6
Figuke 9. Vakious time cycles evaluated fOk accelekated aging tests on aluminum and vinyl windows
O(f) "" TIMElEMP
7-/.
~ '// /, /,
Z '/ '/. Z T '/ /. '// ~' /. //. ,,,. // '" //. ,,, " // ." ". '/ '" '/ : . ..: /, '" '/ ''': '/ '" , ..... ' '.,' /, .,,' '" '/ ". ." " '/ ,,'., Z ". /. ~ ..... '
,'., " '" /. ,,, '., ".
/. '" Z S Z X X o 60 120 160 240
~ WINDOW W/PIL£ SEAL HEAT/COLD CYCL£1l!iRS)
~ WINDOW W/CLAO SEAL
Figuke 10. Window aik leakage
889
o 266
o ll6
o 447.6
o 264

r 1.200
1.100
1.000
C , 0.900
J
" 0.800 , , C 0.700
w \ 0.600 , w C.500 c , " < 0.400 W J ,
0.300 , 0.200
0.100
a.DOG
::> x 5 DOUSLE HUNG nLT OUT WINDOW
/; / //
//// / / //, / ///, ////~j
;~~ ~ ~ f~
47 96 HIGH TEMP SOAK TIME (HOURS)
192 192
Figu1:e 11. Sho1:t-tez-m acceler:ated aging test
1.100
1.000
0.900
0.800
0.70Cl
0.600
0.500
0.400
0.300
0.200
0.100
0.090
0.080
" 0 0 0.070 , "-, ,
a.GSO u
w 0.050 \ ,
w 0.040 0
< , , w 0.030 J , ,
0.020
0.010
0.000 I/I\V~'iX
10
~ CLAD SEAL/PRE TEST
rs:::s cum S ..... jPDST TEST
COMPRESSION SET EFFECTS ON AIR LEAKAGE
~ p 20 30
PERCENT COMPRESSION OF SEAl HEIGHT ~ PILE wi APP /PRE TEST
~PlLE. W/_/PoST "TEST
...s I/l\
40
~ PILE PRE/TEST
&>l'iI PICE POSTjresr
Figure 13. Weatherseal air-leakage char-dcteristics
o ~ 00