Embed Size (px)
Citation preview

US Navy Polarimetric Microwave Radiometer
WindSat Data Products
Users’ Manual Sensor & Environmental Data Records
Version 3.0
January 2006
D- 29825

Editor: Ted Lungu
ACKNOWLEDGEMENTS:
The following JPL staff has contributed to the WindSat Science Data Product User’s Manual: Richard Chen. The following individuals also contributed significantly to this document: Peter Gaiser, Michael Bettenhausen, Ian Adams, Elizabeth Twarog and Craig Smith of NRL; and Paul Chang, Zorana Jelenak, Laurence Connor, and Tim Mavor of NOAA/NESDIS.

Table of Contents1 Introduction.................................................................................................................1
1.1 How to Use this Document....................................................................................1
1.2 Conventions ..........................................................................................................1 1.2.1 Units .........................................................................................................................................................1 1.2.2 Resolution................................................................................................................................................2 1.2.3 Wind Direction Convention.................................................................................................................2 1.2.4 Reference Height for Surface Winds..................................................................................................2 1.2.5 Data Flagging and Editing....................................................................................................................2
1.3 Applicable Documents ..........................................................................................2 1.3.1 Related Documents ................................................................................................................................2
1.4 Change Control....................................................................................................3
2 CORIOLIS Mission Overview ....................................................................................4
2.1 Mission Description..............................................................................................4 2.1.1 Mission Requirements...........................................................................................................................5
2.2 Satellite Description..............................................................................................5 2.2.1 Nominal Orbital Parameters .................................................................................................................6
3 WindSat Sensor Overview...........................................................................................7
3.1 Principles of Operation.........................................................................................7
3.2 Instrument Description.........................................................................................8
3.3 Operating Modes ................................................................................................11
4 Data Processing Overview ........................................................................................13
5 Geophysical Algorithms – Overview.........................................................................14
5.1 NRL-2, Retrieval Algorithm ...............................................................................15
6 Geophysical Data Product Content & Format.........................................................19
6.1 Brightness Temperature Quality ........................................................................19
6.2 Sensor Data Record Files (SDR) .........................................................................21 6.3 Environmental Data Record ...............................................................................25
7 Software and Data Conventions...............................................................................32
7.1 File Names ..........................................................................................................32 7.1.1 Sensor Data Record Files....................................................................................................................32 7.1.2 Environmental Data Record Files .....................................................................................................32
7.2 File Organization................................................................................................32
7.3 Coordinate Systems ............................................................................................32
7.4 Data Representation...........................................................................................33 7.4.1 Bit and Byte Format.............................................................................................................................33
8 Acquiring and Extracting the WindSat Science Data.............................................34
8.1 Obtaining the Data .............................................................................................34

8.1.1 WindSat Science Products..................................................................................................................34 8.1.2 Network Access....................................................................................................................................34
8.2 Reading the WindSat Data..................................................................................35
9 Appendices.................................................................................................................36
9.1 PO.DAAC Points of Contact...............................................................................36
9.2 Definitions of Commonly-Used Terms ................................................................37 9.2.1 Abbreviations and Acronyms.............................................................................................................37 9.2.2 Polarimetric Radiometry References and Bibliography................................................................38

WINDSAT DATA PRODUCTS USER’S MANUAL
- 1 -
1 Introduction
The purpose of the WindSat Science Data Product User’s Manual is to assist investigators in making effective use of the WindSat on CORIOLIS Science Data Products, which are produced by the Naval Research Laboratory (NRL) WindSat Project and distributed by the JPL Physical Oceanography Distributed Active Archive Center (PO.DAAC) at the Jet Propulsion Laboratory. This User’s Manual comprehensively describes the content and the format of the data products and gives examples of data usage. In addition, it discusses the WindSat geophysical processing algorithms and how they relate to the data products. An overview of the CORIOLIS mission and an introduction to the operation of the instrument and ground data systems are provided for new investigators. The algorithm and data descriptions presented in this User’s Manual cover the brightness temperature (SDR) and geophysical data products (EDR).
1.1 How to Use this Document
For experienced users of winds data, the key parts of this guide are Sections 3, 5, 6, 7 and 8. Section 3 should be reviewed as it introduces the design and operating characteristics of the WindSat Polarimetric Microwave Radiometer, including key engineering parameters required to understand the data. Section 5 provides a more in-depth summary of the data processing algorithms, with specific references to the data elements in the data products. Section 6 completely describes the contents and the format of the data products from raw to EDR. Section 8 is a practical guide to the use of the WindSat science data, namely how to obtain the data and read the files.
Less experienced or newer users of winds data should read all sections, including the introductory sections of this guide prior to using the data products. Section 2 gives an overview of the mission, including the science requirements and goals, a description of the CORIOLIS spacecraft, the WindSat Polarimetric Microwave Radiometer instrument on the satellite, and a brief description of the overall CORIOLIS ground system segment. Section 4 describes the WindSat Ground Data Processing System (GDPS), and gives a high-level functional walkthrough of the data processing and quality assurance stages. Newer users will find the practical guide given in Section 8 of particular help in getting started on WindSat data.
Ancillary information, of potential interest to all users, is presented in Section 9. The group of appendices, which make up Section 9, covers definitions of commonly used terms, acronyms, and a list of polarimetric radiometry-related references and points of contact via various means.
1.2 Conventions
1.2.1 Units
All quantities reported in the data products data are computed and expressed in MKS units. Distances are reported in meters, speeds in meters per second, and powers in watts (or decibels relative to 1 watt).

WINDSAT DATA PRODUCTS USER’S MANUAL
- 2 -
Antenna azimuths are measured counterclockwise from the spacecraft-heading vector. Beam and cell azimuths and wind directions are in degrees measured clockwise from North. Longitudes are measured eastward and westward from the Greenwich meridian, and range from -180 to 180. Incidence angles are computed relative to the local normal to the Earth ellipsoid.
1.2.2 Resolution
Quoted resolutions for brightness temperature measurements are defined as the dimension of the equivalent-area square footprint, which can be practically estimated as the square root of the cell area.
WindSat on CORIOLIS is capable of generating brightness temperature measurements at a variety of resolutions. These different types of measurements and their derivation are described in Sections 4 and 5.
The WindSat antenna footprint is an ellipse whose size depends on frequency, from approximately 8-km in azimuth by 13-km in the look (or range) direction for the 37.0 GHz frequency to 40- by 60-km for the 6.8 GHz.
1.2.3 Wind Direction Convention
The oceanographic, or flow vector, convention for wind direction is adopted for WindSat. Under this convention, a wind direction of 0° implies a flow toward the north. This is in contrast to the meteorological, or “out of”, convention, for which a “north” wind (0° direction) flows from the north. Conversion between the two conventions is performed by simply reversing the directions (adding 180° modulo 360°).
1.2.4 Reference Height for Surface Winds
The adopted reference height for all wind vectors is 10 meters.
1.2.5 Data Flagging and Editing
The policy adopted within the processing algorithms and software design is to flag values that are out of range or to indicate a non-nominal condition. Except where otherwise noted, a “1” or “set” bit indicates an error or abnormal condition, and a “0” or “cleared” bit indicates a normal condition. Some informational flags may have a number of set bits under normal conditions.
1.3 Applicable Documents
1.3.1 Related Documents
WindSat Experiment Requirements Document (ERD) NCST-D-WS013 Rev. A, 28 Jan 1999

WINDSAT DATA PRODUCTS USER’S MANUAL
- 3 -
1.4 Change Control
This document is maintained by PO.DAAC and will be kept current to reflect changes in algorithms and data products content. Algorithm specifications and software changes are controlled by the WindSat Change Control Board (WCCB).
WINDSAT DATA PRODUCTS USER’S MANUAL
- 4 -
2 CORIOLIS Mission Overview
2.1 Mission Description
Coriolis is a 3-year demonstration/validation mission sponsored by the DoD Space Test Program (STP), the U.S. Navy and the National Polar-Orbiting Operational Environmental Satellite System (NPOESS) Integrated Program Office (IPO). Current plans call for extending the mission as long as Coriolis/WindSat operate sufficiently. Coriolis launched on Jan. 6, 2003, on a Titan II launch vehicle from the Western Test Range at Vandenberg Air Force Base (VAFB).
The primary payload, WindSat, is a multi- frequency polarimetric microwave radiometer developed by the Naval Research Laboratory Remote Sensing Division and the Naval Center for Space Technology for the U.S. Navy and the National Polar-orbiting Operational Environmental Satellite System (NPOESS) Integrated Program Office (IPO). WindSat is designed to demonstrate the viability of using polarimetric microwave radiometry to measure the ocean surface wind vector from space. In addition to potentially providing the Navy with badly needed ocean surface wind vector measurements, WindSat provides risk reduction data that the NPOESS will use in the development of the Conically-scanned Microwave Imager Sounder (CMIS).
The global ocean surface wind vector is a key parameter for short-term weather forecasting, the issuing of timely weather warnings, and the gathering of general climatological data. In addition, it affects a broad range of naval missions, including strategic ship movement and positioning, aircraft carrier operations, aircraft deployment, effective weapons use, underway replenishment, and littoral operations. WindSat measurements will help researchers determine atmospheric forcing, ocean response and air-sea interaction mechanisms on various spatial and temporal scales. Operational users will seek to develop improved methods of assimilating wind data into numerical weather and wave-prediction models. Microwave radiometer wind data, combined with measurements from various scientific disciplines, will help to understand mechanisms of global climatic change and weather.
A secondary payload, Solar Mass Ejection Imager (SMEI) is a science experiment sponsored by the Air Force Research Lab (AFRL) at Hanscom, AFB in Massachusetts. A spacecraft developed by Spectrum-Astro of Gilbert, Arizona, supports both payloads.
The following organizations were involved in the CORIOLIS mission:
OPNAV – N6 (Sponsor) – N096 (Requirements)
NPOESS IPO (Sponsor)
Space Test Program (CORIOLIS Sponsor)

WINDSAT DATA PRODUCTS USER’S MANUAL
- 5 -
SPAWAR PMW180 (Executing Agent)
Naval Research Laboratory (Payload)
Spectrum Astro, Inc. (Spacecraft)
JPL PO.DAAC (Data distribution and archiving).
2.1.1 Mission Requirements
The requirements for wind vector are typically broken down into requirements for Sea Surface Wind Speed (SSWS) and Sea Surface Wind Direction (SSWD). The WindSat top-level performance goals are derived from the NPOESS Integrated Operational Requirements Document (IORD) and are summarized in the table below.
Parameter Uncertainty Range Spatial Resolution
Wind Speed (rms) ± 2 m/s or 20% 3 – 25 m/s 30 km
Wind Direction (rms) selected ambiguity
±20° (5-25 m/s) ±25° (3-5 m/s)
0 - 360° 30 km
In addition to the required ocean surface wind speed and direction, the WindSat system will provide a host of secondary ocean-scene environmental data products. These products are: column integrated Cloud Liquid Water (CLW), column integrated Precipitable Water (PW), and Sea Surface Temperature (SST). The WindSat data also has potential applications for land and ice data products.
The WindSat spatial resolution requirement represents a compromise between meeting the NPOESS CMIS/IORD requirement, staying within the allowable launch vehicle envelope, and minimizing risk and cost associated with post-launch reflector antenna deployment. WindSat does not have operational requirements driving the swath width or global coverage. Rather, the WindSat mission is designed so that a portion of the swath is sampled in both the forward and aft viewing directions. This two-look capability provides an evaluation of the wind direction retrieval accuracy under single and two-look operations. In this manner an assessment will be made of the necessity of such a configuration for an operational system.
2.2 Satellite Description
CORIOLIS is a fully redundant three-axis stabilized spacecraft (nadir pointing) built by Spectrum Astro Inc. of Gilbert, AZ. The S/C bus is based on the SA-200HP catalog bus, an Al honeycomb/Al facesheet deck structure, as flown on Deep Space 1, with specific tailoring to suit the Coriolis requirements. The overall dimensions are: 4.69 m height (without solar array), 1.34 m diameter.
Power is provided by a solar array assembly (dual-junction GaAs solar cells, 1.174 kW at EOL) and a single 50 Ah NiH2 battery for ecliptic period operations. Attitude sensing is provided by autonomous

WINDSAT DATA PRODUCTS USER’S MANUAL
- 6 -
sun acquisition using coarse sun sensors and magnetometers. Actuation is provided by reaction wheels (pitch momentum biased).
GPS-based orbit knowledge is of <100 m, 10 cm/s, all axes. A hydrazine propulsion system is used for orbit transfer.
The S/C has a total mass of 827.4 kg (S/C bus of 377 kg); the design life is three years.
Key features of the Coriolis spacecraft design include:
• extremely low levels of electromagnetic interference for compatibility with the ultra-sensitive WindSat radiometer (e.g., radiated emissions are <6.5 dB µV/m at 6.8 GHz).
• a system architecture to support the 31 rpm yaw spin of WindSat's rotating assembly, while providing power plus precise attitude knowledge and control.
Command and data handling is provided by a VME-based architecture and a MIL-STD-1553B bus. An on-board solid-state recorder of 30 Gbit capacity is provided. TT&C communications are provided in S-band (128 kbit/s downlink, 2 kbit/s encrypted uplink).
Instrument data are downlinked in X-band at 25.6 or 51.2 Mbit/s using CCSDS protocols. The US Navy uses a real-time S-band tactical downlink (256 kbit/s) to distribute radiometer data to deployed fleet units. The Air Force RSC at Kirtland AFB, Albuquerque, NM, provides S/C operations in S-band using the AFSCN (Air Force Satellite Control Network).111
2.2.1 Nominal Orbital Parameters
The nominal orbit for CORIOLIS is defined by the following parameters:
840 km circular
98.7 degree inclination
Sun synchronous
Revisit time of 8 days
Local time of ascending node (LTAN) of 6 PM
Westward-shifting longitude of the ascending node by 138 km daily
WindSat antenna spin about the yaw axis at 31.6 rpm

WINDSAT DATA PRODUCTS USER’S MANUAL
- 7 -
3 WindSat Sensor Overview
WindSat is a polarimetric microwave radiometer developed and built by NRL. The objective of WindSat is to conduct an operational demonstration of the WindSat system and to measure the ocean surface wind vector (speed and direction) for a number of practical applications. Secondary measurements are sea surface temperature, rain rate and water vapor. WindSat also provides insight into such problems as the upwind/downwind asymmetry and boundary layer conditions.
3.1 Principles of Operation
The measurement principle makes use of the natural microwave emissions of the sea surface which vary with the degree of sea surface roughness. The rougher the seas, the more intense are the emissions. The wind direction is obtained from the relationship between the horizontal and vertical polarization characteristics of the received signal and the anisotropic distribution of wind-driven waves. The wind vectors are estimated (model algorithm) by the measurement of multi- frequency polarimetric brightness temperatures.
Microwave radiometry is a well-established technology for remote sensing of the environment. Radiometers, such as WindSat, measure the microwave emission from the field-of-view (FOV) of its antenna. The received energy is a combination of energy emitted from the surface (ocean), radiation from the atmosphere and energy from the sky reflected off the surface. The measured radiation from the surface is known as the brightness temperature. For the surface emission, it is related to the physical temperature by
Where is the brightness temperature in polarization p, e is the scene emissivity, Tphys is the physical temperature of the scene, and (θ, ϕ) represent the viewing geometry. A perfectly absorbing and emitting blackbody by definition has an emissivity of one; therefore, at thermal equilibrium it has a brightness temperature equal to its physical temperature. All other scenes have an emissivity less than one. The emissivity depends not only on the geometry and polarization, but also the physical properties of the medium. In particular, for sea water the emissivity is a function of the water temperature, salinity, and the roughness of the medium’s surface.
It has long been known that the microwave emission from the ocean surface depends on the wind speed at the surface. As the winds increase, the seas become rougher and the microwave emission increases. However, the wind driven waves on the ocean surface are not isotropic; their distribution varies with the wind direction. Therefore, the intensity of the emission depends not only on the wave structure, but also on the orientation of the wind driven waves.
WindSat is the first space borne polarimetric microwave radiometer. As a polarimetric radiometer, WindSat measures not only the principal polarizations (vertical and horizontal), but also the cross-correlation of the vertical and horizontal polarizations. The cross-correlation terms represent the third and fourth parameters of the modified Stokes vector, defined as
WINDSAT DATA PRODUCTS USER’S MANUAL
- 8 -
In this definition, Tv, Th, T45, T-45, Tlc and Trc represent brightness temperatures (radiances) at vertical, horizontal, plus 45°, minus 45°, left-hand circular and right-hand circular polarizations respectively. The Stokes vector provides a full characterization of the electromagnetic signature of the ocean surface, and the independent information needed to uniquely determine the wind direction.
3.2 Instrument Description
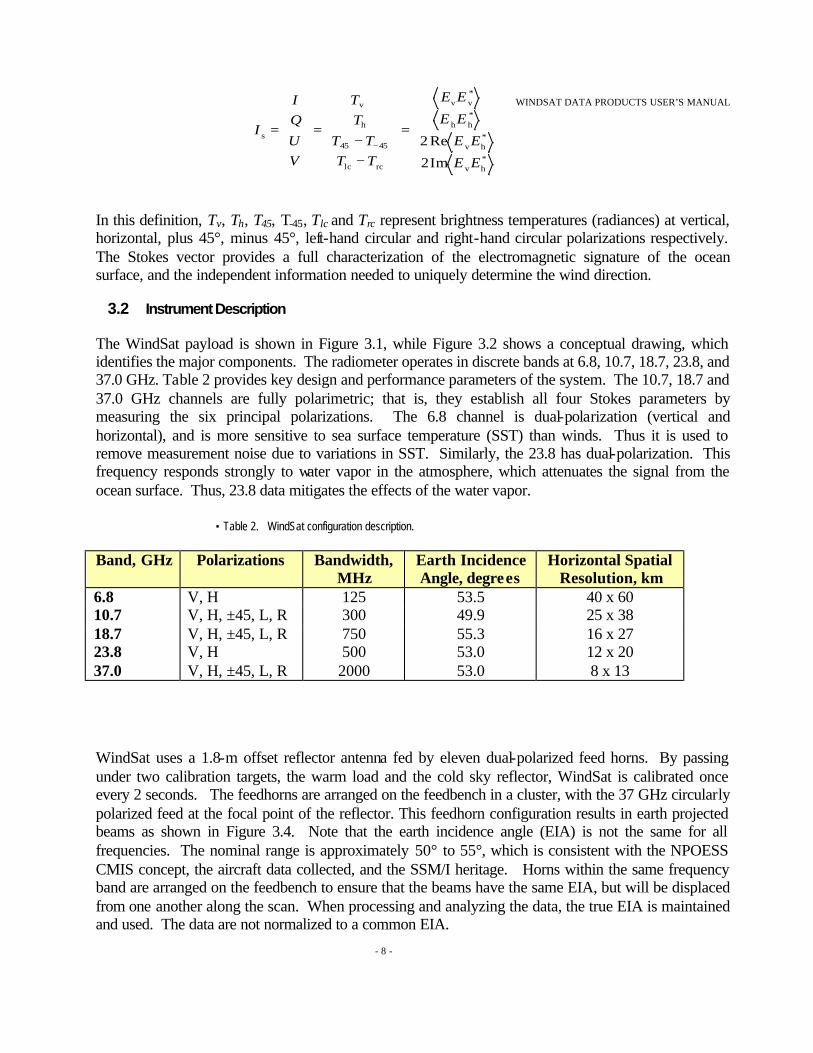
The WindSat payload is shown in Figure 3.1, while Figure 3.2 shows a conceptual drawing, which identifies the major components. The radiometer operates in discrete bands at 6.8, 10.7, 18.7, 23.8, and 37.0 GHz. Table 2 provides key design and performance parameters of the system. The 10.7, 18.7 and 37.0 GHz channels are fully polarimetric; that is, they establish all four Stokes parameters by measuring the six principal polarizations. The 6.8 channel is dual-polarization (vertical and horizontal), and is more sensitive to sea surface temperature (SST) than winds. Thus it is used to remove measurement noise due to variations in SST. Similarly, the 23.8 has dual-polarization. This frequency responds strongly to water vapor in the atmosphere, which attenuates the signal from the ocean surface. Thus, 23.8 data mitigates the effects of the water vapor.
• Table 2. WindSat configuration description.
Band, GHz Polarizations Bandwidth, MHz
Earth Incidence Angle, degrees
Horizontal Spatial Resolution, km
6.8 V, H 125 53.5 40 x 60 10.7 V, H, ±45, L, R 300 49.9 25 x 38 18.7 V, H, ±45, L, R 750 55.3 16 x 27 23.8 V, H 500 53.0 12 x 20 37.0 V, H, ±45, L, R 2000 53.0 8 x 13
WindSat uses a 1.8-m offset reflector antenna fed by eleven dual-polarized feed horns. By passing under two calibration targets, the warm load and the cold sky reflector, WindSat is calibrated once every 2 seconds. The feedhorns are arranged on the feedbench in a cluster, with the 37 GHz circularly polarized feed at the focal point of the reflector. This feedhorn configuration results in earth projected beams as shown in Figure 3.4. Note that the earth incidence angle (EIA) is not the same for all frequencies. The nominal range is approximately 50° to 55°, which is consistent with the NPOESS CMIS concept, the aircraft data collected, and the SSM/I heritage. Horns within the same frequency band are arranged on the feedbench to ensure that the beams have the same EIA, but will be displaced from one another along the scan. When processing and analyzing the data, the true EIA is maintained and used. The data are not normalized to a common EIA.
=
−−
=
=−
*hv
*hv
*hh
*vv
rclc
4545
h
v
s
Im2
Re2
EE
EE
EE
EE
TTTT
TT
VU
QI
I

WINDSAT DATA PRODUCTS USER’S MANUAL
- 9 -
The Coriolis satellite orbits the earth at an altitude of 840 km in a sun-synchronous orbit. The satellite completes just over 14 orbits per day. Figure 3.3 depicts the antenna scan and pointing definitions. The orbit and antenna geometry result in a forward-looking swath of approximately 1000 km and an aft- looking swath of about 400 km. The fully integrated WindSat payload stands ten feet tall and weighs approximately 675 pounds. Orbital average power consumption is 295 watts.
Fig 3.1 WindSat payload in thermal/vacuum chamber. The cold sky reflector calibration target is removed in this photo.

WINDSAT DATA PRODUCTS USER’S MANUAL
- 10 -
Figure 3.2 Drawing of the WindSat payload with major components labeled.
Fig. 3.3 WindSat Scanning Pattern and Pointing Definitions

WINDSAT DATA PRODUCTS USER’S MANUAL
- 11 -
Fig. 3.4 WindSat antenna beam placement on the surface of the Earth. Coriolis flight direction is toward the top of the figure.
3.3 Operating Modes
WindSat operates in two basic modes. The first, used for initial checkout and on-orbit testing, enables data to be collected for the entire scan, including regions where the calibration targets partially obscure the antenna beams. This mode is useful for verifying the radiometer behavior when entering and leaving calibration zones. The data rate in this mode is too high for the onboard data buffers and some data is eventually lost. Thus, this mode is used only temporarily for tests.
The second mode is the nominal mode of operation. In this case, data are excluded from scan regions where the beams transition between data swaths and the calibration targets. This reduces the data rate sufficiently without losing any useable scene data. The scan geometry, location of the occlusion zones and calibration targets allow fore and aft viewing. However, the arrangement of the antenna feeds and resultant scanning of the beams causes the aft swath to contain no 6.8 GHz data. The data release of wind vectors does not include data from the aft scan.
In addition to these basic modes of operation, there are occasional special spacecraft maneuvers, which interrupt normal operations. One of these involves pitching the space vehicle fore and aft 45° so that the main beam points into deep space. This maneuver is valuable for checking the quality of the cold

WINDSAT DATA PRODUCTS USER’S MANUAL
- 12 -
sky calibration data. A second operation involves scanning the entire vehicle about the yaw axis. This is done in support of thermal tests for the SMEI payload.

WINDSAT DATA PRODUCTS USER’S MANUAL
- 13 -
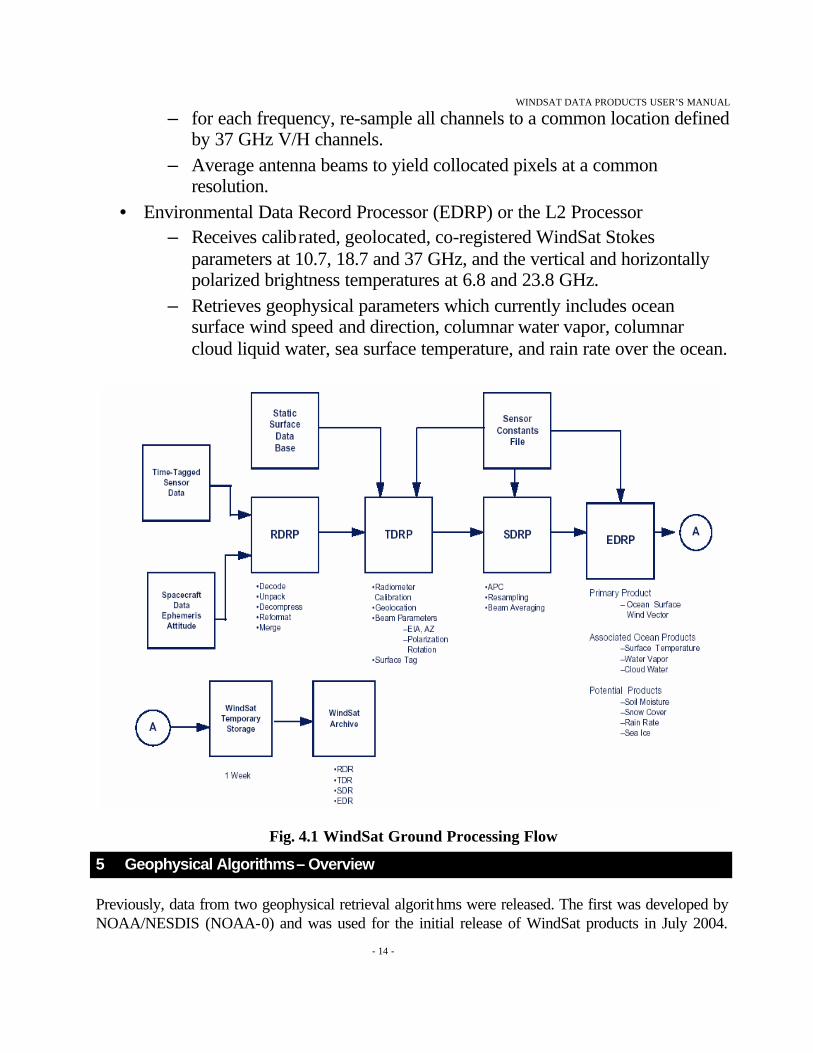
4 Data Processing Overview
This section describes the overall design and functionality of the ground data processing system for the WindSat data from CORIOLIS. The data flow diagram is shown in Figure 4.1.
WindSat produces approximately 200 Mbytes of data per orbit, or 2.8 GB / day.
The Ground Data Processing Software (GDPS) consists of four main processors:
• Raw Data Record Processor (RDRP)
– receives the WindSat data stream, including receiver, calibration, housekeeping and spacecraft attitude data.
– decodes, unpacks, reformats and merges these data.
• Temperature Data Record Processor (TDRP)
– calibrates the raw counts into radiances using the calibration target measurements and the sensor constants file.
- geolocates each channel, using the scan angle, spacecraft attitude and ephemeris and antenna pointing offset.
– calculates various antenna pointing parameters (earth incidence angle, polarization rotation angle, surface compass azimuth angle) using the spacecraft attitude and ephemeris along with pre-launch antenna alignment data.
• Sensor Data Record Processor (SDRP) – Collocate data pixels within frequency bands. At this point, one has all
six polarizations for a polarimetric channel spatially collocated. – forms the third and fourth elements (U and F) of the Stokes vectors by
taking the difference of the appropriate polarization pairs. – Apply the antenna pattern correction (APC) using cross-polarization
correction matrices and feed spillover efficiencies, and correct for the PRA.
WINDSAT DATA PRODUCTS USER’S MANUAL
- 14 -
– for each frequency, re-sample all channels to a common location defined by 37 GHz V/H channels.
– Average antenna beams to yield collocated pixels at a common resolution.
• Environmental Data Record Processor (EDRP) or the L2 Processor – Receives calibrated, geolocated, co-registered WindSat Stokes
parameters at 10.7, 18.7 and 37 GHz, and the vertical and horizontally polarized brightness temperatures at 6.8 and 23.8 GHz.
– Retrieves geophysical parameters which currently includes ocean surface wind speed and direction, columnar water vapor, columnar cloud liquid water, sea surface temperature, and rain rate over the ocean.
Fig. 4.1 WindSat Ground Processing Flow
5 Geophysical Algorithms – Overview
Previously, data from two geophysical retrieval algorithms were released. The first was developed by NOAA/NESDIS (NOAA-0) and was used for the initial release of WindSat products in July 2004.

WINDSAT DATA PRODUCTS USER’S MANUAL
- 15 -
Secondly, WindSat retrievals produced with the NRL-1 algorithm were first made available in March 2005 with version 1.8.1 of the WindSat ground data processing system (GDPS). The NRL-1 algorithm description also applies to subsequent data deliveries generated with NRL version 1.8.x ground software. Full descriptions of these algorithms are available in earlier versions of the user guide.
The current data release contains products generated by the NRL-2 algorithm, which is part of version 1.9.1 of the WindSat GDPS. The NRL-2 algorithm is briefly described here. A more detailed description is provided [Bettenhausen, et al, 2006].
5.1 NRL-2, Retrieval Algorithm
The Naval Research Laboratory retrieval algorithm (NRL-2) for WindSat is a nonlinear optimization algorithm, which simultaneously retrieves wind speed (W), relative wind direciton (ϕR), sea surface temperature (TS), water vapor (V) and cloud liquid water (L) from WindSat brightness temperatures (Tbs). This algorithm is designed to produce four solutions (ambiguities) for each set of WindSat Tbs using a physically-based forward model. The retrieval algorithm uses an optimal estimator which is a Gauss-Newton iterative method with a priori constraints. The iteration used can be written
xi+1 = xa + (Sa- 1 + Ki
T Sy- 1 Ki)- 1 Ki
T Sy- 1 [y - yi + Ki (xi - xa)]
where the subscript i denotes the ith iteration and the superscript T indicates the matrix transpose. In this equation, y is the measurement vector, with error covariance matrix Sy, and x is the state vector of quantities to be retrieved. The state vector is comprised of W, ϕR,, TS, V and L or a subset thereof. The measurement vector is the set of WindSat Tbs used for the retrieval. The a priori constraints are given by the a priori state vector, xa, and the a priori error covariance matrix, Sa. The state and measurement spaces are related through a geophysical model function, or forward model, yi = F(x i). The matrix Ki, called the weighting function or kernel, is the derivative of the forward model with respect to the state parameters, Ki = ?F/?x at x=x i. The kernel is calculated numerically at each stage of the iteration using a centered finite difference scheme. The measurement error covariance matrix, Sy, effectively weights the WindSat channels in the retrievals based on measurement noise and expected forward modeling errors. We use a two-stage retrieval algorithm where the first stage retrieval is performed to provide more accurate a priori values for the second stage. The first stage retrieves TS, W, V and L using only the WindSat Tbs for the vertical and horizontal polarizations. The forward model for the first stage is not a function of the wind direction. Both retrieval stages employ the optimal estimation method outlined above. A diagram of the retrieval process is shown in Figure 3.

WINDSAT DATA PRODUCTS USER’S MANUAL
- 16 -
Simplified flow chart of the retrieval algorithm.
The second stage retrieval solves for all five retrieval parameters and includes the azimuthal wind direction dependence in the forward model. WindSat Tbs for all Stokes parameters are used. The first stage retrievals for TS, W, V , L are used as a priori values for the second stage. We obtain four solutions or “ambiguities” by performing separate retrievals for four a priori state vectors where only the wind direction differs. The ambiguities are ranked by a corresponding χ2 measure with the first rank ambiguity having the lowest χ2 .We apply a spatial vector median filter (MF) to the retrieval cells to correct isolated errors in the ambiguity selection based on the χ2 ranking. The median filter can be initialized using the first rank retrieval from the optimal estimation results or with a “nudged” wind field where a background wind field from an external data source is used to select the first or second rank ambiguity closest to the background field. A NCEP Global Data Assimilation model wind field which has a 1°x1° spatial resolution and is available every six hours is currently used for initialization. The model field is interpolated in space (but not in time) to the location of the WindSat SDRs.
WindSat Forward Model We use a physically-based forward model and then apply empirical corrections to better match the measured Tbs. We have developed a parameterized forward model similar to that described in [9]. The Tbs measured by the satellite are the sum of the upwelling atmospheric radiation, the reflected downwelling atmospheric and cosmic background radiation and the direct emission of the sea surface. The reflected downwelling radiation and the direct emission are attenuated by the atmosphere. The Tbs at each WindSat frequency can be expressed as
)]([, CdownpSpuphv TTrTeTT ττ +Ω++= (1)
)]([4,3 CdownSp TTTeT ττ +−= (2)

WINDSAT DATA PRODUCTS USER’S MANUAL
- 17 -
where Tv,h refers to the Tbs for the vertically or horizontally polarized Tbs and T3,4 refers to the Tbs for the third and fourth Stokes parameters. The sea surface emissivity for polarization p is ep and the corresponding reflectivity is rp = - ep. Tup is the upwelling atmospheric brightness temperature at the top of the atmosphere; Tdown is the downwelling atmospheric brightness temperature at the surface and τ is the atmospheric transmissivity. TC is the cosmic background radiation temperature which is approximately 2.7 K. The Ω term is a correction factor to account for non-specular reflection of the atmospheric downwelling radiation from the rough sea surface[14]. We use a one-layer isotropic atmosphere approximation because the WindSat frequency band set does not provide the information necessary to estimate atmospheric profiles. In addition, the one-layer atmosphere approximation facilitates rapid evaluation of the forward model for the retrieval algorithm. The atmospheric transmissivity is taken to be
)](secexp[ LVO AAA ++−= θτ
where ? is the earth incidence angle and AO, AV and AL are the vertical atmospheric absorptions due to oxygen, water vapor and cloud liquid water respectively. The upwelling and downwelling atmospheric brightness temperatures are parameterized in terms of effective upwelling and downwelling atmospheric temperatures, TU and TD where )1( τ−= Ddown TT and )1( τ−= Uup TT . Values for TU, TD, AO, AV and AL are computed at each frequency so that the parameterized forward model matches a full radiative transfer model. Atmospheric profiles from National Centers for Environmental Prediction Final Analysis (NCEP) are used for the radiative transfer calculations. We use least squares fits to the radiative transfer modeling results in terms of V and L to calculate the atmospheric parameters for each forward model evaluation. We consider the emissivity and reflectivity of the sea surface as determined by a combination of the effects from large scale gravity waves, small scale capillary waves and sea surface foam. We use a two-scale model implementation [Johnson; 2005] to obtain an initial approximation of the sea surface emissivity and reflectivity and then use empirically derived corrections to account for modeling errors and sea surface foam. We have chosen to account for sea surface foam emission using only empirical estimates because there is large uncertainty in current foam coverage models. We have used the Durden-Vesecky model of the sea spectrum with modifications that were made to better match the WindSat brightness temperatures. To develop empirical corrections to the sea surface emissivity we use values for the geophysical parameters from NCEP, QuikSCAT, SSM/I and TMI collocated to WindSat SDRs. We use the values for TS, W, ϕR, V and L from this matchup data set and the two-scale model to calculate a value for emissivity, emodel, atmospheric parameters and Ω . These values for Tup, Tdown , τ and Ω along with the brightness temperatures from the corresponding SDRs and are then used in equations 1 and 2 to solve for the “measured emissivity”, emeasured. We then calculate empirical corrections to the emissivity using least squares fits to the difference between emeasured and emodel for the Tv and Th channels
emeasured - emodel = cj0 + cj1W + cj2 cos(ϕR) + cj3 cos(2ϕR)
For the T3 and T4 channels we calculate an empirical fit of the form
emeasured = cj0 + cj1 sin(ϕR) + cj2 sin(2ϕR)

WINDSAT DATA PRODUCTS USER’S MANUAL
- 18 -
where j denotes the WindSat channel. The corrections for Tv and Th are added to the emodel. For the T3 and T4 channels the correction is applied as a ratio to the result from the two scale model, e.g. cj1 = cj1/cj1,model and cj2 = cj2/cj2,model where the model subscript denotes the harmonic term calculated from the two scale model using the mean TS and W from the wind speed bin and the nominal earth incidence angle. The cj0 term for the T3 and T4 channels is used as a radiometer calibration offset. We have developed empirical corrections to the sea emissivity for wind speeds up to 20 m/s.
Rain Rate Retrieval The WindSat EDRs for version 1.9.0 and later include surface rain rates over the ocean. The rain algorithm employs a multi-channel, physically-based rainfall retrieval procedure [Wilheit, Kummerow and Ferraro] that uses cloud resolving models to produce a large set of possible cloud profiles for a wide range of likely raining conditions. A radiative transfer model generates the respective passive microwave radiances, which are then convolved with approximated WindSat antenna gain functions. These brightness temperatures are classified by freezing height, which can be determined using the 18.7 and 23.8 GHz channels. The retrieval matches the measured brightness temperatures to those generated from the cloud profiles using Bayesian inversion. The probability of a rain profile “R” given a measured brightness temperature is P(R|Tb) = P(R) x P(Tb|R) where Pr(R) is the probability that a particular rain profile will be observed and Pr(Tb|R) is the probability of sensing a brightness temperature given a rain profile. A detailed solution is available in [Kummerow, Olson and Giglio]. WindSat surface rain rates are collocated with the other ocean EDRs. The rain retrieval uses the Tbs for the WindSat channels at their native resolutions. The nominal horizontal resolution of the surface rain rates is 14 km.

WINDSAT DATA PRODUCTS USER’S MANUAL
- 19 -
6 Geophysical Data Product Content & Format
6.1 Brightness Temperature Quality
Retrieval of the ocean surface wind vector and sea surface temperature require accurate, well calibrated brightness temperatures. The WindSat calibration and validation effort has identified several factors that reduce the quality of some of the ocean Tbs in the SDRs. These factors are described in this section. For the version 1.9.0 data release, corrections or quality control flagging for these factors is done in the EDRP. The Tbs in the SDRs are currently NOT adjusted or calibrated to match a radiative transfer model. Future versions of the WindSat ground data processing system will incorporate some or all of the corrections and quality control flagging into the SDRs.
Land Contamination The version 1.9.0 WindSat SDRs have an effective footprint of about 40 km along-scan and 60 km along-track. The resampling and averaging uses measurements which observe areas outside this effective footprint to produce the Tbs in the SDRs. The fraction of power received from areas well outside the 40 km by 60 km footprint is normally small over the open ocean. However, because the surface emissivities for land are higher than they are for the ocean at the WindSat frequencies, radiation observed from land contamination can significantly increase the Tbs even when the land is well beyond the 40 km by 60 km footprint. This land contamination effect increases with decreasing frequency and primarily affects the retrieved wind speed and sea surface temperature. The EDRs are, therefore, flagged for land contamination within approximately 105 km of land as identified in the WindSat surface type database.
Satellite Attitude Transients The measurements resampled and averaged to a common location to produce the Tbs at the SDR level are collected over a time period of about 40 seconds for all channels and over periods that vary from about 9 to 21 seconds for single channels (increasing with frequency). The resampling and averaging algorithm utilizes static coefficients based on along-scan and along-track increments that vary only with the scan position (downcount number). Changes in the attitude of the Coriolis spacecraft over the resampling and averaging time periods are negligible under normal operation. However, intermittent transients occur where the spacecraft attitude changes are significant. The collocation of the Tbs and the corresponding averaging of pointing angles are distorted during the transients. The SDRs during these periods cannot be used to produce accurate retrievals of EDRs. About 0.5 percent of the data is affected. These transients are currently flagged in the EDRs using ratios of the earth incidence angles (EIAs) at different frequencies. The EDRs are flagged for any record where any of the following conditions are true:
EIA_18.7 / EIA_37 < 1.042
EIA_18.7 / EIA_37 > 1.047

WINDSAT DATA PRODUCTS USER’S MANUAL
- 20 -
EIA_10.7 / EIA_37 < 0.9403
EIA_10.7 / EIA_37 > 0.9428
where the EIAs are in radians.
10.7 GHz Radio Frequency Interference The WindSat 10.7 GHz channels are affected by radio frequency interference (RFI) for ocean scenes around Europe in the descending pass and off the eastern coast of South America in the ascending pass. The RFI is strongest in the Mediterranean Sea but it can degrade sea surface temperature and wind speed retrievals over larger areas. This RFI is from the downlinks of some geostationary television broadcast satellites that reflect from the ocean surface. The RFI locations and strength are quite persistent for every satellite overpass with similar observation geometry. A geographical mask is used to flag regions for the appropriate pass where RFI is likely to be present.
Along-scan Variations There are variations in the WindSat Tbs which are only a function of scan position. The extreme cases are at the left edge of the forward swath for the 6.8 GHz and at the right edge of the swath for the 23.8 GHz. For the respective outermost pixels, the effect for the 6.8 GHz V-pol is on the order of several Kelvin and the effect for the 23.8 V-pol is on the order of a few Kelvin. These edge-of-swath effects are likely due to interference from mechanical structures or the calibration loads on the WindSat instrument. There are also along scan variations which are approximately linear with scan angle. These variations are most significant in the 18.7 GHz third Stokes Tbs but they are present to a smaller degree in other channels. These variations are likely due to small errors in the cross-polarization corrections. Additive corrections have been derived for the along scan variations using the difference between measured Tbs and Tbs using a radiative transfer model for ocean scenes. The along scan variations are dependent on of the magnitude of the scene Tbs; so, the derived corrections are only applicable to ocean scenes.
In addition to along scan variations, third and fourth Stokes Tbs in the SDRs are not zero-mean, in contrast to predictions from radiative transfer modeling. These offsets are likely due to non-common mode calibration errors and/or small errors in the cross-polarization corrections. Fortran and IDL routines for calculating the along scan corrections with the third and fourth Stokes offsets are available with the sample routines for reading WindSat data.
Warm Load Thermal Gradients The WindSat receivers are calibrated each scan by using a two-point calibration method where the feedhorns pass beneath stationary warm and cold targets located above the WindSat deck. The physical temperature of the warm load is measured by six platinum resistance thermometers (PRTs) embedded in the aluminum base. A calibration problem arises when the physical temperature of the base is different from the radiometric temperature of the warm load surface viewed by the radiometers. Solar illumination reflected onto the face of the warm load and cooling during satellite eclipse can create thermal gradients in the warm load between the load surface and the load base. The PRTs do not accurately reflect the physical temperature of the surface of the load when these thermal gradients

WINDSAT DATA PRODUCTS USER’S MANUAL
- 21 -
are present. Consequently, brightness temperatures calculated using these PRT measurements are inaccurate. The errors in the Tbs may be up to 2 K.
The worst case Tb errors due to warm load thermal gradients are centered around the summer solstice, due to the angle between WindSat and the Sun, with a secondary season near the winter solstice. The feedhorns for the WindSat frequency bands view different regions of the warm load; therefore, Tbs errors in one band will have different magnitudes and temporal characteristics from another. Starting in April, these warm load calibration errors appear first in the 18.7 GHz channels, which see the bottom, or inboard portion of the warm load, followed by the 37, 23.8 and 6.8 GHz channels, and then finally by the 10.7 GHz channels, which see the top or outboard portion of the load. After the solstice, the problem first disappears in the 10.7 GHz channels, followed by the others in reverse order.
Work to correct the warm load calibration during periods when warm load thermal gradients are significant is ongoing. The version 1.9.0 EDRP retrieval algorithm has been modified to mitigate the effects of the warm load calibration errors on the wind vector retrievals. The algorithm uses ratio and differences of the 6.8 GHz and 18.7 GHz vertically and horizontally polarized channels. The largest residual effects on the retrievals are biases in the sea surface temperature and water vapor retrievals near the summer solstice.
6.2 Sensor Data Record Files (SDR)
The Sensor Data Record (SDR) file contains calibrated, collocated, averaged brightness temperatures for all WindSat channels. The file is composed of data records spaced in time for every fourth 37 GHz VH measurement along scan and every scan along track. This results in approximately a 12.5-by-12.5 km grid locally.
The SDRP reads the TDRs and applies the antenna pattern correction, including spillover. The SDRP also corrects for polarization rotation angle (PRA) variations, which change the polarization basis of the antenna. The data from each frequency band are then resampled to the 37 V/H locations. At this stage, the data are in the form of collocated four-element modified Stokes vectors for 10, 18 and 37 GHz; the 6 and 23 channels are in two-element (V, H) vectors. The data are then averaged to a common spatial resolution. The file extension indicates the averaged spatial resolution, e.g., *.sdr68 is an SDR file with common cell sizes at 6.8 GHz resolution. Note that this file contains data for all frequencies, as described in the format statement below. The file extension merely indicates the basis of the target spatial resolution.
The swath of the SDR data is defined as the common swath of all channels at 10.7, 18.7, 23.8 and 37.0 GHz. Because of the feed placement and resulting antenna beam scanning, the 6.8 swath is offset from the other channels. Therefore, approximately one-fourth of the forward swath does not include 6.8 GHz data. The 6.8 fie ld in this region contains NOVALs (-9999). For similar reasons, the aft swath contains almost no 6.8 data.
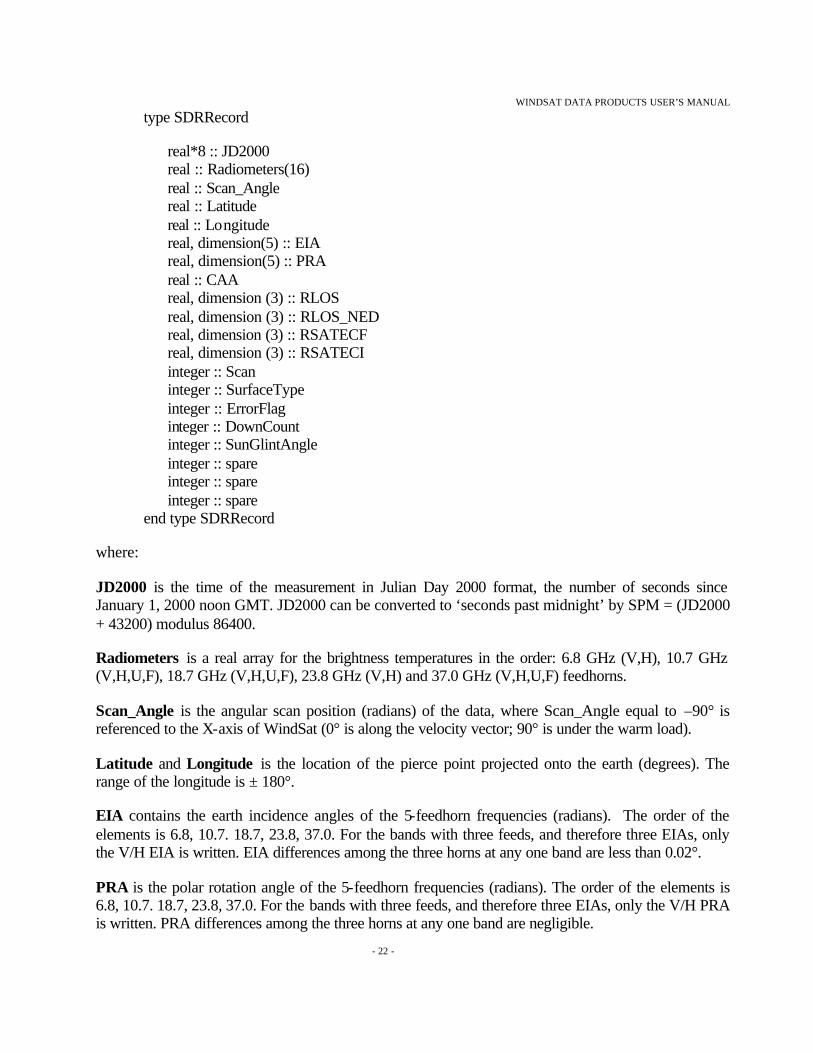
The contents of the SDR record are as follows:
WINDSAT DATA PRODUCTS USER’S MANUAL
- 22 -
type SDRRecord
real*8 :: JD2000 real :: Radiometers(16) real :: Scan_Angle real :: Latitude real :: Longitude real, dimension(5) :: EIA real, dimension(5) :: PRA real :: CAA real, dimension (3) :: RLOS real, dimension (3) :: RLOS_NED real, dimension (3) :: RSATECF real, dimension (3) :: RSATECI integer :: Scan integer :: SurfaceType integer :: ErrorFlag integer :: DownCount integer :: SunGlintAngle integer :: spare integer :: spare integer :: spare
end type SDRRecord
where:
JD2000 is the time of the measurement in Julian Day 2000 format, the number of seconds since January 1, 2000 noon GMT. JD2000 can be converted to ‘seconds past midnight’ by SPM = (JD2000 + 43200) modulus 86400.
Radiometers is a real array for the brightness temperatures in the order: 6.8 GHz (V,H), 10.7 GHz (V,H,U,F), 18.7 GHz (V,H,U,F), 23.8 GHz (V,H) and 37.0 GHz (V,H,U,F) feedhorns.
Scan_Angle is the angular scan position (radians) of the data, where Scan_Angle equal to –90° is referenced to the X-axis of WindSat (0° is along the velocity vector; 90° is under the warm load).
Latitude and Longitude is the location of the pierce point projected onto the earth (degrees). The range of the longitude is ± 180°.
EIA contains the earth incidence angles of the 5-feedhorn frequencies (radians). The order of the elements is 6.8, 10.7. 18.7, 23.8, 37.0. For the bands with three feeds, and therefore three EIAs, only the V/H EIA is written. EIA differences among the three horns at any one band are less than 0.02°.
PRA is the polar rotation angle of the 5-feedhorn frequencies (radians). The order of the elements is 6.8, 10.7. 18.7, 23.8, 37.0. For the bands with three feeds, and therefore three EIAs, only the V/H PRA is written. PRA differences among the three horns at any one band are negligible.

WINDSAT DATA PRODUCTS USER’S MANUAL
- 23 -
CAA is the compass azimuth angle at the pierce point (radian). North equals 0°, and the CAA increases clockwise.
RLOS is the line of site vector (meters).
RLOS_NED is the line-of-site vector in the north-east-down coordinate system (meters).
RSATECF is the location of the satellite at the 37-GHz VH measurement in the Earth Centered Fixed coordinate system (meters).
RSATECI is the location of the satellite at the 37-GHz VH measurement in the Earth Centered Inertial coordinate system (meters).
Scan is the number of BAPTA spins since the start of the data file. This number is incremented when a sync mark is crossed
SurfaceType is an integer value where:
0 = LAND 1 = NOT USED 2 = NEAR COAST 3 = ICE 4 = POSSIBLE ICE 5 = OCEAN 6 = COAST 7 = SPARE
ErrorFlag is a bit pattern indicating errors in the processing or quality control flags. The table below gives the definit ion of the error flag. The cold load error flag was added in release 1.5.0 and modified to cover all bands as a patch to 1.5.1.
SDR_QC_Flag
Bit Significance 0-7 Dual Frequency Rain Flag (value from 0 to 101) 8 forward/aft scan (bit set to 1 for forward part of
scan, 0 for Aft scan ) 9 ascending/desending orbit flag (1 for ascending, 0

WINDSAT DATA PRODUCTS USER’S MANUAL
- 24 -
for descending) 10 Ignore 11 Gains Applied (1 = Gains applied to data, 0 =
gains could not be applied) 12 Glare angle (sun glint) invalid because no sun
vector or LOS doesn't pierce earth if set to 1 13-18 Glare Angle (glare angle goes 0 to 30 for 0 to 60
degree, 31 is > 60 deg, 32 is invalid) 19-23 Cold Load Flag (1 if RFI or moon contamination
present in scan). This flag indicates that the cold sky calibration data was contaminated with RFI or lunar intrusion. There is one bit for each frequency band (6.8: bit 19; 10.7: bit 20;…37.0: bit 23) RFI and lunar contamination introduces a small error in the radiometer calibration. The effect of this error is much smaller than the warm load calibration error. At the time of this version, mitigation algorithms are in development.
24-28 Frequency specific warm load flag indicating presence of thermal gradients on the warm load which introduce biases. There is one bit for each frequency band (6.8: bit 24; 10.7: bit 25;…37.0: bit 28) . This version of the flag underreports the anomaly.
DownCount is the 37 GHz VH downcount number associated with this measurement and pixel location.
SunGlintAngle are the solar angles for the VH channels packed into a one 32-bit integer using 5-bit integers. Values of the 5-bit integer have a resolution and a bin size of 2 degrees with 0 for the bin from 0 to 2 degrees, 1 from 2 to 4 degrees, etc. A value of 30 indicates a sun glint angle greater than 60 degrees and a value of 31 indicates that the TDRP was not able to calculate the sun glint angle. Only the 25 lowest order bits will be used, as shown below.
Bits Frequency 0-4 6.8 5-9 10.7 10-14 18.7 15-19 23.8 20-24 37.0
Spare(1, 2, 3) are three long integers reserved for later use.

WINDSAT DATA PRODUCTS USER’S MANUAL
- 25 -
6.3 Environmental Data Record
The Environmental Data Record (EDR) file contains geolocated wind vector retrievals. In addition to the selected wind vector, the first four ambiguities are provided (or as many as were retrieved) along with the ranking statistics. Other retrieved parameters include sea surface temperature, integrated water vapor, integrated cloud liquid water, and rain rate. These parameters were retrieved in support of the wind vector retrieval. The file is composed of data records spaced in time for every fourth 37 GHz VH measurement along scan and every scan along track. This results in approximately at 12.5-by-12.5 km grid locally. In this dataset the WindSat channels were averaged to a common footprint determined by the 6.8GHz channel. This results in a spatial resolution of approximately 50km along scan for the WindSat footprint. Only data points over the ocean are included in the EDR data records. The EDR contains the SDR record number, which can be used to associate EDRs with SDRs. Note that SDRs for all surface types are reported.
The EDR file is a binary file written as a FORTRAN direct access file, with FORTRAN 90 structure for each EDR record. Missing/Invalid data: Missing or invalid data, and the values of the spares, will be set to –9999. This value will never be found in valid data. The contents of the EDR record are as follows:
type EDRRecord real*8 :: JD2000 real :: Latitude real :: Longitude real :: Scan_Angle real :: EIA real :: CAA integer*4 :: Scan_Number integer*2 :: Downcount_Number integer*2 :: SurfaceType integer*4 :: SDR_QC_Flag integer*4 :: SDR_Record_Number integer*1 :: sstErr integer*1 :: wspdErr integer*1 :: vaporErr integer*1 :: cloudErr real :: SST real :: Water_Vapor real :: Cloud_Liquid_Water integer*2 :: Number_of_Ambiguities integer*2 :: Selected_Ambiguity real, dimension (4) :: Wind_Speed real, dimension (4) :: Wind_Direction

WINDSAT DATA PRODUCTS USER’S MANUAL
- 26 -
real, dimension (4) :: Chi_Squared real :: Model_Wind_Speed real :: Model_Wind_Direction integer*4 :: EDR_QC_Flag 1 integer*4 :: EDR_QC_Flag 2 real :: Rain Rate integer*1, dimension(4) :: phiErr
end type EDRRecord where:
JD2000 is the time of the measurement in Julian Day 2000 format, the number of seconds since January 1, 2000 noon UTC. JD2000 can be converted to ‘seconds past midnight’ by SPM = (JD2000 + 43200) modulus 86400
Latitude and Longitude is the location of the pierce point projected onto the earth (degrees). Range of the longitude is ± 180°.
Scan_Angle is the angular scan position (radians) of the data, where Scan_Angle equal to –90° is referenced to the X-axis of WindSat (0° is approximately along the spacecraft velocity vector; 90° is under the warm load). Units are radians.
EIA contains the earth incidence angles of the 37 GHz channels. Units are radians.
CAA is the compass azimuth angle at the pierce point (radian). This represents the WindSat look-direction relative to the local meridian. North equals 0°, and the CAA increases clockwise.
Scan_Number is the number of BAPTA spins since the start of the data file. This number is incremented when a sync mark is crossed. (The BAPTA is the scan drive mechanism on WindSat.)
Downcount number is a short integer containing the 37 GHz VH sample number associated with this measurement for this scan. Downcount numbers count downward and reset once per scan. The fore swath data covers a downcount range of 800 to 1116. For the EDRs, the downcounts decrement by four, because the pixel locations correspond to every fourth 37 GHz sample.
SurfaceType is a short integer value where:
0 = LAND 1 = NOT USED 2 = NEAR COAST 3 = ICE 4 = POSSIBLE ICE 5 = OCEAN 6 = COAST 7 = SPARE
SDR_QC_Flag is a bit pattern indicating errors in the processing or quality control flags. This

WINDSAT DATA PRODUCTS USER’S MANUAL
- 27 -
flag is set in the SDRP and passed through the EDRP for informational purposes. Refer to Section 6.1 for a complete description of the SDR_QC-Flag. SDR_Record_Number is the number of the corresponding SDR record for a given EDR record. Having this value enables easy comparison with SDRs or SDR-based match-up data sets.
sstErr, wspdErr, vaporErr, cloudErr are the estimated retrieval error covariances for the first rank ambiguity for SST, wind speed, water vapor and cloud liquid water respectively. They are as unsigned one-byte integers.is a real field reserved for later use. A value of 255 is used to denote that the retrieval error covariance is invalid or not meaningful (such as when a retrieval is not performed). Multiply by sstErr by 0.05 to convert to K. Multiply wspdErr by 0.05 to convert to m/s. Multiply vaporErr by 0.05 to convert to mm. Multiply cloudErr by 0.002 to convert to mm.
SST is the retrieved sea surface temperature in K.
Water_Vapor is the retrieved integrated columnar water vapor reported in mm.
Cloud_Liquid_Water is the retrieved integrated columnar cloud liquid water in mm.
Number_of_ambiguities is a short integer containing the number of wind direction ambiguities retrieved. When set to 0, this indicates that no directional ambiguities were retrieved.
Selected_ambiguity is a short integer containing a pointer to the ambiguity selected by the ambiguity selection algorithm. It contains values 0,1,2 and 3 where 0 value points to first ranked ambiguity, 1 points to 2nd ranked etc. This variable should be used together with number of ambiguities.
Wind_Speed is a four element real array containing up to four wind speeds corresponding to the wind direction ambiguities. The wind speeds are listed in order of the wind direction ambiguity ranking. If fewer than four ambiguities are retrieved, the remaining fields are set to -9999. For example, when the number of ambiguities is 2, the 3rd and 4th elements of this array are set to -9999. Units are m/s and all wind data are referenced to 10-m height.
Wind_Direction is a four element array containing up to four wind direction ambiguities. The wind directions are place in the array in order of rank. If fewer than four ambiguities are retrieved, the remaining fields are set to 0. For example, when the number of ambiguities is 2, the 3rd and 4th elements of this array are set to 0. Units are degrees with 0° representing north and increasing clockwise. The wind direction convention is oceanographic, i.e., wind direction of 90° is blowing toward the east. As with wind speed, the direction is referenced to 10-m height.
Chi_Squared is a four element array containing the chi-squared, or similar metric, of the wind vector retrieval, which is used for ranking the ambiguities. These values can be used to calculate chi squared probabilities using 14 degrees of freedom when the 6.8 GHz measurements are available and 46.9 otherwise. The ratio of the chi squared probabilities for the different ambiguities provides an estimate of the relative probabilities for each ambiguity. The chi squared probabilities are not accurate measures of the relative probabilities for different retrievals since the appropriateness of the estimated measurement error covariance matrix and the accuracy of the forward model, which are used to compute the chi squared, varies significantly with wind speed and atmospheric conditions.

WINDSAT DATA PRODUCTS USER’S MANUAL
- 28 -
Model_Wind_Speed is the wind speed that corresponds to the wind direction used for initialization of the ambiguity selection routine.
Model_Wind_Direction is the wind direction used for initialization of the ambiguity selection routine.
EDR_QC_Flag1 is a 32 bit long integer used to describe the “quality” of a number of radiometric and radiometrically determined geophysical parameters, as well as indicating the conditions under which the retrieval was performed. The quality is indicated by the setting of specific bits based on the range in which these various parameters fall. As a general rule, a bit set to “1” means “bad”, while a bit set to “0” means “good”. EDR_QC_Flag1 is described in more detail beginning on the next page. EDR_QC_Flag2 is a spare retrieval quality flag. It is currently reserved for use in retrieval algorithm development.
Rain_Rate is the retrieved rain rate over the ocean in mm/hour at a horizontal spatial resolution of 14 km.
phiErr is a four-element array containing the estimated wind direction retrieval error covariance for each ambiguity stored as an unsigned one-byte integer. A value of 255 is used to denote that the retrieval error covariance is invalid or not meaningful (such as when a retrieval is not performed). Multiply by 0.2 to convert to degrees. EDR_QC_Flag1 description (NRL-2): This EDR QC Flag 1 description provided here applies to the NRL-2 data release, which used WindSat GDPS version 1.9.0. EDR QC Flag 1 definitions are consistent with those from the previous data release. EDR_QC_Flag1 is populated as described in the table on the next page. The flags that are most likely to indicate conditions that will degrade retrievals are: EDR rain flag, ice flag, RFI flag, land contamination, inland lakes and seas and sheltered bodies of water and beam averaging threshold (bits 3, 5, 6, 7, 9 and 19). These flags are grouped together in the “Low confidence flag”, bit 1, which along with bit 0 can be used to screen retrievals for most uses. Additionally the “Low confidence flag” is set when the Chi_Squared value for the first rank retrieval exceeds a threshold value. This threshold is currently set to 48.1 when the 6.8 GHz measurements are available and 46.9 otherwise (these values are chosen based on chi squared probabilities). There are also low confidence bits for each of the individual EDR's which will be set when conditions may reduce the accuracy of the retrieva l for that EDR. An example would be high water vapor may reduce wind direction accuracy even if the water vapor retrieval accuracy is acceptable. The criteria for setting the low confidence bits for the inidividual EDR's may vary with the retrieval algorithm and is likely to change as the retrieval algorithms and brightness temperatures are improved.

WINDSAT DATA PRODUCTS USER’S MANUAL
- 29 -
The contents of the flag are given in the table at the end of this document. Additional information for some of the flags is given below.
EDR Rain Flag: Observations where the retrieved integrated cloud liquid water is greater than 0.2 mm are flagged for rain. SDR Rain Flag: Rain is considered to be present by the condition 37V - 0.979*37H < 55.0 OR 1.175*18V – 30.0 > 37V OR 18H > 170.0 OR 37H > 210 This rain flag was developed for Stokes vector analysis and model development. It was based on similar flag used for SSM/I cal/val. The flag was tested against the SSM/I rain flag. Because this flag was developed for model development, it is conservative, i.e., sensitive, to ensure that as little rain as possible was in the training data sets. As such, the algorithm flags not only rain, but also flags some regions of high cloud liquid water or high columnar water vapor. Geographic Boundaries Flag: Geolocation places SDR surface point in one of several geographic regions that might be unsuitable for surface wind (or other edr) retrievals due to ice, salinity variations, etc. These include Lakes and Inland Seas: 1.) Great Lakes, 2.) the Black, Aral, Caspian Seas and inlet in the Mediterranean, 3.) Lake Victoria and surrounding lakes, 4.) Lake Baikal. Also included are regions where Salinity is far from the norm and/or surrounded by land: 1.) Top of Baja (above Tiburon Island), 2.) Baltic and area between Sweden and Finland, 3.) Red Sea, 4.) Persian Gulf. Warm Load Anomaly: Not used at this time (see section 6.1). Land Contamination: Prior to performing retrievals, individual WindSat pixels are averaged together to reduce the measurement noise and to match antenna beams at all frequencies. This flag indicates regions where the pixels with significant land contamination have been averaged in with ocean pixels. This results in erroneous brightness temperatures. RFI: This flag indicates when RFI is likely to affect the 10.7 GHz brightness temperature measurements. The primary known source is the downlink from some TV broadcast satellites which reflects off the ocean surface. The regions flagged are around Europe in the descending pass and off the eastern coast of South America in the ascending pass. Satellite Attitude Transient : There are anomalies in the WindSat data caused by rapid changes in the satellite attitude. These transients cause poor spatial matching of the
WINDSAT DATA PRODUCTS USER’S MANUAL
- 30 -
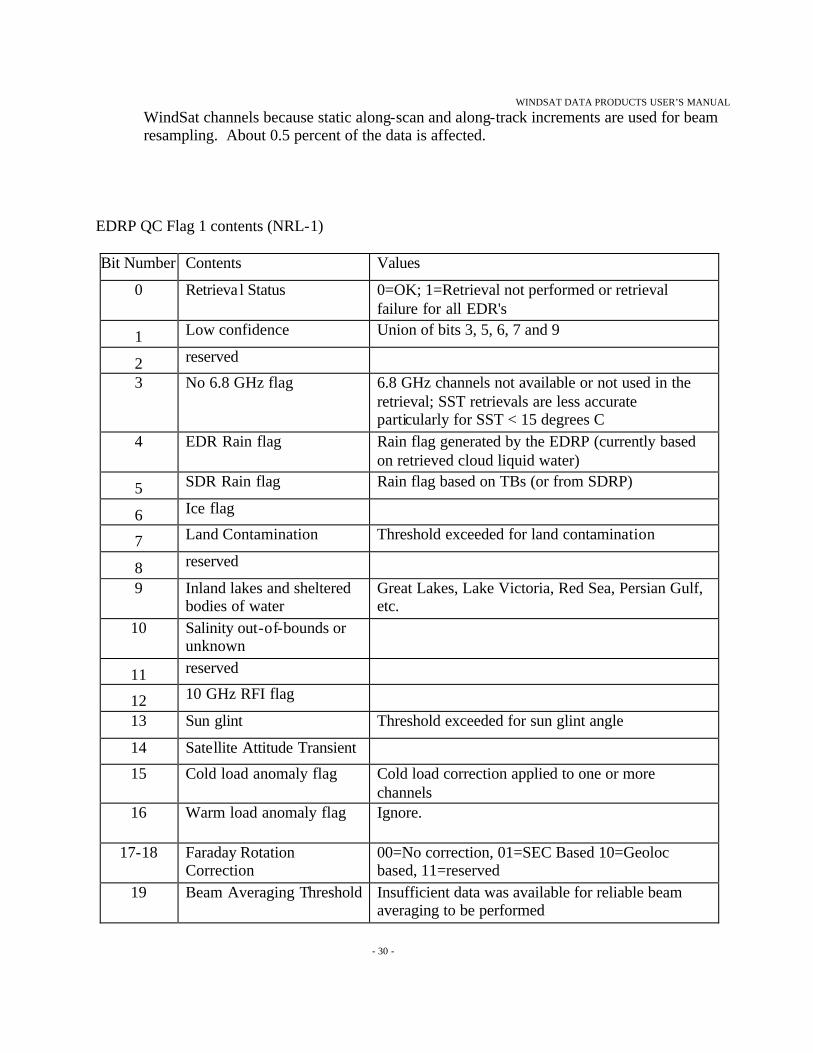
WindSat channels because static along-scan and along-track increments are used for beam resampling. About 0.5 percent of the data is affected.
EDRP QC Flag 1 contents (NRL-1)
Bit Number Contents Values
0 Retrieval Status 0=OK; 1=Retrieval not performed or retrieval failure for all EDR's
1 Low confidence Union of bits 3, 5, 6, 7 and 9
2 reserved 3 No 6.8 GHz flag 6.8 GHz channels not available or not used in the
retrieval; SST retrievals are less accurate particularly for SST < 15 degrees C
4 EDR Rain flag Rain flag generated by the EDRP (currently based on retrieved cloud liquid water)
5 SDR Rain flag Rain flag based on TBs (or from SDRP)
6 Ice flag
7 Land Contamination Threshold exceeded for land contamination
8 reserved
9 Inland lakes and sheltered bodies of water
Great Lakes, Lake Victoria, Red Sea, Persian Gulf, etc.
10 Salinity out-of-bounds or unknown
11 reserved
12 10 GHz RFI flag
13 Sun glint Threshold exceeded for sun glint angle
14 Satellite Attitude Transient 15 Cold load anomaly flag Cold load correction applied to one or more
channels 16 Warm load anomaly flag Ignore.
17-18 Faraday Rotation Correction
00=No correction, 01=SEC Based 10=Geoloc based, 11=reserved
19 Beam Averaging Threshold Insufficient data was available for reliable beam averaging to be performed

WINDSAT DATA PRODUCTS USER’S MANUAL
- 31 -
20 Wind speed too low for accurate wind direction retrieval
Wind speed is < 5 m/s
21 Wind speed too high for accurate retrieval
Wind speed is > 25 m/s
22 Wind speed qua lity Low confidence for wind speed retrieval
23 Wind speed retrieval status No retrieval for wind speed
24 Wind direction quality Low confidence for wind direction retrieval
25 Wind direction retrieval status
No retrieval for wind direction
26 SST quality Low confidence for SST retrieval
27 SST retrieval status No retrieval for SST
28 Water vapor quality Low confidence for water vapor retrieval
29 Water vapor retrieval status No retrieval for water vapor
30 Cloud liquid water quality Low confidence for cloud liquid water retrieval
31 Cloud liquid water retrieval status
No retrieval for cloud liquid water

WINDSAT DATA PRODUCTS USER’S MANUAL
- 32 -
7 Software and Data Conventions
7.1 File Names
7.1.1 Sensor Data Record Files
The file name contains a unique descriptor of the data set. For example, for the file
wndmi_fws_d20031112_s165348_e183421_r04402_c146AFBBDA.sdr68
wndmi_fws is the mission identifier
d field is the date (YYYYMMDD)
s is the start time of the data in the raw file (HHMMSS)
e is the end time of the data in the raw file (HHMMSS)
r is the revolution or orbit number of the mission at the start of the file (note that files may contain more than one orbit)
c describes the processing version, including WindSat software release and all static files
(Note on start and end time: The start and end times of the data in the SDR may differ from the times indicated by the file name. This is the result of the averaging, resampling and filtering within the processing code. The difference is usually less than one minute.)
7.1.2 Environmental Data Record Files
EDR file naming convention is similar to the SDR, except that file extension is .edr68.
7.2 File Organization
All WindSat files are created under the UNIX operating system. The SDR and EDR files are binary file written as a FORTRAN direct access files, with FORTRAN 90 structure for each record. Note that in FORTRAN90 integers are long (4 bytes) by default, unless noted otherwise.
7.3 Coordinate Systems
WindSat level data products employ the Earth Centered Fixed (ECF) and Earth Centered Inertial (ECI) Coordinate Systems to specify the location and velocity of the CORIOLIS spacecraft. The ECF coordinate system is right-handed. The origin is at the earth’s center. The positive x-axis extends from the origin through the intersection of the equator and the prime (Greenwich) meridian. The positive y-axis runs from the origin through the equator at 90 degrees East longitude. The z-axis extends from the origin through the North Pole.

WINDSAT DATA PRODUCTS USER’S MANUAL
- 33 -
The ECI coordinate system is a Cartesian coordinate system, where the coordinates are defined as the distance from the origin along the three orthogonal (mutually perpendicular) axes. The z axis runs along the Earth's rotational axis pointing North, the x axis points in the direction of the vernal equinox, and the y axis completes the right-handed orthogonal system. The vernal equinox is an imaginary point in space which lies along the line representing the intersection of the Earth's equatorial plane and the ecliptic. These three axes defining the Earth-Centered Inertial coordinate system are 'fixed' in space and do not rotate with the Earth.
The spacecraft fixed coordinate system is also right-handed. The origin is the center of mass of the spacecraft. The y-axis points in the direction of flight, while the z-axis points in the nadir direction. Spacecraft attitude measurements employ a roll-pitch-yaw system relative to these axes. Positive rotations of attitude conform to the right hand rule.
7.4 Data Representation
Unless stated otherwise, all data are in binary format. The term “byte” is synonymous with the ISO term “octet”.
7.4.1 Bit and Byte Format
The basic addressable unit is the 8-bit byte. Multi-byte quantities are addressed by the most significant byte, and hence bytes are stored in order of decreasing significance. A byte is 8 contiguous bits starting on an addressable byte boundary. The bits are numbered 0 through 7 starting from right to left.
Example:
Byte n Byte n+1 Byte n+2 Byte n+3 31 ... 24 23 ... 16 15 ... 08 07 ... 00 The twos complement system is used for negative numbers. The twos complement representation of a negative number is formed by performing binary subtraction of each digit from 1 and then adding 1 to the least significant digit. For example, the twos complement of 11010011 is 00101101.

WINDSAT DATA PRODUCTS USER’S MANUAL
- 34 -
8 Acquiring and Extracting the WindSat Science Data
8.1 Obtaining the Data
During the calibration/validation phase of this mission, PO.DAAC distributes SDR and EDR data, processed at FNMOC, to approved researchers, members of the Cal/Val Science Team. Data are available via:
http://podaac.jpl.nasa.gov/windsat/calval/data (password-protected)
password-protected FTP from podaac.jpl.nasa.gov
DLT-7000 tape, after emailing [email protected].
8.1.1 WindSat Science Products
The DLT tape products contain approximately 1.5 months of SDR data in binary compressed format with supporting documentation and software.
Each tape consists of one UNIX tar file that contains the following:
• an ASCII file listing of the package contents;
• the data files in compressed binary format;
• the C, FORTRAN, and IDL readers, provided by the PO.DAAC;
• data documentation (user’s manual).
The product will be physically labeled to indicate the product level, the data start and stop times, and the tape creation time.
8.1.2 Network Access
Supporting software, documentation and higher-level data products (SDRs and EDRs) will be available on PO.DAAC’s web and ftp sites.
WINDSAT DATA PRODUCTS USER’S MANUAL
- 35 -
8.2 Reading the WindSat Data
Sample read software for the WindSat data are available in C, FORTRAN and Interactive Data Language (IDL). These programs can be easily modified to meet the requirements of individual users. Please contact the PO.DAAC WindSat Data Team ([email protected]) if you encounter any difficulty while using this software.

WINDSAT DATA PRODUCTS USER’S MANUAL
- 36 -
9 Appendices
9.1 PO.DAAC Points of Contact
Questions and comments concerning the WindSat Science Data Products should be directed to PO.DAAC. Please note that e-mail is always the preferred method of communication.
E-mail: [email protected] Home Page: http://podaac.jpl.nasa.gov/windsat FTP: host podaac.jpl.nasa.gov (username and password required)
Telephone: +1-626-744-5508 Fax: +1-626-744-5506
By mail: JPL PO.DAAC User Services Office Jet Propulsion Laboratory Mail Stop Raytheon-299 4800 Oak Grove Drive Pasadena, CA 91109 U.S.A.

WINDSAT DATA PRODUCTS USER’S MANUAL
- 37 -
9.2 Definitions of Commonly-Used Terms
9.2.1 Abbreviations and Acronyms
AFSCN Air Force Satellite Control Network
APC Antenna Pattern Correction
CMIS Conical Scanning Microwave Imager/Sounder
EDR Environmental Data Record
EDRP Environmental Data Record Processor
FNMOC Fleet Numerical Meteorology and Oceanography Center, Monterey, CA
IORD Integrated Operational Requirements Document
IPO Integrated Program Office, a tri-agency (DoC, DOD, NASA) entity managing NPOESS
NEDT Noise Equivalent Differential Temperature
NPOES S National Polar-orbiting Operational Environmental Satellite System
NRL Naval Research Laboratory
Office of the Chief of Naval Operations (US Navy) N6 - Space, Information Warfare, Command and Control
OPNAV
N096 - Oceanographer of the Navy
PO.DAAC Physical Ocean Distributed Active Archive Center
PMW155 Program Executive Officer C4I and Space for Naval, Meteorological and Oceanographic Applications
PRA Polarization Rotation Angle
RDR Raw Data Record
RDRP Raw Data Record Processor
RFI Radio Frequency Interference
RSC Research, Development, Test, and Evaluation (RDT&E) Support Complex, Kirtland AFB, Albuquerque, New Mexico
SDR Sensor Data Record
SDRP Sensor Data Record Processor
SPAWAR Space and Naval Warfare Systems Command
SST Sea Surface Temperature
STP Space Test Program
TDR Temperature Data Record
TDRP Temperature Data Record Processor

WINDSAT DATA PRODUCTS USER’S MANUAL
- 38 -
9.2.2 Polarimetric Radiometry References and Bibliography
P.W. Gaiser, K.M. St. Germain, E.M. Twarog, G.A. Poe, W. Purdy, D. Richardson, W. Grossman, W. L. Jones, D. Spencer, G. Golba, M. Mook, J. Cleveland, L. Choy, R.M. Bevilacqua, and P.S. Chang, “The WindSat space borne polarimetric microwave radiometer: sensor description and early orbit performance”, IEEE Trans. on Geosci. and Remote Sensing, vol. 42, pp. 2347-2361, Nov 2004.
M. H. Bettenhausen, C. K. Smith, R. M. Bevilacqua, N. Y. Wang, P. W. Gaiser and S. Cox, "A nonlinear optimization algorithm for WindSat wind vector retrievals," IEEE Trans. Geosci. Remote Sensing, in press, 2006. E.M. Twarog, W. E. Purdy, P. W. Gaiser, K. H. Cheung, and B. E. Kelm, “WindSat On-Orbit Warm Load Calibration”, IEEE Trans. Geosci. Remote Sensing, in press, 2006.
P.S. Chang, and L. Li, “Ocean surface wind speed and direction retrievals from the SSM/I,” IEEE Trans. Geosci. Remote Sensing, vol. 36, no. 6, 1866-1871, November 1998.
P.W. Gaiser, G.A. Poe and K.M. St. Germain, “Critical design issues for space borne polarimetric radiometry,” Proceedings of the International Geoscience and Remote Sensing Symposium 1998 , Seattle, WA, 1998.
J. T. Johnson, W. H. Theunissen, S. W. Ellingson, “A Study of Sea Emission Models for WindSat,” IGARSS 2003, Toulouse, France, July 21-25, 2003
J. T. Johnson, “An efficient two-scale model for the computation of thermal emission and atmospheric reflection from the sea surface,” IEEE Trans. Geosci. Remote Sensing, in press, 2006.
L. Li, P.W. Gaiser, M.H. Bettenhausen and W. Johnston, “WindSat Radio Frequency Interference Signature and Its Identification Over Land and Ocean,” IEEE Trans. Geosci. Remote Sensing, in press, 2006.T. Wilheit, C. D. Kummerow, and R. Ferraro, “Rainfall algorithms for AMSR-E,” IEEE Transactions on Geoscience and Remote Sensing , Vol. 41: 204-214, 2003. C. Kummerow, W. Olson, and L. Giglio, “The evolution of the Go ddard Profiling Algorithm (GPROF) for rainfall estimation from passive microwave sensors,” IEEE Transactions on Geoscience and Remote Sensing, Vol. 34: 1213-1232, 1996.
T.P. Mavor, N.-Y. Wang, L.N. Connor, P.S. Chang and R. Legeckis, "Development of an Operational Microwave Sea Surface Temperature Retrieval Algorithm", in Proceedings of IGARSS 2002, Toronto, CA, 2002.
J.R. Piepmeier and A.J. Gasiewski, “High-resolution passive polarimetric microwave mapping of the ocean surface wind vector fields,” IEEE Trans. Geosci. Remote Sensing, vol. 39, no. 3, 606-622, March 2001.
K. M. St. Germain, P. W. Gaiser, “Spaceborne polarimetric radiometer and the WindSat Coriolis mission,” Proceedings of the IEEE Aerospace Conference, IEEE Vol. 5, pp. 159-164, 2000.
K.M. St. Germain, G.A. Poe and P.W. Gaiser, “Polarimetric emission model of the sea at microwave frequencies and comparison with measurements,” Progress in Electromagnetic Research, vol. 37, pp 2-32, 2002.
Nai-Yu Wang , P. S. Chang, R. M. Bevilacqua, C. K. Smith, P. W. Gaiser, “WindSat Atmospheric Forward Model Comparisons,” Proceedings of IGARSS 2002, Toronto, Canada, June 24-28, 2002
WindSat Experiment Requirements Document (ERD) NCST-D-WS013 Rev. A, 28 Jan 1999.
S.H.Yueh, S.H., W.J. Wilson, F.K. Li, W.B. Ricketts and S.V. Nghiem, “Polarimetric brightness temperatures of sea surfaces measured with aircraft K- and Ka-band radiometers,” IEEE Trans. Geosci. Remote Sensing, Vol. 33, No. 5, 1177-1187, September 1997.
S.H. Yueh, W.J. Wilson, S.J. DiNardo, and F.K. Li, Polarimetric microwave brightness signatures of ocean wind direction, IEEE Trans. Geosci. Remote Sensing, Vol. 37, No. 2, 949-959, March 1999.

WINDSAT DATA PRODUCTS USER’S MANUAL
- 39 -