Embed Size (px)
Citation preview
WINDTESTKaiser-Wilhelm-Koog GmbH
EWEC 2007 Session DT2 Slide No. 1
Comparison of the ZephIR Wind-LiDAR to Classical Cup MeasurementsOn- and Offshore
Detlef Kindler WINDTEST Kaiser-Wilhelm-Koog GmbH
Andy Oldroyd Oldbaum Services Ltd.
EWEC 2007, Milan, Italy
“Advances in measuring methods”
Technical Track - Session DT2, 10 Mai 2007
supported by: EU-Project DOWNVInD - Partners
Title

WINDTESTKaiser-Wilhelm-Koog GmbH
EWEC 2007 Session DT2 Slide No. 2
• Motivation
• Onshore and Offshore Assesment Campaign 5M met.mast site, Brunsbüttel Offshore platform FINO-1, Germany
• Assessment Results Availability Data quality
• Wind Speed Profiles
• Turbulence Comparisons
• Summary
Outline
WINDTESTKaiser-Wilhelm-Koog GmbH
EWEC 2007 Session DT2 Slide No. 3
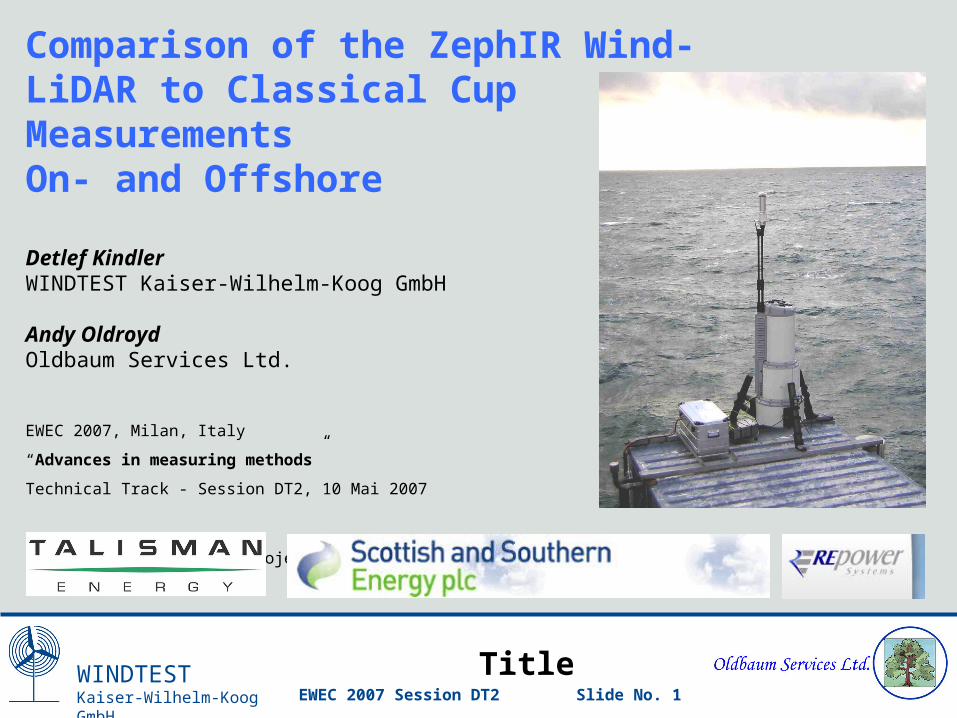
Remote Sensing (LiDAR) as primary wind resource monitoring method for Beatrice Windfarm Demonstrator Project
• Assessment of capabilities of the ZephIR Wind LiDAR
• Suitability for offshore purposes
Motivation
5M Offshore

WINDTESTKaiser-Wilhelm-Koog GmbH
EWEC 2007 Session DT2 Slide No. 4
Acceptance Criteria
Acceptance criteria for the ZephIR being used
as the primary wind monitioring method
on the Beatrice Alpha platform:
Availability: > 95 % (system & data)
Data quality: wind speed relative to cups (4 to 16 m/s)
linear regression through origin
Y = mx + b (i.e. with b==0)
0.97 < m < 1
R2 > 0.95
WINDTESTKaiser-Wilhelm-Koog GmbH
EWEC 2007 Session DT2 Slide No. 5
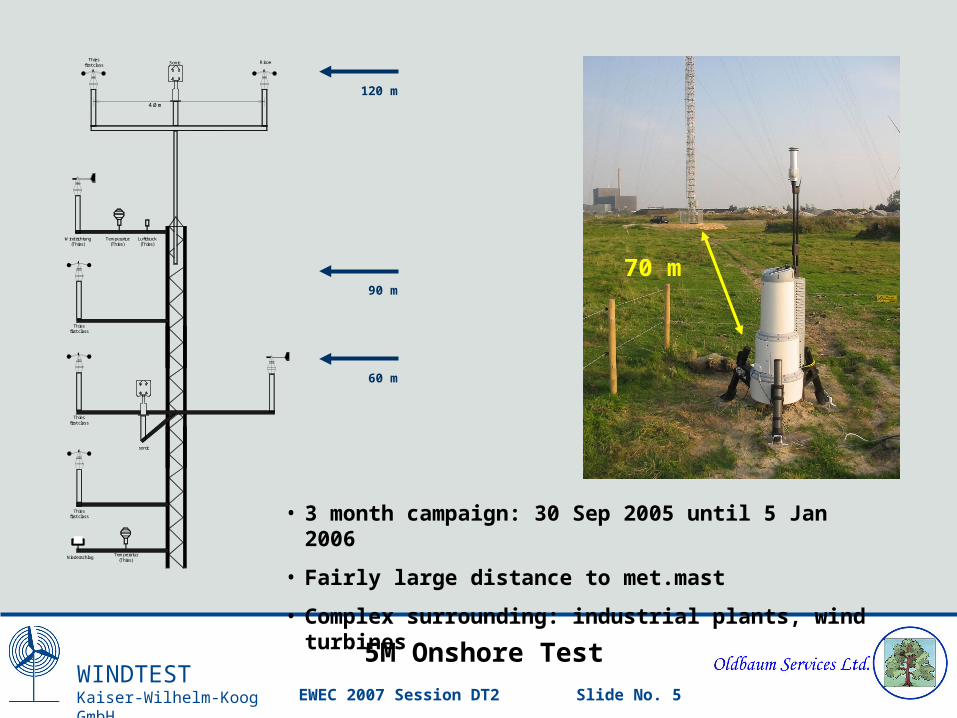
5M Onshore Test
4.0 m
Thiesfirst class
RisoeSonic
Windrichtung(Thies)
Temperatur(Thies)
Luftdruck(Thies)
Thiesfirst class
Thiesfirst class
sonic
Thiesfirst class
Temperatur(Thies)
Niederschlag
120 m
90 m
60 m
• 3 month campaign: 30 Sep 2005 until 5 Jan 2006
• Fairly large distance to met.mast
• Complex surrounding: industrial plants, wind turbines
70 m

WINDTESTKaiser-Wilhelm-Koog GmbH
EWEC 2007 Session DT2 Slide No. 6
FINO-1 Offshore Test
ZephIR
• North Sea, 45 km North of German island Borkum
• Annual mean wind speed on 100 m: ~ 10 m/s
• Prevailing wind dir.: SW
• Mast top height: 103 m
• ZephIR height: 25 m
• 5 Month campaignMarch to July 2006
• ZephIR close to mast ( ~ 10 m)
• No disturbance by met.mast on LiDAR
103 m
81 m
61 m
WINDTESTKaiser-Wilhelm-Koog GmbH
EWEC 2007 Session DT2 Slide No. 7
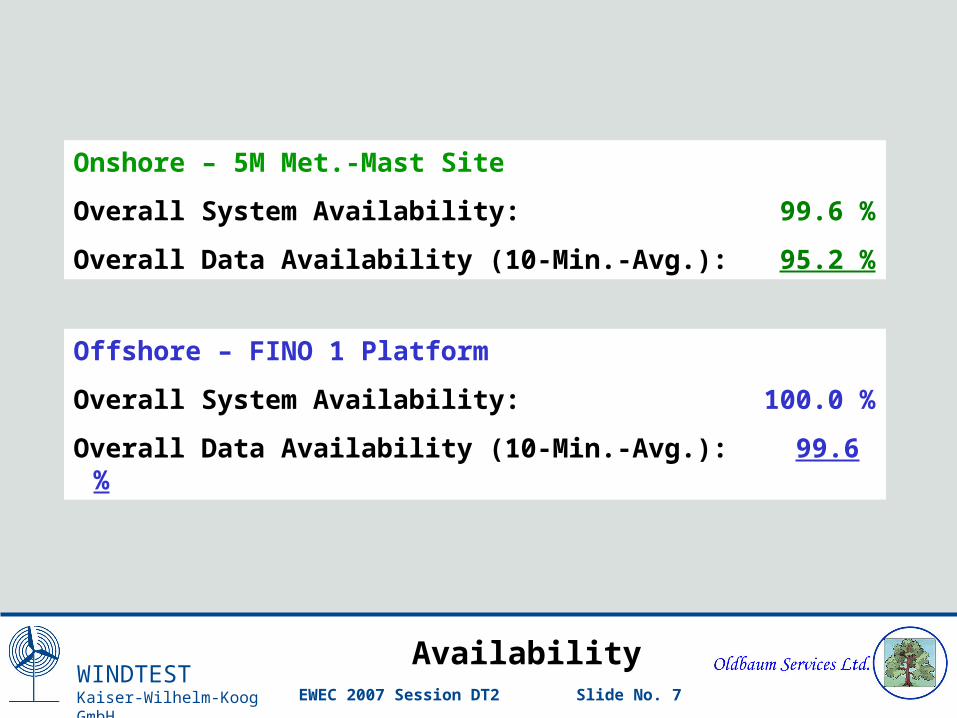
Availability
Onshore – 5M Met.-Mast Site
Overall System Availability: 99.6 %
Overall Data Availability (10-Min.-Avg.): 95.2 %
Offshore – FINO 1 Platform
Overall System Availability: 100.0 %
Overall Data Availability (10-Min.-Avg.): 99.6 %

WINDTESTKaiser-Wilhelm-Koog GmbH
EWEC 2007 Session DT2 Slide No. 8
WS Regressions Onshore
Slope:m = 0.97
Regr. coefficient:R2 = 0.97
90mSlope:m = 0.95
Regr. coefficient:R2 = 0.96
120m
WINDTESTKaiser-Wilhelm-Koog GmbH
EWEC 2007 Session DT2 Slide No. 9
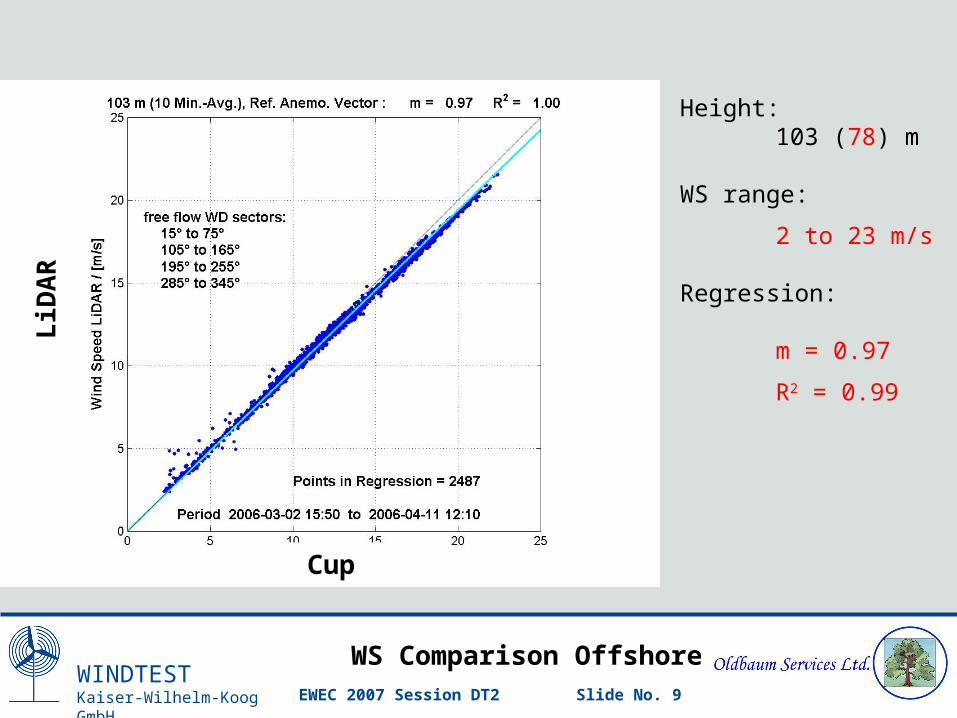
Height:103 (78) m
WS range:
2 to 23 m/s
Regression:
m = 0.97
R2 = 0.99
WS Comparison Offshore
Cup
LiD
AR

WINDTESTKaiser-Wilhelm-Koog GmbH
EWEC 2007 Session DT2 Slide No. 10
WS Regressions Offshore
81 (56) m
Slope:m = 0.97
Regr. coefficient:R2 = 0.99
61 (36) m
Slope:m = 0.98
Regr. coefficient:R2 = 1.00

WINDTESTKaiser-Wilhelm-Koog GmbH
EWEC 2007 Session DT2 Slide No. 11
WS Regression Results
Sector 125° to 255°CUP CUP CUP
1st Period 120 m 90 m 60 m
10-min-avg. values 3034 / /
Slope "m" 0.94 / /
Regr. Coeff "R2" 0.95 / /
2nd Period 120 m 90 m 60 m
10-min-avg. values 2532 1688 1577Slope "m" 0.95 0.97 0.99
Regr. Coeff "R2" 0.96 0.97 0.95
Onshore180° to 255°
Sectors15°-75°, 105°-165°, 195°-
255°, 295°-345°
CUP CUP CUP
1st Period 103 (78) m 81 (56) m 61 (36) m
10-min-avg. values 1965 / /
Slope "m" 0.97 / /
Regr. Coeff "R2" 0.99 / /
2nd Period 103 (78) m 81 (56) m 61 (36) m
10-min-avg. values 6005 2589 2749
Slope "m" 0.98 0,97 0,98
Regr. Coeff "R2" 0.99 0.99 1,00
Offshore30° to 90° and 180° to 240°
WINDTESTKaiser-Wilhelm-Koog GmbH
EWEC 2007 Session DT2 Slide No. 12
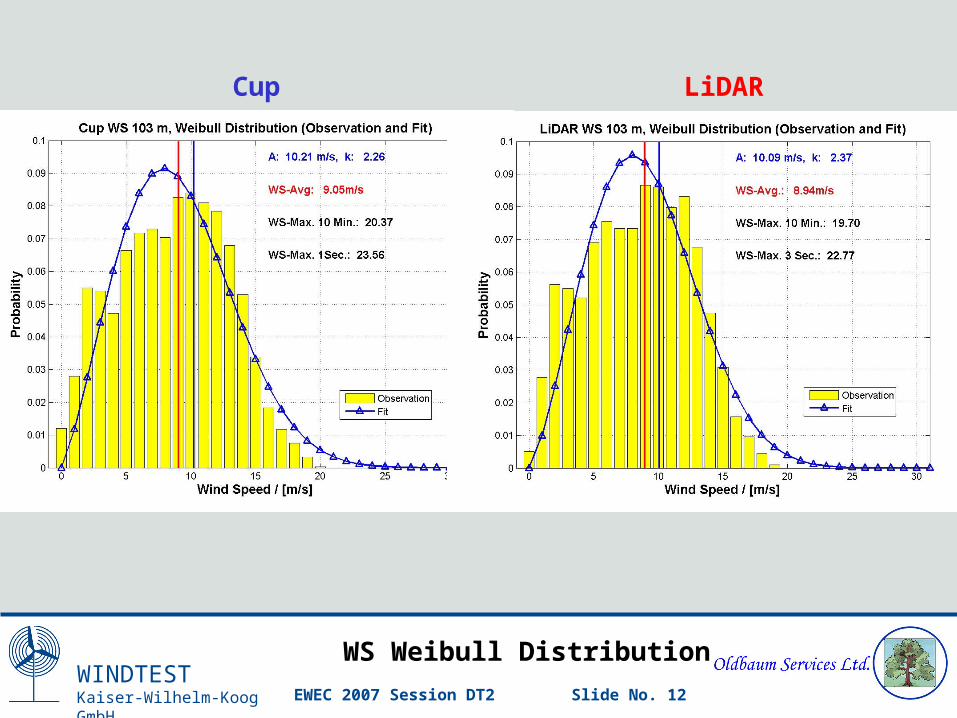
WS Weibull Distribution
Cup LiDAR

WINDTESTKaiser-Wilhelm-Koog GmbH
EWEC 2007 Session DT2 Slide No. 13
Assessment Summary
• Good performance onshore despite terrain complexity ZephIR passed acceptance
• Offshore test FINO-1, similar environment as on Beatrice better correlation offshore than onshore
• Main result WS deviation from Cups < 3% Availability close to 100% (NO weather dependence) good handling, easy to install
• System passed acceptance onshore and offshore installation on Beatrice in Nov. 2006 stand-alone operation for wind monitoring,
good performance since
Note: 1st Beatrice 5M wind turbine connected since last Tue, 8th May 2007

WINDTESTKaiser-Wilhelm-Koog GmbH
EWEC 2007 Session DT2 Slide No. 14
WS Profiles
Wind Speed Profiles – Vertical Sampling:
Cup: point measurement
LiDAR: “average” over vertical range change of probing length with height 2
1( )
s
Ls
L s
20 40 60 80 100 120 140 160 180 200 220
Range (m)
0.0
0.2
0.4
0.6
0.8
1.0
1.2
Sen
siti
vity
(re
l. t
o p
eak)
Altitude L
40m 2.5 m
60m 6 m
100m 16 m
200m 65 m
Source: RISOE

WINDTESTKaiser-Wilhelm-Koog GmbH
EWEC 2007 Session DT2 Slide No. 15
WS Profiles Offshore
WINDTESTKaiser-Wilhelm-Koog GmbH
EWEC 2007 Session DT2 Slide No. 16
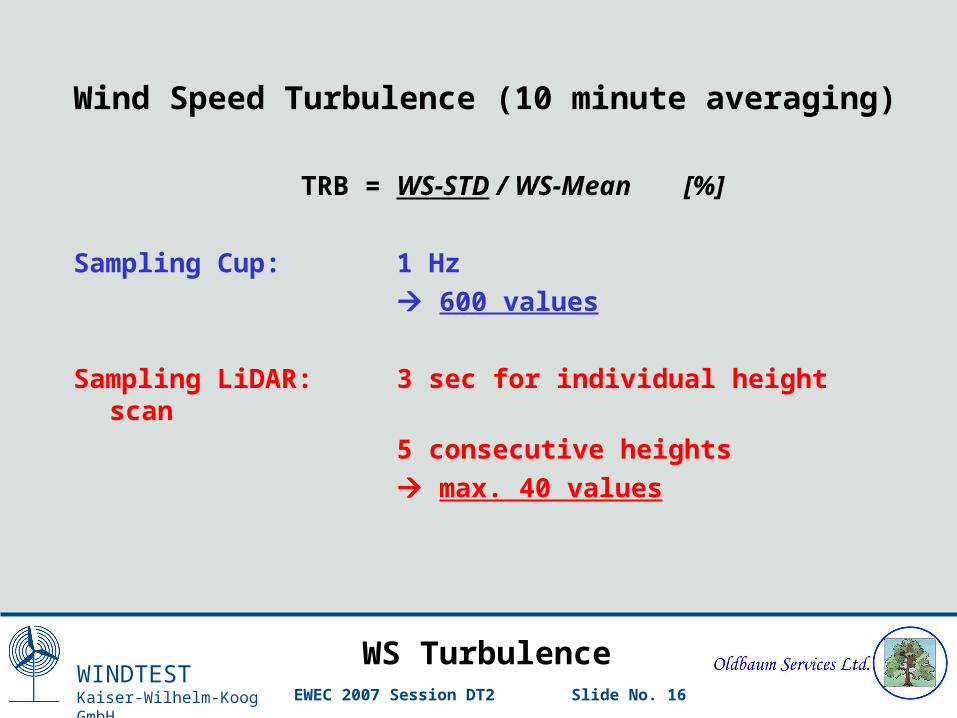
WS Turbulence
Wind Speed Turbulence (10 minute averaging)
TRB = WS-STD / WS-Mean [%]
Sampling Cup: 1 Hz
600 values
Sampling LiDAR: 3 sec for individual height scan
5 consecutive heights
max. 40 values
WINDTESTKaiser-Wilhelm-Koog GmbH
EWEC 2007 Session DT2 Slide No. 17
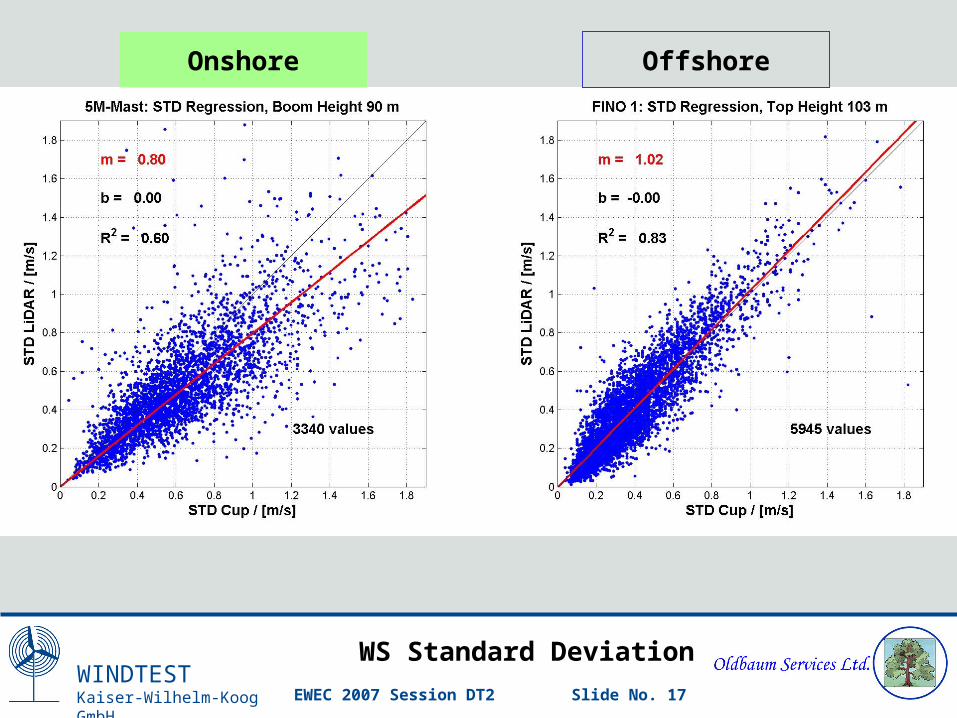
WS Standard Deviation
Onshore Offshore

WINDTESTKaiser-Wilhelm-Koog GmbH
EWEC 2007 Session DT2 Slide No. 18
Turbulence vs. WS
Onshore Offshore

WINDTESTKaiser-Wilhelm-Koog GmbH
EWEC 2007 Session DT2 Slide No. 19
Turbulence WS Binned
Onshore Offshore

WINDTESTKaiser-Wilhelm-Koog GmbH
EWEC 2007 Session DT2 Slide No. 20
Turbulence
Differences in mast measurements
• Cup type Thies-1st-Class (On-), Vector (Offshore)
• STD calculation1Hz, 600 values, 10 Min.-STD1Hz, 60 values, 1 Min.STD 10 Min.STD (according to IEC)
Other differences onshore vs. offshore
• Terrain, obstacles
• Surface roughness
• Atmospheric stability
impact on dominant turbulence length scales
Character of volume measuring technique more pronounced onshore …
WINDTESTKaiser-Wilhelm-Koog GmbH
EWEC 2007 Session DT2 Slide No. 21
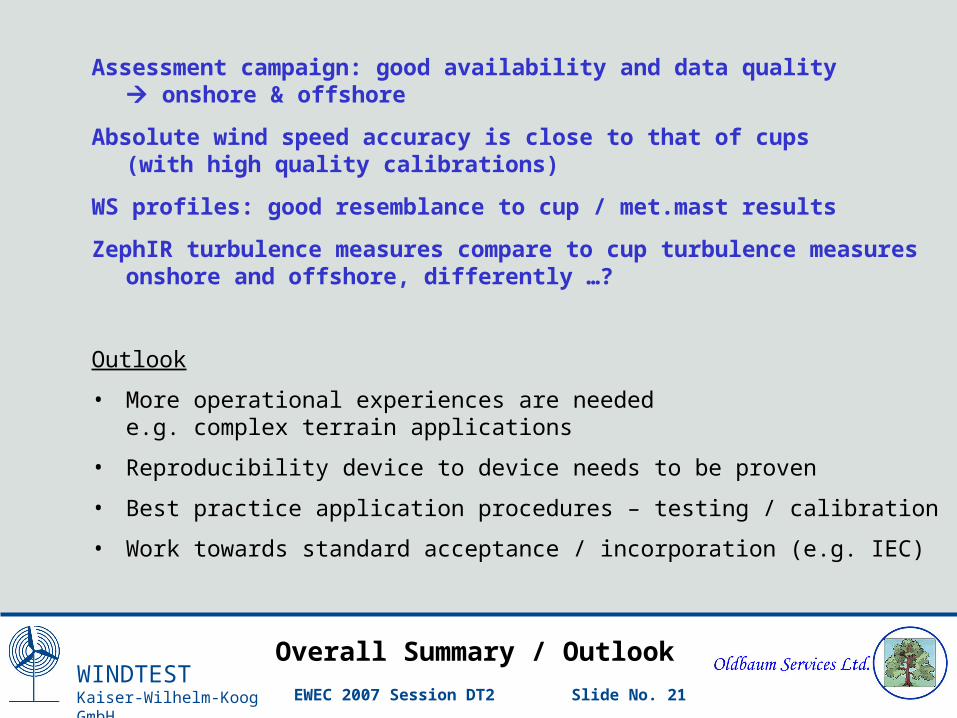
Overall Summary / Outlook
Assessment campaign: good availability and data quality onshore & offshore
Absolute wind speed accuracy is close to that of cups (with high quality calibrations)
WS profiles: good resemblance to cup / met.mast results
ZephIR turbulence measures compare to cup turbulence measures onshore and offshore, differently …?
Outlook
• More operational experiences are needed e.g. complex terrain applications
• Reproducibility device to device needs to be proven
• Best practice application procedures – testing / calibration
• Work towards standard acceptance / incorporation (e.g. IEC)
WINDTESTKaiser-Wilhelm-Koog GmbH
EWEC 2007 Session DT2 Slide No. 22
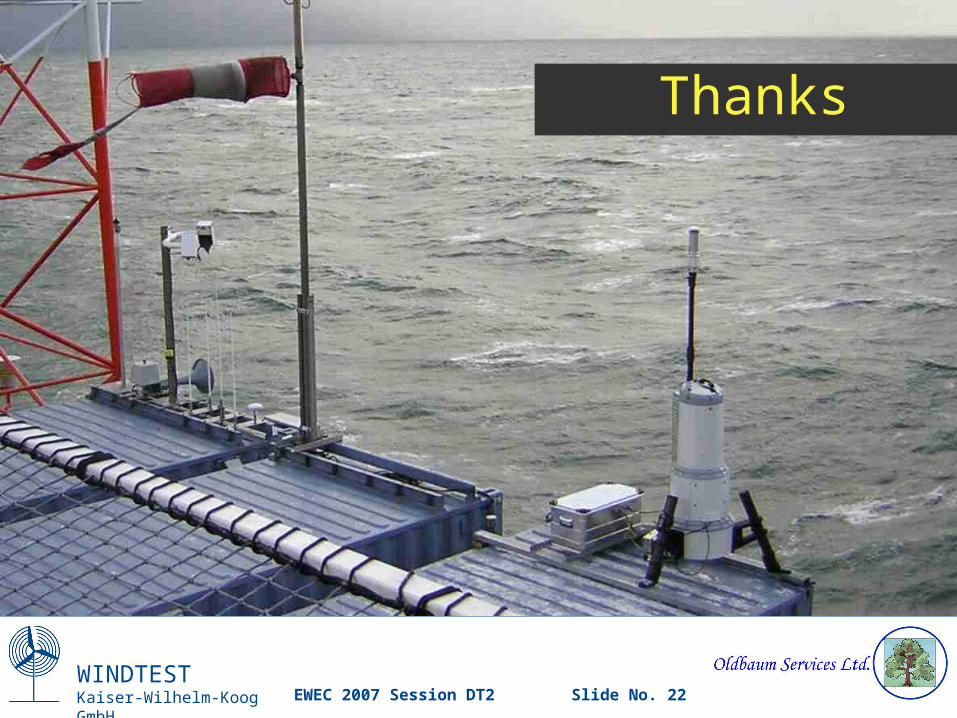
Thanks
![Validation of Measurements from a ZephIR Lidar · ZephIR Lidar [1]. The measurements were collected using a ZephIR 300 wind lidar (which collects finance grade measurements up to](https://img.pdfslide.net/doc/110x75/5f5261a4dc395358a915c491/validation-of-measurements-from-a-zephir-zephir-lidar-1-the-measurements-were.jpg)