Embed Size (px)
Citation preview

Discussion Paper No. 0103
Adelaide University Adelaide 5005 Australia
Wine Quality and Varietal, Regional and
Winery Reputations: Hedonic Prices for
Australia and New Zealand
Günter Schamel and Kym Anderson
Revised October 2001

CENTRE FOR INTERNATIONAL ECONOMIC STUDIES The Centre was established in 1989 by the Economics Department of the Adelaide University to strengthen teaching and research in the field of international economics and closely related disciplines. Its specific objectives are:
• to promote individual and group research by scholars within and outside the Adelaide University
• to strengthen undergraduate and post-graduate education in this field
• to provide shorter training programs in Australia and elsewhere
• to conduct seminars, workshops and conferences for academics and for the wider community
• to publish and promote research results
• to provide specialised consulting services
• to improve public understanding of international economic issues, especially among policy makers and shapers
Both theoretical and empirical, policy-oriented studies are emphasised, with a particular focus on developments within, or of relevance to, the Asia-Pacific region. The Centre’s Executive Director is Professor Kym Anderson (Email [email protected]) and Deputy Director, Dr Randy Stringer (Email [email protected]).
Further details and a list of publications are available from:
Executive Assistant CIES School of Economics Adelaide University SA 5005 AUSTRALIA Telephone: (+61 8) 8303 5672 Facsimile: (+61 8) 8223 1460 Email: [email protected] Most publications can be downloaded from our Home page at http://www.adelaide.edu.au/cies/ ISSN 1444-4534 series, electronic publication

2
CIES DISCUSSION PAPER 0103
Wine Quality and Varietal, Regional and Winery Reputations: Hedonic Prices for Australia and New Zealand
Günter Schamel and Kym Anderson
Humboldt-University at Berlin [email protected]
and
Centre for International Economic Studies, Adelaide University [email protected]
Revised October 2001
Thanks are due to numerous colleagues for comments on earlier drafts presented at the AARES Conference in Adelaide in January 2001, the Enometrics VIII Conference in the Napa Valley in May 2001, and the CIES Workshop on Understanding Developments in the World’s Wine Markets in Adelaide in October 2001; to Australia’s Grape and Wine Research and Development Corporation, Rural Industries Research and Development Corporation, and the Australian Research Council as well as the German Academic Exchange Service (DAAD) for financial support; and to James Halliday and Peter Simic for kindly providing their very extensive tastings databases.
Wine Quality and Varietal, Regional and Winery Reputations: Hedonic Prices for Australia and New Zealand
ABSTRACT
We estimate hedonic price functions for premium wine from Australia and New Zealand,
differentiating implicit prices for sensory quality ratings, wine varieties, and regional as well as
winery brand reputations over the vintages 1992 to 2000. For Australia, the results suggest
regional reputations in general are becoming increasingly significant through time, indicating
intensifying regional quality differentiation. In particular, some specific cool-climate regions
are becoming increasingly preferred over other regions. Price premia based on brand reputation
also are shown to be significant. For New Zealand also, regional quality differentiation is
significant, although less so than in Australia. In each country, price premia associated with
both James Halliday’s and Winestate magazine’s sensory quality ratings, and with Halliday’s
winery ratings and classic wine designations, are highly significant.
Key words: Wine quality, regional reputation, brand reputation, hedonic pricing
JEL codes: C50, D12, Q13
Contact author: Kym Anderson Centre for International Economics, School of Economics Adelaide University Adelaide SA 5005 Phone (08) 8303 4712 [email protected]

Wine Quality and Varietal, Regional and Winery Reputations:
Hedonic Prices for Australia and New Zealand
1. Introduction
For more than a dozen years now the wine industry has been booming in Australia and
New Zealand. Both the area planted to vineyards and the volume of wine produced have
grown at 5+ per cent per year on average from 1988 to 1999, while the two countries’ exports
of wine have been growing at around 20 per cent per year (from a low base). Simultaneously,
wine exports from California, South Africa and South America have been soaring, such that
the volume share of global wine production that is exported has risen from 15 to 25 per cent.
Yet per capita wine consumption in Australia and New Zealand has been static. Abroad,
consumption has been falling steadily in the traditional wine-consuming countries of Europe
and the southern cone of Latin America, more than offsetting demand growth in the UK, the
US, and (from a tiny base) East Asia (Anderson and Norman 2001). In each of these markets,
however, as in Australia and New Zealand, there has been a dramatic substitution of quality
for quantity: premium (bottled) wine sales are growing steadily while non-premium (cask)
sales are declining (Anderson, Norman and Wittwer 2001).
With global demand static and export supplies expanding rapidly, the average price of
internationally traded wine is bound to come under pressure to decline in the coming years. In
this more-competitive and more-globalized environment, the extent to which the price
declines (or rises) for a particular group of producers will depend very much on the quality
upgrading of its product, absolutely and relative to that of other producer groups, as perceived

by consumers at home and abroad. This raises the question of what determines consumers’
perceptions of quality when they buy wine.1 Many consumers, especially when they are new
and inexperienced, are looking for guidance before purchasing wines. Often they are unsure
about the quality of a wine they intend to purchase and turn to published ratings of wine
experts for guidance. This begs the question as to how expert ratings, in addition to grape
variety and regional reputations, affect the price of wine. What are consumers willing to pay
for such things as the reputation of the producing region as distinct from corporate brand
reputation, or grape variety reputation, or the published ratings of wine writers/judges/critics;
and how has that willingness to pay evolved over time?
This paper addresses this question as it relates to Australian and New Zealand wines,
using a hedonic pricing model. Our analysis is unique in a number of ways. First, in
examining two very large samples of ratings, each drawn from the same base population of
wines and consumers, we are able to make direct comparisons between the Halliday and
Winestate ratings. Second, we are able to expose changes in reputations over the past decade
when markets changed dramatically. And third, we include indicators for sensory quality,
producer reputation, variety, and regional origin for not only Australia but also New Zealand
(which has not been previously studied in this way).
The paper is structured as follows. In section 2, we briefly review the literature on
hedonic pricing models and their application to wine. Section 3 presents the model and the
two different data sets used in the analysis. Section 4 details the empirical results for the
markets in Australia and New Zealand separately. The final section summarizes what has
been learnt and suggests areas for further research.
1 This is to be distinguished from the quality upgrading over time of super-premium wine as it matures in the bottle in the years following its initial sale by the winery, as captured by time series of prices in the secondary market. According to Ashenfelter (2000), Ashenfelter, Ashmore and Lalonde (1995), Byron and Ashenfelter (1995) and Wood (2001), key determinants of the vintage-to-vintage variation in the ultimate quality of mature wine are a few straightforward weather variables in the growing season - information that consumers appear to have been ignoring.

2. Literature review
A number of studies apply hedonic price analysis to estimate implicit prices for wine
quality attributes.2 They are based on the hypothesis that any product represents a bundle of
characteristics that define quality. Their theoretical foundation is provided in the seminal
paper by Rosen (1974), which posits that goods are valued for their utility-generating
attributes. Rosen suggests there are competitive implicit markets that define implicit prices for
embodied product attributes, and that consumers evaluate product attributes (e.g. features of a
car, indicators of air or water quality) when making a purchasing decision. The observed
market price is the sum of implicit prices paid for each quality attribute. Rosen also
recognizes an identification problem for supply and demand functions derived from hedonic
price functions, because implicit prices are equilibrium prices jointly determined by supply
and demand conditions. Hence, implicit prices may reflect not only consumer preferences but
also factors that determine production. In order to solve the identification problem it is
necessary to separate supply and demand conditions. Arguea and Hsiao (1993) argue that the
identification problem is essentially a data issue that can be avoided by pooling cross-section
and time-series data specific to a particular side of the market.
Since the quality of a particular bottle of wine cannot be known until it is de-corked
and consumed, consumers’ willingness to pay depends on reputations associated with that
wine. In addition to quality ratings, individual producer reputation, the collective reputation of
wine regions as well as the grape variety(-ies) used also affect wine quality and thus prices.
Shapiro (1983) presents a theoretical framework to examine the effects of individual producer
reputation on prices. He develops an equilibrium price-quality schedule for high-quality
products, assuming competitive markets and imperfect consumer information, to demonstrate
that reputation allows high-quality producers to sell their items at a premium that may be
interpreted as revenue for producer investments in building reputation. On the demand side of

the market, it is costly for consumers to improve their information about product quality too.
In such an environment of imperfect information, learning about the reputation of a product or
of some of its attributes can be an effective way for consumers to reduce their decision-
making costs. A favorable producer or winery rating assigned by a wine expert may serve as
such an effective way to reduce the decision-making costs.
Tirole (1996) presents a model of collective reputation as an aggregate of individual
reputations where current producer incentives are affected by their own actions as well as
collective actions of the past. He derives the existence of stereotype producers from history
dependence, shows that new producers may suffer from past mistakes of older producers for a
long time after the latter disappear, and derives conditions under which the collective
reputation can be regained. A favorable collective reputation of a wine region relative to other
regions may be another effective way to reduce consumer decision-making costs.
Oczkowski (1994) adopts a hedonic pricing model in one of the first empirical wine
studies. He estimates a log-linear function for premium Australian wines, relating retail prices
to six attribute groups and various interaction terms. In another paper, Oczkowski (2000)
estimates hedonic price functions for Australian wine arguing that single indicators of wine
quality and reputation are imperfect measures because tasters' evaluations differ and thus
contain measurement errors. Employing factor analysis and 2SLS, he finds significant
reputation effects but insignificant quality effects.
Nerlove (1995) examines the Swedish wine market, which is characterized by no
domestic production, a small share of global consumption, and government control of prices.
This allows to assume exogenous prices (as opposed to assuming exogenous supply) and to
estimate a reduced form hedonic price function, regressing quantities sold on various quality
attributes and prices. Thus, Nerlove assumes that wine consumers in Sweden express their
valuation of a particular quality attribute by varying the derived hedonic demand for it.
2 This work builds on a long history of agricultural econometric research on product quality. An early example is

Golan and Shalit (1993) identify and evaluate quality characteristics for wine grapes
produced in Israel relative to California wine. That is, they analyze hedonic grape pricing of
the input supply side of the wine market. Their premise is that high-quality wines are
produced only when growers are given a strong enough price incentive to supply better
grapes. In a two-stage model, they first develop a quality index by evaluating the (relative)
contributions of various physical grape attributes to wine quality. Second, they construct a
quality-price function relating the price of Californian wine to the quality index developed in
the first stage. Analogous to Nerlove, they also assume that prices are exogenous.
Combris, Lecocq and Visser (1997) estimate a hedonic price equation and what is
referred to as a jury grade equation for Bordeaux wine to explain the variations in price and
quality, respectively.3 Landon and Smith (1997, 1998) also present empirical analyses of
Bordeaux wine, focusing on reputation indicators in addition to sensory quality attributes. In
both papers, they study the impact of current quality as well as reputation indicators on
consumer behavior using hedonic price functions. Lagged sensory quality ratings define
individual product reputation. Regional reputation indicators are government and industry
classifications. In addition, their 1997 paper analyzes five individual vintages over the period
1987 to 1991. Their main conclusions are: reputation indicators have a large impact on
consumer willingness to pay; an established reputation is considerably more important than
short-term quality improvements; and ignoring reputation indicators will overstate the impact
of current quality on consumer behavior. Their estimated coefficients vary substantially
across the five vintages examined.
Roberts and Reagans (2001) examine market experience, consumer attention, and
price-quality relationships for New World wines in the U.S. market. They argue that the
Waugh (1928). 3 On its own, the jury grade equation has no economic meaning, and no theoretical or empirical reason is presented as to why it is estimated in addition to the hedonic price equation. In a review of the above four empirical wine studies, Unwin (1999) stresses the difficulties associated with identifying appropriate variables to include, the varying definitions of wine quality used, and the possible inconsistencies in their data.

attention paid to wine quality signals increases with the market experience of its producer
and, because of spillover effects, with the experience of associated producers.
Schamel (2000) estimates a hedonic pricing model based on U.S. data for sensory
quality ratings, individual wine quality and regional reputation indicators for two premium
wine varieties: a white (Chardonnay) and a red (Cabernet Sauvignon). The paper examines
seven regions (Napa and Sonoma Valley, Sonoma County, Oregon, Washington State,
Australia, Chile, South Africa) and includes observations from a pool of eight vintages
between 1988 and 1995. However, it does not estimate coefficients for individual vintages.
The estimated price elasticity of sensory quality is larger for white wine, indicating that U.S.
consumers were willing to pay a higher quality premium for white compared to red wine at
that time. However, the results suggest both regional reputation and individual quality
indicators seem to be more important to U.S. consumers of red wine. The results also suggest
that the marketing of regional origin as a reputation attribute may have a higher payoff for
regions primarily growing red wine. In other words, it seems that the public-good value of a
regional appellation is higher for red wine regions and that individual producers in those
regions may benefit more from collective marketing efforts.
Because wine consumers are uncertain about quality, we assume that, in addition to
their own quality perceptions about grape varieties and growing regions, they use expert
quality ratings for the wine and/or the winery in their buying decisions. Thus, consumer
willingness to pay for a particular wine depends on a critic's quality rating of the wine and/or
the producer, as well as their own reputation assessment for grape varieties and growing
regions expressed through premiums or discounts relative to a base region and variety. The
present paper analyzes such quality and reputation indicators for premium wines from
Australia and New Zealand. For each country, we examine Halliday's (1999a,b and 2001) data
set as a whole as well as data sets for recent vintages. Moreover, we analyze a second data set
of more than 12,500 tasting scores for premium wines for the same two countries (Winestate

2001). This enabled us to compare for the first time hedonic pricing model results for two
different data sets drawn from the same base population of wines and consumers.
3. The data and hedonic price model
The data
Table 1a provides an overview of the data set from well-known Australian wine critic
James Halliday (2001 and earlier editions), which we have used to estimate a first set the
hedonic price equations. This consistent set is available for each vintage from 1992 (1993 in
the case of New Zealand) to 2000, amounting to 6,145 observations from Australia and 1,233
from New Zealand. In addition, we analyze the full data set for the '92-'00 vintages. For the
Australian sample, the average quality rating is 87 points (range 65-97) and the average price
is A$23.91 (range A$5-300). For New Zealand, the average quality rating is 88.5 points
(range 73-97) and the average price is NZ$23.37 (range NZ$7-90). Halliday's value of
sensory wine quality is defined by the variable vintage rating (100-point scale). He also
provises a winery rating of the producer as a supplier of premium wine, and a classic wine
classification in recognition of an outstanding wine. To evaluate differences in the
willingness to pay for different grape varieties, we distinguish six different red and six white
wine varieties or variety groupings, respectively. In order to assess the value of regional
denominations in Halliday's sample, we distinguish wines from 27 different regions in
Australia as well as six different regions in New Zealand. Separate equations are estimated
for Australia and New Zealand. The endogenous variable (the tax-inclusive recommended
retail price) is expressed in dollars per 750ml bottle.
Table 1b provides an analogous overview of our second data source from Australia's
popular wine magazine Winestate. It provides wine ratings for 12,625 combined observations
for Australia and New Zealand. In contrast to the 100-point scale for sensory wine quality
adopted by Halliday, Winestate uses a 5-star rating scheme, assigning between 3 and 5 stars

but also using half-stars. (Some wines have no rating at all, which presumably implies less
than 3 stars, so we assigned 2.5 stars for all non-rated wines.) For simplicity, we have given
two points for every star, to avoid using decimals. From the Winestate tastings, a consistent
set is available for each vintage from 1992 to 1999 (1994 to 1999 in the case of New
Zealand), amounting to 11,251 observations from Australia and 1,374 from New Zealand. In
addition, we analyze the full data set for all consistent observations (vintages '92-'00 for
Australia and '92-'99 for New Zealand). For the Australian sample, the average quality rating
is 3.25 stars and the average price is A$19.56 (range A$5-385). For New Zealand, the
average quality rating is 3.44 stars and the average price is NZ$20.59 (range NZ$9-90). In
order to assess regional denominations, the Winestate sample allows us to distinguish 28
different regions for Australia and six different regions for New Zealand.
The model
Following conventional hedonic models, we propose that a bundle of quality attributes
defines any premium wine. Consumer willingness to pay is a function of that bundle of wine
quality attributes. In addition to wine experts’ sensory quality ratings of a particular wine each
vintage and of the winery producing it (commonly available for perusal in wine shops),
willingness to pay for a wine also reflects the varietal reputation and the reputation of the
growing region. An individual quality indicator such as a classic wine rating assigned by wine
critics may also affects buying decisions.
In general, suppose that a bundle of n different quality characteristics describe any
bottle of premium wine: Z = z1, ..., zn (e.g. sensory quality rating, regional origin, variety).
Associated with this bundle is a unit price P(Z). A hedonic price function describes the price
of any particular wine i (Pwi) as a function of its characteristics:
(1) )z...,,z...,,z(PP inij1iwwi =
Following Rosen (1974), the utility maximization problem for a representative individual is
(2) 0XPM.t.s),X(UUMax iw =−−= Z
where X is a composite (numeraire) commodity. An implicit assumption of equation (2) is
that each individual purchases only one bottle of wine i during the relevant time period. Thus,
the model assumes that the quantity consumed is given and that consumers express their
valuation of a particular quality attribute by varying their willingness to pay for it. The first
order condition for the choice of characteristic zj is given by
(3) zP =
XU/zU/
j
wj
∂∂
∂∂∂∂
.
Condition (3) simply states that the consumer’s marginal willingness to pay for
attribute zj is equal to the marginal cost of purchasing more of zj. ∂Pw /∂zj is the marginal
implicit price for characteristic zj and corresponds to the regression coefficients to be
estimated using equation (1). The utility function U can be rewritten as
(4) )...,,...,,,( 1 inijiw zzzPMUUi
−=
Inverting (4), solving for Pwi, and holding all but characteristic j constant yields a bid curve:
(5) Bj = Bj(zj, Z*, U*)
Equation (5) describes the maximum amount that a representative individual would be
willing to pay for one bottle of a particular wine as a function of zj, holding other things
constant. Note that U* is the optimal utility level associated with maximization problem (2)
and Z* is the vector of optimally chosen quantities for all other characteristics. A well-
behaved bid curve exhibits a diminishing willingness to pay for zj or a diminishing marginal
rate of substitution between zj and X. Because of differences in their preferences and/or
incomes, consumers can have different bid curves.
Analogously, a hedonic pricing model can be developed for the supply side of the
market. The inversion of the firm’s cost function yields an offer curve for characteristic j,
which describes the minimum price a firm would be willing to accept for one unit of a
particular wine as a function of zj, holding other things constant. In equilibrium, all bid and
offer curves for each quality attribute and each market participant are tangent to the hedonic
price function. However, we do not need to model the supply side of the wine market,
because we assume that the market is in equilibrium. That is, consumers have made their
utility-maximizing choices, given their knowledge of prices and characteristics of alternative
wines and other goods. Moreover, all firms have made their profit-maximizing decisions,
given their production costs and the costs of alternative wine qualities producible, and that the
resulting prices and quantities clear implicit markets.
Hedonic price analysis relates the price of a good to its utility-generating
characteristics and yields implicit prices for these characteristics. Thus, any quantitative or
qualitative variable that affects consumer utility may be included in a hedonic price function.
We formulate a model assuming that consumers, uncertain about the true sensory quality of a
particular wine, adjust their willingness to pay using expert ratings of wine quality (vintage
ratings) and wine producer as well as varietal and regional reputations as important criteria.
The theoretical model described so far does not restrict the functional form to be
estimated, but it limits the type of explanatory variables. In the empirical literature on
hedonic wine pricing, a variety of different functional forms have been explored and reported.
For example, Landon and Smith (1997) examine five different functions choosing the
reciprocal square root form, Oczkowski (1994) reports a log-linear form, and Nerlove (1995)
compares log-linear, log-log and Box-Cox transformations. Heteroskedasticity is a potential
problem given the nature of the data set. In our case, when we apply a simple Breusch-Pagan
test to the linear, log-linear, and log-log functional forms and fix the level of significance for
the critical χ2 test statistic at 1%, we cannot reject the hypothesis of homoscedasticity for the

log-linear form (Breusch and Pagan 1979). Hence log-linear is the functional form we use,
with log(Price) as the dependent variable. An examination of the correlation matrices for the
coefficient estimates suggests that no serious degree of multicollinearity is present in the data.
Moreover, we observe no correlation between a single measure quality regressor and the error
term which would point to measurement errors and lead to inconsistent OLS estimates as
pointed out by Oczkowski (2000).
4. The results
Australia
Tables 2 and 3 present the estimation results for Australia from the Halliday and
Winestate samples, respectively. Shiraz and Barossa Valley are chosen as the comparator
variety and region (necessary to avoid the dummy variable trap). Thus, all coefficients can be
thought of, as relative to what a Shiraz produced in Barossa Valley would sell for. The first
column reports implicit prices for the complete pooled sample. The other columns show the
estimation results for each of the eight or nine sub-samples of individual vintages. For the
Halliday sample, the coefficients for “vintage rating” and “winery rating” measure the
percentage price premia for a one-point increase in the 100-point scale, respectively. The
dummy variable coefficients for variety and regional origin can be interpreted as a percentage
price impact relative to a Barossa Valley Shiraz. The coefficient for “classic wine” reports the
percentage price premium for a wine that obtained this special recognition. For the Winestate
sample, the coefficients for “rating” measure the percentage price premia for a one-point
increase (on a 10 point scale), which may in turn be interpreted as the percentage price
premium for a ½ star rating increase.
Consider first the estimates using the Halliday data (Table 2). The parameters for
vintage rating are all significant and fairly constant over time. The price premium is 3.1% on
average and varies between 2.4% and 4.5% for a one-point increase in the vintage rating for
the '92-'00 vintages. That is, a one point increase in Halliday’s quality rating would yield an
increase in the price per bottle between 43 cents and $1.09 on an average–priced bottle of
wine for each vintage over that period (see second to last row in Table 2). The coefficients for
producer reputation (“winery rating”) are significant for all vintages except for '92 and ‘00.
The price premium for an average–priced bottle of wine worth $23.91 is equivalent to 68
cents for another ½ star in Halliday’s winery rating. However, it ranges between 16 cents and
$1.14 for individual vintages. Moreover, we observe a downward trend over the period
analyzed which would indicate a decrease in brand reputation. Halliday's “classic wine”
rating is significant for all vintages in Australia except the most recent three vintages (which
are incomplete samples because many premium reds from those vintages are still to be
released), and adds a price premium of about 25.1% (or A$6.00) on average, all other things
equal. Again a downward trend in this coefficient is evident reflecting a premium paid for
older vintages.
Turning to the wine variety dummies, the changes over time in the parameter values
for varieties reflect relative changes in consumer tastes and preferences for the various
varieties. For example, Semillon and Sauvignon Blanc parameters become less negative, that
is, the price discount for them relative to Barossa Valley Shiraz decreases, implying that these
varieties have become less unpopular over the latter 1990s. On average they attract about a
one-third discount relative to Barossa Shiraz, other things equal. For Chardonnay the discount
was only half as large whereas for Riesling it averaged almost 50% (although less so in the
late 1990s). Among the reds, Pinot Noir, Cabernet and Cabernet Blends attracted similar
prices relative to Shiraz (less than 5% discount) not showing a significant difference for most
individual vintages.4 However, Shiraz Blends and other reds were sold at discounts of as
much as 20% or more below the Barossa Shiraz price, again all other things equal. Over time
the variety parameters have become slightly more significant for the whites.
4 For Pinot Noir and Cabernet Blends the difference is also not significant for the whole sample.

When examining the regional dummies, note that they clearly become more significant
over time. For the '92 vintage, only one region (Eden Valley) is significantly different from
Barossa while for the '98 vintage, only 6 of the 26 regions are not significantly different.5
This pattern clearly indicates of an intensifying regional quality differentiation in Australia,
with coefficients for some regions trending down while others are trending up. For example,
the coefficients for wines from Tasmania first become significant in 1997 and then increase
which means that they have become more popular with consumers relative to Barossa Valley
wines. Strong upward trends are also evident for the newly developing super premium cool-
climate regions of the Adelaide Hills, Mornington Peninsula and Yarra Valley with average
premia up to 18%. By way of contrast, the wines of the warm-climate irrigated region of
Riverina become heavily discounted by the mid-1990s and have remained so since then.
Now consider the estimates for the Winestate data (Table 3). The parameters for
vintage rating are all significant but less constant over time compared to Halliday. The price
premium is 6.9% on average and varies between 4.1% to 10.7% for a ½-star improvement in
the sensory quality rating for the '93-'99 vintages. That is, a ½-star increase in Winestate’s
rating would yield an increase in the price per bottle between 66 cents and A$2.28 on an
average–priced bottle of rated wine for the '93-'99 vintages (worth up to $19.56 -- see last row
in Table 3). For the '92 vintage, the percentage price premium for a ½-star rating increase is
even higher at 15.6% which would yield an increase of A$3.12 for the average priced bottle
of that vintage. Unfortunately, the different rating schemes do not allow a direct comparison
of the price premia for both data sets, since Winestate only publishes ratings of three or more
stars. The two data providers also vary in the extent to which they focus on commercial,
super- and ultra-premium wines (as reflected in their different average prices).
5 Because the data sets for the ’99 sand ’00 vintages still exclude many super premium reds still awaiting release, less store can be put on the results for those two years.

For the variety dummies, the Winestate data confirms that the Semillon and Sauvignon
Blanc parameters become less negative, implying that these varieties have become more
popular relative to Barossa Valley Shiraz over the latter 1990s. On average, the Winestate
data also confirms that they attract about a one-third discount relative to Barossa Shiraz, other
things equal, with both coefficients almost identical to Halliday's. For Chardonnay the
discount is slightly higher in the Winestate sample (22% compared with Halliday’s 16%)
whereas for Riesling it averaged 44% which is close to Halliday’s 49%. Both samples
confirm that the discount has declined over the 1990s. Among the reds, Pinot Noir and Merlot
attracted similar prices to Shiraz (less than 5% discount), but other red varieties including
Cabernet, Cabernet Blends and Shiraz Blends show discounts between 6% to 21% below the
Barossa Shiraz price, again all other things equal. Compared to the results from Halliday's
data set, more of these parameters have become significant as the past decade proceeded.
When examining the regional dummies, notice again that they become increasingly
significant over time, although the trend is less clear than in the Halliday sample. In the
sample the only region significantly different from the Barossa Valley for the '92 vintage was
Rutherglen, while for the '98 and ’99 vintages about half the regions are significantly
different. Again, this pattern is an indication of an intensifying regional quality differentiation
in Australia, with coefficients trending up or downward. Moreover, the Winestate data
confirms the strong upward trends are evident for the newly developing super premium cool-
climate regions (e.g. Adelaide Hills, Mornington Peninsula and Tasmania).
New Zealand
The results for New Zealand, shown in Tables 4 and 5, differentiate 10 varieties and 6
regions. (Absence of an entry means insufficient or no observations.) The Chardonnay
variety and the region of Marlborough are chosen as the New Zealand bases. A number of
interesting results, especially when compared with Australia's are worth highlighting. For
example, the parameters for Halliday’s “vintage rating” are all significant and fairly constant
over time, with almost the same price premium for New Zealand as for Australia (2.2%
versus 3.1% for one additional quality point over the full sample period). For the individual
vintages in Halliday's data set, the significant coefficients vary between 1.9% and 3.2%
(which translate into price premia between 49 and 97 cents calculated at the average NZ price
for each vintage). The “classic wine” parameter is almost equally significant with the
premium averaging 22.6% or NZ$5.28, not quite as much as for Australia (A$6.00). The
parameters for “winery rating” also are smaller and much less significant for New Zealand
than for Australia. Variety differences are less pronounced in New Zealand too. Note that
Riesling is discounted by one-third and other whites by 20-29% relative to the base variety
(Chardonnay), whereas the reds enjoy considerable premia (between one-sixth and one-third),
other things equal. Most strikingly, however, are the differences in the degree of regional
differentiation between the two countries. For New Zealand, only five out of the 40 regional
dummies (Table 4) are significantly different from the base region (Marlborough) over the
full sample period (8 vintages), and the degree of difference is not large. Nor are any trends in
the size or significance of coefficients obvious over time.
As was the case for Australia, very similar findings emerge for New Zealand from the
Winestate data (Table 5) as those from the Halliday data (Table 4): vintage ratings are nearly
all significant with no obvious trend over time, variety and regional differences are not
pronounced, and nor are they becoming more significant over time.
Finally on the results, note that in all sub-samples the variation in prices explained by
the model (R2) is always higher for New Zealand, despite much smaller sample sizes and
fewer explanatory variables. Moreover, note that the estimation results are fairly consistent
across the two different data sets for each country, although the Halliday data set has the
higher explanatory power. In addition, the size of the price premia that consumers are willing
to pay for higher-rated wines is consistently less in New Zealand than in Australia (especially
bearing in mind that the NZ$ was worth only 70-85 per cent of the value of the A$ in the
1990s).
5. Implications and areas for further research
At least three clear lessons can be drawn from these results. One is that vintage ratings
by independent writers/critics/judges (in this case those of Winestate magazine judges and for
James Halliday also winery ratings and classic wine categorization) each appear to have a
significant positive impact on the prices that consumers are willing to pay for premium wines,
after taking into account their own reputation assessment for grape varieties and growing
regions, expressed through premiums or discounts relative to a base region and variety. This
is equally true for Australia and New Zealand. It is consistent with Schamel’s (2000) findings
for the United States, based in that case on ratings published in the US magazine The Wine
Spectator, and suggests consumers value this information in their quest for greater knowledge
about available wines.
Second, the premia consumers are willing to pay for higher-rated wines (both
Halliday’s and Winestate’s) appear to have trended downwards slightly over the 1990s. This
is true also for Halliday’s winery ratings. This is consistent with wine consumers in these two
countries becoming more confident in their one ability to discern the quality of different
wines, and hence less reliant on critics’ ratings.
The third lesson is not unrelated to the second. It is that there is a clear trend towards
greater regional and varietal differentiation, at least within Australia. This too suggests a
greater proportion of consumers are becoming more discerning. Note, however, the weaker
regional and varietal differentiation and the absence of any obvious price premia trend in New
Zealand. The weaker varietal differentiation may reflect the relatively few varieties grown in
New Zealand and (a point emphasized by Roberts and Reagans 2001) the newness of many of
its premium wine-producing regions. And the lower price premia New Zealanders seem
willing to pay for higher-rated wines and wineries compared with Australians may simply
reflect the lower per capita incomes in New Zealand and their weaker preference for wine
(their per capita consumption being only 80% that of Australians).
The difference between the two markets in the degree of regional differentiation also
may reflect the fact that Australia has more major premium regions that have been producing
continuously for a long time than does New Zealand. The greater extent to which regional
differentiation is increasing in Australia is partly a consequence of the rapid growth in the
1990s of new super-premium cool-climate regions, which are challenging the supremacy of
the long-established regions. But another contributing factor is that, unlike New Zealand,
Australia has introduced legislation (in 1993) to allow legal registration of regional names
(technically, “geographical indications”).6 That legislation is providing stronger rights over
the intellectual property value of regional names, thereby raising the rates of return on
investments in regional promotion. Even though they cannot say anything about the
profitability of such investments, the above results are not inconsistent with the view that
price premia can be generated through such promotion. The European tradition of
emphasizing region in addition to nation of origin would appear to be gradually taking hold in
Australia. It remains to be seen whether regional reputation indicators become more or less
important over time. On the one hand, regions are investing more in generic promotion of
their regions; but on the other, globalization is causing individual wineries to agglomerate and
put more emphasis on building their corporate brand reputation.
As for the signs and sizes of the premia/discounts attached to variety, they are
consistent with common knowledge. But the fact that there are distinct premia for particular
varieties, over and above a premium or discount for region of origin, distinguishes the
Antipodes from Western Europe where varietal distinctions are downplayed.
6 This was to enable Australia to fulfill its agreement with the European Union on trade in wine, following the Uruguay Round of multilateral trade negotiations. For details see www.awbc.com.au/arms/a_regions.html. An analysis of its possible effects can be found in Kok (1999).

There is much scope for further empirical work of this sort. Two examples of other
questions that might be addressed are mentioned by way of conclusion. First, to what extent
are sub-national regions beginning to enjoy a price premium in markets abroad, or is it still
only national recognition (“Brand Australia”) and corporate brands that matter in those export
markets at this stage? An answer to this question would help to fine-tune the promotional
efforts of wine companies and regional wine associations. If national generic promotion can
be shown to pay abroad, the bodies responsible for that national promotion7 would find it
easier to attract (i) funds for that generic promotion and (ii) support for regulation of wine
exports to ensure the national reputation for quality exports is not tarnished.8 This is
especially crucial in light of Tirole's (1996) theoretical result that producers may suffer a very
long time from previous mistakes.
Second, how well could hedonic pricing models be applied to better understand the
demand for winegrapes by wineries? Various technical features of grapes contribute to the
quality of the wines made from them, but in ways that are not very transparent to
grapegrowers. As quantitative measures improve for measuring those attributes winemakers
are looking for, so will the scope for addressing this issue with hedonic price modeling,
building on the work begun by Golan and Shalit (1993) with respect to Israeli grapes. If
indeed weather variables during the grape growing season are crucial, as the empirical results
of Ashenfelter (2000) and Wood (2001) suggest, those too would need to be included in
addition to such variables and grape sugar level, color and acidity.
7 The Australian Wine and Brandy Corporation and the Wine Institute of New Zealand, respectively. 8 Care is needed in any such empirical work to separate the influences of quality upgrading national R&D on the supply side and promotional efforts on the demand side (see Zhao, Wittwer and Anderson 2001), as well as to distinguish corporate, regional and national generic promotion.

References
Anderson, K. 2001. “Where in the World is the Wine Industry Going?” Plenary Paper
presented at the AARES Annual Conference, Adelaide, 23-25 January. CIES
Discussion Paper 0101, Centre for International Economic Studies, University of
Adelaide (downloadable at http://www.adelaide.edu.au/CIES/wine.htm#other).
Anderson, K. and Norman, D. 2001. Global Wine Production, Consumption and Trade: A
Statistical Compendium, Adelaide: Centre for International Economic Studies.
Anderson, K., D. Norman and G. Wittwer 2001. “Globalization and the World’s Wine
Markets: An Overview”, Opening paper for the post-conference workshop (W90) of
the Australian Wine Industry Technical Conference, on Understanding Developments
in the World’s Wine Markets, Adelaide, 11-12 October.
Arguea, N. and C. Hsiao. 1993. “Econometric Issues of Estimating Hedonic Price Functions.”
Journal of Econometrics 56: 243-67.
Ashenfelter, O. 2000. “Liquid Assets: The International Guide to Fine Wines.” In Optimus:
The Magazine for the Private Investor, Volume 2.
Ashenfelter, O., D. Ashmore and R. Lalonde. 1995. “Bordeaux Wine Vintage Quality and the
Weather.” Chance 8(4): 7-14.
Breusch T. and A. Pagan. 1979. "A Simple Test for Heteroskedasticity and Random
Coefficients of Variation." Econometrica 47: 1287-94.
Byron, R.P. and O. Ashenfelter. 1995. “Predicting the Quality of the Unborn Grange.”
Economic Record 71(212): 40-53, March.

Combris, P., S. Lecocq, and M. Visser. 1997. “Estimation of a Hedonic Price Equation for
Bordeaux Wine: Does Quality Matter?” The Economic Journal 107: 390-402.
Golan, A. and H. Shalit. 1993. “Wine Quality Differentials in Hedonic Grape Pricing.”
Journal of Agricultural Economics 44: 311 - 21.
Halliday, J. 1999a. Australia and New Zealand Wine Companion 2000. Sydney: Harper
Collins (and earlier issues of the book).
Halliday, J. 1999b. Australia and New Zealand Classic Wines. Sydney: Harper Collins.
Halliday, J. 2001. Australia and New Zealand Wine Companion 2002. Sydney: Harper Collins
(and earlier issues of the book).
Kok, S. 1999. The Economics of Geographical Indications: A Case Study of the EU-Australia
Wine Agreement. Unpublished Honours thesis, School of Economics, University of
Adelaide, November.
Landon, S. and C. E. Smith. 1997. “The Use of Quality and Reputation Indicators by
Consumers: The Case of Bordeaux Wine.” Journal of Consumer Policy 20: 289 - 323.
Landon, S. and C. E. Smith. 1998. “Quality Expectations, Reputation and Price.” Southern
Economic Journal 64(3): 628 - 47.
Nerlove, M. 1995. “Hedonic Price Functions and the Measurement of Preferences: The Case
of Swedish Wine Consumers.” European Economic Review 39: 1697 - 716.
Oczkowski, E. 1994. “A Hedonic Price Function for Australian Premium Table Wine.”
Australian Journal of Agricultural Economics 38: 93-110.
Oczkowski, E. 2000. “Hedonic Wine Price Functions and Measurement Error.” Working
Paper No. 24. School of Management, Charles Stuart University, Wagga Wagga.

Rachman, G. 1999. “The Globe in a Glass: Christmas Survey, Wine.” The Economist
353(8150): 97-115, 18-30 December.
Rosen, S. 1974. “Hedonic Prices and Implicit Markets: Product Differentiation in Pure
Competition.” Journal of Political Economy 82: 34 - 55.
Roberts P.W. and R. Reagans. 2001. “Market Experience, Consumer Attention and Price-
Quality Relationships for New World Wines in the US Market, 1987-1999”. GSIA
Working Paper. Graduate School of Industrial Administration, Carnegie Mellon
University, Pittsburgh, February.
Schamel, G. 2000. “Individual and Collective Reputation Indicators of Wine Quality.” CIES
Discussion Paper 0009. Centre for International Economic Studies, University of
Adelaide, March.
Shapiro, C. 1983. “Premiums for High Quality Products as Returns to Reputations.”
Quarterly Journal of Economics 98(4): 659 - 79.
Tirole, J. 1996. "A theory of Collective Reputations (with applications to the persistence of
corruption and to firm quality)." Review of Economic Studies 63: 1-22
Unwin, T. 1999. “Hedonic Price Indexes and the Qualities of Wine.” Journal of Wine
Research 10(2): 95-104.
Waugh, F.V. 1928. “Quality Factors Influencing Vegetable Prices.” Journal of Farm
Economics 10: 185-96.
Winestate. 2001. Tasting Data File 2001. Personal communication with Winestate Magazine,
Adelaide.

Wood, D. 2001. Predicting the Secondary Market Prices of Icon Red Wines, unpublished
Honours thesis, School of Economics, Adelaide University, November.
Zhao, X., G. Wittwer and K. Anderson. 2001. “Estimating the Distribution of Rewards from
R&D and Promotion of Wine”, Paper for the post-conference workshop (W90) of the
Australian Wine Industry Technical Conference, on Understanding Developments in
the World’s Wine Markets, Adelaide, 11-12 October.
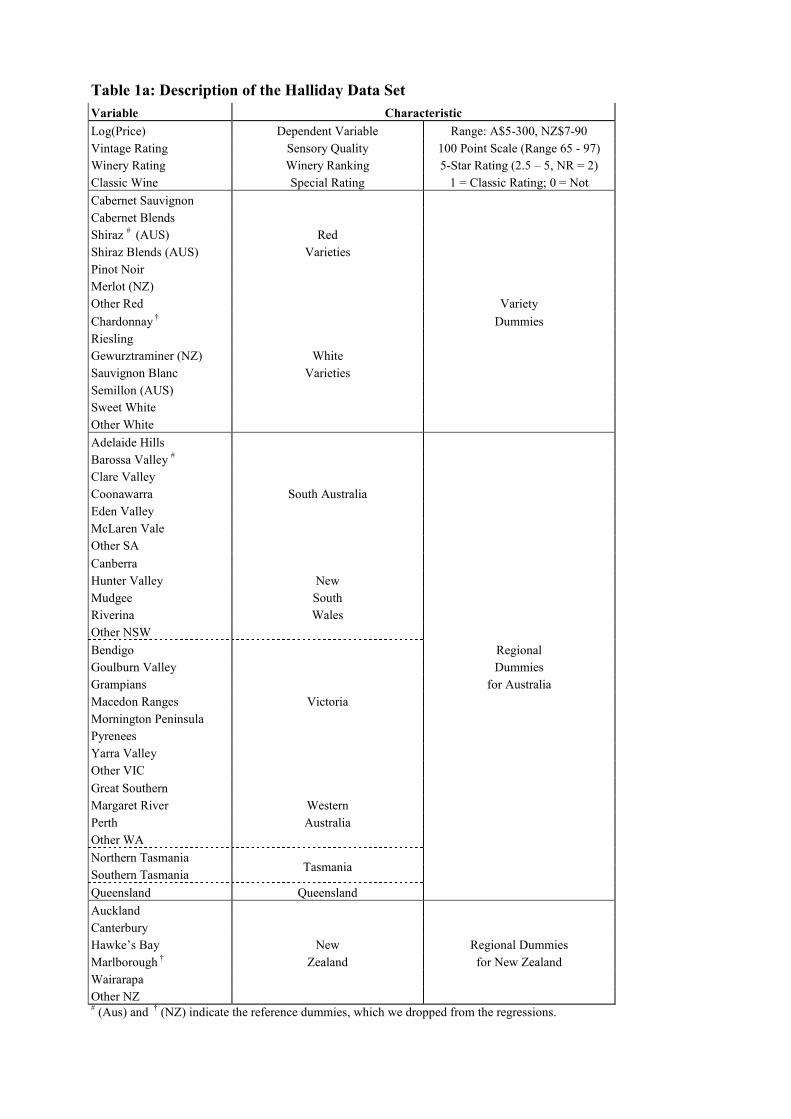
Table 1a: Description of the Halliday Data Set Variable Characteristic Log(Price) Dependent Variable Range: A$5-300, NZ$7-90 Vintage Rating Sensory Quality 100 Point Scale (Range 65 - 97) Winery Rating Winery Ranking 5-Star Rating (2.5 – 5, NR = 2) Classic Wine Special Rating 1 = Classic Rating; 0 = Not Cabernet Sauvignon Cabernet Blends Shiraz # (AUS) Red Shiraz Blends (AUS) Varieties Pinot Noir Merlot (NZ) Other Red Variety Chardonnay † Dummies Riesling Gewurztraminer (NZ) White Sauvignon Blanc Varieties Semillon (AUS) Sweet White Other White Adelaide Hills Barossa Valley # Clare Valley Coonawarra South Australia Eden Valley McLaren Vale Other SA Canberra Hunter Valley New Mudgee South Riverina Wales Other NSW Bendigo Regional Goulburn Valley Dummies Grampians for Australia Macedon Ranges Victoria Mornington Peninsula Pyrenees Yarra Valley Other VIC Great Southern Margaret River Western Perth Australia Other WA Northern Tasmania Southern Tasmania Tasmania Queensland Queensland Auckland Canterbury Hawke’s Bay New Regional Dummies Marlborough † Zealand for New Zealand Wairarapa Other NZ # (Aus) and † (NZ) indicate the reference dummies, which we dropped from the regressions.

Table 1b: Description of the Winestate Data Set Variable Characteristic Log(Price) Dependent Variable Range: A$5-385, NZ$9-90 Star Rating Sensory Quality 3, 3½, 4, 4½, 5-Stars (NR = 2½) Point Rating -------- " -------- => 10-Point Scale (Range 5-10) Cabernet Sauvignon Cabernet Blends Shiraz # Red Shiraz Blends (AUS) Varieties Pinot Noir Merlot Other Red Variety Chardonnay † Dummies Riesling Sauvignon Blanc White Semillon Varieties Sweet White (AUS) Other White Adelaide Hills Barossa Valley # Clare Valley Coonawarra Eden Valley South Australia McLaren Vale Other Limestone Coast Riverland Langhorne Creek Other SA Canberra Hunter Valley Mudgee New South Wales Riverina Regional Other NSW Dummies Goulburn Valley for Australia Mornington Peninsula Rutherglen King Valley Victoria Yarra Valley Central & West VIC Other VIC Great Southern Margaret River Western Perth Australia Other WA Tasmania Tasmania Queensland Queensland Auckland Canterbury Hawke's Bay New Regional Dummies Marlborough † Zealand for New Zealand Nelson Other NZ # (Aus) and † (NZ) indicate the reference dummies, which we dropped from the regressions.

Table 2: Regression results for Australia [Halliday Data Set]
Parameter '92-'00 2000 1999 1998 1997 1996 1995 1994 1993 1992CONSTANT 0.184* 0.687 -0.468 -1.020* 0.116 0.478* 0.586* 0.599* 0.313 -0.347Vintage Rating 0.031* 0.024* 0.037* 0.045* 0.031* 0.027* 0.027* 0.025* 0.028* 0.038*Winery Rating 0.057* 0.018 0.070* 0.039* 0.047* 0.085* 0.065* 0.092* 0.081* 0.070Classic Wine 0.251* 0.078 0.030 0.092 0.240* 0.245* 0.236* 0.269* 0.354* 0.303*Cabernet Sauvignon -0.047* -0.119 0.021 -0.112* -0.001 -0.039 -0.091 -0.035 -0.113* -0.027Cabernet Blends -0.024 -0.332* 0.015 -0.126* -0.033 -0.064 0.011 0.021 0.004 0.003Pinot Noir 0.002 -0.049 0.103* -0.008 -0.016 -0.054 -0.033 -0.030 -0.328* -0.310*Shiraz Blends -0.179* 0.046 -0.145* -0.225* -0.076 -0.073 -0.202* -0.290* 0.148 0.240Other Red -0.053* -0.178 0.116* -0.058 0.023 -0.112* -0.094 -0.150* -0.134 0.006Chardonnay -0.163* -0.124 0.006 -0.212* -0.159* -0.222* -0.187* -0.179* -0.108 -0.054Riesling -0.486* -0.231* -0.331* -0.590* -0.447* -0.557* -0.556* -0.523* -0.364* -0.459*Sauvignon Blanc -0.318* -0.164 -0.176* -0.350* -0.270* -0.402* -0.365* -0.341* -0.627 -0.418Semillon -0.339* -0.148 -0.129 -0.345* -0.328* -0.421* -0.421* -0.424* -0.355* -0.316Sweet White -0.293* -0.141 -0.141 -0.138 -0.322* -0.373* -0.178 -0.264* -0.395* -0.462*Other White -0.371* -0.155 -0.137* -0.416* -0.341* -0.397* -0.496* -0.454* -0.487* -0.231Great Southern 0.089* 0.234* 0.019 0.248* 0.229* 0.082 -0.014 0.048 0.062 -0.118Margaret River 0.218* 0.257* 0.186* 0.305* 0.269* 0.223* 0.131* 0.233* 0.257* 0.118Perth -0.081* 0.069 -0.057 0.005 0.014 -0.258* -0.035 -0.153 -0.065 -0.019Other WA 0.193* 0.216* 0.094 0.418* 0.275* 0.186 0.192* 0.108 0.129 0.043Adelaide Hills 0.152* 0.263* 0.114 0.225* 0.302* 0.085 0.093 0.130 0.018 -0.221Clare Valley 0.023 0.193* -0.080 0.188* 0.129* -0.003 -0.062 -0.026 0.007 -0.163Coonawarra 0.060* 0.156 0.043 0.197* 0.111 -0.037 -0.009 0.048 0.061 -0.048Eden Valley 0.373* 0.133 0.174 0.470* 0.441* 0.365* 0.387* 0.348* 0.275* 0.498*McLaren Vale 0.051* 0.025 0.035 0.258* 0.078 -0.043 -0.084 0.088 0.083 -0.114Other SA -0.062* 0.063 0.038 0.014 0.055 -0.187* -0.213* -0.045 0.054 -0.290Canberra 0.045 0.238* 0.118 0.307 0.105 -0.028 -0.040 -0.078 0.134 -0.325Hunter Valley -0.002 0.148* 0.017 0.151* 0.079 -0.043 -0.086 -0.101 -0.158 -0.335Mudgee -0.109* 0.024 -0.031 0.236* 0.006 -0.097 -0.356* -0.380* -0.402* -0.452Riverina -0.297* -0.214 -0.287* -0.214* -0.281* -0.335* -0.496* -0.170 -0.246 -0.105Other NSW -0.045 0.209* 0.061 0.074 0.055 -0.179* -0.147 -0.109 -0.098 -0.303Bendigo 0.080* 0.362* 0.064 0.180 0.144 -0.075 0.059 0.079 0.098 -0.189Goldburn Valley 0.005 -0.021 -0.189 0.170 -0.007 -0.135 -0.028 0.127 -0.019 -0.002Grampians 0.143* 0.192 0.109 0.258* 0.187 0.024 0.257 0.077 0.061 0.191Mecedon Ranges 0.192* 0.291* 0.149 0.355* 0.243* 0.245* 0.155 0.085 0.141 -0.134Mornington Peninsula 0.178* 0.269* 0.151* 0.243* 0.282* 0.204* 0.135 0.167* 0.073 -0.449Pyrenees 0.231* 0.267* 0.177* 0.331* 0.366* 0.115 0.192 0.196 0.248 0.151Yarra Valley 0.127* 0.199* 0.123 0.182* 0.239* 0.100 0.096 0.121 0.074 0.004Other Victoria 0.045* 0.243* 0.065 0.111* 0.046 -0.020 0.026 -0.013 0.018 -0.069Northern Tasmania 0.092* 0.246* -0.034 0.196* 0.183* 0.142 0.035 -0.060 -0.154 -0.078Southern Tasmania 0.118* 0.359* 0.003 0.177* 0.167* 0.113 0.065 0.108 0.218 -0.251Queensland -0.037 0.136 0.198 -0.123 -0.051 0.135* -0.085 -0.204 -0.150 0.044
# of observations 6145 424 655 1013 958 909 759 724 448 255R2 (%) 41 30 38 41 46 46 46 46 49 47
Av. retail price (A$) 23.91 17.98 23.63 24.28 23.50 24.04 23.99 24.78 25.30 28.92Av. point rating 87.2 87.0 87.3 87.9 87.4 86.9 86.5 87.1 86.5 87.9Av. winery rating (stars) 4.01 3.83 3.82 3.98 4.01 4.07 4.07 4.07 4.085 4.149
1-point price effect (A$) 0.74 0.43 0.88 1.09 0.74 0.66 0.65 0.62 0.72 1.09½ -star price effect (A$) 0.68 0.16* 0.82 0.47 0.56 1.02 0.79 1.14 1.03 1.01** = significant at the 5% level.

Table 3: Regression results for Australia [Winestate Data Set]
Parameter '92-'99 1999 1998 1997 1996 1995 1994 1993 1992CONSTANT 2.586* 2.550* 2.641* 2.767* 2.699* 2.634* 2.419* 2.432* 2.183*Point Rating 0.069* 0.041* 0.045* 0.044* 0.060* 0.073* 0.092* 0.107* 0.156*Cabernet Sauvignon -0.063* -0.003 -0.019 -0.062* -0.054 -0.125* -0.042 -0.012 -0.238*Cabernet Blends -0.141* -0.149* -0.094* -0.141* -0.161* -0.199* -0.112* -0.103 -0.315*Shiraz Blends -0.212* -0.307* -0.254* -0.063 -0.258* -0.140 -0.012 -0.322* -0.240Pinot Noir -0.041* 0.105* 0.087* -0.022 -0.111* -0.138* -0.077 -0.011* -0.357*Merlot -0.001 -0.068 0.067* -0.016 0.021 -0.097 0.083 0.219 0.039Other Red -0.194* -0.115* -0.076* -0.254* -0.187* -0.282* -0.155* -0.239* -0.215Chardonnay -0.225* -0.143* -0.167* -0.247* -0.258* -0.249* -0.124* -0.136* -0.530*Riesling -0.439* -0.250* -0.371* -0.440* -0.491* -0.525* -0.417* -0.347* -0.567*Sauvignon Blanc -0.319* -0.121* -0.253* -0.396* -0.418* -0.401* -0.250* -0.088 -0.504*Semillon -0.332* -0.192* -0.253* -0.416* -0.442* -0.393* -0.226* -0.276* -0.419*Sweet White -0.283* -0.001 -0.116 -0.223* -0.507* -0.800* -0.548* --- ---Other White -0.415* -0.220* -0.379* -0.450* -0.471* -0.495* -0.394* -0.335* -0.690*Adelaide Hills 0.145* 0.248* 0.231* 0.173* 0.121* 0.083 0.064 -0.110 0.122Clare Valley -0.029 0.103* 0.047 0.010 -0.043 -0.052 -0.082 -0.300* -0.125Coonawarra 0.097* 0.089 0.186* 0.112* 0.105* 0.015 0.078 -0.053 0.068Eden Valley 0.245* 0.147* 0.081 0.316* 0.377* 0.598* 0.905* -0.414 0.088McLaren Vale 0.012 0.038 0.156* 0.058 0.007 0.008 -0.152* -0.318* -0.159Oth. Limestone Coast 0.062* 0.127* 0.146* 0.067 0.025 0.345* 0.070 -0.667 ---Riverland -0.396* -0.254* -0.312* -0.288* -0.454* -0.626* -0.609* -0.644* -0.429Langhorne Creek -0.026 0.059 0.039 0.090 -0.118 0.073 -0.193 -0.129 -0.253Other SA -0.131* 0.121 -0.048 -0.057 -0.164* -0.208* -0.280* -0.237* -0.128Canberra -0.004 0.313 0.130 0.154 0.030 -0.115 -0.141 -0.306 -0.294Hunter Valley 0.065* 0.179* 0.123* 0.058 0.057 0.019 0.036 -0.085 0.007Mudgee -0.113* 0.009 0.033 0.092 -0.201* -0.264* -0.427* -0.754* -0.252Riverina -0.341* -0.407* -0.321* -0.328* -0.222* -0.351* -0.239* -0.230 -0.018Other NSW -0.049* -0.011 -0.003 -0.011 -0.099 -0.073 -0.015 -0.225 ---Goulburn Valley -0.096* 0.063 -0.113 -0.021 -0.143* -0.066 -0.133 -0.081 -0.303Mornington Peninsula 0.212* 0.300* 0.325* 0.231* 0.211 0.249* 0.053 -0.259 0.181Rutherglen -0.121* 0.051 -0.019 -0.105 -0.154* -0.103 -0.132 -0.296 -0.277*King Valley 0.058 0.157 0.063 -0.069 0.003 0.085 0.129 0.424 0.226Yarra Valley 0.155* 0.068 0.253* 0.212* 0.128* 0.161* 0.167* 0.004 0.082Central & West VIC 0.124* 0.187* 0.197* 0.161* 0.090 0.068 0.060 0.000 0.129Other Victoria -0.078* 0.094 0.019 -0.069 -0.024 -0.192* -0.204* -0.302* -0.073Great Southern 0.062* 0.219* 0.159* 0.133* 0.112* -0.031 -0.084 -0.020 0.058Margaret River 0.250* 0.287* 0.270* 0.363* 0.347* 0.182* 0.084 0.131 0.069Perth -0.047 -0.013 0.020 0.017 -0.022 -0.072 -0.170 --- -0.103Other WA 0.040 0.186* 0.128* 0.035 -0.042 0.071 0.048 -0.280* -0.357Tasmania 0.205* 0.292* 0.269* 0.208* 0.190* 0.199* 0.118 -0.162 0.411Queensland -0.075* 0.080 0.013 -0.102 0.047 -0.219 -0.008 -0.280 -0.329
# of observations 11251 1345 2154 1993 2001 1551 1186 489 367R2 (%) 29 36 32 31 31 32 29 36 47
Av. retail price (A$) 19.56 15.87 19.29 20.22 20.31 20.03 20.75 21.33 19.98Av. point rating 6.50 5.91 6.41 6.59 6.68 6.65 6.70 6.70 6.21Av. star rating 3.25 2.96 3.20 3.29 3.34 3.32 3.35 3.35 3.11½ -star price effect (A$) 1.36 0.65 0.86 0.88 1.21 1.456 1.92 2.28 3.12* = significant at the 5% level.
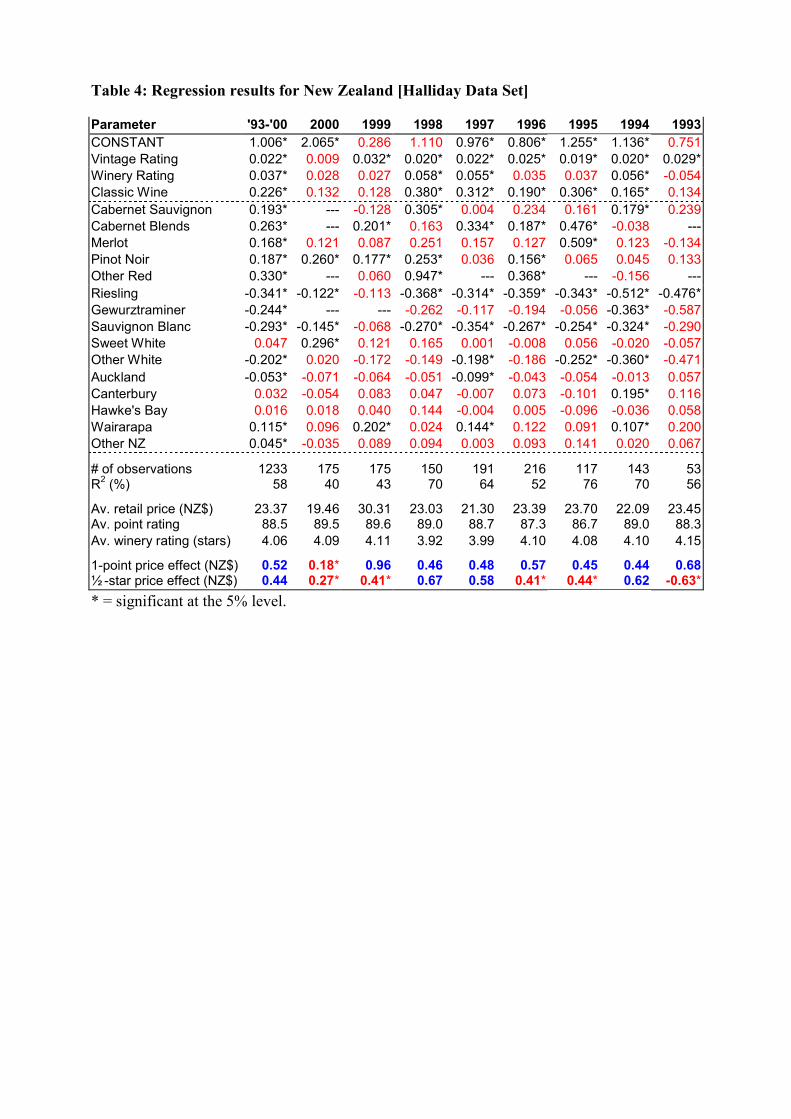
Table 4: Regression results for New Zealand [Halliday Data Set]
Parameter '93-'00 2000 1999 1998 1997 1996 1995 1994 1993CONSTANT 1.006* 2.065* 0.286 1.110 0.976* 0.806* 1.255* 1.136* 0.751Vintage Rating 0.022* 0.009 0.032* 0.020* 0.022* 0.025* 0.019* 0.020* 0.029*Winery Rating 0.037* 0.028 0.027 0.058* 0.055* 0.035 0.037 0.056* -0.054Classic Wine 0.226* 0.132 0.128 0.380* 0.312* 0.190* 0.306* 0.165* 0.134Cabernet Sauvignon 0.193* --- -0.128 0.305* 0.004 0.234 0.161 0.179* 0.239Cabernet Blends 0.263* --- 0.201* 0.163 0.334* 0.187* 0.476* -0.038 ---Merlot 0.168* 0.121 0.087 0.251 0.157 0.127 0.509* 0.123 -0.134Pinot Noir 0.187* 0.260* 0.177* 0.253* 0.036 0.156* 0.065 0.045 0.133Other Red 0.330* --- 0.060 0.947* --- 0.368* --- -0.156 ---Riesling -0.341* -0.122* -0.113 -0.368* -0.314* -0.359* -0.343* -0.512* -0.476*Gewurztraminer -0.244* --- --- -0.262 -0.117 -0.194 -0.056 -0.363* -0.587Sauvignon Blanc -0.293* -0.145* -0.068 -0.270* -0.354* -0.267* -0.254* -0.324* -0.290Sweet White 0.047 0.296* 0.121 0.165 0.001 -0.008 0.056 -0.020 -0.057Other White -0.202* 0.020 -0.172 -0.149 -0.198* -0.186 -0.252* -0.360* -0.471Auckland -0.053* -0.071 -0.064 -0.051 -0.099* -0.043 -0.054 -0.013 0.057Canterbury 0.032 -0.054 0.083 0.047 -0.007 0.073 -0.101 0.195* 0.116Hawke's Bay 0.016 0.018 0.040 0.144 -0.004 0.005 -0.096 -0.036 0.058Wairarapa 0.115* 0.096 0.202* 0.024 0.144* 0.122 0.091 0.107* 0.200Other NZ 0.045* -0.035 0.089 0.094 0.003 0.093 0.141 0.020 0.067
# of observations 1233 175 175 150 191 216 117 143 53R2 (%) 58 40 43 70 64 52 76 70 56
Av. retail price (NZ$) 23.37 19.46 30.31 23.03 21.30 23.39 23.70 22.09 23.45Av. point rating 88.5 89.5 89.6 89.0 88.7 87.3 86.7 89.0 88.3Av. winery rating (stars) 4.06 4.09 4.11 3.92 3.99 4.10 4.08 4.10 4.15
1-point price effect (NZ$) 0.52 0.18* 0.96 0.46 0.48 0.57 0.45 0.44 0.68½ -star price effect (NZ$) 0.44 0.27* 0.41* 0.67 0.58 0.41* 0.44* 0.62 -0.63** = significant at the 5% level.

Table 5: Regression results for New Zealand [Winestate Data Set]
Parameter '94-'99 1999 1998 1997 1996 1995 1994 CONSTANT 2.761* 2.530* 2.963* 2.782* 2.608* 2.760* 2.800* Point Rating 0.044* 0.048* 0.014 0.042* 0.065* 0.041* 0.047 Cabernet Sauvignon 0.063 --- 0.032 0.031 0.170 0.000 0.038 Cabernet Blends 0.140* --- -0.107 0.269* 0.289* 0.174* -0.024 Merlot 0.078* --- 0.032 0.150* 0.047 0.184* 0.007 Pinot Noir 0.232* --- 0.352* 0.291* 0.218* 0.090 0.134 Shiraz 0.091 --- --- --- 0.156 --- 0.077 Other Red 0.031 0.115 -0.179* 0.014 0.145 0.178 --- Riesling -0.239* -0.037 -0.212* -0.256* -0.220* -0.282* -0.342* Sauvignon Blanc -0.255* -0.095 -0.223* -0.258* -0.255* -0.304* -0.027 Semillon -0.142* --- -0.073 -0.096 -0.135 -0.335* --- Other White -0.256* 0.195* -0.227* -0.266* -0.309* -0.369* -0.415 Auckland -0.087* -0.061 -0.063 -0.099* -0.067 -0.089 -0.050 Canterbury -0.091* --- --- -0.157* -0.041 -0.002 -0.137 Hawke's Bay 0.058* -0.111 0.005 0.147* 0.042 0.001 0.139 Nelson -0.103* -0.088 -0.118 -0.105 -0.023 -0.098 --- Other NZ 0.064* 0.124 -0.054 0.076 0.109* 0.116 0.043
# of observations 1374 126 248 344 362 194 90 R2 (%) 37 28 33 48 41 47 26
Av. retail price (NZ$) 20.59 17.70 19.62 20.30 21.23 21.14 24.43 Av. point rating 6.88 7.09 6.66 6.75 6.97 6.90 7.31 Av. star rating 3.44 3.54 3.33 3.38 3.49 3.45 3.66 ½ -star price effect (NZ$) 0.90 0.85 0.27* 0.84 1.37 0.87 1.14* * = significant at the 5% level.

CIES DISCUSSION PAPER SERIES The CIES Discussion Paper series provides a means of circulating promptly papers of interest to the research and policy communities and written by staff and visitors associated with the Centre for International Economic Studies (CIES) at the Adelaide University. Its purpose is to stimulate discussion of issues of contemporary policy relevance among non-economists as well as economists. To that end the papers are non-technical in nature and more widely accessible than papers published in specialist academic journals and books. (Prior to April 1999 this was called the CIES Policy Discussion Paper series. Since then the former CIES Seminar Paper series has been merged with this series.) Copies of CIES Policy Discussion Papers may be downloaded from our Web site at http://www.adelaide.edu.au/cies/ or are available by contacting the Executive Assistant, CIES, School of Economics, Adelaide University, SA 5005 AUSTRALIA. Tel: (+61 8) 8303 5672, Fax: (+61 8) 8223 1460, Email: [email protected]. Single copies are free on request; the cost to institutions is US$5.00 overseas or A$5.50 (incl. GST) in Australia each including postage and handling. For a full list of CIES publications, visit our Web site at http://www.adelaide.edu.au/cies/ or write, email or fax to the above address for our List of Publications by CIES Researchers, 1989 to 1999 plus updates. 0142 Busse, Matthias, “Do Labour Standards Affect Comparative Advantage? Evidence
for Labour-Intensive Goods”, November 2001. 0141 Stringer, Randy and Glyn Wittwer, “Grapes, Wine and Water: Modelling Water
Policy Reforms in Australia”, November 2001. 0140 Damania, Richard , Randy Stringer, K. Ullas Karanth, and Brad Stith, “The
Economics of Protecting Tiger Populations: Linking Household Behaviour to Poaching and Prey Depletion”, November 2001.
0139 Damania, Richard and Erwin H. Bulte, “The Economics of Captive Breeding and Endangered Species Conservation”, October 2001.
0138 James, Jennifer S and Julian M Alston, “Taxes and Quality: A Market-Level Analysis”, October 2001.
0137 Rajan, Ramkishen, “Adopting an appropriate exchange rate regime: fixed or floating?”, October 2001. (Paper prepared for Malaysian Economic Outlook 2001, organized by the Malaysian Institute for Economic Research, Kuala Lumpur, Malaysia).
0136 Anderson, Kym, Dimarana, Betina, Francois, Joseph, Hertel, Tom, Hoekman, Bernard, and Martin, Will, “The Cost of Rich (and Poor) Country Protection to Developing Countries”, September 2001. (Forthcoming in Journal of African Economies 2002.)
0135 Rajan, Ramkishen and Chung-Hua Shen, “Are Crisis-Devaluations contractionary?”, September 2001.
0134 Shapiro, Perry and Petchey, Jeffrey “Internationally Mobile Factors of Production and Economic Policy in an Integrated Regional Union of States”, August 2001.
0133 Rajan, Ramkishen and Graham Bird, Still the Weakest Link: the Domestic Financial System and Post-1998 Recovery in East Asia”, July 2001. (Since published in Development Policy Review, 19 (3), pp.355-66, 2001
0132 Rajan, Ramkishen and Bird, Graham, “Banks, Maturity Mismatches and Liquidity Crises: a Simple Model”, July 2001.
0131 Montreevat, Sakulrat and Rajan, Ramkishen, “Financial Crisis, Bank Restructuring and Foreign Bank Entry: an Analytic Case Study of Thailand”, June
2001. 0130 Francois, Joseph F. “Factor Mobility, Economic Integration and the Location of
Industry”, June 2001. 0129 Francois, Joseph F. “Flexible Estimation and Inference Within General
Equilibrium Systems”, June 2001. 0128 Rajan, Ramkishen S., "Revisiting the Case for a Tobin Tax Post Asian Crisis: a
Financial Safeguard or Financial Bonanza?" June 2001. (Paper prepared for presentation at a United Nations Meeting on Resource Mobilisation for Development, New York, June 25-26, 2001.)
0127 Rajan, Ramkishen S. and Graham Bird, "Regional Arrangements for Providing Liquidity in a Financial Crisis: Developments in Asia", June 2001.
0126 Anderson, Kym and Shunli Yao, "China, GMOs, and World Trade in Agricultural and Textile Products", June 2001. (Paper prepared for the Fourth Annual Conference on Global Economic Analysis, Purdue University, West Lafayette 27-29 June 2001.)
0125 Anderson, Kym, "The Globalization (and Regionalization) of Wine", June 2001. (Paper for the National Academies Forum’s Symposium on Food and Drink in Australia: Where Are We Today? Adelaide, 5-6 July 2001.) (Forthcoming in Australian Agribusiness Review 2002.)
0124 Rajan, Ramkishen S., "On the Road to Recovery? International Capital Flows and Domestic Financial Reforms in East Asia", May 2001.
0123 Chunlai, Chen, and Christopher Findlay., "Patterns of Domestic Grain Flows and Regional Comparative Advantage in Grain Production in China", April 2001.
0122 Rajan, Ramkishen S., Rahul Sen and Reza Siregar, "Singapore and the New Regionalism: Bilateral Economic Relations with Japan and the US", May 2001.
0121 Anderson, Kym, Glyn Wittwer and Nick Berger, "A Model of the World Wine Market", May 2001. (Forthcoming in Economic Modelling, 2002)
0120 Barnes, Michelle, and Shiguang Ma, "Market Efficiency or not? The Behaviour of China’s Stock Prices in Response to the Announcement of Bonus Issues," April 2001.
0119 Ma, Shiguang, and Michelle Barnes, "Are China’s Stock Markets Really Weak-form Efficient?" April 2001.
0118 Stringer, Randy, "How Important are the 'Non-traditional' Economic Roles Agriculture in Development?" April 2001.
0117 Bird, Graham, and Ramkishen S. Rajan, "Economic Globalization: How Far and How Much Further?" April 2001. (Since published in World Economics, 2 (3), pp.1-18, 2001.)
0116 Damania, Richard, "Environmental Controls with Corrupt Bureaucrats," April 2001. 0115 Whitley, John, "The Gains and Losses from Agricultural Concentration," April 2001. 0114 Damania, Richard, and E. Barbier, "Lobbying, Trade and Renewable Resource
Harvesting," April 2001. 0113 Anderson, Kym, " Economy-wide Dimensions of Trade Policy and Reform," April
2001. (Forthcoming in Handbook on Developing Countries and the Next Round of WTO Negotiations, Washington DC: World Bank, 2002.)
0112 Tyers, Rod, "European Unemployment and the Asian Emergence: Insights from the Elemental Trade Model," March 2001. (Forthcoming in The World Economy, Vol. 24, 2001.)
0111 Harris, Richard G., "The New Economy and the Exchange Rate Regime," March 2001.
0110 Harris, Richard G., "Is There a Case for Exchange Rate Induced Productivity
Changes?", March 2001. 0109 Harris, Richard G., "The New Economy, Globalization and Regional Trade
Agreements", March 2001. 0108 Rajan, Ramkishen S., "Economic Globalization and Asia: Trade, Finance and
Taxation", March 2001. (Since published in ASEAN Economic Bulletin, 18(1), April 2001.)
0107 Chang, Chang Li Lin, Ramkishen S. Rajan, "The Economics and Politics of Monetary Regionalism in Asia", March 2001. (Since published in ASEAN Economic Bulletin 18(1), April 2001.)
0106 Pomfret, Richard, "Reintegration of Formerly Centrally Planned Economies into the Global Trading System", February 2001. (Since published in ASEAN Economic Bulletin, 18(1), April 2001).
0105 Manzano, George, "Is there any Value-added in the ASEAN Surveillance Process?" February 2001. (Since published in ASEAN Economic Bulletin, 18(1), April 2001).
0104 Anderson, Kym, "Globalization, WTO and ASEAN", February 2001. (Since published in ASEAN Economic Bulletin, 18(1): 12-23, April 2001).
0103 Schamel, Günter and Kym Anderson, "Wine Quality and Varietal, Regional and Winery Reputations: Hedonic Prices for Australia and New Zealand", January 2001, Revised October 2001.
0102 Wittwer, Glyn, Nick Berger and Kym Anderson, "Modelling the World Wine Market to 2005: Impacts of Structural and Policy Changes", January 2001.
0101 Anderson, Kym, "Where in the World is the Wine Industry Going?" January 2001. 0050 Allsopp, Louise, "A Model to Explain the Duration of a Currency Crisis", December
2000.(Since published in International Journal of Finance and Economics 5(4):331-337, 2000.)
0049 Anderson, Kym, "Australia in the International Economy", December 2000. (Forthcoming as Ch. 11 in Creating an Environment for Australia's Growth, edited by P.J. Lloyd, J. Nieuwenhuysen and M. Mead, Cambridge and Sydney: Cambridge University Press, 2001.)
0048 Allsopp, Louise, " Common Knowledge and the Value of Defending a Fixed Exchange Rate", December 2000. (Forthcoming in the Journal of Macroeconomics)
0047 Damania, Richard, Per G. Fredriksson and John A. List, "Trade Liberalization, Corruption and Environmental Policy Formation: Theory and Evidence", December 2000.
0046 Damania, Richard, "Trade and the Political Economy of Renewable Resource Management", November 2000.
0045 Rajan, Ramkishen S., Rahul Sen and Reza Siregar, "Misalignment of the Baht, Trade Imbalances and the Crisis in Thailand", November 2000.
0044 Rajan, Ramkishen S., and Graham Bird, "Financial Crises and the Composition of International Capital Flows: Does FDI Guarantee Stability?", November 2000.
0043 Graham Bird and Ramkishen S. Rajan, "Recovery or Recession? Post-Devaluation Output Performance: The Thai Experience", November 2000.