Embed Size (px)
Citation preview
Western Indian Ocean J. Mar. Sci. Vol. 12. No. 2, pp. 151-168, 2013 © 2014 WIOMSA
Winners and Losers in the Finfish Trade on Mafia Island: A Value Chain Analysis
K. Kulindwa1 and Razack Lokina2
1Associate Professor, Department of International Environment and Development Studies, Norwegian University of Life Sciences, P.O. Box 5003, 1432 Ås, Norway;
2University of Dar es Salaam, Department of Economics, Box 35045, Dar es Salaam.
Keywords: Value chain, market arrangements, finfish trade, economic winners and losers, bargaining power
Abstract — Fish trade on Mafia Island involves several players in the value chain from fishing to the plate, either on Mafia Island or mainland Tanzania. This paper investigates the different actors in the value chain to establish how much each of them invests in the process of adding value to fish as a traded commodity, and how much they gain from it, with the intention of establishing who are the winners and losers in the fish trade. The results showed that small-scale fishers in Mafia are mostly on the losing side, spending long hours preparing for and undertaking the risky activity of fishing in rudimentary canoes, plus the cost of maintenance and the acquisition of their fishing gear. Due to their disadvantaged position and lacking the necessary facilities for the preservation and storage of their catch, they are forced to sell it at low prices in prearranged market arrangements to avoid spoilage and, therefore, incur loss. The findings of this study indicated where a major policy change would improve fishers’ welfare. Arrangements need to be made for small-scale fishers and female fish vendors to access markets to improve their gain at most fish landing and trading sites. This would help to reward the hard work and risk taken by fishers and women fish vendors, and reduce their poverty.
Corresponding author: KKEmail: [email protected]
INTRODUCTION
Fishing is an important activity for communities living adjacent to rivers, lakes and seas, constituting an economic activity that generates income and provides sustenance to those who engage in fishing as an occupation. On Mafia Island in Tanzania, as in most developing countries endowed with marine resources, fishing is mostly undertaken by small-scale artisanal fishers as a subsistence activity which
has, over time, become increasingly become commercialised. Fishing is both a subsistence strategy for small-scale fishers on Mafia Island, providing an important source of protein for their families, as well as an increasingly important income-generating activity which provides for their household needs.
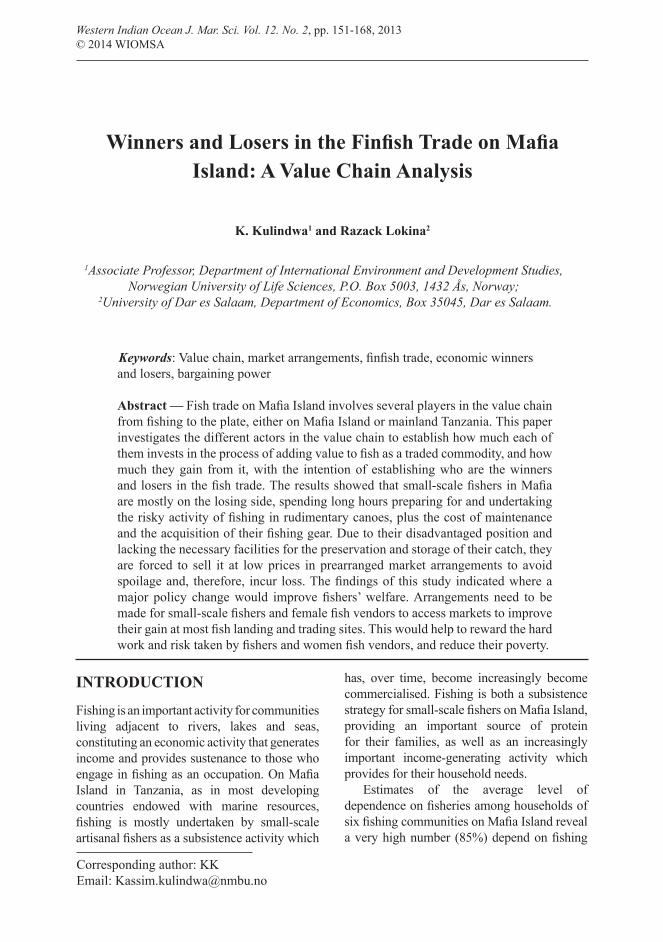
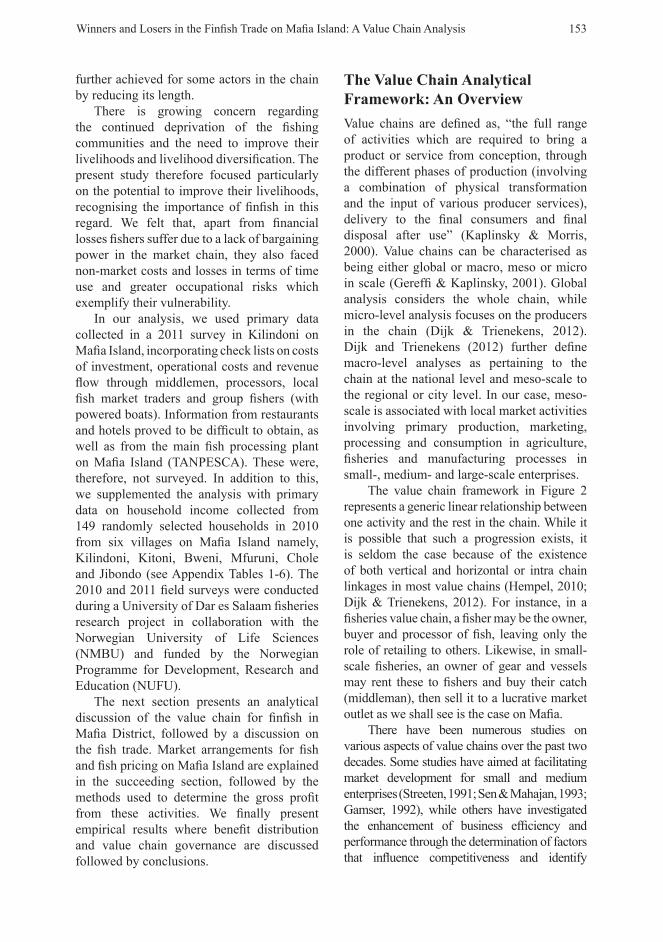
Estimates of the average level of dependence on fisheries among households of six fishing communities on Mafia Island reveal a very high number (85%) depend on fishing
152 K. Kulindwa and R. Lokina
(Fig. 1). Furthermore, the sources of livelihood for these communities is narrow, apart from fishing, the second highest contributor to their livelihood being seaweed, representing an average of 12.6% of the total annual household income. Last are agriculture and petty trade which account on average for 2.4% of their activities (see also appendix Table 3). This goes on to show how important fishing activity is to the livelihood of the Mafia inhabitants.
Fishing involves many actors and stakeholders in the linkages in the industry (backward and forward), who play different roles but make up the totality of the industry. The fish trade on Mafia, as in other artisanal fishing communities, involves several players and stages in the fisheries value chain, from fishing itself to the consumers’ table, both on Mafia Island and mainland Tanzania, and beyond.
This article investigates the different actors in the value chain to establish how much each of them contributes to the process of adding value to fish as a traded commodity in the markets of Mafia and mainland Tanzania. We focused mainly on the small- and medium-
scale fishers’ position in the chain to evaluate their contribution and what they gain from it. The aims were to investigate the categories of business players who benefit most and those who benefit least, or lose, in finfish trade on Mafia Island. To achieve this, we used value chain analysis to try and trace the nature of activities, the costs and the gross margins in terms of market values. Although all of the stakeholders contribute to the total value of the fishing industry, we feel that there are some who benefit more at the cost of others, resulting in a Pareto-inefficient distribution of benefits accruing to the different actors.
We felt that an understanding of the value chain would contribute to the development of livelihood interventions or their improvement to benefit the losing actors, and it would identify constraints and opportunities in the marketing system and elucidate its governance. Value chain analysis would also help identify the potential for adding value (e.g. by improving the product, producing it more efficiently or adding additional higher value services). Improved benefit may be
Figure 1: Dependency on Fishing in Mafia Island's Fishing Communities.
Winners and Losers in the Finfish Trade on Mafia Island: A Value Chain Analysis 153
further achieved for some actors in the chain by reducing its length.
There is growing concern regarding the continued deprivation of the fishing communities and the need to improve their livelihoods and livelihood diversification. The present study therefore focused particularly on the potential to improve their livelihoods, recognising the importance of finfish in this regard. We felt that, apart from financial losses fishers suffer due to a lack of bargaining power in the market chain, they also faced non-market costs and losses in terms of time use and greater occupational risks which exemplify their vulnerability.
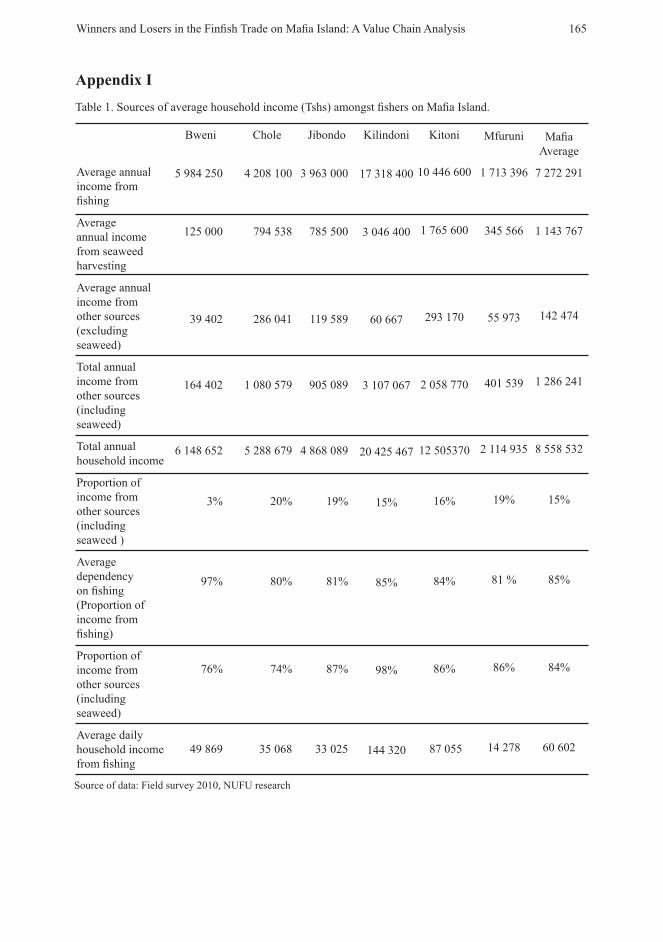
In our analysis, we used primary data collected in a 2011 survey in Kilindoni on Mafia Island, incorporating check lists on costs of investment, operational costs and revenue flow through middlemen, processors, local fish market traders and group fishers (with powered boats). Information from restaurants and hotels proved to be difficult to obtain, as well as from the main fish processing plant on Mafia Island (TANPESCA). These were, therefore, not surveyed. In addition to this, we supplemented the analysis with primary data on household income collected from 149 randomly selected households in 2010 from six villages on Mafia Island namely, Kilindoni, Kitoni, Bweni, Mfuruni, Chole and Jibondo (see Appendix Tables 1-6). The 2010 and 2011 field surveys were conducted during a University of Dar es Salaam fisheries research project in collaboration with the Norwegian University of Life Sciences (NMBU) and funded by the Norwegian Programme for Development, Research and Education (NUFU).
The next section presents an analytical discussion of the value chain for finfish in Mafia District, followed by a discussion on the fish trade. Market arrangements for fish and fish pricing on Mafia Island are explained in the succeeding section, followed by the methods used to determine the gross profit from these activities. We finally present empirical results where benefit distribution and value chain governance are discussed followed by conclusions.
The Value Chain Analytical Framework: An OverviewValue chains are defined as, “the full range of activities which are required to bring a product or service from conception, through the different phases of production (involving a combination of physical transformation and the input of various producer services), delivery to the final consumers and final disposal after use” (Kaplinsky & Morris, 2000). Value chains can be characterised as being either global or macro, meso or micro in scale (Gereffi & Kaplinsky, 2001). Global analysis considers the whole chain, while micro-level analysis focuses on the producers in the chain (Dijk & Trienekens, 2012). Dijk and Trienekens (2012) further define macro-level analyses as pertaining to the chain at the national level and meso-scale to the regional or city level. In our case, meso-scale is associated with local market activities involving primary production, marketing, processing and consumption in agriculture, fisheries and manufacturing processes in small-, medium- and large-scale enterprises.
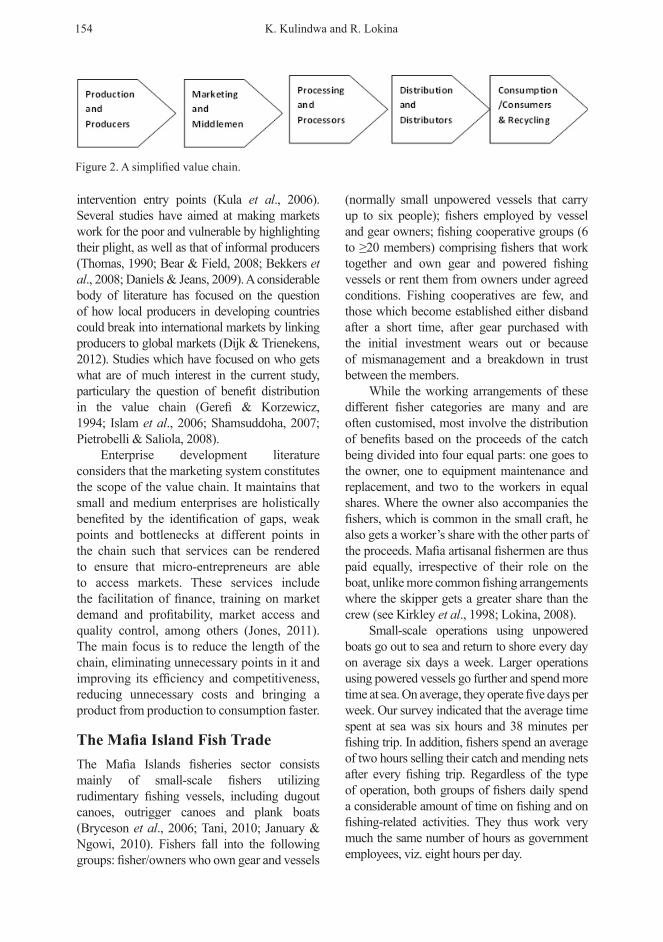
The value chain framework in Figure 2 represents a generic linear relationship between one activity and the rest in the chain. While it is possible that such a progression exists, it is seldom the case because of the existence of both vertical and horizontal or intra chain linkages in most value chains (Hempel, 2010; Dijk & Trienekens, 2012). For instance, in a fisheries value chain, a fisher may be the owner, buyer and processor of fish, leaving only the role of retailing to others. Likewise, in small-scale fisheries, an owner of gear and vessels may rent these to fishers and buy their catch (middleman), then sell it to a lucrative market outlet as we shall see is the case on Mafia.
There have been numerous studies on various aspects of value chains over the past two decades. Some studies have aimed at facilitating market development for small and medium enterprises (Streeten, 1991; Sen & Mahajan, 1993; Gamser, 1992), while others have investigated the enhancement of business efficiency and performance through the determination of factors that influence competitiveness and identify
intervention entry points (Kula et al., 2006). Several studies have aimed at making markets work for the poor and vulnerable by highlighting their plight, as well as that of informal producers (Thomas, 1990; Bear & Field, 2008; Bekkers et al., 2008; Daniels & Jeans, 2009). A considerable body of literature has focused on the question of how local producers in developing countries could break into international markets by linking producers to global markets (Dijk & Trienekens, 2012). Studies which have focused on who gets what are of much interest in the current study, particulary the question of benefit distribution in the value chain (Gerefi & Korzewicz, 1994; Islam et al., 2006; Shamsuddoha, 2007; Pietrobelli & Saliola, 2008).
Enterprise development literature considers that the marketing system constitutes the scope of the value chain. It maintains that small and medium enterprises are holistically benefited by the identification of gaps, weak points and bottlenecks at different points in the chain such that services can be rendered to ensure that micro-entrepreneurs are able to access markets. These services include the facilitation of finance, training on market demand and profitability, market access and quality control, among others (Jones, 2011). The main focus is to reduce the length of the chain, eliminating unnecessary points in it and improving its efficiency and competitiveness, reducing unnecessary costs and bringing a product from production to consumption faster.
The Mafia Island Fish TradeThe Mafia Islands fisheries sector consists mainly of small-scale fishers utilizing rudimentary fishing vessels, including dugout canoes, outrigger canoes and plank boats (Bryceson et al., 2006; Tani, 2010; January & Ngowi, 2010). Fishers fall into the following groups: fisher/owners who own gear and vessels
(normally small unpowered vessels that carry up to six people); fishers employed by vessel and gear owners; fishing cooperative groups (6 to ≥20 members) comprising fishers that work together and own gear and powered fishing vessels or rent them from owners under agreed conditions. Fishing cooperatives are few, and those which become established either disband after a short time, after gear purchased with the initial investment wears out or because of mismanagement and a breakdown in trust between the members.
While the working arrangements of these different fisher categories are many and are often customised, most involve the distribution of benefits based on the proceeds of the catch being divided into four equal parts: one goes to the owner, one to equipment maintenance and replacement, and two to the workers in equal shares. Where the owner also accompanies the fishers, which is common in the small craft, he also gets a worker’s share with the other parts of the proceeds. Mafia artisanal fishermen are thus paid equally, irrespective of their role on the boat, unlike more common fishing arrangements where the skipper gets a greater share than the crew (see Kirkley et al., 1998; Lokina, 2008).
Small-scale operations using unpowered boats go out to sea and return to shore every day on average six days a week. Larger operations using powered vessels go further and spend more time at sea. On average, they operate five days per week. Our survey indicated that the average time spent at sea was six hours and 38 minutes per fishing trip. In addition, fishers spend an average of two hours selling their catch and mending nets after every fishing trip. Regardless of the type of operation, both groups of fishers daily spend a considerable amount of time on fishing and on fishing-related activities. They thus work very much the same number of hours as government employees, viz. eight hours per day.
Figure 2. A simplified value chain.
154 K. Kulindwa and R. Lokina
Market Arrangements and Fish Price DeterminationFishers in Mafia District can sell their catch through various market arrangements, some predetermined by agreement, others dictated by prevalent liberalised market conditions. These arrangements include selling at beach landing auctions if there are multiple buyers or, more often, directly to middlemen, buying agents, fish vendors, gear and vessel ownersand fish processing plants among others. Middlemen wait on shore for the fishers to return to land, and buy and sell fish at the beach landing sites or take their stock to an established market in Kilindoni town. They have working capital which they use in their trade, taking advantage of the trust that fishers bestow on them to also function as money lenders when catches are bad. This occupies them on average for five hours a day. The mode of fish sales at the landing sites may be through pre-agreed arrangements or by bargaining. If a fishing group rents vessel and fishing gear, they most often find themselves selling to the owner of the vessel and gear. This arrangement has advantages and disadvantages, the former being that fishers are always guaranteed the sale of their fish. However, they may earn less this way as the price may be lower than the market.
This practice is similar to the buyer/lender arrangement where the lender buys all the fish at a lower price as per a loan repayment agreement. In terms of Institutional Economics, we can categorise fish sellers as agents and fish buyers (the lenders or vessel and gear owners) as principals in a repeated principal agent model1. If the principal can
1 Agent’s actions are observable to the principal but not verifiable in court. The agent’s incentives derive both from salary payments (or selling assurance) based on verifiable signals, and from implicit promises by the principal of bonuses for good behaviour (see for example, Klein et al., 1978; Wachter & Williamson, 1978; Peace & Stacchetti, 1998). Typically a principal can make commitments to an agent by offering him a legally enforceable contract which specifies payments contingent on information available to the courts.
obtain more than publicly verifiable information, implicit self-enforcing agreements (which supplement the terms of the explicit contract) between the principal and agent may be mutually beneficial. However, fishers on Mafia Island are often faced with ‘explicit written contracts’ as far as gear renting or credit to fishers are concerned. The pricing of fish is dominated by implicit agreements which are often tacit agreements, where the principal offers a lower price as his reward for guaranteeing a market to the fishers2.
All other market arrangements involve a variation in prices, depending on a number of open market factors including the number of buyers at a landing site, the number of sellers and the quantity of fish harvested. At the time of our survey, the Mafia fish processing plant, TANPESCA, offered the highest price in the market of Tshs 1200 per kilogram for emperors (changu), rabbit fish (tasi), Carangoides (kolekole), snappers, parrot fish (pono) and grouper (Chewa). Fishers gained Tshs 900 and Tshs 700 per kilogram respectively from auctions and middlemen.
Due to unreliability in the market situation, a lack of storage facilities, limited market options and other factors, fishers prefer to sell to established buyers even if they do not get their money immediately, thus informally insuring themselves and avoiding risk. Due to their lack of capital, fishers find themselves obligated to sell to their creditors and owners of fishing gear and vessels. In all these cases, a sense of insecurity appears to be an important factor which influences fishers in their decision making.
2 This minimizes the risk on the part of fishers of not selling in periods of unfavourable market conditions. Buyers may sometimes defer payment to a later date in times of shortage of funds..
Winners and Losers in the Finfish Trade on Mafia Island: A Value Chain Analysis 155
We found an interesting reason why many fishers prefer to borrow money/capital from individual money lenders such as shopkeepers, vessel and gear owners, and middlemen, as opposed to borrowing from well-established financial institutions and other credit options. Responses to the question as to why this was the case ranged from fear of losing one’s property if one defaulted on payments, to knowing and trusting the individual lenders who accommodated their human shortcomings. This difference between impersonal institutions and personal relationships has a profound impact on the decision-making process of fishers and will affect the architecture of programmes designed to help them. Although the preferred modes of borrowing may be considerd more exploitative, the alternative appears more threatening to their security, livelihood and property ownership.
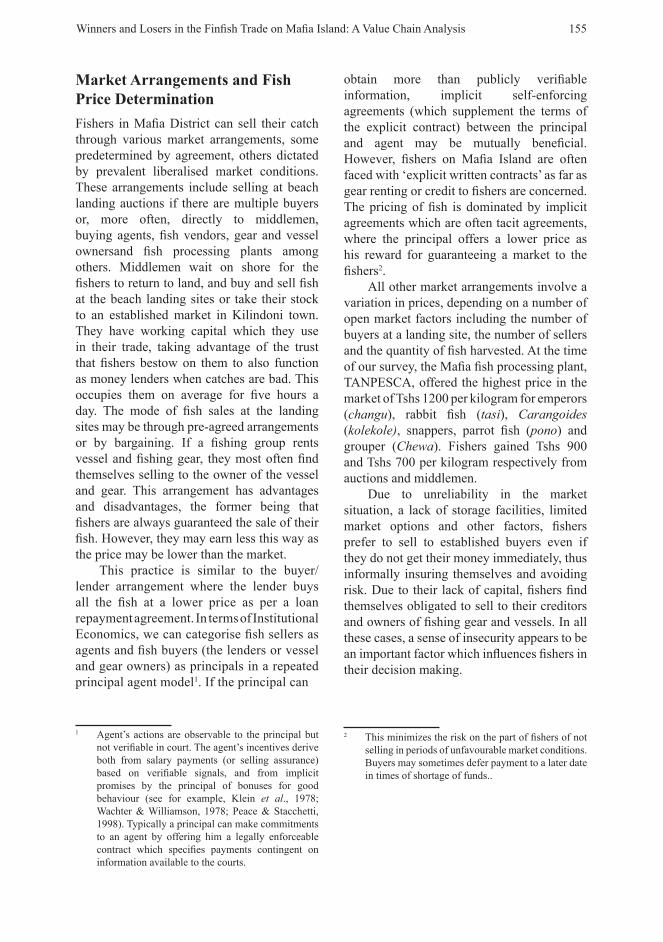
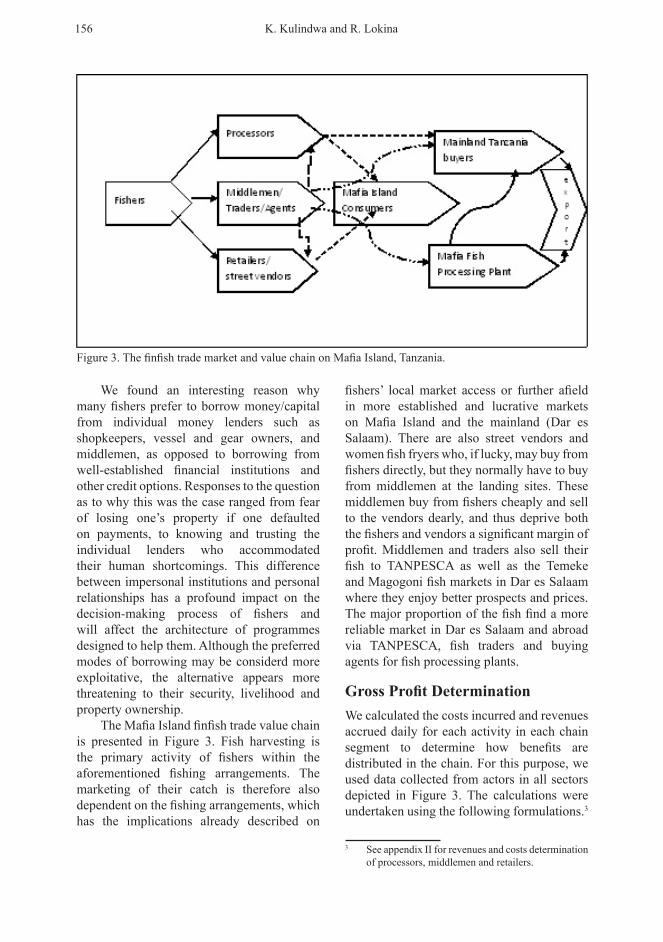
The Mafia Island finfish trade value chain is presented in Figure 3. Fish harvesting is the primary activity of fishers within the aforementioned fishing arrangements. The marketing of their catch is therefore also dependent on the fishing arrangements, which has the implications already described on
fishers’ local market access or further afield in more established and lucrative markets on Mafia Island and the mainland (Dar es Salaam). There are also street vendors and women fish fryers who, if lucky, may buy from fishers directly, but they normally have to buy from middlemen at the landing sites. These middlemen buy from fishers cheaply and sell to the vendors dearly, and thus deprive both the fishers and vendors a significant margin of profit. Middlemen and traders also sell their fish to TANPESCA as well as the Temeke and Magogoni fish markets in Dar es Salaam where they enjoy better prospects and prices. The major proportion of the fish find a more reliable market in Dar es Salaam and abroad via TANPESCA, fish traders and buying agents for fish processing plants.
Gross Profit DeterminationWe calculated the costs incurred and revenues accrued daily for each activity in each chain segment to determine how benefits are distributed in the chain. For this purpose, we used data collected from actors in all sectors depicted in Figure 3. The calculations were undertaken using the following formulations.3
3 See appendix II for revenues and costs determination of processors, middlemen and retailers.
Figure 3. The finfish trade market and value chain on Mafia Island, Tanzania.
156 K. Kulindwa and R. Lokina
Empirical ResultsData presented in appendix Tables 2 to 6 were used to arrive at the value quotients in Table 1. Some cost categories such as tax and levies were omitted from the fishers’ costs because tax data were lacking or incomplete; many fishers do not comply with taxes and fees imposed by the district council and village governments. However, the available costs should provide a reasonable estimate of gross profit by the different groups. All the revenues and costs were converted to daily values and the gross margin ratio4 was computed, providing a clear relationship between individual benefits from each dollar of revenue generated.
4 Gross profit divided by Total Average Revenue (TAR; where gross profit = TAR minus cost of goods sold, including raw materials and supplies used, Labour and Overhead of the business allocatable to production). This represents the percentage of total sales revenue the business retains after incurring the direct costs of producing the goods and services sold in a 1:1:2 sharing agreement.
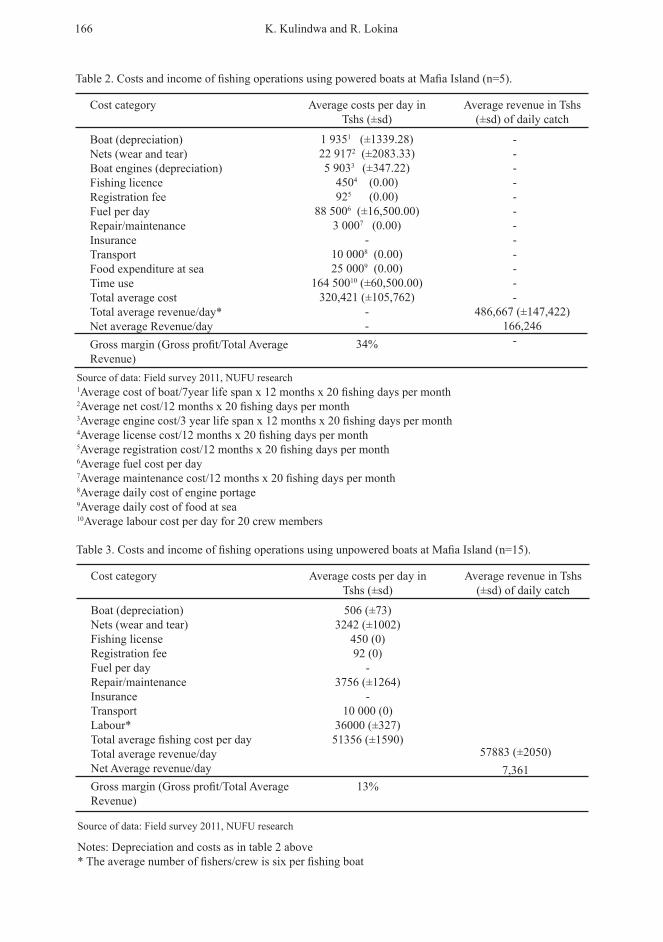
The finfish targeted for this study included (with Kiswahili names in brackets) emperors (changu), rabbit fish (tasi), Carangoides (kolekole), snappers, parrot fish (Pono), grouper (Chewa), sardines and mackerels, these being the fish mostly caught and traded by small scale-fishers on Mafia Island. The normal measures of bulk sale included trays which hold an average weight of 10 or 40 kg of fish depending on their size. An estimated lifetime of equipment was used to determine the daily wear and tear on capital investment, this being seven years in the case of artisanal fishing boats and three years in the case of outboard engines. The life span of equipment such as fishing nets, processing tables and utensils was estimated to be one year. An average labour cost was estimated according to the catch and income distribution arrangements described earlier. The cost of fuel was incorporated, where appropriate.
Winners and Losers in the Finfish Trade on Mafia Island: A Value Chain Analysis 157
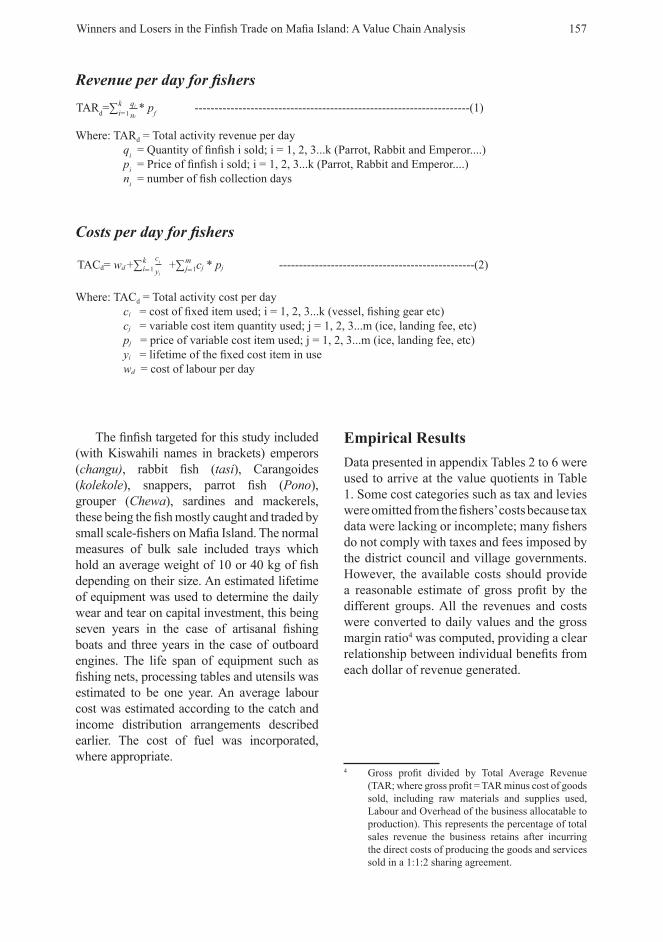
Revenue per day for fishers
TARd=∑ * pf ---------------------------------------------------------------------(1)ki=1
qi
ni
Where: TARd = Total activity revenue per day qi = Quantity of finfish i sold; i = 1, 2, 3...k (Parrot, Rabbit and Emperor....) pi = Price of finfish i sold; i = 1, 2, 3...k (Parrot, Rabbit and Emperor....) ni = number of fish collection days
Costs per day for fisherski=1
mj=1
ci yi
TACd= wd +∑ +∑ cj * pj -------------------------------------------------(2)
Where: TACd = Total activity cost per day ci = cost of fixed item used; i = 1, 2, 3...k (vessel, fishing gear etc) cj = variable cost item quantity used; j = 1, 2, 3...m (ice, landing fee, etc) pj = price of variable cost item used; j = 1, 2, 3...m (ice, landing fee, etc) yi = lifetime of the fixed cost item in use wd = cost of labour per day
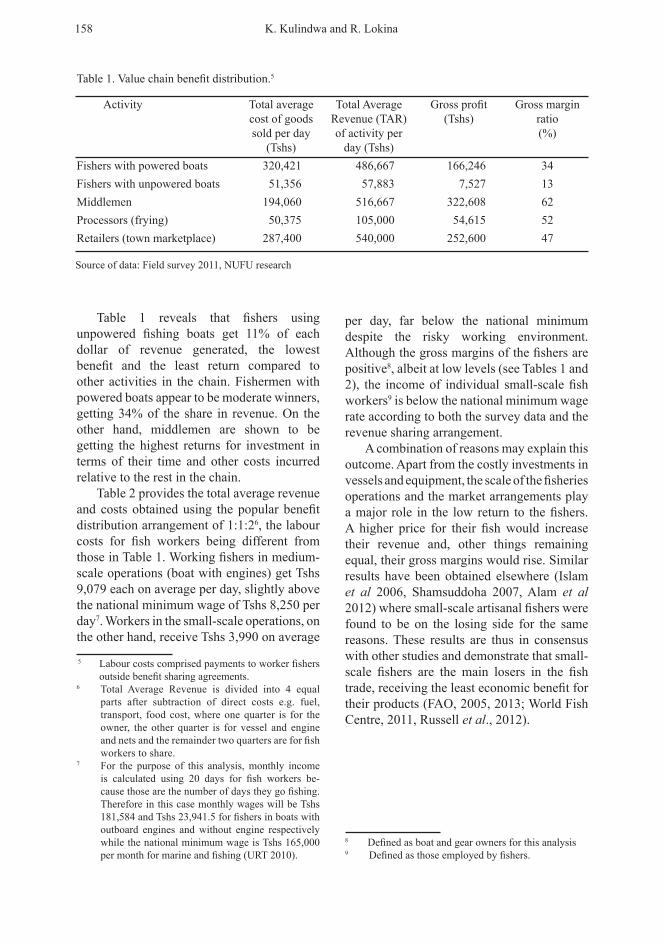
Table 1. Value chain benefit distribution.5
Table 1 reveals that fishers using unpowered fishing boats get 11% of each dollar of revenue generated, the lowest benefit and the least return compared to other activities in the chain. Fishermen with powered boats appear to be moderate winners, getting 34% of the share in revenue. On the other hand, middlemen are shown to be getting the highest returns for investment in terms of their time and other costs incurred relative to the rest in the chain.
Table 2 provides the total average revenue and costs obtained using the popular benefit distribution arrangement of 1:1:26, the labour costs for fish workers being different from those in Table 1. Working fishers in medium-scale operations (boat with engines) get Tshs 9,079 each on average per day, slightly above the national minimum wage of Tshs 8,250 per day7. Workers in the small-scale operations, on the other hand, receive Tshs 3,990 on average
5 Labour costs comprised payments to worker fishers outside benefit sharing agreements.
6 Total Average Revenue is divided into 4 equal parts after subtraction of direct costs e.g. fuel, transport, food cost, where one quarter is for the owner, the other quarter is for vessel and engine and nets and the remainder two quarters are for fish workers to share.
7 For the purpose of this analysis, monthly income is calculated using 20 days for fish workers be-cause those are the number of days they go fishing. Therefore in this case monthly wages will be Tshs 181,584 and Tshs 23,941.5 for fishers in boats with outboard engines and without engine respectively while the national minimum wage is Tshs 165,000 per month for marine and fishing (URT 2010).
per day, far below the national minimum despite the risky working environment. Although the gross margins of the fishers are positive8, albeit at low levels (see Tables 1 and 2), the income of individual small-scale fish workers9 is below the national minimum wage rate according to both the survey data and the revenue sharing arrangement.
A combination of reasons may explain this outcome. Apart from the costly investments in vessels and equipment, the scale of the fisheries operations and the market arrangements play a major role in the low return to the fishers. A higher price for their fish would increase their revenue and, other things remaining equal, their gross margins would rise. Similar results have been obtained elsewhere (Islam et al 2006, Shamsuddoha 2007, Alam et al 2012) where small-scale artisanal fishers were found to be on the losing side for the same reasons. These results are thus in consensus with other studies and demonstrate that small-scale fishers are the main losers in the fish trade, receiving the least economic benefit for their products (FAO, 2005, 2013; World Fish Centre, 2011, Russell et al., 2012).
8 Defined as boat and gear owners for this analysis9 Defined as those employed by fishers.
Activity
Fishers with powered boatsFishers with unpowered boatsMiddlemenProcessors (frying)Retailers (town marketplace)
Total average cost of goods sold per day
(Tshs)320,421 51,356
194,060 50,375
287,400
Total Average Revenue (TAR) of activity per
day (Tshs)486,667 57,883
516,667 105,000 540,000
Gross profit (Tshs)
166,246 7,527
322,608 54,615
252,600
Gross margin ratio(%)
3413625247
Source of data: Field survey 2011, NUFU research
158 K. Kulindwa and R. Lokina
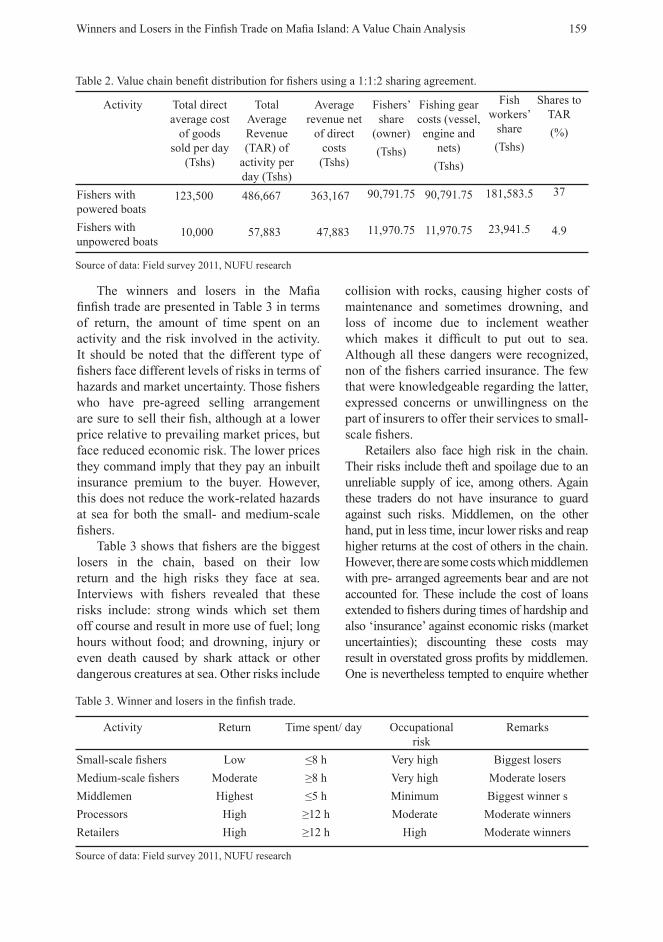
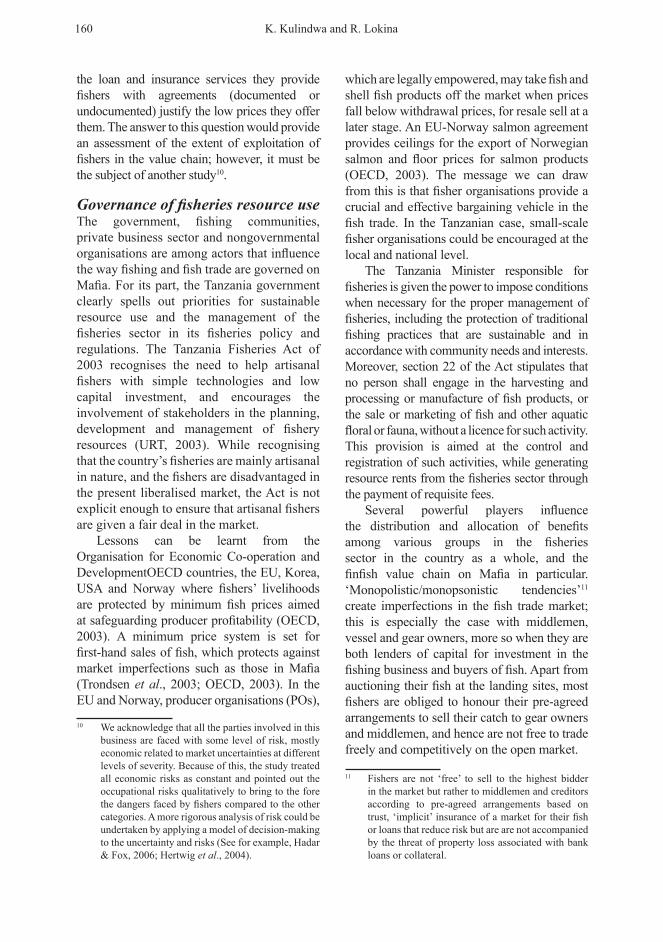
The winners and losers in the Mafia finfish trade are presented in Table 3 in terms of return, the amount of time spent on an activity and the risk involved in the activity. It should be noted that the different type of fishers face different levels of risks in terms of hazards and market uncertainty. Those fishers who have pre-agreed selling arrangement are sure to sell their fish, although at a lower price relative to prevailing market prices, but face reduced economic risk. The lower prices they command imply that they pay an inbuilt insurance premium to the buyer. However, this does not reduce the work-related hazards at sea for both the small- and medium-scale fishers.
Table 3 shows that fishers are the biggest losers in the chain, based on their low return and the high risks they face at sea. Interviews with fishers revealed that these risks include: strong winds which set them off course and result in more use of fuel; long hours without food; and drowning, injury or even death caused by shark attack or other dangerous creatures at sea. Other risks include
collision with rocks, causing higher costs of maintenance and sometimes drowning, and loss of income due to inclement weather which makes it difficult to put out to sea. Although all these dangers were recognized, non of the fishers carried insurance. The few that were knowledgeable regarding the latter, expressed concerns or unwillingness on the part of insurers to offer their services to small-scale fishers.
Retailers also face high risk in the chain. Their risks include theft and spoilage due to an unreliable supply of ice, among others. Again these traders do not have insurance to guard against such risks. Middlemen, on the other hand, put in less time, incur lower risks and reap higher returns at the cost of others in the chain. However, there are some costs which middlemen with pre- arranged agreements bear and are not accounted for. These include the cost of loans extended to fishers during times of hardship and also ‘insurance’ against economic risks (market uncertainties); discounting these costs may result in overstated gross profits by middlemen. One is nevertheless tempted to enquire whether
Activity
Fishers with powered boatsFishers with unpowered boats
Total direct average cost
of goods sold per day
(Tshs)
123,500
10,000
Total Average Revenue (TAR) of
activity per day (Tshs)486,667
57,883
Average revenue net
of direct costs(Tshs)
363,167
47,883
Fishers’ share
(owner)(Tshs)
90,791.75
11,970.75
Source of data: Field survey 2011, NUFU research
Table 2. Value chain benefit distribution for fishers using a 1:1:2 sharing agreement.
Fishing gear costs (vessel, engine and
nets)(Tshs)
90,791.75
11,970.75
Fish workers’
share(Tshs)
181,583.5
23,941.5
Shares to TAR(%)
37
4.9
Activity
Small-scale fishersMedium-scale fishersMiddlemenProcessorsRetailers
Return
LowModerateHighest
HighHigh
Time spent/ day
≤8 h≥8 h≤5 h ≥12 h ≥12 h
Occupational risk
Very highVery highMinimum Moderate
High
Remarks
Biggest losersModerate losersBiggest winner s
Moderate winners Moderate winners
Source of data: Field survey 2011, NUFU research
Table 3. Winner and losers in the finfish trade.
Winners and Losers in the Finfish Trade on Mafia Island: A Value Chain Analysis 159
the loan and insurance services they provide fishers with agreements (documented or undocumented) justify the low prices they offer them. The answer to this question would provide an assessment of the extent of exploitation of fishers in the value chain; however, it must be the subject of another study10.
Governance of fisheries resource use The government, fishing communities, private business sector and nongovernmental organisations are among actors that influence the way fishing and fish trade are governed on Mafia. For its part, the Tanzania government clearly spells out priorities for sustainable resource use and the management of the fisheries sector in its fisheries policy and regulations. The Tanzania Fisheries Act of 2003 recognises the need to help artisanal fishers with simple technologies and low capital investment, and encourages the involvement of stakeholders in the planning, development and management of fishery resources (URT, 2003). While recognising that the country’s fisheries are mainly artisanal in nature, and the fishers are disadvantaged in the present liberalised market, the Act is not explicit enough to ensure that artisanal fishers are given a fair deal in the market.
Lessons can be learnt from the Organisation for Economic Co-operation and DevelopmentOECD countries, the EU, Korea, USA and Norway where fishers’ livelihoods are protected by minimum fish prices aimed at safeguarding producer profitability (OECD, 2003). A minimum price system is set for first-hand sales of fish, which protects against market imperfections such as those in Mafia (Trondsen et al., 2003; OECD, 2003). In the EU and Norway, producer organisations (POs),
10 We acknowledge that all the parties involved in this business are faced with some level of risk, mostly economic related to market uncertainties at different levels of severity. Because of this, the study treated all economic risks as constant and pointed out the occupational risks qualitatively to bring to the fore the dangers faced by fishers compared to the other categories. A more rigorous analysis of risk could be undertaken by applying a model of decision-making to the uncertainty and risks (See for example, Hadar & Fox, 2006; Hertwig et al., 2004).
which are legally empowered, may take fish and shell fish products off the market when prices fall below withdrawal prices, for resale sell at a later stage. An EU-Norway salmon agreement provides ceilings for the export of Norwegian salmon and floor prices for salmon products (OECD, 2003). The message we can draw from this is that fisher organisations provide a crucial and effective bargaining vehicle in the fish trade. In the Tanzanian case, small-scale fisher organisations could be encouraged at the local and national level.
The Tanzania Minister responsible for fisheries is given the power to impose conditions when necessary for the proper management of fisheries, including the protection of traditional fishing practices that are sustainable and in accordance with community needs and interests. Moreover, section 22 of the Act stipulates that no person shall engage in the harvesting and processing or manufacture of fish products, or the sale or marketing of fish and other aquatic floral or fauna, without a licence for such activity. This provision is aimed at the control and registration of such activities, while generating resource rents from the fisheries sector through the payment of requisite fees.
Several powerful players influence the distribution and allocation of benefits among various groups in the fisheries sector in the country as a whole, and the finfish value chain on Mafia in particular. ‘Monopolistic/monopsonistic tendencies’11 create imperfections in the fish trade market; this is especially the case with middlemen, vessel and gear owners, more so when they are both lenders of capital for investment in the fishing business and buyers of fish. Apart from auctioning their fish at the landing sites, most fishers are obliged to honour their pre-agreed arrangements to sell their catch to gear owners and middlemen, and hence are not free to trade freely and competitively on the open market.
11 Fishers are not ‘free’ to sell to the highest bidder in the market but rather to middlemen and creditors according to pre-agreed arrangements based on trust, ‘implicit’ insurance of a market for their fish or loans that reduce risk but are are not accompanied by the threat of property loss associated with bank loans or collateral.
160 K. Kulindwa and R. Lokina
A paradigm shift in resource management from top-down to community participation has resulted in the Fisheries Division, formerly under the Ministry of Natural Resources and Tourism, to introduce the co-management system in fisheries in which power is devolved and the responsibility of fisheries management is shared with the resource users (January & Ngowi, 2010). Several such initiatives by the government and non state actors have improved the lot of artisanal fishers, including on Mafia. These efforts have included the provision of capital for modern fishing gear and vessels through the Marine Conservation and Environmental Management Project (MACEMP), the Mafia Island Marine Park (MIMP), World Wide Fund for Nature (WWF) under the Rufiji Mafia and Kilwa seascape project (RUMAKI)12, and encouragement and facilitation to form collaborative fishing groups to increase their bargaining power. These efforts are still ongoing but, unfortunately, with little success. Some of the main factors contributing to the slow progress include a lack of trust among fishers and their fear of losing assets or property used as collateral for loans; alternative ‘humane’ sources of credit from gear and vessel owners and lenders, as well as traders, are seen as a better option.
CONCLUSIONS
Several factors limit the small-scale fishers’ benefits from the fisheries value chain on Mafia Island. These will need redress through multiple approaches to improve the fishers’ livelihoods. A start could be made by addressing their capacity to operate efficiently by improving their equipment to harvest a better catch and their facilities to reduce the spoilage of their fish. The lack of storage facilities causes desperation amongst fishers and they sell their catch quickly and at lower prices for fear of it getting spoiled. 12 See Wild et al., 2008; FORCONSULT, 2010,
Niesten & Gjertsen, 2010.
An improvement in their capacity to get better deals would strengthen their bargaining power. Efforts initiated in this regard over two decades ago ought to be continued but improved, recognizing factors which have impeded their success. These include building of trust and the facilitation of trade unions. Similarly, while some progress has been made in providing credit for fishers, more is needed. Current initiatives to form savings and credit cooperative societies (SACCOS) ought to be strengthened through training in project planning and financial management. The formation of small-scale fishers’ associations at the local and national level coupled with improved credit would create leverage for fishers to seek and obtain fair deals, better working conditions and more beneficial contractual arrangements. Greater market information is needed. Risks at sea are a reality; insurance for fishers should be a government requirement, just as it is for motor vehicles and drivers.
Acknowledgements – We acknowledge funding for the research by The Norwegian Programme for Development, Research and Education (NUFU). We are grateful for the cooperation extended to us by all the respondents on Mafia Island. We also wish to thank the anonymous reviewers of this article for their constructive comments and useful suggestions which improved the article
References
Alam F, Palash S, Mian IA, Dey MM (2012) Marketing of major fish species in Bangladesh: A Value Chain Analysis. A report submitted to Food and Agriculture Organization for the project entitled A Value-chain Analysis of International Fish Trade and Food Security with an Impact Assessment of the Small-scale Sector. (Available at: http://www.fao.org/valuechaininsmallscalefisheries/participatingcountries/bangladeh/en/)
Winners and Losers in the Finfish Trade on Mafia Island: A Value Chain Analysis 161
Bear M, Field M (2008) Managing the process of change: Useful frameworks for implementers of making markets work for the poor programmes. In Jones, Linda ed. (2011) Value chains in development: Emerging theory and practice. Key writings in enterprise development. Practical Action Publishing, 226 pp. (Available at: http://practicalaction.org/publishing)
Bekkers H, Miehlbradt A, Roggekamp P (2008) How to assess if markets work better for the poor: experiences from the Katalyst project in Bangladesh. In Jones, Linda ed. (2011) Value chains in development: Emerging theory and practice. Key writings in enterprise development. Practical Action Publishing, 226 pp. (Available at: http://practicalaction.org/publishing)
Bryceson I, Jiddawi N, Kamukuru A, Kulindwa K, Mwaipopo R, Onyango P, Sebastian M (2006) Fisheries study in Tanzanian coastal waters: The effects of trial export of finfish from Mafia Island on ecological–social resilience and vulnerability. Report to Ministry of Natural Resources and Tourism and Norwegian Embassy, Tanzania. 82 pages.
Daniels A, Jeans A (2009) Integrating approaches to enabling the most vulnerable to participate in markets. In: Jones L (ed) Value chains in development: Emerging theory and practice. Key writings in enterprise development. Practical Action Publishing, 226 pp. (Available at: http://practicalaction.org/publishing)
Dijk MP, Trienekens J (eds) (2012) Global value chains: Linking local producers from developing countries to international markets. Amsterdam University Press, Amsterdam, Amsterdam, the Netherlands, 280 pp
FAO (2012) A value chain analysis of international fish trade and food security with an impact assessment of the small scale sector. A Synthesis of Backgroung Reports, NORAD-FAO project, 165 pp
FAO (2005) Responsible fish trade and food security. FAO Fisheries Technical Paper 456, FAO, Rome, Italy, 102 pp
FORCONSULT (2010 ) Strengthening community capacity for fisheries co-management in Rufiji, Mafia and Kilwa districts. A final evaluation report prepared for WWF-Tanzania Country Office, 132 pp
Gamser M (1992) Sub sector analysis - a macro-analytical tool for microenterprise support. In: Jones L (ed). Value chains in development: Emerging theory and practice. Key writings in enterprise development. Practical Action Publishing, 226 pp. (Available at: http://practicalaction.org/publishing)
Gereffi G, Kaplinsky R (eds) (2001) The value of value chains: Spreading the gains from globalisation. IDS Bulletin 32 (3), special issue, 136 pp
Gereffi G, Humphrey J, Kaplinsky R, Sturgeon T J (2001) Introduction: Globalisation, value chains and development. IDS Bulletin 32: 1-9
Gereffi G, Korzeniewicz M (1994) Commodity chains and global capitalism. Westport, CT: Praeger. An Imprint of Greenwood Publishing Group Inc., 331 pp
Hadar L, Fox CR (2009) Information asymmetry in decision from description versus decision from experience. Judgment and Decision Making 4: 317-325
Hempel E (2010) Value chain analysis in the fisheries sector in Africa. Study carried out by Mr Erik Hempel in collaboration with INFOSA and funded by the Trade Working Group of the Partnership for African Fisheries, an AU/NEPAD Programme. (Available at: http://www.fao.org/valuechaininsmallscalefisheries/projectreports/en/)
Hertwig R, Barron G, Weber EU, Erev I (2004) Decisions from experience and the effect of rare events in risky choice. Psychological Science 15: 534–539
162 K. Kulindwa and R. Lokina
Heyman WD, Granados-dieseldorff P (2012) The voice of the fishermen of the Gulf of Honduras: Improving regional fisheries management through fisher participation. Fisheries Research,125-126: 129-148
Islam S, Akteruzzaman M, Ahmed N (2006) Study on marketing and value chain of some commercially important coastal and marine aquatic products of Bangladesh. Bangladesh Fisheries Research Forum (BFRF). (Available at: http://www.bfrf.org/aquatic product-overview.pdf)
January M, Ngowi HP (2010) Untangling the nets: The governance of Tanzania’s marine fisheries. Research report 5, Governance of Africa's resources programme. The South African Institute of International Affairs (SAIIA), Johannesburg, South Africa, 59 pp
Jones L (ed) (2011) Value chains in development: Emerging theory and practice. Key writings in enterprise development. Practical Action Publishing, 226 pp. (Available at: http://practicalaction.org/publishing)
Kaplinsky R, Morris M (2000) A handbook for value chain research. International Development Research Centre (IDRC), University of Sussex, UK,113 pp
Kirkley JE, Squires D, Strand IE (1998) Characterizing managerial skill and technical efficiency in a fishery. Journal of Productivity Analysis, 9: 145-160
Klein B, Crawford RG, Alchian A (1978) Vertical integration, ap-propriable rents, and the Competitive Contracting Process. Journal of Law and Economics 21: 297-326
Kula O, Downing J, Field M (2006) Value chain programmes to integrate competitiveness, economic growth and poverty reduction. In: Jones L (ed) Value chains in development: Emerging theory and practice. Key writings in enterprise development. Practical Action Publishing, 226 pp. (Available at: http://practicalaction.org/publishing)
Levitsky J (1994) Business associations in countries in transition to market economies. In Jones L (ed) (2011) Value chains in development: Emerging theory and practice. Key writings in enterprise development. Practical Action Publishing, 226 pp. (Available at: http://practicalaction.org/publishing)
Lokina RB (2008) Technical efficiency and the role of skipper skill in artisanal Lake Victoria fisheries. Environment and Development Economics 14: 497–519
Niesten E, Gjertsen H (2010) Case studies of three economic incentive approaches in marine conservation. Science and Knowledge Division, Conservation International, Arlington, Virginia, USA, 83 pp
OECD (2003) Liberalizing fisheries markets: Scope and effects. Organisation for Economic Cooperation and Development, Paris, France, 381 pp
Pearce DG, Stacchetti E (1998) The interaction of implicit and explicit contracts in repeated agency. Games and Economic Behavior 23: 75-96
Pietrobelli C, Saliola F (2008) Power relationships along the value chain: multinational firms, global buyers and performance of local suppliers. Cambridge Journal of Economics 32: 947-962
Porter ME (1996) What is strategy? Harvard Business Review, November–December: 61-78. (Available at: http://maaw.info/ArticleSummaries/ArtSumPorter96.htm)
Russell D, Hanoomanjee S (2012) Manual on value chain analysis and promotion. regional training on value chain analysis. Project ref. N° SA-4.1-B20: Strengthening Fisheries Management in ACP Countries, ACP Fish II. A project implemented by Pescares Italia and Funded by the European Union, 39 pp
Winners and Losers in the Finfish Trade on Mafia Island: A Value Chain Analysis 163
Sapkota-Bastola P, Dey MM, Alam MF, Singh K (2012). Price transmission relationships along the seafood value chains in Bangladesh: An analysis of both aquaculture and capture fisheries species. A report submitted to the Food and Agriculture Organization for the project entitled A Value-chain Analysis of International Fish Trade and Food Security with an Impact Assessment of the Small-scale Sector. (Available at: http://www.fao.org/valuechaininsmallscalefisheries/participatingcountries/bangladeh/en)
Sen B, Mahajan K (1994) A subsectoral approach to small business and microenterprise development. In: Jones L (ed) Value chains in development: Emerging theory and practice. Key writings in enterprise development. Practical Action Publishing, 226 pp. (Available at: http://practicalaction.org/publishing)
Shamsuddoha MD (2007) Supply and value chain analysis in the marketing of marine dried fish in Bangladesh and non-tariff measures (NTMs) in international trading. Paper prepared for presentation at the 106th seminar of the European Association of Agricultural Economists, (EAAE) Pro-poor development in low income countries: Food, agriculture, trade, and environment, October 25-27, 2007, Montpellier, France, 11 pp
Streeten P (1991) The Judo trick or crowding in. In: Jones L (ed) Value chains in development: Emerging theory and practice. Key writings in enterprise development. Practical Action Publishing, 226 pp. (Available at: http://practicalaction.org/publishing)
Tani EK (2010) A study on sustainable exploitation of marine fish resources in Tanzania; Case study of Mafia. A dissertation submitted in partial fulfillment of the requirements for the Degree of Masters of Arts (Econ) of the University of Dar es Salaam, 98 pp
Thomas J (1990) The Triple Trust – a three-fold approach. In: Jones L (ed) Value chains in development: Emerging theory and practice. Key writings in enterprise development. Practical Action Publishing, 226 pp. (Available at: http://practicalaction.org/publishing)
URT (2003) National Fisheries Act, Ministry of Natural Resources and Tourism. Printed by Government Printer, Dar es Salaam, 42 pp
URT (2010) Government Notice number 172. Labour Institutions Act (CAP 300). The Regulation of wages and terms of employment order, 2010. Printed by Government Printer, Dar es Salaam
Wachter ML, Williamson OE (1978) Obligational markets and the mechanics of inflation. Bell Journal of Economics 9: 549-71
Wild R, Millinga A, Robinson J (2008) Summary report - Microfinance and environment in Tanzania and Kenya. Report by LTS International, Care and WWF, 40 pp
World Fish Centre (2011) Aquaculture, Fisheries, Poverty and Food Security. Working Paper 2011-65, 62 pp
164 K. Kulindwa and R. Lokina
Winners and Losers in the Finfish Trade on Mafia Island: A Value Chain Analysis 165
Appendix I
Average annual income from fishing
Average annual income from seaweed harvesting
Average annual income from other sources (excluding seaweed)
Total annual income from other sources (including seaweed)
Total annual household income
Proportion of income from other sources (including seaweed )
Average dependency on fishing (Proportion of income from fishing)
Proportion of income from other sources (including seaweed)
Average daily household income from fishing
Bweni
5 984 250
125 000
39 402
164 402
6 148 652
3%
97%
76%
49 869
Chole
4 208 100
794 538
286 041
1 080 579
5 288 679
20%
80%
74%
35 068
Jibondo
3 963 000
785 500
119 589
905 089
4 868 089
19%
81%
87%
33 025
Kilindoni
17 318 400
3 046 400
60 667
3 107 067
20 425 467
15%
85%
98%
144 320
Source of data: Field survey 2010, NUFU research
Table 1. Sources of average household income (Tshs) amongst fishers on Mafia Island.
Kitoni
10 446 600
1 765 600
293 170
2 058 770
12 505370
16%
84%
86%
87 055
Mfuruni
1 713 396
345 566
55 973
401 539
2 114 935
19%
81 %
86%
14 278
Mafia Average
7 272 291
1 143 767
142 474
1 286 241
8 558 532
15%
85%
84%
60 602
166 K. Kulindwa and R. Lokina
Average revenue in Tshs (±sd) of daily catch
------------
486,667 (±147,422)166,246
-
Cost category
Boat (depreciation)Nets (wear and tear)Boat engines (depreciation)Fishing licenceRegistration feeFuel per dayRepair/maintenanceInsuranceTransportFood expenditure at seaTime useTotal average costTotal average revenue/day*Net average Revenue/dayGross margin (Gross profit/Total Average Revenue)
Average costs per day in Tshs (±sd)
1 9351 (±1339.28)22 9172 (±2083.33)5 9033 (±347.22)
4504 (0.00)925 (0.00)
88 5006 (±16,500.00)3 0007 (0.00)
-10 0008 (0.00)25 0009 (0.00)
164 50010 (±60,500.00)320,421 (±105,762)
--
34%
Source of data: Field survey 2011, NUFU research
Table 2. Costs and income of fishing operations using powered boats at Mafia Island (n=5).
1Average cost of boat/7year life span x 12 months x 20 fishing days per month2Average net cost/12 months x 20 fishing days per month3Average engine cost/3 year life span x 12 months x 20 fishing days per month4Average license cost/12 months x 20 fishing days per month5Average registration cost/12 months x 20 fishing days per month6Average fuel cost per day7Average maintenance cost/12 months x 20 fishing days per month8Average daily cost of engine portage9Average daily cost of food at sea10Average labour cost per day for 20 crew members
Cost category
Boat (depreciation)Nets (wear and tear)Fishing licenseRegistration feeFuel per dayRepair/maintenanceInsuranceTransportLabour* Total average fishing cost per dayTotal average revenue/dayNet Average revenue/dayGross margin (Gross profit/Total Average Revenue)
Average costs per day in Tshs (±sd)
506 (±73)3242 (±1002)
450 (0)92 (0)
-3756 (±1264)
-10 000 (0)
36000 (±327)51356 (±1590)
13%
Source of data: Field survey 2011, NUFU research
Table 3. Costs and income of fishing operations using unpowered boats at Mafia Island (n=15).
Notes: Depreciation and costs as in table 2 above* The average number of fishers/crew is six per fishing boat
Average revenue in Tshs (±sd) of daily catch
57883 (±2050)7,361
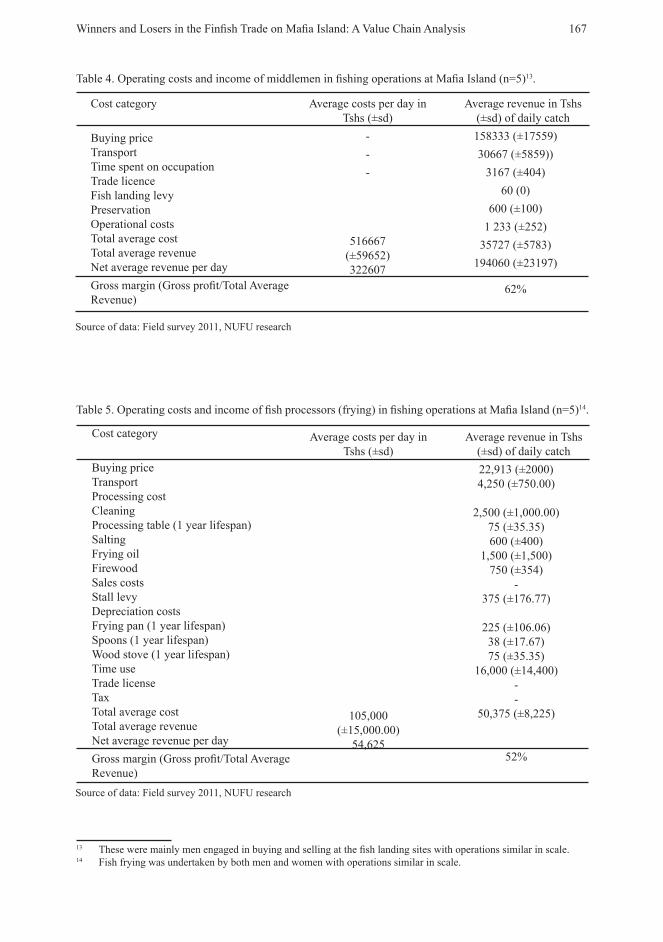
Table 4. Operating costs and income of middlemen in fishing operations at Mafia Island (n=5)13.
Table 5. Operating costs and income of fish processors (frying) in fishing operations at Mafia Island (n=5)14.
13 These were mainly men engaged in buying and selling at the fish landing sites with operations similar in scale.14 Fish frying was undertaken by both men and women with operations similar in scale.
Winners and Losers in the Finfish Trade on Mafia Island: A Value Chain Analysis 167
Average revenue in Tshs (±sd) of daily catch158333 (±17559)30667 (±5859))
3167 (±404)60 (0)
600 (±100)1 233 (±252)
35727 (±5783)194060 (±23197)
62%
Source of data: Field survey 2011, NUFU research
Cost category
Buying priceTransportTime spent on occupationTrade licenceFish landing levyPreservationOperational costsTotal average costTotal average revenueNet average revenue per dayGross margin (Gross profit/Total Average Revenue)
Average costs per day in Tshs (±sd)
---
516667 (±59652)322607
Average revenue in Tshs (±sd) of daily catch22,913 (±2000)4,250 (±750.00)
2,500 (±1,000.00)75 (±35.35)600 (±400)
1,500 (±1,500)750 (±354)
-375 (±176.77)
225 (±106.06)38 (±17.67)75 (±35.35)
16,000 (±14,400)--
50,375 (±8,225)
52%
Source of data: Field survey 2011, NUFU research
Cost category
Buying priceTransportProcessing costCleaningProcessing table (1 year lifespan)SaltingFrying oilFirewoodSales costsStall levyDepreciation costsFrying pan (1 year lifespan)Spoons (1 year lifespan)Wood stove (1 year lifespan)Time useTrade licenseTaxTotal average costTotal average revenueNet average revenue per dayGross margin (Gross profit/Total Average Revenue)
Average costs per day in Tshs (±sd)
105,000 (±15,000.00)
54,625
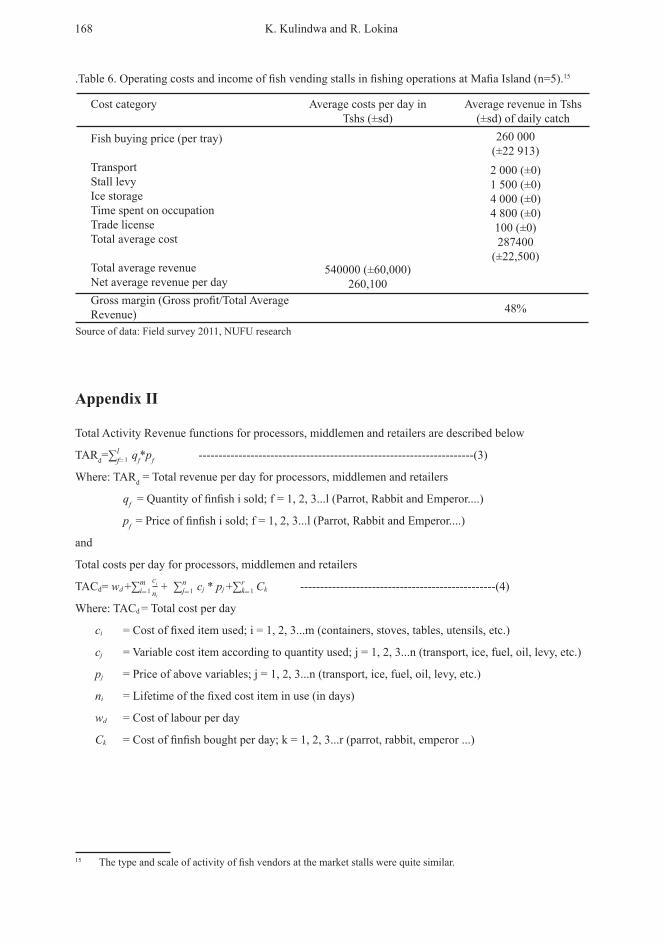
.Table 6. Operating costs and income of fish vending stalls in fishing operations at Mafia Island (n=5).15
Appendix II
Total Activity Revenue functions for processors, middlemen and retailers are described below
TARd=∑ qf*pf ---------------------------------------------------------------------(3)
Where: TARd = Total revenue per day for processors, middlemen and retailers
qf = Quantity of finfish i sold; f = 1, 2, 3...l (Parrot, Rabbit and Emperor....)
pf = Price of finfish i sold; f = 1, 2, 3...l (Parrot, Rabbit and Emperor....)
and
Total costs per day for processors, middlemen and retailers
TACd= wd +∑ + ∑ cj * pj +∑ Ck -------------------------------------------------(4)
Where: TACd = Total cost per day
ci = Cost of fixed item used; i = 1, 2, 3...m (containers, stoves, tables, utensils, etc.)
cj = Variable cost item according to quantity used; j = 1, 2, 3...n (transport, ice, fuel, oil, levy, etc.)
pj = Price of above variables; j = 1, 2, 3...n (transport, ice, fuel, oil, levy, etc.)
ni = Lifetime of the fixed cost item in use (in days)
wd = Cost of labour per day
Ck = Cost of finfish bought per day; k = 1, 2, 3...r (parrot, rabbit, emperor ...)
15 The type and scale of activity of fish vendors at the market stalls were quite similar.
168 K. Kulindwa and R. Lokina
Average revenue in Tshs (±sd) of daily catch
260 000 (±22 913)2 000 (±0)1 500 (±0)4 000 (±0)4 800 (±0)100 (±0)287400
(±22,500)
48%
Source of data: Field survey 2011, NUFU research
Cost category
Fish buying price (per tray)
TransportStall levyIce storageTime spent on occupationTrade licenseTotal average cost
Total average revenueNet average revenue per dayGross margin (Gross profit/Total Average Revenue)
Average costs per day in Tshs (±sd)
540000 (±60,000)260,100
lf=1
mi=1
nj=1
rk=1
ci ni