Embed Size (px)
Citation preview

WINNING OVER SHOPPERS IN CHINA’S “NEW NORMAL” China Shopper Report 2015, Vol. 2

Copyright © 2015 Bain & Company, Inc. and Kantar WorldpanelAll rights reserved
Winning over shoppers in China’s “new normal” | Bain & Company, Inc. | Kantar Worldpanel
Page i
Contents
1. Executivesummary . . . . . . . . . . . . . . . . . . . . . . . . . . . . . . . . . . . . . . . . pg . 3
2. Fullreport . . . . . . . . . . . . . . . . . . . . . . . . . . . . . . . . . . . . . . . . . . . . . . pg . 4
a . China offline: FMCG retailers in turbulence . . . . . . . . . . . . . . . . . . . . . pg . 4
b . China online: FMCG trends and behaviors . . . . . . . . . . . . . . . . . . . . . .pg . 13
3. Implicationsforretailers . . . . . . . . . . . . . . . . . . . . . . . . . . . . . . . . . . . . pg . 21
4. Abouttheauthorsandacknowledgments . . . . . . . . . . . . . . . . . . . . . . . . pg . 22
Winning over shoppers in China’s “new normal” | Bain & Company, Inc . | Kantar Worldpanel
Page ii
Winning over shoppers in China’s “new normal” | Bain & Company, Inc. | Kantar Worldpanel
Page 3
Executive summary
How should consumer goods companies respond when the world’s hottest market cools to a slow simmer? Is it time to abandon the illusion that China and its massive shopper population hold the keys to the future for com-panies selling fast-moving consumer goods (FMCG)? Should retailers scratch aggressive expansion plans for China and look elsewhere? Stick to their playbook and wait for the market to reheat? Or, is it time simply to acknowledge that growth in the world’s second-largest market for consumer goods has slowed to a pace that is more realistic—and far more sustainable—than in previous years?
This, our 10th consecutive study of the shopping behaviors of 40,000 Chinese households over the past four years, conducted in partnership with Kantar Worldpanel, provides unique insights into a rapidly evolving market. The study covers 106 FMCG categories across offline and online channels. In Volume 1, “Winning over shoppers in China’s ‘new normal,’” we chronicled the significant shifts in shoppers’ behavior and offered advice for brands hoping to advance in a market characterized by decelerated growth, widely varying pricing opportunities among product categories and other significant trends. In Volume 2 we turn our attention to the changing retail environment, analyzing the vast accumulation of shopper data to better understand how retailers can choose winning strategies for both offline and online channels.
It’s no secret that today’s China is different. The FMCG retail market grew 5.4% in 2014 compared with 11.8% three years prior. During this deceleration, some stores experienced negative same-store sales growth. Retailers became more cautious about expansion and, in certain situations, did something virtually unimaginable five years earlier: They closed stores. Leading retailers took a regional (city/province-based) approach to the expansion of physical stores, a strategy that helped them gain more market share than their competitors.
While the brick-and-mortar world of FMCG exhibited lackluster performance, the opposite was true for China’s dynamic e-commerce landscape. Online sales rose 34% in 2014 as e-commerce retailers expanded penetration and as online shoppers dramatically increased their purchasing frequency. Online pure-play retailers such as Taobao and Tmall continued to dominate in 2014, while omnichannel players were just emerging.
Online, Chinese shoppers exhibit the same lack of loyalty as they do in physical stores. However, certain distinctions between online and offline shopping behaviors are coming into focus as e-commerce expands. For example, the 10 top categories of FMCG differ across online and offline channels, and the concentration of the top 10 categories is much higher online (accounting for nearly 80% of online purchases compared with about 40% offline). Shoppers tend to go online to purchase premium products, a trend that results in a higher average selling price (ASP) for products bought online. It is therefore not surprising that imported goods enjoy higher value share in online channels (about 40% online compared with 10% offline), thanks to increased access to global e-commerce. Motivated by free or low-cost delivery, online shoppers opt for bigger orders and larger quantities. And online shoppers are particularly eager to take advantage of special promotions. In fact, approximately 40% of online purchases are made during popular promotions like Double 11 and Double 12 sales events, both of which delivered huge spikes in digital sales in 2014.
In the years ahead, FMCG retailers in both offline and online channels will need to adapt to slowing growth. Offline, winners will take a focused approach to store expansion, aiming to increase penetration on a region-by-region basis and making a push for smaller-format stores. Online, they’ll strive to make the most of shoppers’ category preferences, desire for premium brands, willingness to buy in larger quantities and fondness for promotions. The most successful retailers in both channels will intensify their efforts to develop and implement online-to-offline (O2O) strategies.
Winning over shoppers in China’s “new normal” | Bain & Company, Inc. | Kantar Worldpanel
Page 4
Full report
Chinaoffline:FMCGretailersinturbulence
China’s fast-moving consumer goods (FMCG) retail market is advancing in different directions. Physical store
retailers grapple with lower productivity in some formats and are reevaluating expansion plans. In contrast,
opportunities abound for e-commerce retailers.
Our tenth consecutive study of the shopping behavior of 40,000 Chinese shoppers helped us gain insights into
these and other important trends that retailers face in China. As in previous years, we equipped research participants
with barcode scanners to track what they purchased, rather than relying on what they said they’d purchased. This
unique approach gives us a clear picture of the purchase activity of shoppers across 106 categories of FMCG.
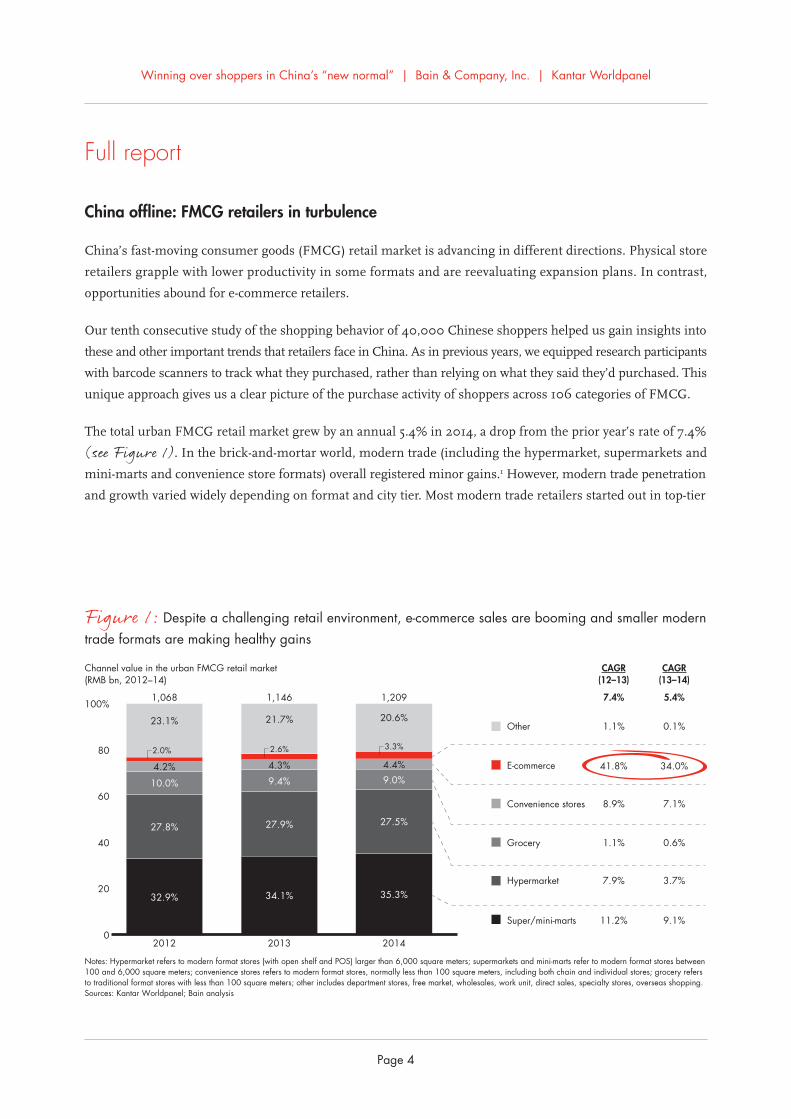
The total urban FMCG retail market grew by an annual 5.4% in 2014, a drop from the prior year’s rate of 7.4%
(see Figure 1). In the brick-and-mortar world, modern trade (including the hypermarket, supermarkets and
mini-marts and convenience store formats) overall registered minor gains.1 However, modern trade penetration
and growth varied widely depending on format and city tier. Most modern trade retailers started out in top-tier
Channel value in the urban FMCG retail market(RMB bn, 2012–14)
Notes: Hypermarket refers to modern format stores (with open shelf and POS) larger than 6,000 square meters; supermarkets and mini-marts refer to modern format stores between100 and 6,000 square meters; convenience stores refers to modern format stores, normally less than 100 square meters, including both chain and individual stores; grocery refersto traditional format stores with less than 100 square meters; other includes department stores, free market, wholesales, work unit, direct sales, specialty stores, overseas shopping.Sources: Kantar Worldpanel; Bain analysis
0
20
40
60
80
100%
2012
32.9%
27.8%
10.0%
4.2%
1,068
2013
34.1%
27.9%
9.4%
4.3%
1,146
2014
35.3%
27.5%
9.0%
4.4%
1,209
2.0%
23.1%
2.6%
21.7%
CAGR(12–13)
7.4%
CAGR(13–14)
5.4%
11.2% 9.1%Super/mini-marts
7.9% 3.7%Hypermarket
1.1% 0.6%Grocery
8.9% 7.1%Convenience stores
41.8% 34.0%E-commerce
1.1% 0.1%Other
3.3%
20.6%
Figure 1: Despite a challenging retail environment, e-commerce sales are booming and smaller modern trade formats are making healthy gains
Winning over shoppers in China’s “new normal” | Bain & Company, Inc. | Kantar Worldpanel
Page 5
cities and with larger formats (hypermarkets and large supermarkets). As large stores approached the saturation
point in terms of penetration, retailers started to develop smaller formats, such as mini-stores. These super- and
mini-mart formats performed well in 2014, growing at a healthy 9.1%, the best rate among all modern trade
formats. Meanwhile, traditional grocery stores grew by only 0.6% throughout the country.
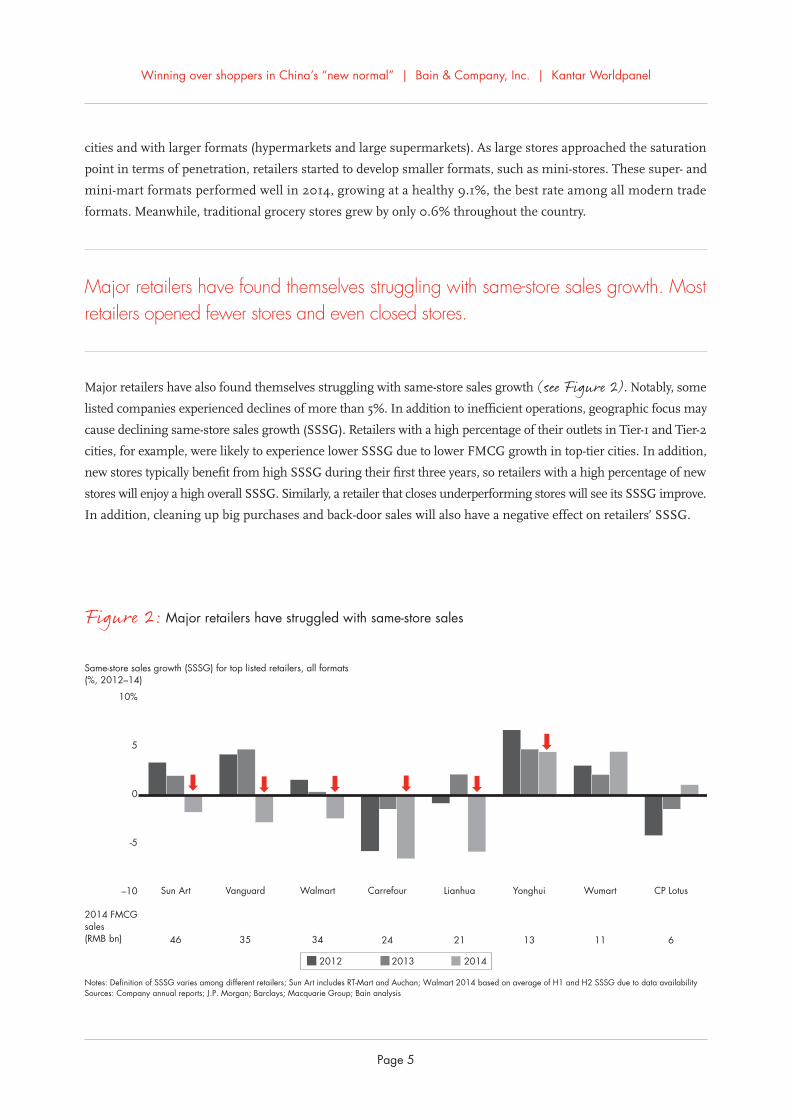
Major retailers have found themselves struggling with same-store sales growth. Most retailers opened fewer stores and even closed stores.
Major retailers have also found themselves struggling with same-store sales growth (see Figure 2). Notably, some
listed companies experienced declines of more than 5%. In addition to inefficient operations, geographic focus may
cause declining same-store sales growth (SSSG). Retailers with a high percentage of their outlets in Tier-1 and Tier-2
cities, for example, were likely to experience lower SSSG due to lower FMCG growth in top-tier cities. In addition,
new stores typically benefit from high SSSG during their first three years, so retailers with a high percentage of new
stores will enjoy a high overall SSSG. Similarly, a retailer that closes underperforming stores will see its SSSG improve.
In addition, cleaning up big purchases and back-door sales will also have a negative effect on retailers’ SSSG.
Same-store sales growth (SSSG) for top listed retailers, all formats(%, 2012–14)
Notes: Definition of SSSG varies among different retailers; Sun Art includes RT-Mart and Auchan; Walmart 2014 based on average of H1 and H2 SSSG due to data availabilitySources: Company annual reports; J.P. Morgan; Barclays; Macquarie Group; Bain analysis
Sun Art
46
Vanguard
35
Walmart
34
Carrefour
24
Lianhua
21
Yonghui
13
Wumart
11
CP Lotus
6
201420132012
2014 FMCGsales (RMB bn)
0
5
10%
-5
–10
Figure 2: Major retailers have struggled with same-store sales
Winning over shoppers in China’s “new normal” | Bain & Company, Inc. | Kantar Worldpanel
Page 6
Year-over-year growth in the number of stores of top listed retailers, all formats (%, 2013−14)
Notes: Sun Art includes RT-Mart and Auchan; Vanguard 2014 store number increase is due to acquisition of Tesco; Wumart includes both self-owned and partnership storesSources: PlanetRetail; company annual reports; Bain analysis
Sun Art
372
Vanguard
4,851
Walmart
415
Carrefour
237
Lianhua
4,291
Yonghui
330
Wumart
565
CP Lotus
55
2014 storenumbers
–10
0
10
20
30%
20142013
Overall growth2013: ~2%2014: ~1%
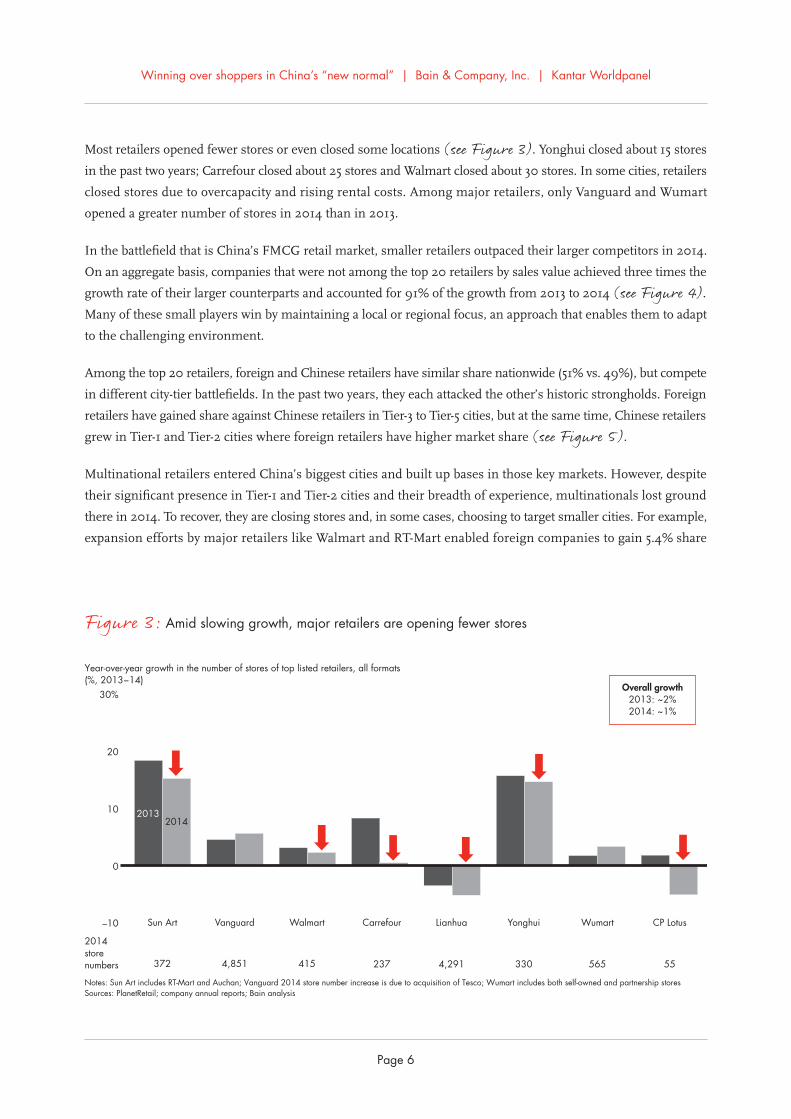
Figure 3: Amid slowing growth, major retailers are opening fewer stores
Most retailers opened fewer stores or even closed some locations (see Figure 3). Yonghui closed about 15 stores
in the past two years; Carrefour closed about 25 stores and Walmart closed about 30 stores. In some cities, retailers
closed stores due to overcapacity and rising rental costs. Among major retailers, only Vanguard and Wumart
opened a greater number of stores in 2014 than in 2013.
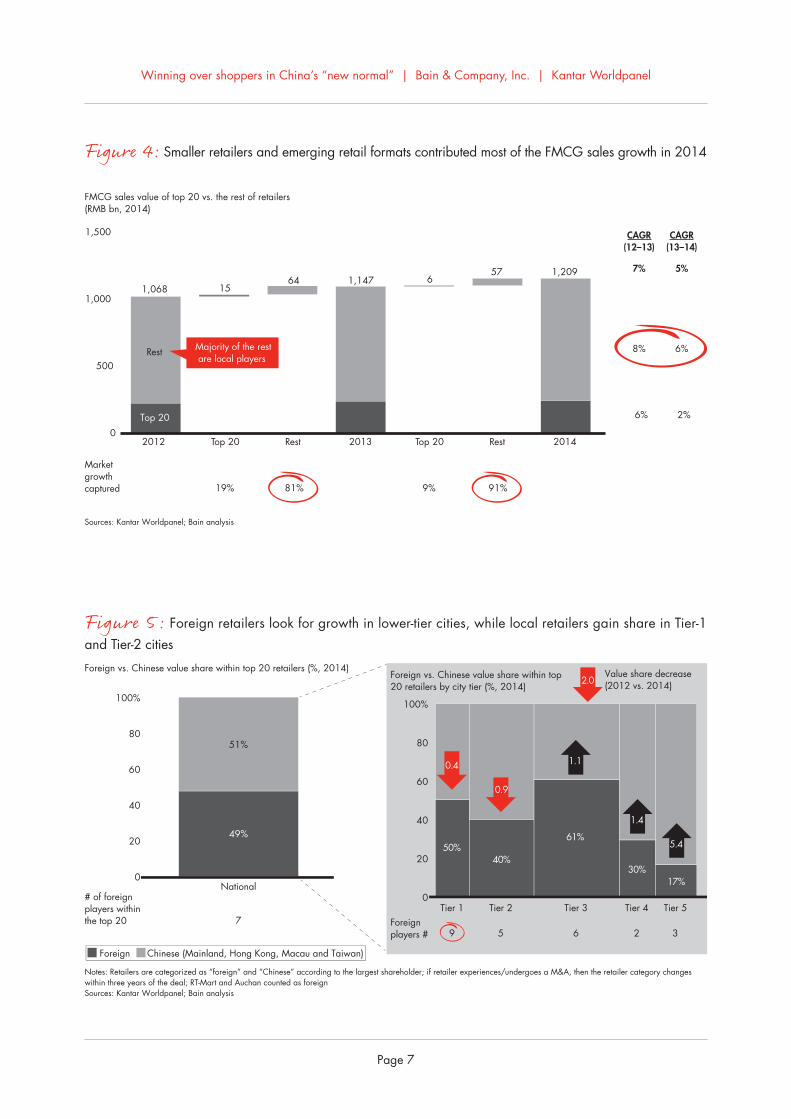
In the battlefield that is China’s FMCG retail market, smaller retailers outpaced their larger competitors in 2014.
On an aggregate basis, companies that were not among the top 20 retailers by sales value achieved three times the
growth rate of their larger counterparts and accounted for 91% of the growth from 2013 to 2014 (see Figure 4).
Many of these small players win by maintaining a local or regional focus, an approach that enables them to adapt
to the challenging environment.
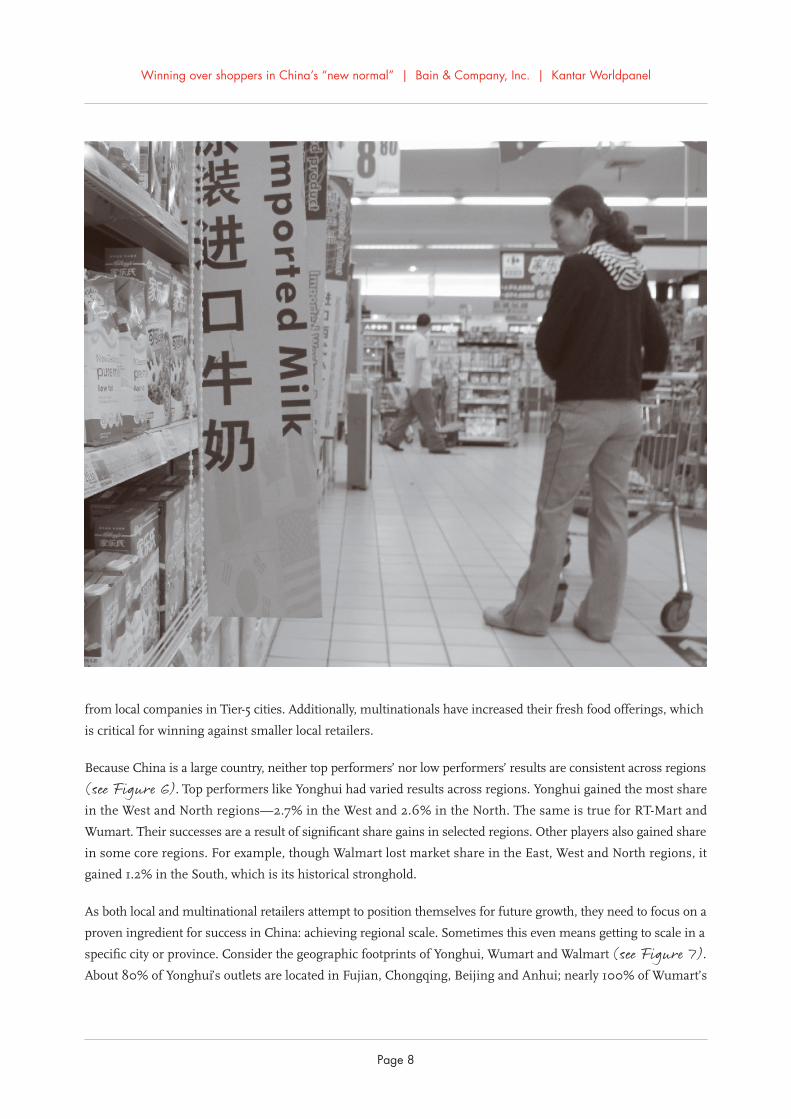
Among the top 20 retailers, foreign and Chinese retailers have similar share nationwide (51% vs. 49%), but compete
in different city-tier battlefields. In the past two years, they each attacked the other’s historic strongholds. Foreign
retailers have gained share against Chinese retailers in Tier-3 to Tier-5 cities, but at the same time, Chinese retailers
grew in Tier-1 and Tier-2 cities where foreign retailers have higher market share (see Figure 5).
Multinational retailers entered China’s biggest cities and built up bases in those key markets. However, despite
their significant presence in Tier-1 and Tier-2 cities and their breadth of experience, multinationals lost ground
there in 2014. To recover, they are closing stores and, in some cases, choosing to target smaller cities. For example,
expansion efforts by major retailers like Walmart and RT-Mart enabled foreign companies to gain 5.4% share
Winning over shoppers in China’s “new normal” | Bain & Company, Inc. | Kantar Worldpanel
Page 7
FMCG sales value of top 20 vs. the rest of retailers(RMB bn, 2014)
Sources: Kantar Worldpanel; Bain analysis
0
500
1,000
1,500
2012
Rest
Top 20
1,068
Top 20
15
Rest
64
2013
1,147
Top 20
6
Rest
57
2014
1,209
91%
Market growthcaptured 19% 81% 9%
6%
8%
7%
2%
6%
5%
CAGR(12–13)
CAGR(13–14)
Majority of the rest are local players
Figure 4: Smaller retailers and emerging retail formats contributed most of the FMCG sales growth in 2014
Foreign vs. Chinese value share within top 20 retailers (%, 2014)Foreign vs. Chinese value share within top 20 retailers by city tier (%, 2014)
Notes: Retailers are categorized as “foreign” and “Chinese” according to the largest shareholder; if retailer experiences/undergoes a M&A, then the retailer category changes within three years of the deal; RT-Mart and Auchan counted as foreignSources: Kantar Worldpanel; Bain analysis
Foreign Chinese (Mainland, Hong Kong, Macau and Taiwan)
National
51%
7
0
20
40
60
80
100%
# of foreign players withinthe top 20
Tier 1 Tier 2 Tier 3 Tier 4 Tier 5
9 5 6 2 3
0
20
40
60
80
100%
Foreignplayers #
2.0Value share decrease(2012 vs. 2014)
49%
0.4
0.9
1.4
5.4
1.1
50%40%
30%17%
61%
Figure 5: Foreign retailers look for growth in lower-tier cities, while local retailers gain share in Tier-1 and Tier-2 cities
Winning over shoppers in China’s “new normal” | Bain & Company, Inc. | Kantar Worldpanel
Page 8
from local companies in Tier-5 cities. Additionally, multinationals have increased their fresh food offerings, which
is critical for winning against smaller local retailers.
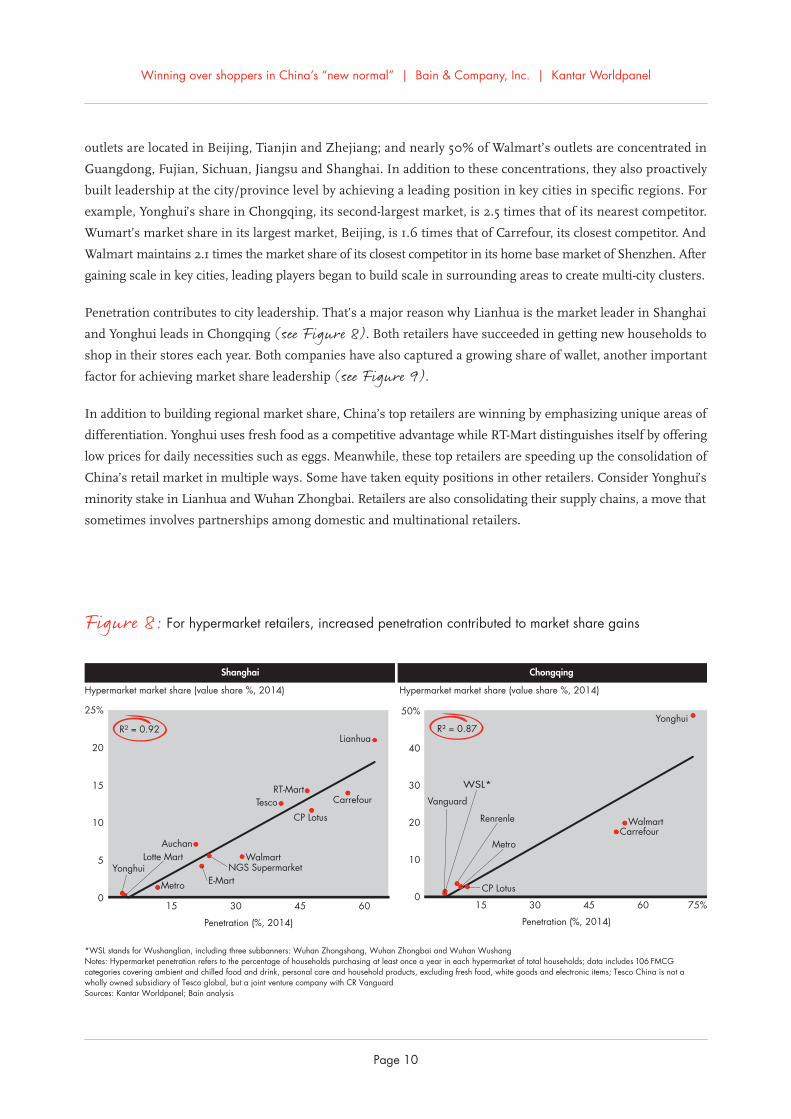
Because China is a large country, neither top performers’ nor low performers’ results are consistent across regions
(see Figure 6). Top performers like Yonghui had varied results across regions. Yonghui gained the most share
in the West and North regions—2.7% in the West and 2.6% in the North. The same is true for RT-Mart and
Wumart. Their successes are a result of significant share gains in selected regions. Other players also gained share
in some core regions. For example, though Walmart lost market share in the East, West and North regions, it
gained 1.2% in the South, which is its historical stronghold.
As both local and multinational retailers attempt to position themselves for future growth, they need to focus on a
proven ingredient for success in China: achieving regional scale. Sometimes this even means getting to scale in a
specific city or province. Consider the geographic footprints of Yonghui, Wumart and Walmart (see Figure 7).
About 80% of Yonghui’s outlets are located in Fujian, Chongqing, Beijing and Anhui; nearly 100% of Wumart’s
Winning over shoppers in China’s “new normal” | Bain & Company, Inc. | Kantar Worldpanel
Page 9
*Wumart and Tesco are not among top 20 retailers in South and WestNotes: East includes Shanghai, Jiangsu, Zhejiang, Anhui, Henan; West includes Chongqing, Shaanxi, Sichuan, Guangxi, Yunnan; South includes Guangdong, Fujian, Hubei, Jiangxi; North includesHeilongjiang, Jilin, Liaoning, Beijing, Tianjin, Hebei, Shandong and Shanxi; Tesco China is not a wholly owned subsidiary of Tesco global, but a joint venture company with CR VanguardSources: Kantar Worldpanel; Bain analysis
Top
perf
orm
ers
Low
per
form
ers
Tesco* Walmart Carrefour
–2
–1
0%
East
–0.6%
North–1.8%
East
–1.0%
West–2.9%
South
1.2%
North East West South North
–0.6%
2
1
0
1%
0.1%0.5%
–1.3%–0.9%
0
1
2
3%
0
1
2
3%
Change in value share of regional top 20 retailers (2012−14, all store formats)
East
2.7%
West
1.6%
South
2.6%
North
1.4%
Change in value share of regional top 20 retailers (2012–14, all store formats)
East
0.7%
West
2.7%
South
0.4%
North
2.6%
0
1%
Change in value share of regional top 20retailers (2012–14, all store formats)
Change in value share of regional top 20 retailers (2012−14, all store formats)
Change in value share of regional top 20 retailers (2012–14, all store formats)
Change in value share of regional top 20retailers (2012–14, all store formats)
East
0.3%
North
0.9%
RT-Mart Yonghui Wumart*
01
2%
–4–3–2–1
Figure 6: Leading retailers have had varied performance in FMCG categories across regions
*Wumart data includes both Wumart and Merrymart; data is from official websites Sources: Kantar Worldpanel; Planet Retail; company annual reports and websites; Bain analysis
Yonghui in CQ Wumart* in BJ Walmart in SZ
0
20
40
60
80
100%
Retail outletconcentration byprovince (2014)Top 5 province
percentage of total~80%
AnhuiBeijing
Fujian
Chongqing
Others
Chongqinghypermarket share
(2014)City RMS
2.5
Other
Yonghui
Walmart
Carrefour
RenrenleMetroCP Lotus
0
20
40
60
80
100%
Retail outletconcentration byprovince (2014)Top 5 province
percentage of total~100%
Zhejiang
Beijing
Tianjin
Other
Beijinghypermarket share
(2014)City RMS
1.6
Other
Wumart
Carrefour
WalmartAuchanYonghui
Lotte MartJinkelongCP Lotus
0
20
40
60
80
100%
Retail outletconcentration byprovince (2014)Top 5 province
percentage of total~50%
ShanghaiJiangsu
Guangdong
SichuanFujian
Other
Shenzhenhypermarket share
(2014)City RMS
2.1
Other
Walmart
Vanguard
Carrefour
A Best
RenrenleMetro
Most of the players proactively build scale provincially with multi-city cluster leadership
Figure 7: Leading retailers focus on getting to scale within one city or province—a key success factor in retail
Winning over shoppers in China’s “new normal” | Bain & Company, Inc. | Kantar Worldpanel
Page 10
Hypermarket market share (value share %, 2014) Hypermarket market share (value share %, 2014)
*WSL stands for Wushanglian, including three subbanners: Wuhan Zhongshang, Wuhan Zhongbai and Wuhan WushangNotes: Hypermarket penetration refers to the percentage of households purchasing at least once a year in each hypermarket of total households; data includes 106 FMCG categories covering ambient and chilled food and drink, personal care and household products, excluding fresh food, white goods and electronic items; Tesco China is not a wholly owned subsidiary of Tesco global, but a joint venture company with CR VanguardSources: Kantar Worldpanel; Bain analysis
Shanghai Chongqing
0
5
10
15
20
25%
15 30 45 60
Penetration (%, 2014)
Lotte MartYonghui
Metro E-Mart
WalmartNGS Supermarket
CP LotusTesco Carrefour
Lianhua
RT-Mart
Auchan
R² = 0.92
0
10
20
30
40
50%
15 30 45 60 75%
Penetration (%, 2014)
Vanguard
WSL*
CP Lotus
Metro
RenrenleCarrefour
Walmart
YonghuiR² = 0.87
Figure 8: For hypermarket retailers, increased penetration contributed to market share gains
outlets are located in Beijing, Tianjin and Zhejiang; and nearly 50% of Walmart’s outlets are concentrated in
Guangdong, Fujian, Sichuan, Jiangsu and Shanghai. In addition to these concentrations, they also proactively
built leadership at the city/province level by achieving a leading position in key cities in specific regions. For
example, Yonghui’s share in Chongqing, its second-largest market, is 2.5 times that of its nearest competitor.
Wumart’s market share in its largest market, Beijing, is 1.6 times that of Carrefour, its closest competitor. And
Walmart maintains 2.1 times the market share of its closest competitor in its home base market of Shenzhen. After
gaining scale in key cities, leading players began to build scale in surrounding areas to create multi-city clusters.
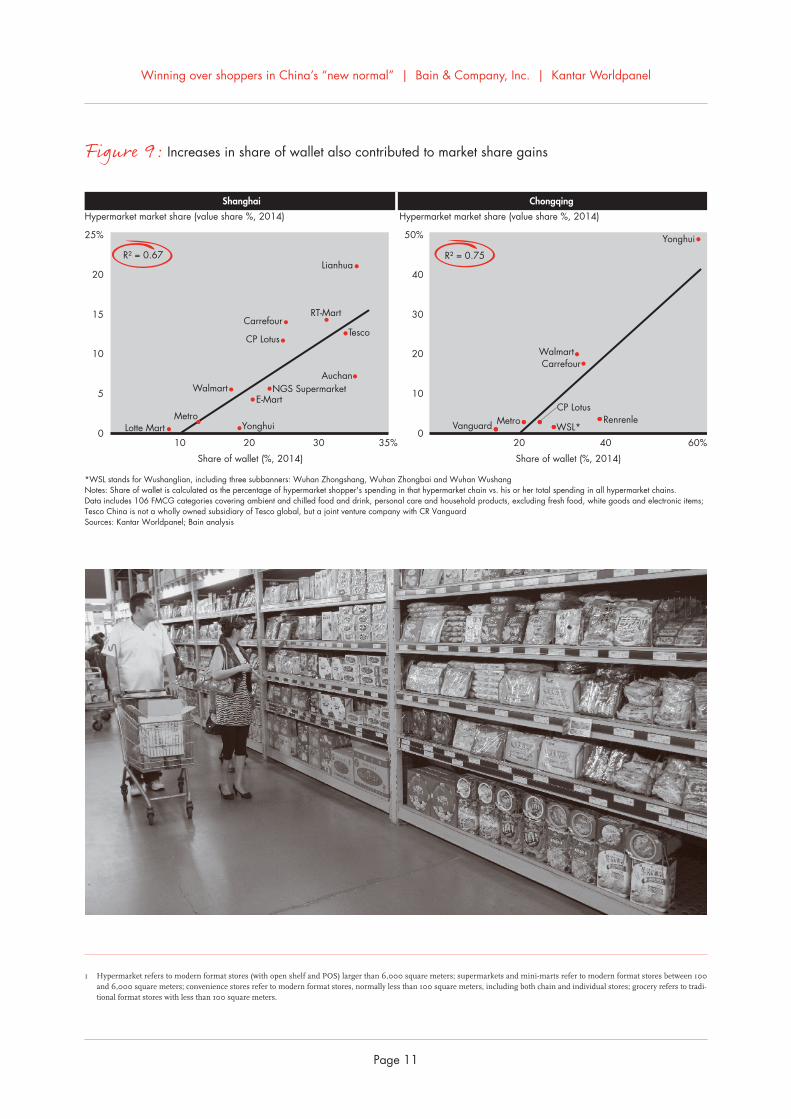
Penetration contributes to city leadership. That’s a major reason why Lianhua is the market leader in Shanghai
and Yonghui leads in Chongqing (see Figure 8). Both retailers have succeeded in getting new households to
shop in their stores each year. Both companies have also captured a growing share of wallet, another important
factor for achieving market share leadership (see Figure 9).
In addition to building regional market share, China’s top retailers are winning by emphasizing unique areas of
differentiation. Yonghui uses fresh food as a competitive advantage while RT-Mart distinguishes itself by offering
low prices for daily necessities such as eggs. Meanwhile, these top retailers are speeding up the consolidation of
China’s retail market in multiple ways. Some have taken equity positions in other retailers. Consider Yonghui’s
minority stake in Lianhua and Wuhan Zhongbai. Retailers are also consolidating their supply chains, a move that
sometimes involves partnerships among domestic and multinational retailers.
Winning over shoppers in China’s “new normal” | Bain & Company, Inc. | Kantar Worldpanel
Page 11
Hypermarket market share (value share %, 2014) Hypermarket market share (value share %, 2014)
*WSL stands for Wushanglian, including three subbanners: Wuhan Zhongshang, Wuhan Zhongbai and Wuhan WushangNotes: Share of wallet is calculated as the percentage of hypermarket shopper's spending in that hypermarket chain vs. his or her total spending in all hypermarket chains.Data includes 106 FMCG categories covering ambient and chilled food and drink, personal care and household products, excluding fresh food, white goods and electronic items;Tesco China is not a wholly owned subsidiary of Tesco global, but a joint venture company with CR VanguardSources: Kantar Worldpanel; Bain analysis
Shanghai Chongqing
0
5
10
15
20
25%
10 20 30 35%
Share of wallet (%, 2014)
Lotte Mart YonghuiMetro
E-MartWalmart
CP LotusTesco
Carrefour
Lianhua
RT-Mart
R² = 0.67
0
10
20
30
40
50%
20 40 60%
Share of wallet (%, 2014)
Vanguard WSL*
CP LotusMetro Renrenle
R² = 0.75
Yonghui
CarrefourWalmart
AuchanNGS Supermarket
Figure 9: Increases in share of wallet also contributed to market share gains
1 Hypermarket refers to modern format stores (with open shelf and POS) larger than 6,000 square meters; supermarkets and mini-marts refer to modern format stores between 100 and 6,000 square meters; convenience stores refer to modern format stores, normally less than 100 square meters, including both chain and individual stores; grocery refers to tradi-tional format stores with less than 100 square meters.
Winning over shoppers in China’s “new normal” | Bain & Company, Inc. | Kantar Worldpanel
Page 12
Winning over shoppers in China’s “new normal” | Bain & Company, Inc. | Kantar Worldpanel
Page 13
Chinaonline:FMCGtrendsandbehaviors
While offline retailers grapple with growth challenges, e-commerce sales in the country continue to boom. In
fact, online sales rose 34% in 2014. While this figure represents a drop from 41.8% in 2013, it still represents
robust activity and reflects Chinese shoppers’ continued enthusiasm for browsing, purchasing and reviewing
products online. If there’s a bright spot for FMCG retailers in China, it’s in the digital realm, where shoppers are
willing to spend more in specific product categories and purchase larger quantities.
Chinese shoppers have become such huge fans of online purchasing that it would be hard to find a market
where shoppers have more fervently ignited the e-commerce revolution. As the online retail world grows, it’s
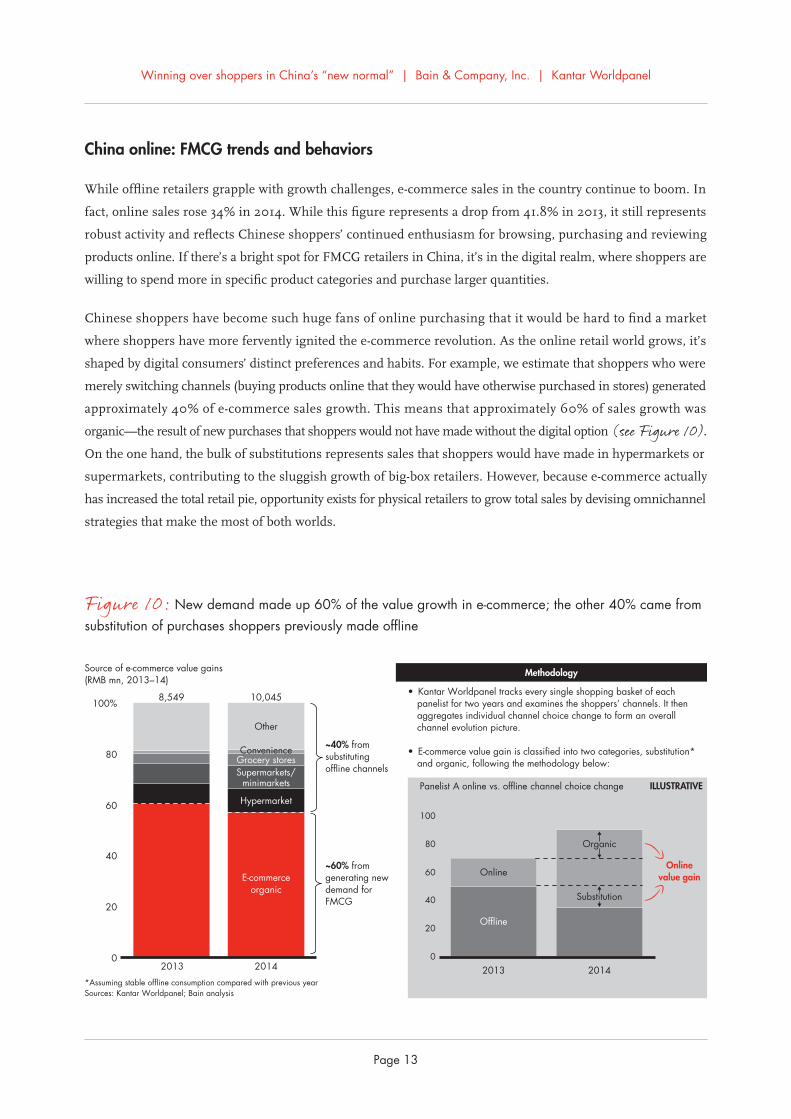
shaped by digital consumers’ distinct preferences and habits. For example, we estimate that shoppers who were
merely switching channels (buying products online that they would have otherwise purchased in stores) generated
approximately 40% of e-commerce sales growth. This means that approximately 60% of sales growth was
organic—the result of new purchases that shoppers would not have made without the digital option (see Figure 10).
On the one hand, the bulk of substitutions represents sales that shoppers would have made in hypermarkets or
supermarkets, contributing to the sluggish growth of big-box retailers. However, because e-commerce actually
has increased the total retail pie, opportunity exists for physical retailers to grow total sales by devising omnichannel
strategies that make the most of both worlds.
Source of e-commerce value gains (RMB mn, 2013–14)
*Assuming stable offline consumption compared with previous yearSources: Kantar Worldpanel; Bain analysis
0
20
40
60
80
100%
2013
8,549 10,045
2014
Onlinevalue gain
ILLUSTRATIVE
0
20
40
60
80
100
Panelist A online vs. offline channel choice change
2013 2014
E-commerceorganic
Online
Organic
Substitution
Offline
Supermarkets/minimarkets
Grocery stores
Other
Convenience
Methodology
• Kantar Worldpanel tracks every single shopping basket of each panelist for two years and examines the shoppers’ channels. It then aggregates individual channel choice change to form an overall channel evolution picture.
• E-commerce value gain is classified into two categories, substitution* and organic, following the methodology below:
Hypermarket
~40% from substituting offline channels
~60% from generating new demand for FMCG
Figure 10: New demand made up 60% of the value growth in e-commerce; the other 40% came from substitution of purchases shoppers previously made offline
Winning over shoppers in China’s “new normal” | Bain & Company, Inc. | Kantar Worldpanel
Page 14
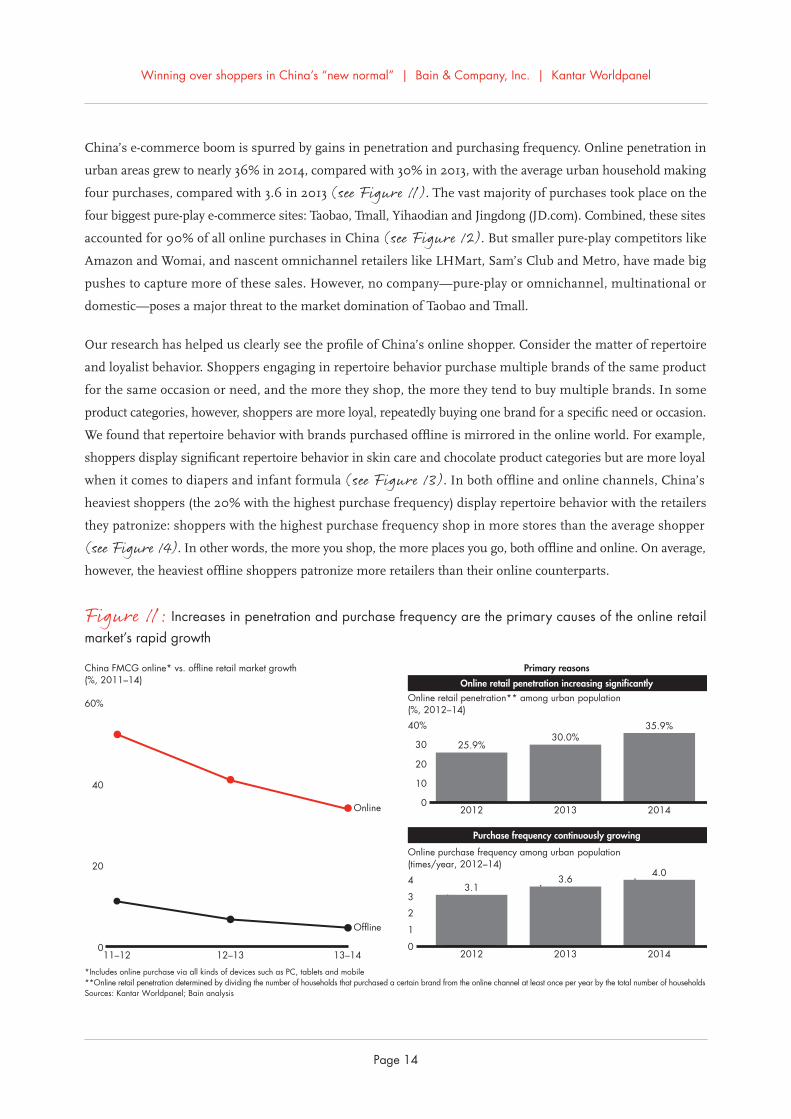
China FMCG online* vs. offline retail market growth (%, 2011–14)
*Includes online purchase via all kinds of devices such as PC, tablets and mobile**Online retail penetration determined by dividing the number of households that purchased a certain brand from the online channel at least once per year by the total number of householdsSources: Kantar Worldpanel; Bain analysis
2.0
0
20
40
60%
Offline
11–12 12–13 13–14
Online 0
10
20
30
40%
Online retail penetration** among urban population(%, 2012–14)
0
1
2
3
4
Online purchase frequency among urban population(times/year, 2012–14)
2012
25.9%
2012
3.1
2013
30.0%
2013
3.6
2014
35.9%
2014
4.0
Primary reasons
Online retail penetration increasing significantly
Purchase frequency continuously growing
Figure 11: Increases in penetration and purchase frequency are the primary causes of the online retail market’s rapid growth
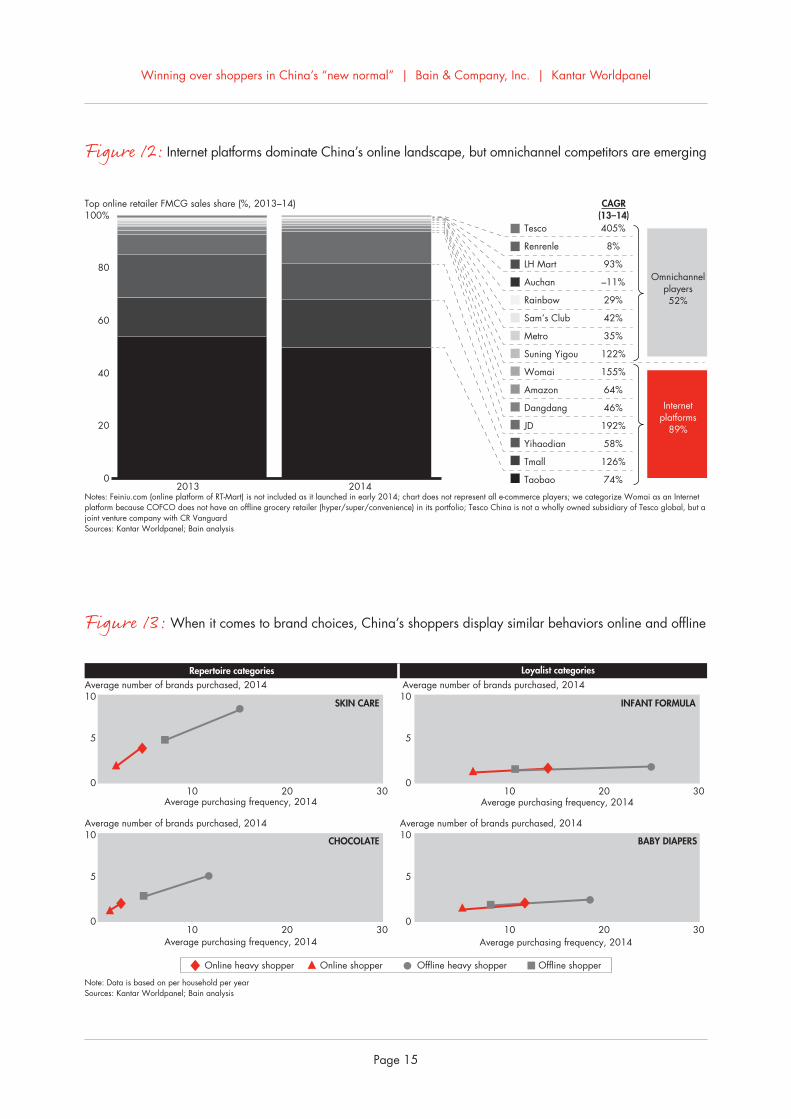
China’s e-commerce boom is spurred by gains in penetration and purchasing frequency. Online penetration in
urban areas grew to nearly 36% in 2014, compared with 30% in 2013, with the average urban household making
four purchases, compared with 3.6 in 2013 (see Figure 11). The vast majority of purchases took place on the
four biggest pure-play e-commerce sites: Taobao, Tmall, Yihaodian and Jingdong (JD.com). Combined, these sites
accounted for 90% of all online purchases in China (see Figure 12). But smaller pure-play competitors like
Amazon and Womai, and nascent omnichannel retailers like LHMart, Sam’s Club and Metro, have made big
pushes to capture more of these sales. However, no company—pure-play or omnichannel, multinational or
domestic—poses a major threat to the market domination of Taobao and Tmall.
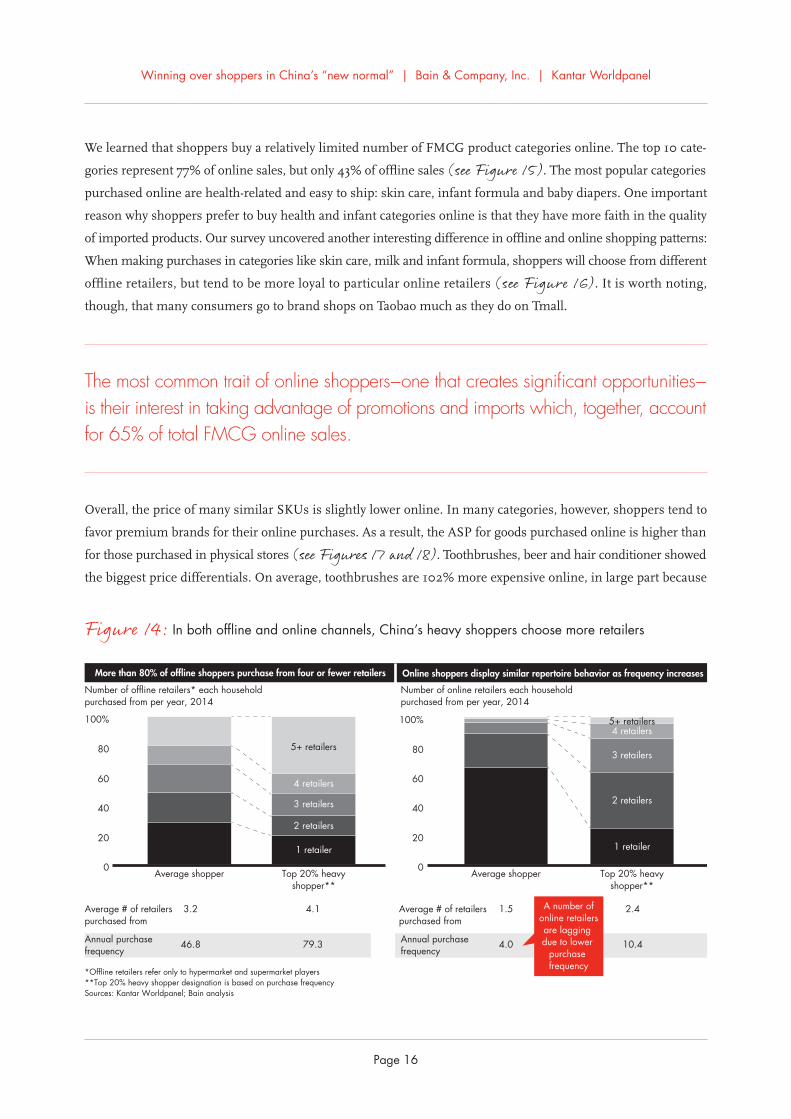
Our research has helped us clearly see the profile of China’s online shopper. Consider the matter of repertoire
and loyalist behavior. Shoppers engaging in repertoire behavior purchase multiple brands of the same product
for the same occasion or need, and the more they shop, the more they tend to buy multiple brands. In some
product categories, however, shoppers are more loyal, repeatedly buying one brand for a specific need or occasion.
We found that repertoire behavior with brands purchased offline is mirrored in the online world. For example,
shoppers display significant repertoire behavior in skin care and chocolate product categories but are more loyal
when it comes to diapers and infant formula (see Figure 13). In both offline and online channels, China’s
heaviest shoppers (the 20% with the highest purchase frequency) display repertoire behavior with the retailers
they patronize: shoppers with the highest purchase frequency shop in more stores than the average shopper
(see Figure 14). In other words, the more you shop, the more places you go, both offline and online. On average,
however, the heaviest offline shoppers patronize more retailers than their online counterparts.
Winning over shoppers in China’s “new normal” | Bain & Company, Inc. | Kantar Worldpanel
Page 15
Top online retailer FMCG sales share (%, 2013–14)
Notes: Feiniu.com (online platform of RT-Mart) is not included as it launched in early 2014; chart does not represent all e-commerce players; we categorize Womai as an Internet platform because COFCO does not have an offline grocery retailer (hyper/super/convenience) in its portfolio; Tesco China is not a wholly owned subsidiary of Tesco global, but ajoint venture company with CR VanguardSources: Kantar Worldpanel; Bain analysis
CAGR(13–14)
0
20
40
60
80
100%
2013 2014
Tesco 405%
Renrenle 8%
LH Mart 93%
Auchan –11%
Rainbow 29%
Sam’s Club 42%
Metro 35%
Suning Yigou 122%
Womai 155%
Amazon 64%
Dangdang 46%
JD 192%
Yihaodian 58%
Tmall 126%
Taobao 74%
Omnichannelplayers52%
Internetplatforms
89%
Figure 12: Internet platforms dominate China’s online landscape, but omnichannel competitors are emerging
Average number of brands purchased, 2014
Average number of brands purchased, 2014
Average number of brands purchased, 2014
Average number of brands purchased, 2014
Note: Data is based on per household per yearSources: Kantar Worldpanel; Bain analysis
Repertoire categories Loyalist categories
SKIN CARE
CHOCOLATE
INFANT FORMULA
BABY DIAPERS
0
5
10
10 20 300
5
10
10 20 30
0
5
10
10 20 300
5
10
10 20 30
Average purchasing frequency, 2014 Average purchasing frequency, 2014
Average purchasing frequency, 2014 Average purchasing frequency, 2014
Online heavy shopper Online shopper Offline heavy shopper Offline shopper
Figure 13: When it comes to brand choices, China’s shoppers display similar behaviors online and offline
Winning over shoppers in China’s “new normal” | Bain & Company, Inc. | Kantar Worldpanel
Page 16
Number of offline retailers* each household purchased from per year, 2014
Number of online retailers each household purchased from per year, 2014
*Offline retailers refer only to hypermarket and supermarket players **Top 20% heavy shopper designation is based on purchase frequencySources: Kantar Worldpanel; Bain analysis
More than 80% of offline shoppers purchase from four or fewer retailers Online shoppers display similar repertoire behavior as frequency increases
0
20
40
60
80
100%
Average # of retailerspurchased from
Average # of retailerspurchased from
Average shopper
3.2
46.8
Top 20% heavyshopper**
1 retailer
2 retailers
3 retailers
4 retailers
5+ retailers
4.1
79.3Annual purchasefrequency
Annual purchasefrequency
0
20
40
60
80
100%
Average shopper
1.5
4.0
Top 20% heavyshopper**
1 retailer
2 retailers
3 retailers
4 retailers5+ retailers
2.4
10.4
A number ofonline retailersare lagging due to lower
purchase frequency
Figure 14: In both offline and online channels, China’s heavy shoppers choose more retailers
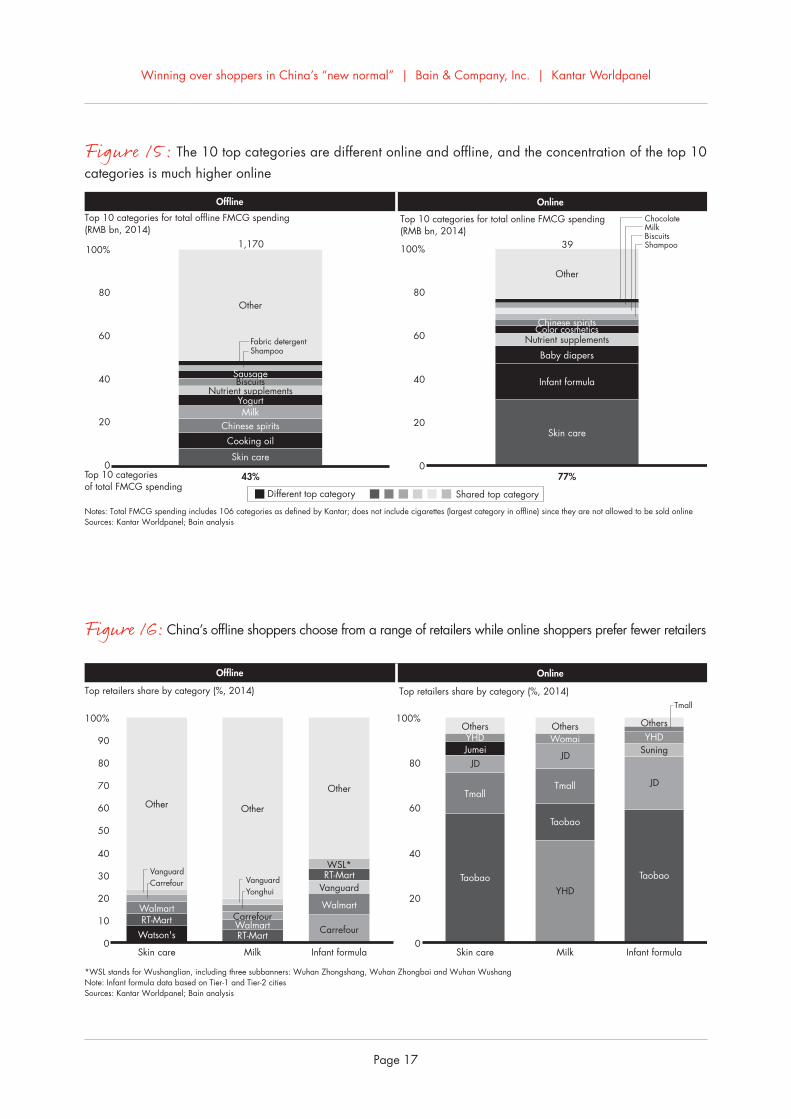
We learned that shoppers buy a relatively limited number of FMCG product categories online. The top 10 cate-
gories represent 77% of online sales, but only 43% of offline sales (see Figure 15). The most popular categories
purchased online are health-related and easy to ship: skin care, infant formula and baby diapers. One important
reason why shoppers prefer to buy health and infant categories online is that they have more faith in the quality
of imported products. Our survey uncovered another interesting difference in offline and online shopping patterns:
When making purchases in categories like skin care, milk and infant formula, shoppers will choose from different
offline retailers, but tend to be more loyal to particular online retailers (see Figure 16). It is worth noting,
though, that many consumers go to brand shops on Taobao much as they do on Tmall.
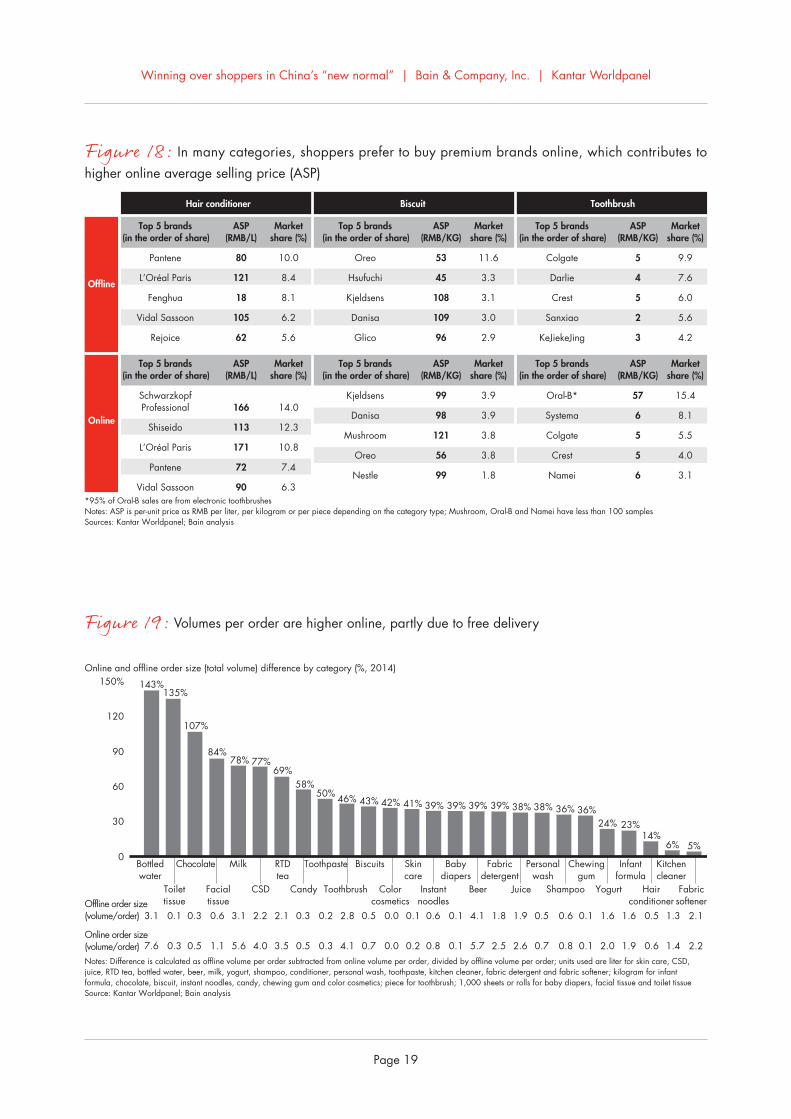
The most common trait of online shoppers−one that creates significant opportunities−is their interest in taking advantage of promotions and imports which, together, account for 65% of total FMCG online sales.
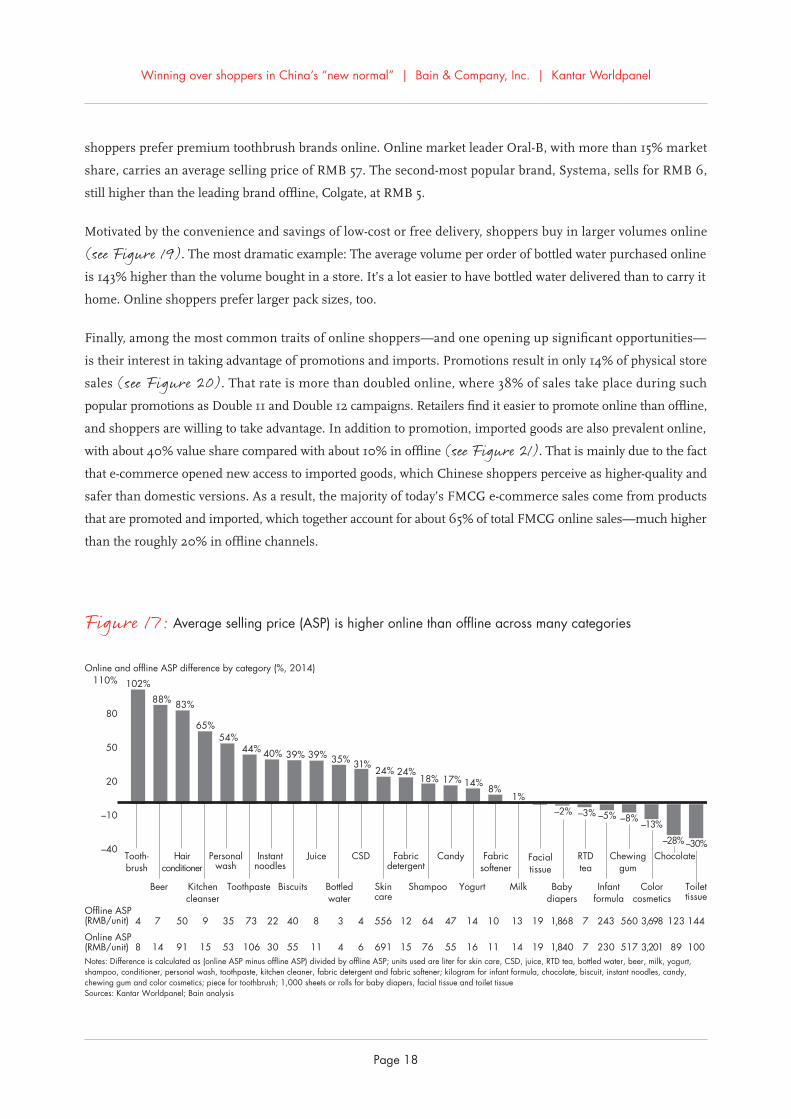
Overall, the price of many similar SKUs is slightly lower online. In many categories, however, shoppers tend to
favor premium brands for their online purchases. As a result, the ASP for goods purchased online is higher than
for those purchased in physical stores (see Figures 17 and 18). Toothbrushes, beer and hair conditioner showed
the biggest price differentials. On average, toothbrushes are 102% more expensive online, in large part because
Winning over shoppers in China’s “new normal” | Bain & Company, Inc. | Kantar Worldpanel
Page 17
Top 10 categories for total offline FMCG spending(RMB bn, 2014)
Top 10 categories for total online FMCG spending(RMB bn, 2014)
Offline Online
Notes: Total FMCG spending includes 106 categories as defined by Kantar; does not include cigarettes (largest category in offline) since they are not allowed to be sold onlineSources: Kantar Worldpanel; Bain analysis
0
20
40
60
80
100%
Skin care
Nutrient supplements
Chinese spiritsMilk
Yogurt
Cooking oil
Other
1,170 39
Fabric detergentShampoo
BiscuitsSausage
43%Top 10 categoriesof total FMCG spending
0
20
40
60
80
100%
Skin care
Infant formula
Baby diapers
Nutrient supplementsColor cosmeticsChinese spirits
Other
ShampooBiscuitsMilkChocolate
77%
Different top category Shared top category
Top retailers share by category (%, 2014) Top retailers share by category (%, 2014)
Offline Online
*WSL stands for Wushanglian, including three subbanners: Wuhan Zhongshang, Wuhan Zhongbai and Wuhan WushangNote: Infant formula data based on Tier-1 and Tier-2 citiesSources: Kantar Worldpanel; Bain analysis
0
10
20
30
40
50
60
70
80
90
100%
Skin care
Watson'sRT-MartWalmart
Other
Milk
WalmartCarrefour
Other
Infant formula
Walmart
Carrefour
Vanguard
WSL*
Other
CarrefourVanguard
VanguardYonghui
0
20
40
60
80
100%
Skin care
Taobao
Tmall
JDJumei
Others
Milk
Taobao
Tmall
JD
YHD
WomaiOthers
Infant formula
Taobao
JD
Suning
OthersYHD
Tmall
YHD
RT-Mart
RT-Mart
Figure 15: The 10 top categories are different online and offline, and the concentration of the top 10 categories is much higher online
Figure 16: China’s offline shoppers choose from a range of retailers while online shoppers prefer fewer retailers
Winning over shoppers in China’s “new normal” | Bain & Company, Inc. | Kantar Worldpanel
Page 18
Online and offline ASP difference by category (%, 2014)
Notes: Difference is calculated as (online ASP minus offline ASP) divided by offline ASP; units used are liter for skin care, CSD, juice, RTD tea, bottled water, beer, milk, yogurt,shampoo, conditioner, personal wash, toothpaste, kitchen cleaner, fabric detergent and fabric softener; kilogram for infant formula, chocolate, biscuit, instant noodles, candy,chewing gum and color cosmetics; piece for toothbrush; 1,000 sheets or rolls for baby diapers, facial tissue and toilet tissueSources: Kantar Worldpanel; Bain analysis
–40
–10
20
50
80
110%
1444 560Offline ASP(RMB/unit)
Fabricdetergent
24%
12
15
Facialtissue
19
19 100
Candy
17%
47
558
Instantnoodles
40%
22
30
Juice
39%
8
11
CSD
31%
4
6
Fabricsoftener
8%
10
11 517
Personalwash
54%
35
53Online ASP(RMB/unit)
Tooth-brush
102%
88%
7
14
Beer
83%
50
91
Hairconditioner
65%
9
15
Kitchencleanser
44%
73
106
Toothpaste
39%
40
55
Biscuits
35%
3
4
Bottledwater
24%
556
691
Skincare
18%
64
76
Shampoo
14%
14
16
Yogurt
1%
13
14
Milk Toilettissue
1,868
1,840
Babydiapers
–2%
RTDtea
7
7
–3%
243
230
Infantformula
–5% –8%
3,698
3,201
Colorcosmetics
–13%
Chocolate
123
89
–28% –30%Chewing
gum
Figure 17: Average selling price (ASP) is higher online than offline across many categories
shoppers prefer premium toothbrush brands online. Online market leader Oral-B, with more than 15% market
share, carries an average selling price of RMB 57. The second-most popular brand, Systema, sells for RMB 6,
still higher than the leading brand offline, Colgate, at RMB 5.
Motivated by the convenience and savings of low-cost or free delivery, shoppers buy in larger volumes online
(see Figure 19). The most dramatic example: The average volume per order of bottled water purchased online
is 143% higher than the volume bought in a store. It’s a lot easier to have bottled water delivered than to carry it
home. Online shoppers prefer larger pack sizes, too.
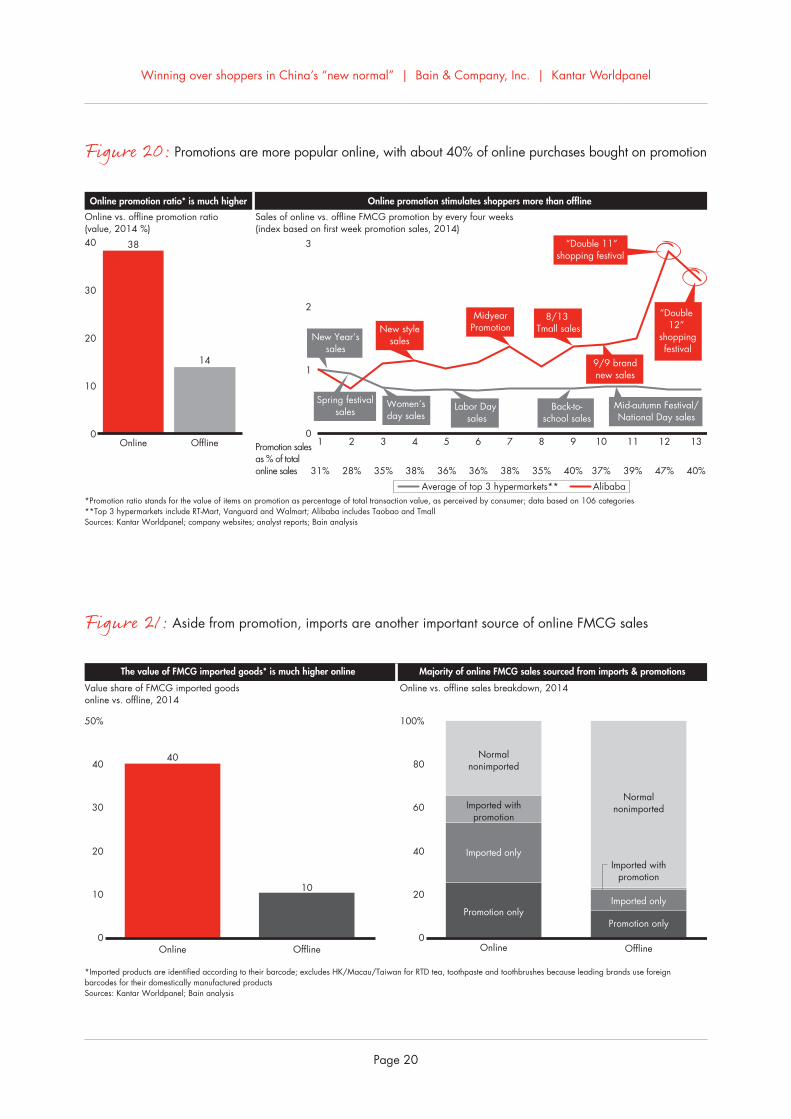
Finally, among the most common traits of online shoppers—and one opening up significant opportunities—
is their interest in taking advantage of promotions and imports. Promotions result in only 14% of physical store
sales (see Figure 20). That rate is more than doubled online, where 38% of sales take place during such
popular promotions as Double 11 and Double 12 campaigns. Retailers find it easier to promote online than offline,
and shoppers are willing to take advantage. In addition to promotion, imported goods are also prevalent online,
with about 40% value share compared with about 10% in offline (see Figure 21). That is mainly due to the fact
that e-commerce opened new access to imported goods, which Chinese shoppers perceive as higher-quality and
safer than domestic versions. As a result, the majority of today’s FMCG e-commerce sales come from products
that are promoted and imported, which together account for about 65% of total FMCG online sales—much higher
than the roughly 20% in offline channels.
Winning over shoppers in China’s “new normal” | Bain & Company, Inc. | Kantar Worldpanel
Page 19
*95% of Oral-B sales are from electronic toothbrushesNotes: ASP is per-unit price as RMB per liter, per kilogram or per piece depending on the category type; Mushroom, Oral-B and Namei have less than 100 samples Sources: Kantar Worldpanel; Bain analysis
Hair conditioner
Offline
Online
Biscuit Toothbrush
Top 5 brands ASP Market (in the order of share) (RMB/L) share (%)
Pantene 80 10.0
L’Oréal Paris 121 8.4
Fenghua 18 8.1
Vidal Sassoon 105 6.2
Rejoice 62 5.6
Top 5 brands ASP Market (in the order of share) (RMB/KG) share (%)
Oreo 53 11.6
Hsufuchi 45 3.3
Kjeldsens 108 3.1
Danisa 109 3.0
Glico 96 2.9
Top 5 brands ASP Market (in the order of share) (RMB/KG) share (%)
Colgate 5 9.9
Darlie 4 7.6
Crest 5 6.0
Sanxiao 2 5.6
KeJiekeJing 3 4.2
Top 5 brands ASP Market (in the order of share) (RMB/L) share (%)
Schwarzkopf Professional 166 14.0
Shiseido 113 12.3
L’Oréal Paris 171 10.8
Pantene 72 7.4
Vidal Sassoon 90 6.3
Top 5 brands ASP Market (in the order of share) (RMB/KG) share (%)
Kjeldsens 99 3.9
Danisa 98 3.9
Mushroom 121 3.8
Oreo 56 3.8
Nestle 99 1.8
Top 5 brands ASP Market (in the order of share) (RMB/KG) share (%)
Oral-B* 57 15.4
Systema 6 8.1
Colgate 5 5.5
Crest 5 4.0
Namei 6 3.1
Figure 18: In many categories, shoppers prefer to buy premium brands online, which contributes to higher online average selling price (ASP)
Online and offline order size (total volume) difference by category (%, 2014)
Notes: Difference is calculated as offline volume per order subtracted from online volume per order, divided by offline volume per order; units used are liter for skin care, CSD, juice, RTD tea, bottled water, beer, milk, yogurt, shampoo, conditioner, personal wash, toothpaste, kitchen cleaner, fabric detergent and fabric softener; kilogram for infant formula, chocolate, biscuit, instant noodles, candy, chewing gum and color cosmetics; piece for toothbrush; 1,000 sheets or rolls for baby diapers, facial tissue and toilet tissueSource: Kantar Worldpanel; Bain analysis
0
30
60
90
120
150%
Bottledwater
143%135%
Chocolate
107%
84%
Milk
78% 77%
RTDtea
69%58%
Toothpaste
50% 46%
Biscuits
43% 42%
Skincare
41% 39%
Babydiapers
39% 39%
Fabricdetergent
39% 38%
Personalwash
38% 36%
Chewinggum
36%24%
Infantformula
23%14%
Kitchencleaner
6% 5%
4.1 0.6 0.50.52.2 1.92.13.1 1.60.10.62.80.3 1.31.8 2.10.6 0.2 0.10.0 0.1 1.63.10.3 0.5
5.7 0.8 0.60.74.0 2.63.57.6 2.00.10.84.10.5 1.42.5 2.21.1 0.3 0.20.0 0.1 1.95.60.5 0.7
Toilettissue
CSD Candy Toothbrush Colorcosmetics
Instantnoodles
Beer Juice Shampoo Yogurt Hairconditioner
Fabricsoftener
0.1
0.3
Offline order size(volume/order)
Online order size (volume/order)
Facialtissue
Figure 19: Volumes per order are higher online, partly due to free delivery
Winning over shoppers in China’s “new normal” | Bain & Company, Inc. | Kantar Worldpanel
Page 20
10
Value share of FMCG imported goods online vs. offline, 2014
Online vs. offline sales breakdown, 2014
*Imported products are identified according to their barcode; excludes HK/Macau/Taiwan for RTD tea, toothpaste and toothbrushes because leading brands use foreign barcodes for their domestically manufactured productsSources: Kantar Worldpanel; Bain analysis
The value of FMCG imported goods* is much higher online Majority of online FMCG sales sourced from imports & promotions
0
10
20
30
40
50%
Online
40
Offline0
20
40
60
80
100%
Online
Imported only
Imported withpromotion
Promotion only
Normalnonimported
Imported only
Imported withpromotion
Promotion only
Normalnonimported
Offline
Online vs. offline promotion ratio(value, 2014 %)
Sales of online vs. offline FMCG promotion by every four weeks (index based on first week promotion sales, 2014)
*Promotion ratio stands for the value of items on promotion as percentage of total transaction value, as perceived by consumer; data based on 106 categories **Top 3 hypermarkets include RT-Mart, Vanguard and Walmart; Alibaba includes Taobao and TmallSources: Kantar Worldpanel; company websites; analyst reports; Bain analysis
Online promotion ratio* is much higher Online promotion stimulates shoppers more than offline
0
10
20
30
40
Online
38
Offline
14
0
2
1
3
1Promotion salesas % of totalonline sales
2 3 4 5 6 7 8 9 10 11 12 13
31% 28% 35% 38% 36% 36% 38% 35% 40% 37% 39% 47% 40%
Average of top 3 hypermarkets** Alibaba
Back-to-school sales
Mid-autumn Festival/National Day sales
Women’sday sales
Labor Day sales
“Double 12”
shoppingfestival
9/9 brandnew sales
8/13 Tmall sales
“Double 11”shopping festival
MidyearPromotion
New Year’ssales
New stylesales
Spring festivalsales
Figure 20: Promotions are more popular online, with about 40% of online purchases bought on promotion
Figure 21: Aside from promotion, imports are another important source of online FMCG sales
Winning over shoppers in China’s “new normal” | Bain & Company, Inc. | Kantar Worldpanel
Page 21
Implications for retailers
What do these findings mean for retailers hoping to win in China’s new normal? The most successful companies
will adhere to a local or regional focus for physical store expansion. With sales growth decelerating, winning
means establishing leadership in one city or region at a time—and only then expanding beyond. It also means
constantly pruning its store portfolio and closing underperforming stores. Meanwhile, with big-box stores no
longer experiencing rapid growth, another key to success in China in the years ahead will be developing and
introducing smaller formats similar to the Carrefour Easy stores that the French retailer opened in Shanghai.
Small-box stores require less investment than larger formats, are more efficient to operate and serve Chinese
shoppers’ growing need for convenience. They can also be used to help retailers implement O2O strategies—
serving as a site for picking up or returning items purchased online, for example.
Retailers need to prepare for the O2O era, and forward-thinking players are taking aggressive steps. In August,
JD.com agreed to invest RMB 4.3 billion (US$700 million) for a 10% stake in Chinese supermarket chain Yonghui
Superstores. The move is designed to enable the retailers to benefit from synergies in sourcing, warehousing,
Internet finance and IT. More important, though, it will enable the companies to implement an O2O strategy.
Also in August, Alibaba bought a 19.9% stake in electronics retail giant Suning, an offline rival, for RMB
28.3 billion (US$4.5 billion). Suning, which has more than 1,600 physical stores across 289 cities in China, in-
vested as much as RMB 14 billion (US$2.28 billion) to take a 1.1% stake in Alibaba. The arrangement gives Suning
access to Alibaba’s massive online traffic, while Alibaba can make the most of Suning’s extensive offline network,
sharing logistics facilities, for example, and integrating Suning’s stores with Alibaba’s platform.
International retailers, too, are actively preparing for O2O. Less than two weeks before the JD.com and Alibaba
deals were announced, Walmart fully acquired the remaining 49% equity share in Yihaodian to become the
online food retailer’s sole shareholder.
Brick-and-mortar retailers are taking different paths to their O2O future. Some rely on big e-commerce players
like Tmall to reach digital shoppers, while others seed their own online sites. Regardless of preferred approach,
the most successful offline retailers will stress the importance of managing customer data. To grow in China’s
e-commerce marketplace, retailers need to tailor their offerings based on evolving online shopping behaviors,
taking lessons from the category strengths that are fueling pure online players’ fast success. The best companies
will optimize their offline and online SKU mix to address online shoppers’ demonstrated preferences for purchasing
premium products online. They will make the most of low-cost or free delivery services to spur increases in pack
size or bundled product purchases and will thoughtfully take advantage of online shoppers’ enthusiastic embrace
of e-commerce promotions and imports.
Winning over shoppers in China’s “new normal” | Bain & Company, Inc. | Kantar Worldpanel
Page 22
About the authors and acknowledgments
BrunoLannes is a partner with Bain’s Shanghai office and leads the Consumer Products and Retail practices for Greater China. You may contact him by email at [email protected].
WeiwenHan is a partner with Bain’s Shanghai office. You may contact him by email at [email protected].
JasonDing is a partner with Bain’s Beijing office. You may contact him by email at [email protected].
ChenkaiLing is a principal with Bain’s Shanghai office. You may contact him by email at [email protected].
MarcyKou is CEO at Kantar Worldpanel Asia. You may contact her by email at [email protected].
JasonYu is general manager at Kantar Worldpanel China. You may contact him by email at [email protected].
Please direct questions and comments about this report via email to the authors.
Acknowledgments
This report is a joint effort between Bain & Company and Kantar Worldpanel. The authors extend their grati-tude to all who contributed to this report, in particular Iris Zhou, Zoe Zou, Jacob Zhou, Pengpeng Wang from Bain & Company and Rachel Lee, Tina Qin and Tracy Zhuang from Kantar Worldpanel.

Winning over shoppers in China’s “new normal” | Bain & Company, Inc. | Kantar Worldpanel
Page 23
Winning over shoppers in China’s “new normal” | Bain & Company, Inc. | Kantar Worldpanel
Page 24

Shared Ambition, True Results
Bain & Company is the management consulting firm that the world’s business leaders come to when they want results.
Bain advises clients on strategy, operations, technology, organization, private equity and mergers and acquisitions. We develop practical, customized insights that clients act on and transfer skills that make change stick. Founded in 1973, Bain has 53 offices in 34 countries, and our deep expertise and client roster cross every industry and economic sector. Our clients have outperformed the stock market 4 to 1.
What sets us apart
We believe a consulting firm should be more than an adviser. So we put ourselves in our clients’ shoes, selling outcomes, not projects. We align our incentives with our clients’ by linking our fees to their results and collaborate to unlock the full potential of their business. Our Results Delivery® process builds our clients’ capabilities, and our True North values mean we do the right thing for our clients, people and communities—always.
Bain in Greater China
Bain was the first strategic consulting firm to set up an office in Beijing in 1993. Since then Bain has worked with both multi-nationals and local clients across more than 30 industries. We have served our clients in more than 40 cities in China and now have three offices in the Greater China region, covering Beijing, Shanghai and Hong Kong. We currently have about 200 consultants with extensive work experience in China and throughout the world working in our offices.
Kantar Worldpanel—high definition inspiration™, a CTR service in China
Kantar Worldpanel is the world leader in continuous consumer panels. Our global team of consultants applies tailored research solutions and advanced analytics to bring you unrivaled sharpness and clarity of insight to both the big picture and the fine detail. We help our clients understand what people buy, what they use and the attitudes behind shopper and consumer behavior.
We use the latest data collection technologies best matched to the people and the environment we are measuring.
Our expertise is rooted in hard, quantitative evidence—evidence that has become the market currency for local and multinational FMCG brand and private label manufacturers, fresh food suppliers, retailers, market analysts and government organizations. We are not limited to the grocery sector; we have a wide range of panels in fields as diverse as entertainment, communications, petrol, fashion, personal care, beauty, baby and food on-the-go.
It’s what we do with our data that sets us apart. We apply hindsight, insight, foresight and advice to make a real difference to the way you see your world and inspire the actions you take for a more successful business.
We have more than 60 years’ experience in helping companies shape their strategies and manage their tactical decisions; we understand shopper and retailer dynamics; we explore opportunities for growth in terms of products, categories, regions and within trade environments. Together with our partner relationships, we are present in more than 50 countries—in most of which we are market leaders—which means we can deliver inspiring insights on a local, regional and global scale. Kantar Worldpanel was formerly known as TNS Worldpanel.