Embed Size (px)
Citation preview
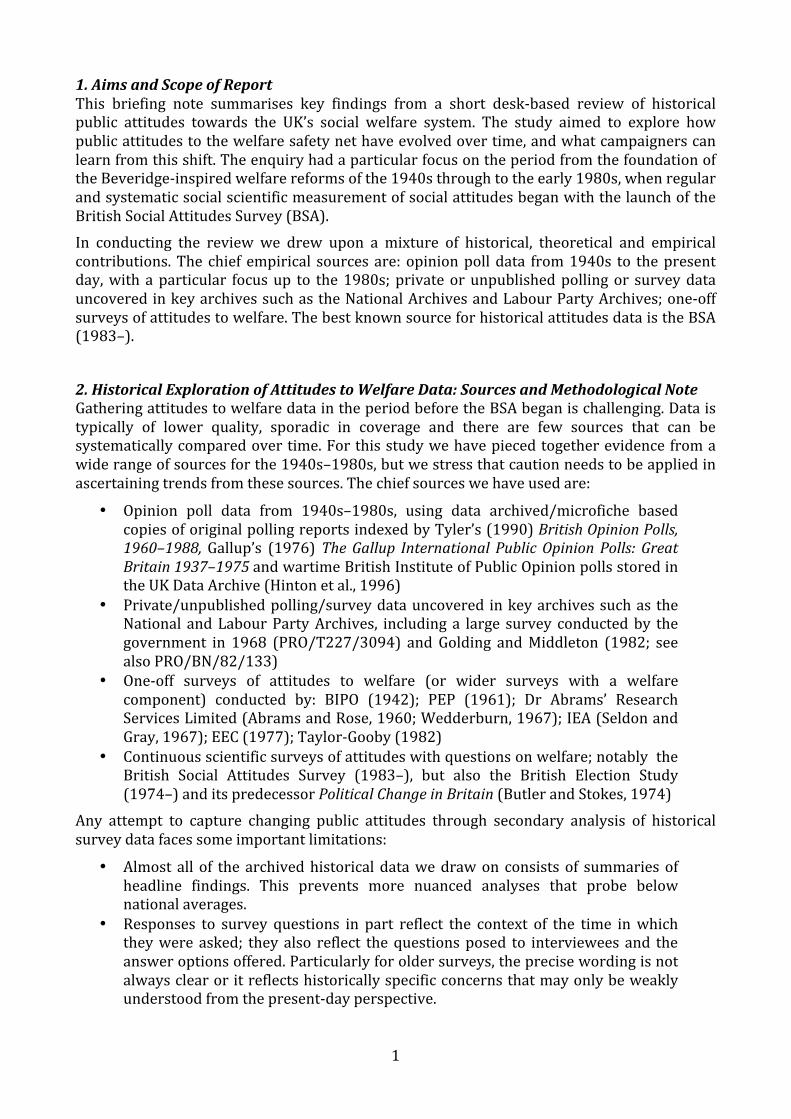
Winning Support for the Safety Net: Exploring the Historical Evidence
Research Summary
John Hudson & Neil Lunt with Charlotte Hamilton, Sophie Mackinder, Jed Meers & Chelsea Swift
Department of Social Policy & Social Work, University of York
Key Points This briefing summarises the findings from a review of historical attitudes of the UK’s social welfare system. The review draws on opinion poll and survey data from the 1940s through to the present day; archived private or unpublished survey data and one-‐off surveys of attitudes to welfare. The best-‐known source for evidence of historical attitudes to welfare in the UK is the British Social Attitudes Survey (BSA, 1983-‐). The record following this is less complete and less understood. This summary places the historical data from before this period within the context of contemporary understandings of social attitudes derived from the BSA. The key findings from the study are as follows:
• There is no simple story of public opinion being once enthusiastically behind the ‘welfare state’ and then swinging against it.
• The British Social Attitudes Survey data appear to show a hardening of public attitudes since the 1980s. However, our analysis suggests these data fail to adequately capture the complexity of long-‐term trends. The unique pressures of the 1980s may have produced a more sympathetic view of welfare than existed in the late-‐1960s/1970s. Viewed from a longer perspective, it appears that attitudes have not so much hardened as returned towards an underlying long-‐running position that is somewhat equivocal to social spending.
• The welfare state is rarely at the top of the agenda for the public. Furthermore, attitudes have been fairly split in terms of support since the inception of the modern welfare state. The picture is a consistent one of ‘pragmatic acceptance’ rather than total hostility or keen support.
• Current attitudes data show a strong hierarchy of preferences around social spending. Our research shows that this was the case from the early days of what we know as the welfare system.
• Health is overwhelmingly the most popular area, with education and pensions also typically high in the list of social spending priorities. Support for working-‐age cash benefits, particularly the unemployed, tends to be lower. One important exception may be around family or child benefits, where relative support appears to have considerably increased .
• An underlying moralistic tone rooted in the ‘deserving’ and ‘undeserving’ can be detected from early on. It is present in survey results from the 1950s, 1960s and 1970s.
• Interpreting historical data is challenging and caution must be placed around interpretation of many of the early surveys. While they represent the best evidence we have, many are limited by scope and design.
1
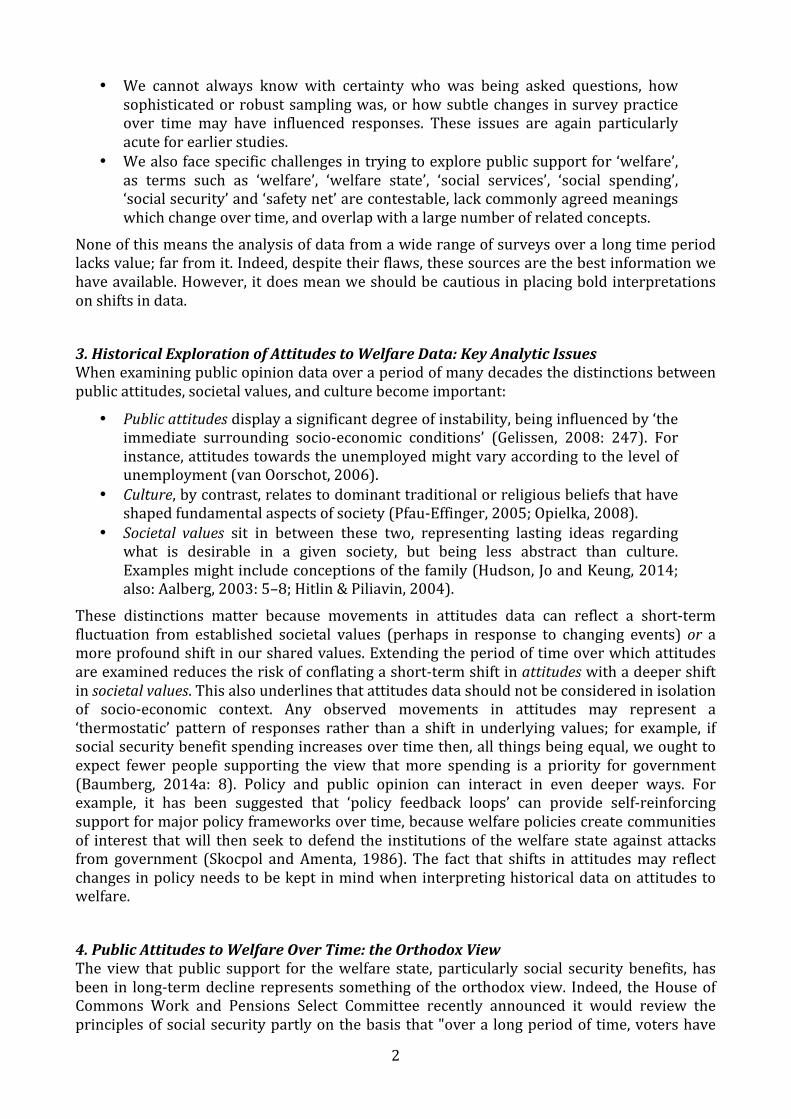
1. Aims and Scope of Report This briefing note summarises key findings from a short desk-‐based review of historical public attitudes towards the UK’s social welfare system. The study aimed to explore how public attitudes to the welfare safety net have evolved over time, and what campaigners can learn from this shift. The enquiry had a particular focus on the period from the foundation of the Beveridge-‐inspired welfare reforms of the 1940s through to the early 1980s, when regular and systematic social scientific measurement of social attitudes began with the launch of the British Social Attitudes Survey (BSA). In conducting the review we drew upon a mixture of historical, theoretical and empirical contributions. The chief empirical sources are: opinion poll data from 1940s to the present day, with a particular focus up to the 1980s; private or unpublished polling or survey data uncovered in key archives such as the National Archives and Labour Party Archives; one-‐off surveys of attitudes to welfare. The best known source for historical attitudes data is the BSA (1983–).
2. Historical Exploration of Attitudes to Welfare Data: Sources and Methodological Note Gathering attitudes to welfare data in the period before the BSA began is challenging. Data is typically of lower quality, sporadic in coverage and there are few sources that can be systematically compared over time. For this study we have pieced together evidence from a wide range of sources for the 1940s–1980s, but we stress that caution needs to be applied in ascertaining trends from these sources. The chief sources we have used are:
• Opinion poll data from 1940s–1980s, using data archived/microfiche based copies of original polling reports indexed by Tyler’s (1990) British Opinion Polls, 1960–1988, Gallup’s (1976) The Gallup International Public Opinion Polls: Great Britain 1937–1975 and wartime British Institute of Public Opinion polls stored in the UK Data Archive (Hinton et al., 1996)
• Private/unpublished polling/survey data uncovered in key archives such as the National and Labour Party Archives, including a large survey conducted by the government in 1968 (PRO/T227/3094) and Golding and Middleton (1982; see also PRO/BN/82/133)
• One-‐off surveys of attitudes to welfare (or wider surveys with a welfare component) conducted by: BIPO (1942); PEP (1961); Dr Abrams’ Research Services Limited (Abrams and Rose, 1960; Wedderburn, 1967); IEA (Seldon and Gray, 1967); EEC (1977); Taylor-‐Gooby (1982)
• Continuous scientific surveys of attitudes with questions on welfare; notably the British Social Attitudes Survey (1983–), but also the British Election Study (1974–) and its predecessor Political Change in Britain (Butler and Stokes, 1974)
Any attempt to capture changing public attitudes through secondary analysis of historical survey data faces some important limitations:
• Almost all of the archived historical data we draw on consists of summaries of headline findings. This prevents more nuanced analyses that probe below national averages.
• Responses to survey questions in part reflect the context of the time in which they were asked; they also reflect the questions posed to interviewees and the answer options offered. Particularly for older surveys, the precise wording is not always clear or it reflects historically specific concerns that may only be weakly understood from the present-‐day perspective.
2
• We cannot always know with certainty who was being asked questions, how sophisticated or robust sampling was, or how subtle changes in survey practice over time may have influenced responses. These issues are again particularly acute for earlier studies.
• We also face specific challenges in trying to explore public support for ‘welfare’, as terms such as ‘welfare’, ‘welfare state’, ‘social services’, ‘social spending’, ‘social security’ and ‘safety net’ are contestable, lack commonly agreed meanings which change over time, and overlap with a large number of related concepts.
None of this means the analysis of data from a wide range of surveys over a long time period lacks value; far from it. Indeed, despite their flaws, these sources are the best information we have available. However, it does mean we should be cautious in placing bold interpretations on shifts in data.
3. Historical Exploration of Attitudes to Welfare Data: Key Analytic Issues When examining public opinion data over a period of many decades the distinctions between public attitudes, societal values, and culture become important:
• Public attitudes display a significant degree of instability, being influenced by ‘the immediate surrounding socio-‐economic conditions’ (Gelissen, 2008: 247). For instance, attitudes towards the unemployed might vary according to the level of unemployment (van Oorschot, 2006).
• Culture, by contrast, relates to dominant traditional or religious beliefs that have shaped fundamental aspects of society (Pfau-‐Effinger, 2005; Opielka, 2008).
• Societal values sit in between these two, representing lasting ideas regarding what is desirable in a given society, but being less abstract than culture. Examples might include conceptions of the family (Hudson, Jo and Keung, 2014; also: Aalberg, 2003: 5–8; Hitlin & Piliavin, 2004).
These distinctions matter because movements in attitudes data can reflect a short-‐term fluctuation from established societal values (perhaps in response to changing events) or a more profound shift in our shared values. Extending the period of time over which attitudes are examined reduces the risk of conflating a short-‐term shift in attitudes with a deeper shift in societal values. This also underlines that attitudes data should not be considered in isolation of socio-‐economic context. Any observed movements in attitudes may represent a ‘thermostatic’ pattern of responses rather than a shift in underlying values; for example, if social security benefit spending increases over time then, all things being equal, we ought to expect fewer people supporting the view that more spending is a priority for government (Baumberg, 2014a: 8). Policy and public opinion can interact in even deeper ways. For example, it has been suggested that ‘policy feedback loops’ can provide self-‐reinforcing support for major policy frameworks over time, because welfare policies create communities of interest that will then seek to defend the institutions of the welfare state against attacks from government (Skocpol and Amenta, 1986). The fact that shifts in attitudes may reflect changes in policy needs to be kept in mind when interpreting historical data on attitudes to welfare.
4. Public Attitudes to Welfare Over Time: the Orthodox View The view that public support for the welfare state, particularly social security benefits, has been in long-‐term decline represents something of the orthodox view. Indeed, the House of Commons Work and Pensions Select Committee recently announced it would review the principles of social security partly on the basis that "over a long period of time, voters have
3
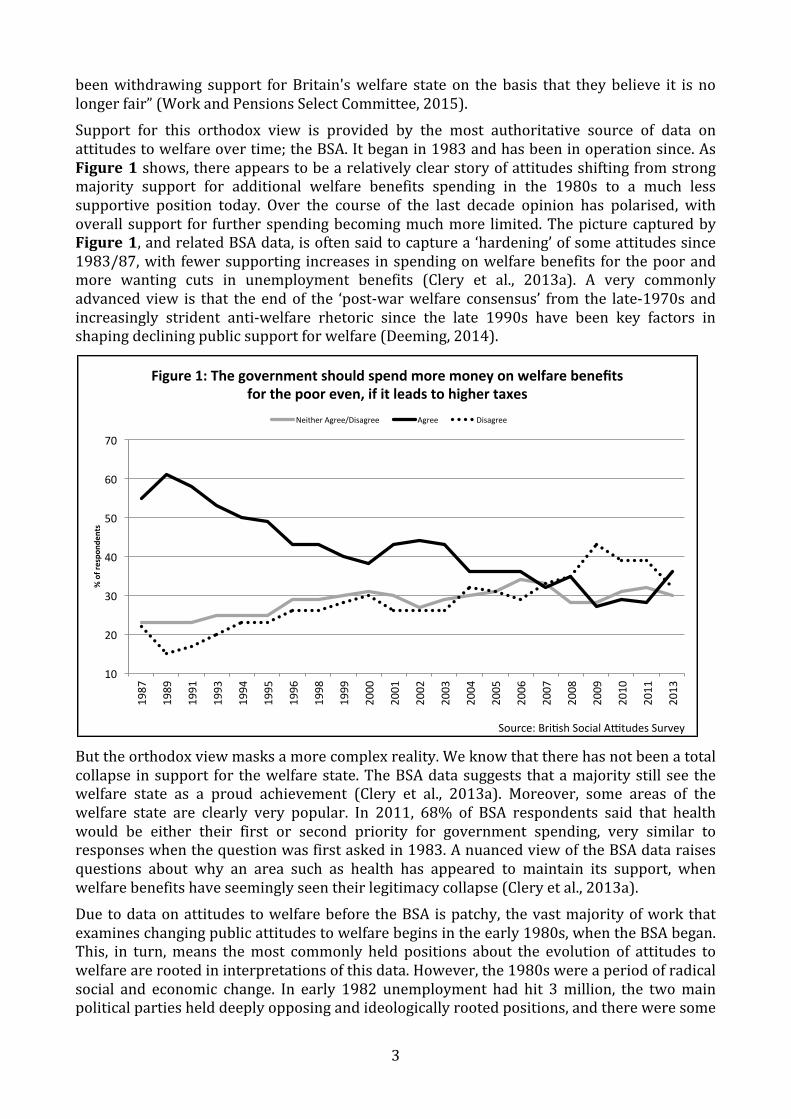
been withdrawing support for Britain's welfare state on the basis that they believe it is no longer fair” (Work and Pensions Select Committee, 2015). Support for this orthodox view is provided by the most authoritative source of data on attitudes to welfare over time; the BSA. It began in 1983 and has been in operation since. As Figure 1 shows, there appears to be a relatively clear story of attitudes shifting from strong majority support for additional welfare benefits spending in the 1980s to a much less supportive position today. Over the course of the last decade opinion has polarised, with overall support for further spending becoming much more limited. The picture captured by Figure 1, and related BSA data, is often said to capture a ‘hardening’ of some attitudes since 1983/87, with fewer supporting increases in spending on welfare benefits for the poor and more wanting cuts in unemployment benefits (Clery et al., 2013a). A very commonly advanced view is that the end of the ‘post-‐war welfare consensus’ from the late-‐1970s and increasingly strident anti-‐welfare rhetoric since the late 1990s have been key factors in shaping declining public support for welfare (Deeming, 2014).
But the orthodox view masks a more complex reality. We know that there has not been a total collapse in support for the welfare state. The BSA data suggests that a majority still see the welfare state as a proud achievement (Clery et al., 2013a). Moreover, some areas of the welfare state are clearly very popular. In 2011, 68% of BSA respondents said that health would be either their first or second priority for government spending, very similar to responses when the question was first asked in 1983. A nuanced view of the BSA data raises questions about why an area such as health has appeared to maintain its support, when welfare benefits have seemingly seen their legitimacy collapse (Clery et al., 2013a). Due to data on attitudes to welfare before the BSA is patchy, the vast majority of work that examines changing public attitudes to welfare begins in the early 1980s, when the BSA began. This, in turn, means the most commonly held positions about the evolution of attitudes to welfare are rooted in interpretations of this data. However, the 1980s were a period of radical social and economic change. In early 1982 unemployment had hit 3 million, the two main political parties held deeply opposing and ideologically rooted positions, and there were some
10#
20#
30#
40#
50#
60#
70#
1987#
1989#
1991#
1993#
1994#
1995#
1996#
1998#
1999#
2000#
2001#
2002#
2003#
2004#
2005#
2006#
2007#
2008#
2009#
2010#
2011#
2013#
%"of"respo
nden
ts"
Source:#Bri5sh#Social#A;tudes#Survey#
Figure"1:"The"government"should"spend"more"money"on"welfare"benefits"for"the"poor"even,"if"it"leads"to"higher"taxes"
Neither#Agree/Disagree# Agree# Disagree#
4
radical economic and social policy cut-‐backs taking place. It seems inconceivable that this did not add a good degree of ‘noise’ to the BSA’s early measurements of attitudes to welfare. This, of course, has implications for time-‐series analyses performed with 1983 as the baseline year. Might placing the BSA data in a broader historical context provide a challenge to the orthodox view that public support for welfare is in decline? As we note in Section 3, public attitudes can be unstable in the face of socio-‐economic pressures, but more enduring societal values are not. A longer view may show welfare attitudes in the 1980s are outliers. If so, rather than attitudes to welfare having hardened since the 1980s, they may have merely returned to their long-‐term position after a temporary ‘softening’ of views.
Exploration of this hypothesis underpins the review of historical data on attitudes to welfare presented in this report. In Sections 5–8 we examine data covering the period from the establishment of the Beveridge-‐inspired welfare state in the 1940s through to the start of the BSA in the early 1980s. In Section 9 we draw out some key findings from the BSA data covering the period from the mid-‐1980s onwards. In reviewing the data we map attitudes to welfare over the past 70 years and our conclusions raise questions of particular value for people interested in building consent for an effective social security system.
5. The 1940s: the Beveridge Welfare State Histories of UK social policy commonly argue that a wave of popular support underpinned implementation of the wide-‐reaching social policy reforms inspired by the 1942 Beveridge Report. However, few quantitative surveys of public attitudes to welfare were conducted during the 1940s; opinion poll data provide one of the few sources of contemporary data, though the polling industry was in its infancy in this period. A Gallup/ British Institute of Public Opinion (BIPO) Poll conducted two weeks after the publication of the Beveridge Report showed that ‘nineteen people out of twenty had heard of the report, and nine out of ten believed its proposals should be adopted’ and histories of the welfare state often cite this data (Calder, 1969: 528; cf. Jacobs, 1993: 113).
Much less frequently reported is that the same Gallup/BIPO (BIPO, 1942) research concluded that public understanding of the detail of proposals was somewhat limited. It was also clear that some areas were welcomed more strongly than others. Health reforms had the clearest approval, with 88% in favour and just 6% against. Pensions (or ‘better pensions’) were the most commonly cited by respondents as capturing the substance of the Beveridge Report, although many felt the suggested rates were too low (ibid.). A bigger role for the state was not favoured in all policy areas. Some 68% agreed that ‘there is no reason why a childless widow should get a pension for life: if she is able to work, she should work’. However, the overwhelming message from the Gallup/BIPO report was that people were supportive of the Beveridge Report, even amongst those groups who were more likely to feel that they would lose out under the new system. Some 88% of respondents felt that the government should put the plan into operation, just 6% feeling that they should not (ibid.). Gallup/BIPO polling during 1943 lends some support to the view that the Beveridge project was not as high in the concerns of the ordinary voters as sometimes presumed. A September 1943 poll asked ‘What do you think is the most important war problem the Government must solve during the next few months?’, and only 1.95% cited ‘Beveridge; social security; pensions’. A broadly similar proportion mentioned other welfare state issues such as health and housing. War objectives were clearly the top concern, but strikes, fuel shortages and unemployment all ranked higher than Beveridge.
We might naturally expect war objectives to be the dominating concerns in the midst of the Second World War, but polling data from the immediate post-‐War period also suggests a
5
certain degree of ambivalence towards policy issues amongst the public. Klein’s (1974) review of polling data noted that ‘Perhaps the most striking fact about the post-‐1945 period is how few issues really matter to the public […] the dominating concerns are with economic questions’ (Klein, 1974: 408). Our own review of opinion poll data over this period (drawing on Gallup, 1976) confirms Klein’s overall analysis, social policy issues providing the public’s key pressing concern only very briefly when housing problems in the immediate aftermath of the War resulted in it being the top concern in July 1945 (Gallup, 1976) and January 1946 (Klein, 1974: 409). However, some caution needs to be placed over the interpretation of this polling data; it my have captured ‘key concerns’, but these are not the same as citizens’ ‘priorities’, let alone their ‘attitudes’ or values. Moreover, concerns tend not to arise when services are functioning well, so the data may reflect strong satisfaction with the new welfare state (Klein, 1974). Some polling data suggests satisfaction was high. By February 1946 there was 71% approval of the government’s plan for social security according to a Gallup poll, and similar polling data also pointed to the popularity of plans for health care (Gallup, 1976). Indeed, health care seemed to be at the top of the list of items people felt captured the new welfare state provisions; health items were two of the top three most common responses in a July 1948 Gallup poll that asked recipients to name the main benefits from the newly implemented social policy reforms (Gallup, 1976).
It seems likely that at the foundational stage of the ‘welfare state’ public support did not spread equally across all aspects of the Beveridge plan, and that while overall support was high it was neither limitless nor unconditional. Moreover, economic concerns often appear to have been uppermost in most people’s minds.
6. The 1950s: Post-‐War Welfare Beds In Polling became more regular and detailed in the 1950s, giving us a better picture of attitudes to welfare than we have for the 1940s (see Gallup, 1976). Support for extending the emerging welfare state could be found in many of the polls. In both 1951 and 1954 there was a 90% positive response to the question: ‘Do you think that Old Age Pensions’ should be increased or left as they are?’ An April 1953 Gallup poll found 81% wanted to see more spending on pensions (59% if this meant tax rises), 59% on housing (35% if tax rises), 42% on education (26% if tax rises), but just 30% wanted more on health (17% if tax rises) and 23% on family allowances (13% if tax rises). However, this survey also offered the option of ‘less spending’ and the numbers opting for this were quite large: family allowances 43%; health 36%; education 24%; housing 15%; pensions 6%. That said, the same poll found much stronger support for cutting defence spending (51%), a finding echoed in a September 1955 Gallup poll where defence (32%) topped the list should spending cuts be required, while welfare state cuts were selected by few respondents (schools and health both 4%; housing 2%).
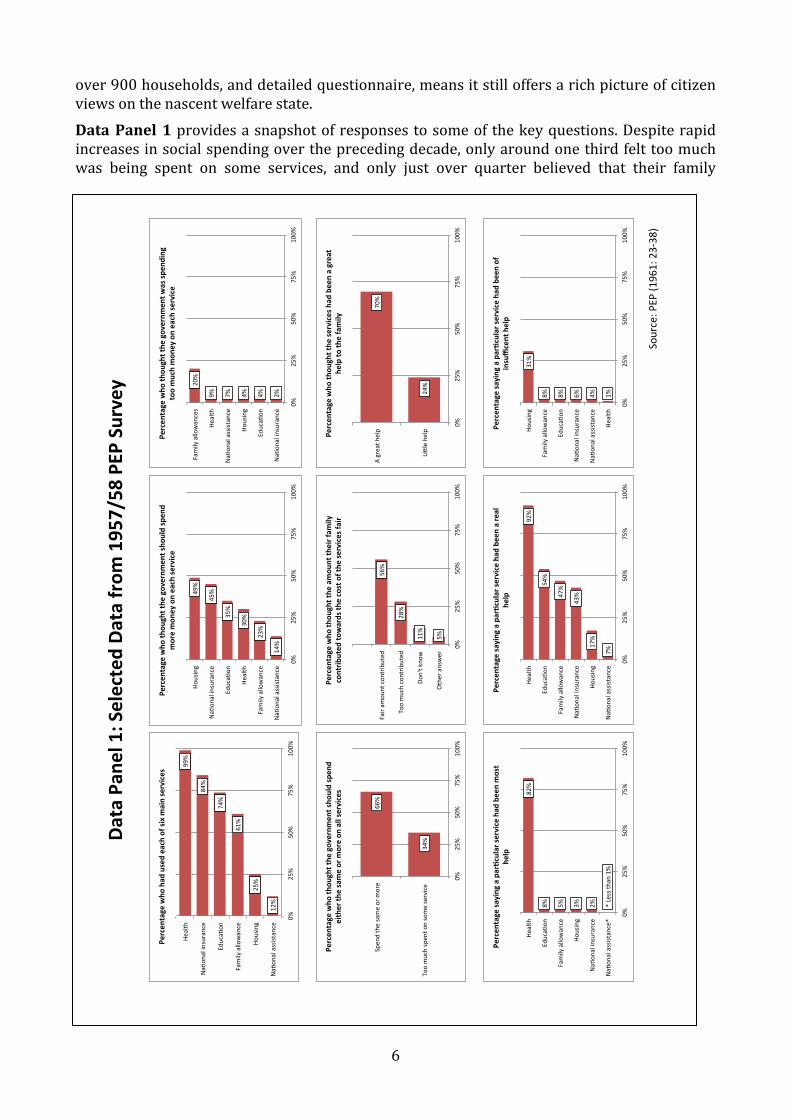
Looking beyond the work of the pollsters, over the course of 1957 and 1958 Political and Economic Planning (PEP) conducted the first detailed social scientific study of public attitudes towards the post-‐war welfare state (PEP, 1961). Their study elicited the views of ‘ordinary families’ on the basis that the welfare state was targeted to all, not merely the most needy. Reflecting the dominant view of the time that ‘ordinary’ equalled nuclear family, the survey only included households containing at least one child aged under 16 (so representing only c. 40% of all households). The survey focused solely on London in the first instance, adding a subsidiary sample of households in Northampton once early analysis underlined that the income levels of the London households were likely to be higher than was the case nationally (PEP, 1961: 14–19). In each case, the target of the interviews was ‘mothers’. The findings are therefore clearly not a representative sample of the UK population, but its large sample of
6
over 900 households, and detailed questionnaire, means it still offers a rich picture of citizen views on the nascent welfare state. Data Panel 1 provides a snapshot of responses to some of the key questions. Despite rapid increases in social spending over the preceding decade, only around one third felt too much was being spent on some services, and only just over quarter believed that their family
12%$
25%$
61%$
74%$
84%$
99%$
0%$
25%$
50%$
75%$
100%
$
Na.
onal$assistance$
Housing$
Family$allowance$
Educa.
on$
Na.
onal$insurance$
Health$
Percen
tage)who
)had
)used)each)of)six)m
ain)services)
34%$
66%$
0%$
25%$
50%$
75%$
100%
$
Too$much$spen
t$on$some$service$$
Spen
d$the$same$or$m
ore$
Percen
tage)who
)thou
ght)the
)governm
ent)sho
uld)spen
d)either)th
e)same)or)m
ore)on
)all)services)
5%#
11%#
28%#
56%#
0%#
25%#
50%#
75%#
100%
#
Other#answer#
Don't#k
now#
Too#much#contrib
uted
#
Fair#am
ount#con
tributed
#
Percen
tage)who
)thou
ght)the
)amou
nt)th
eir)fam
ily)
contrib
uted
)towards)th
e)cost)of)the
)services)fa
ir)
24%$
70%$
0%$
25%$
50%$
75%$
100%
$
Li+le$he
lp$
A$great$h
elp$Percen
tage)who
)thou
ght)the
)services)had
)been)a)great)
help)to
)the)family)
*"Less"th
an"1%"
2%"
3%"
5%"
8%"
82%"
0%"
25%"
50%"
75%"
100%
"
Na3
onal"assistance*"
Na3
onal"insurance"
Housing"
Family"allowance"
Educa3
on"
Health"
Percen
tage)sa
ying)a)par.cular)se
rvice)ha
d)be
en)m
ost)
help)
7%#17%#
43%#
47%#54%#
92%#
0%#
25%#
50%#
75%#
100%
#
Na-
onal#assistance#
Housing#
Na-
onal#insurance#
Family#allowance#
Educa-
on#
Health#
Percen
tage)sa
ying)a)par.cular)se
rvice)ha
d)be
en)a)re
al)
help)
1%#
4%#
6%#
8%#
8%#
31%#
0%#
25%#
50%#
75%#
100%
#
Health#
Na3
onal#assistance#
Na3
onal#insurance#
Educa3
on#
Family#allowance#
Housing#
Percen
tage)sa
ying)a)par.cular)se
rvice)ha
d)be
en)of)
insufficent)help)
Data$Pan
el$1:$Selected$Da
ta$from
$1957/58$PEP
$Survey$
Source:(PEP((1
961:(23138)(
14%$23
%$30%$35%$
45%$
49%$
0%$
25%$
50%$
75%$
100%
$
Na-
onal$assistance$
Family$allowance$
Health$
Educa-
on$
Na-
onal$insurance$
Housing$
Percen
tage)who
)thou
ght)the
)governm
ent)sho
uld)spen
d)more)mon
ey)on)each)se
rvice)
2%#
4%#
4%#
7%#
9%#20
%#
0%#
25%#
50%#
75%#
100%
#
Na,
onal#insurance#
Educa,
on#
Housing#
Na,
onal#assistance#
Health#
Family#allowances#
Percen
tage)who
)thou
ght)the
)governm
ent)w
as)sp
ending)
too)much)mon
ey)on)each)se
rvice)
7
contributed too much to the cost of social services. As in the polling data there seemed to be little dissatisfaction with key social services at this juncture, the exception being housing; a substantial minority (31%) said had been of insufficient help to their family (PEP, 1961: 20). Given that the survey excluded many of the most vulnerable groups, this underlines that public perceptions of the adequacy of housing in the early post-‐war period were not favourable. Indeed, housing topped the list of social services on which respondents felt the government should spend more (49%).
The broad overall degree of contentment with the welfare state was also qualified in some other ways. There were differences in opinion towards universal services/benefits and those that were targeted and, similarly, between contributory and non-‐contributory benefits/services. Despite fewer households making use of the non-‐contributory benefits – or, perhaps, because of this – they were more often picked out as being areas where the government spent too much money: 20% saying this was so for Family Allowances (by far the most common choice), 7% for National Assistance and just 2% for National Insurance.
More generally, the report’s authors were clear in their view that connection with the concept of a ‘welfare state’ was not particularly deep or widespread, and that for many of the respondents ‘the Welfare State was more or less synonymous with health services’ (PEP, 1961: 35). More strongly still, they concluded that ‘The attitude of [respondents] towards the social services was enthusiastic rather than critical, but there is not much doubt that this attitude is governed by their enthusiasm for the health services’ (PEP, 1961: 39).
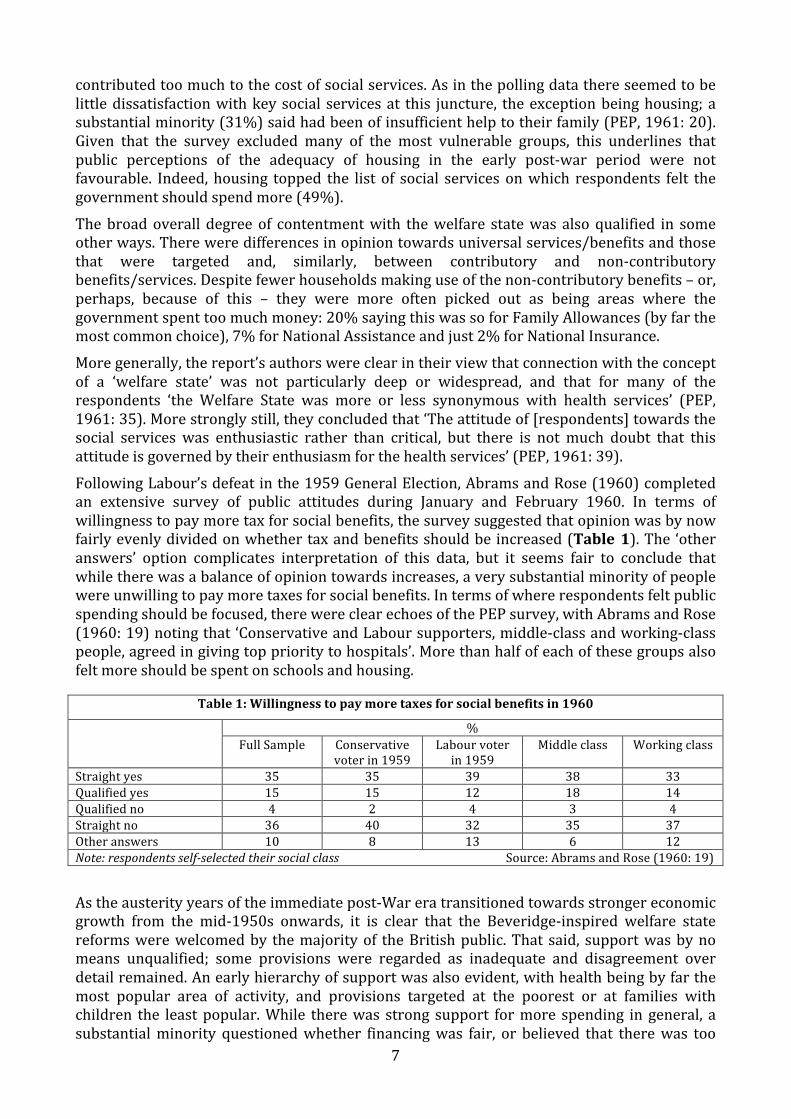
Following Labour’s defeat in the 1959 General Election, Abrams and Rose (1960) completed an extensive survey of public attitudes during January and February 1960. In terms of willingness to pay more tax for social benefits, the survey suggested that opinion was by now fairly evenly divided on whether tax and benefits should be increased (Table 1). The ‘other answers’ option complicates interpretation of this data, but it seems fair to conclude that while there was a balance of opinion towards increases, a very substantial minority of people were unwilling to pay more taxes for social benefits. In terms of where respondents felt public spending should be focused, there were clear echoes of the PEP survey, with Abrams and Rose (1960: 19) noting that ‘Conservative and Labour supporters, middle-‐class and working-‐class people, agreed in giving top priority to hospitals’. More than half of each of these groups also felt more should be spent on schools and housing.
Table 1: Willingness to pay more taxes for social benefits in 1960
% Full Sample Conservative
voter in 1959 Labour voter in 1959
Middle class Working class
Straight yes 35 35 39 38 33 Qualified yes 15 15 12 18 14 Qualified no 4 2 4 3 4 Straight no 36 40 32 35 37 Other answers 10 8 13 6 12 Note: respondents self-‐selected their social class Source: Abrams and Rose (1960: 19)
As the austerity years of the immediate post-‐War era transitioned towards stronger economic growth from the mid-‐1950s onwards, it is clear that the Beveridge-‐inspired welfare state reforms were welcomed by the majority of the British public. That said, support was by no means unqualified; some provisions were regarded as inadequate and disagreement over detail remained. An early hierarchy of support was also evident, with health being by far the most popular area of activity, and provisions targeted at the poorest or at families with children the least popular. While there was strong support for more spending in general, a substantial minority questioned whether financing was fair, or believed that there was too
8
much spending in some areas. Abrams’ 1960 survey underlined that opinion was quite evenly balanced on the question of whether or not more spending was warranted, and that support for additional spending was not unqualified amongst those who favoured more spending.
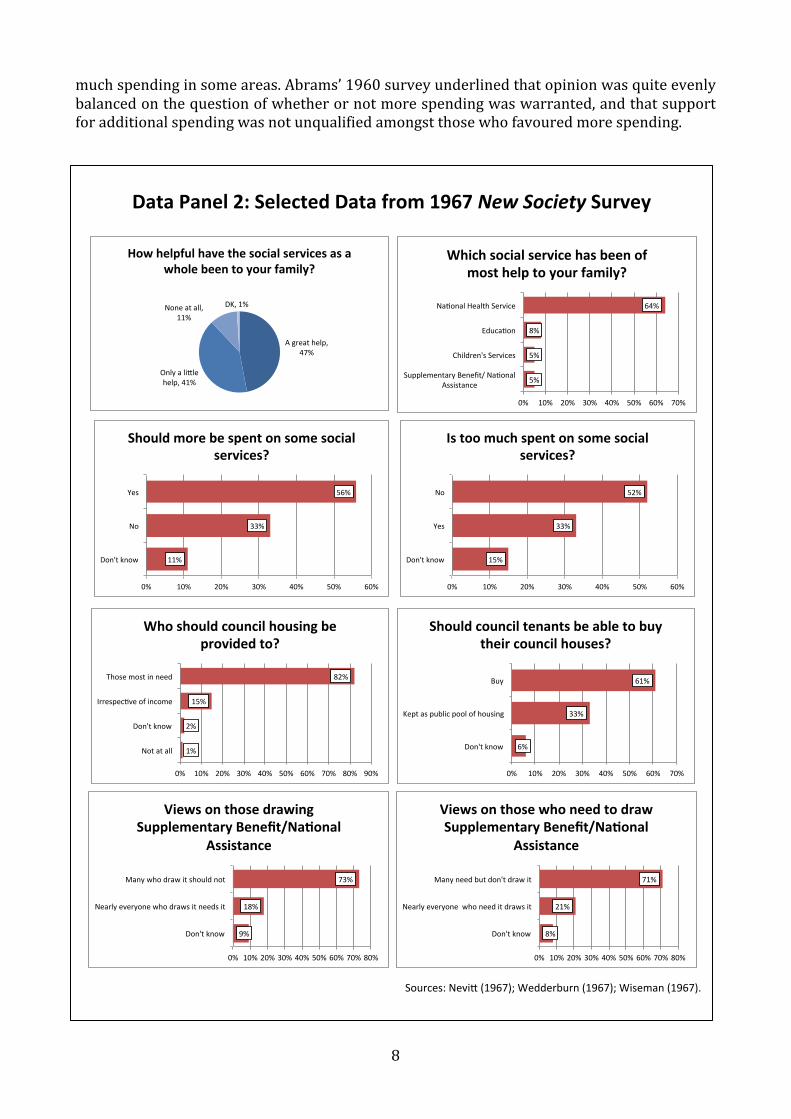
Data$Panel$2:$Selected$Data$from$1967$New$Society$Survey$
Sources:)Nevi-)(1967);)Wedderburn)(1967);)Wiseman)(1967).)
A"great"help,"47%"
Only"a"li3le"help,"41%"
None"at"all,"11%"
DK,"1%"
How$helpful$have$the$social$services$as$a$whole$been$to$your$family?$
$
1%#
2%#
15%#
82%#
0%# 10%# 20%# 30%# 40%# 50%# 60%# 70%# 80%# 90%#
Not#at#all#
Don't#know#
Irrespec=ve#of#income#
Those#most#in#need#
Who$should$council$housing$be$provided$to?$
6%#
33%#
61%#
0%# 10%# 20%# 30%# 40%# 50%# 60%# 70%#
Don't#know#
Kept#as#public#pool#of#housing#
Buy#
Should'council'tenants'be'able'to'buy'their'council'houses?'
5%#
5%#
8%#
64%#
0%# 10%# 20%# 30%# 40%# 50%# 60%# 70%#
Supplementary#Benefit/#Na;onal#Assistance#
Children's#Services#
Educa;on#
Na;onal#Health#Service#
Which%social%service%has%been%of%most%help%to%your%family?%
11%#
33%#
56%#
0%# 10%# 20%# 30%# 40%# 50%# 60%#
Don't#know#
No#
Yes#
Should'more'be'spent'on'some'social'services?'
15%$
33%$
52%$
0%$ 10%$ 20%$ 30%$ 40%$ 50%$ 60%$
Don't$know$
Yes$
No$
Is#too#much#spent#on#some#social#services?#
9%#
18%#
73%#
0%# 10%#20%#30%#40%#50%#60%#70%#80%#
Don't#know#
Nearly#everyone#who#draws#it#needs#it#
Many#who#draw#it#should#not#
Views&on&those&drawing&Supplementary&Benefit/Na9onal&
Assistance&
8%#
21%#
71%#
0%# 10%#20%#30%#40%#50%#60%#70%#80%#
Don't#know#
Nearly#everyone##who#need#it#draws#it#
Many#need#but#don't#draw#it#
Views&on&those&who&need&to&draw&Supplementary&Benefit/Na8onal&
Assistance&

9
7: The 1960s: Post-‐War Welfare Matures
As the post-‐war welfare state was maturing, New Society magazine undertook a detailed survey of attitudes in the summer of 1967 (see Nevitt, 1967; Wedderburn, 1967; Forsyth, 1967; Donnison, 1967; Wiseman, 1967). Matching the scale and ambition of the PEP survey a decade earlier, a sample of c. 1,300 households responded to questions on a wide range of topics that included housing, health, education and social security. Data Panel 2 highlights key findings. While differences in the questions and research design mean we cannot directly compare its findings with those of the PEP survey, common themes can be identified. Attitudes towards future spending seemed balanced a little more towards favouring increased spending (56%) than against (33%). Just one third felt that too much was spent on some social services, remarkably similar to the PEP survey’s findings a decade earlier. However, questions in the New Society and PEP surveys probing personal experience of the welfare state suggest that by 1967 fewer people saw it as having been ‘a great help’ to their family; opinion moving from broad majority seeing it in such terms to a fairly equally split between those viewing it as a great help and those seeing it helping a little/none at all (Data Panel 2). Notably, health was again by far and away the part of the welfare state most commonly cited as being of most help to respondents.
The complexity of attitudes was highlighted by responses to questions on the operation of the Supplementary Benefit/National Assistance safety net. A large majority (73%) agreed there were ‘many people drawing supplementary benefit/national assistance who could really be earning enough to support themselves if they wanted to’, but a similarly large majority (71%) agreed ‘there are many people who need to draw supplementary benefit/national assistance but who are not doing so’. Wedderburn (1967: 516) argued this showed ‘the concept of the “deserving’’ and ‘’undeserving” poor is still very much alive’.
Deserving/undeserving stereotypes could certainly be found in other survey responses; of those who felt too much was being spent on a social service, ‘National Assistance is too easy’ was the most common reason given (17%), while around 10% cited that family allowance ‘wasn’t spent on children’ and a similar proportion saying ‘parents should subsidise their own children’ (Wiseman, 1967). By contrast, ‘OAPs need more money’ was the most common reason given (27%) by those who felt more money needed to be spent (ibid.).
Public concerns over the efficacy of spending could even be seen in relation to health spending. While the NHS was the second most common area of the welfare state to be highlighted as meriting further spending, it was also the service (as opposed to cash benefit) most often flagged as an area for cuts amongst those feeling too much was being spent on some social services. The ‘abuse of free prescriptions’ was a concern for some (Forsyth, 1967). Opinion polling by Gallup (New Society, 1980) also highlights some degree of polarisation over health spending in the 1960s (see Figure 2).
Snippets of data such as these hint at some public concern over the scale of the welfare state during the 1960s. A series of studies conducted by the Institute of Economic Affairs (IEA) in 1963, 1964 and 1966 aimed to explore such concerns (see
0%#
10%#
20%#
30%#
40%#
50%#
60%#
70%#
80%#
1961# 1965# 1975# 1980#!!
Figure!2:!Views!on!NHS!Spending!
Too#Much# Too#Li5le#
Source:#New#Society#(1980)/Gallup#

10
Seldon and Gray, 1967). Although concerns about the robustness of the IEA’s approach means we should be very cautious, a number of key points can be drawn from their work. The first is that it did indeed show that opinion was not quite so firmly behind the welfare consensus as is perhaps commonly presumed, though we must underline that even the IEA’s work was rooted in an attempt to challenge what they described as the ‘assumption that reform away from universal benefits was politically impossible’ (Seldon, 1967: 11). Secondly, the variations between groups/geographic areas identified offer some interesting insights concerning differing degrees of support for the welfare state. For example, in its 1966 survey the IEA found support for universalism (on the basis of IEA’s measures) tended to be stronger: a) in Scotland and the north of England than in the south of England (Seldon, 1967: 21, Table 6); b) amongst those living in council houses compared with those with other forms of tenure (ibid.: 23, Table 7); and c), amongst working class rather than middle and upper class people (ibid.: 17, Table 4). Support also tended to decline from younger to older age groups, with the exception of pensions where the pattern was similar across age groups (ibid.: 19, Table 5).
The government itself commissioned a survey of public attitudes to welfare in the summer of 1968, to feed into the work of the newly established Department of Health and Social Security. However, Treasury concerns meant questioning was mainly restricted to a test of public understanding of current benefits (see: PRO/BN/72/31, PRO/T227/2592 and PRO/T227/3094). The survey’s findings provide some useful, albeit limited, insights (PRO/T227/3094). Questions on the awareness of health and social security financing showed much confusion amongst the public about the operation of the welfare state, be it in terms of principles of finance or benefit and contribution rates. When asked if they would like to pay higher contributions to get a higher pension, around half said they would prefer to stick with current contributions for current benefits and just one-‐third would want to contribute more in order to receive more. Around 65% of respondents said they would be willing to pay more to help specific ‘vulnerable groups’, though variations in terms of which groups they would like to support again reflected common deserving/undeserving stereotypes: ‘old people living alone’ and groups of disabled people were high on the list of those people were willing to pay more to support further, while only a very small minority supported extra spending for ‘men who are homeless because they are alcoholics’, ‘deserted wives’, or ‘men who are homeless because they are ex-‐prisoners’, for example. Even in these early days of the welfare state it seems some aspects of policy were looked upon disapprovingly by many, and that there was at least a substantial minority (if not more) who felt that targeting may be beneficial in some areas. In his review of polling data from the 1940s to 1960s, Klein (1974: 411) argued public opinion ‘tends to be moralistic [… and this] emerges clearly when opinions about pensions and family allowances are compared. With remarkable consistency over the years, there is a very large majority which favours raising pensions and a very large minority which is highly critical of family allowances’. Interestingly, he also reported findings from a private poll carried out by ORC for the Conservative Party in 1968 that showed 89% agreed that ‘Too many people don’t bother to work because they can live well enough on the dole’, and 78% agreed that ‘We have so many Social Services that people work less hard than they used to’. Klein’s (1974: 412) view was this showed there was ‘overwhelming support for a moralistic view of the Welfare State’.
As the 1960s drew to a close, public opinion seemed broadly behind the welfare state, being fairly well disposed to increasing social spending. However, support was not unqualified. It was clear that some areas were more popular than others; the NHS continued to be a very popular aspect, family allowances an unpopular one. Moralistic views on ‘deserving’ and ‘undeserving’ groups also seemed to shape attitudes. Concerns about unwarranted or excessive spending were an issue for a significant minority.

11
8. The 1970s/Early-‐1980s: the End of the Post-‐War Welfare Consensus In the 1970s and early 1980s more frequent polling, the roll-‐out of the British Election Survey, some early cross-‐national European surveys, and some detailed academic studies that focused specifically on welfare, offered a richer picture on attitudes to welfare than was available for previous decades.
Data$Panel$3:$1976$Centre$for$Mass$Communica9on$Study$
Sources:)PRO/BN)82/133;)Golding)&)Middleton,)1982))
Too#li&le,#18.3%#
About#right,#32.1%#
Too#much,#49.6%#
Views&of&Non+welfare&recipients&on&social&security&spending&
Too#li&le,#25.8%#
About#right,#32.3%#
Too#much,#41.9%#
Views&of&welfare&recipients&on&social&security&spending&
66%#
16%#
69%#
80%#
70%#
0%#
10%#
20%#
30%#
40%#
50%#
60%#
70%#
80%#
90%#
The#welfare#state#in#this#country#is#s=ll#something#we#can#be#really#proud#of#
Poor#people#have#only#themselves#to#blame,#so#there's#no#reason#why#society#should#support#them#
Many#people#who#should#get#social#security#in#fact#don't#get#what#they're#en=tled#to#
Nowadays#too#many#people#depend#on#welfare#
There's#so#much#welfare#now#it's#made#the#people#of#this#country#lazy#
Views&on&the&Welfare&State&today&
49.5%&
50.5%&
66.0%&
34.0%&
0%& 10%& 20%& 30%& 40%& 50%& 60%& 70%&
Welfare&benefits&are&too&generous&
Welfare&benefits&are&too&small&
Non=welfare&recipients& Welfare&recipients&
61.1%%
38.9%%
59.5%%
40.5%%
0%% 10%% 20%% 30%% 40%% 50%% 60%% 70%%
If%it%wasn’t%for%social%security%many%people%would%suffer%hardship,%however%hard%they%tried%to%fend%for%themselves%
If%there%wasn't%so%much%social%security%people%would%learn%to%stand%on%their%
own%two%feet%
NonGwelfare%recipients% Welfare%recipients%
55.3%%
44.7%%
61.9%%
38.1%%
0%% 10%% 20%% 30%% 40%% 50%% 60%% 70%%
The%trouble%with%welfare%benefits%is%it's%too%easy%to%get%them%
It's%so%difficult%to%get%welfare%benefits%that%many%people%don't%get%all%they're%
enGtled%to%
NonIwelfare%recipients% Welfare%recipients%
49.6%&
50.4%&
43.5%&
56.5%&
0%& 10%& 20%& 30%& 40%& 50%& 60%&
People&should&only&get&money&from&the&government&if&they've&paid&in&for&it&
in&the&past&
The&government&should&try&to&help&everybody&in&need,®ardless&of&how&
much&they've&paid&&in&in&the&past&
NonFwelfare&recipients& Welfare&recipients&
12
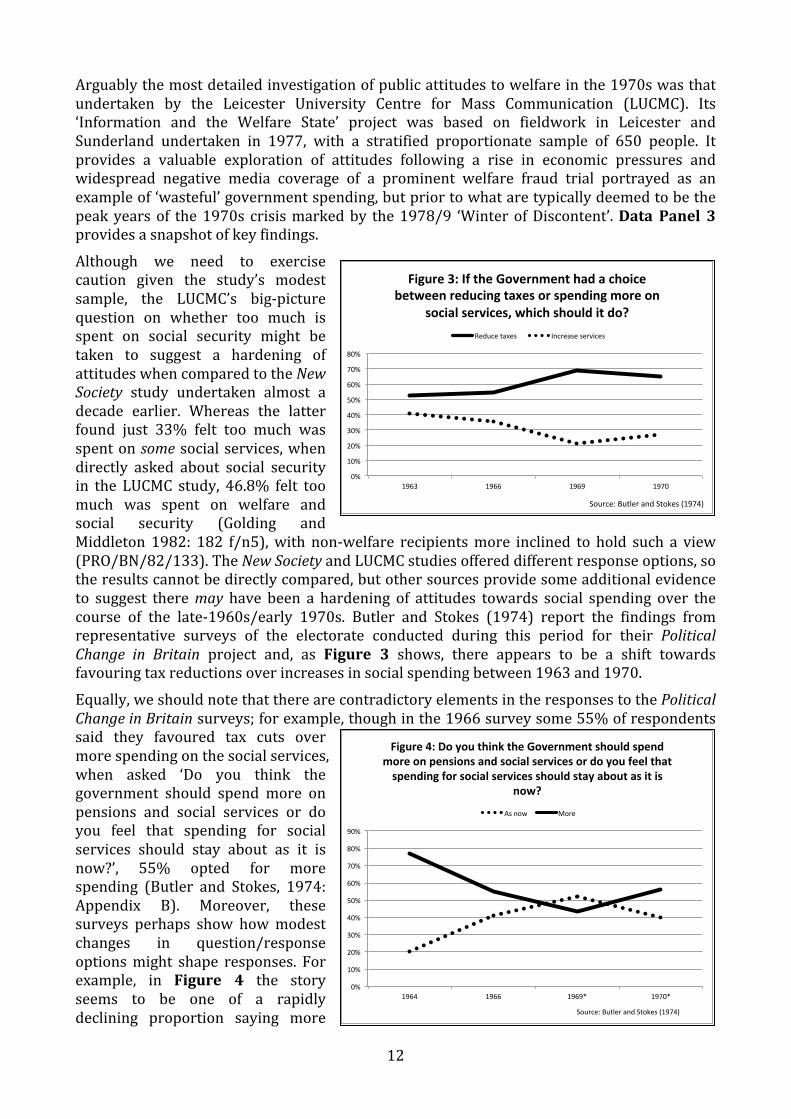
Arguably the most detailed investigation of public attitudes to welfare in the 1970s was that undertaken by the Leicester University Centre for Mass Communication (LUCMC). Its ‘Information and the Welfare State’ project was based on fieldwork in Leicester and Sunderland undertaken in 1977, with a stratified proportionate sample of 650 people. It provides a valuable exploration of attitudes following a rise in economic pressures and widespread negative media coverage of a prominent welfare fraud trial portrayed as an example of ‘wasteful’ government spending, but prior to what are typically deemed to be the peak years of the 1970s crisis marked by the 1978/9 ‘Winter of Discontent’. Data Panel 3 provides a snapshot of key findings.
Although we need to exercise caution given the study’s modest sample, the LUCMC’s big-‐picture question on whether too much is spent on social security might be taken to suggest a hardening of attitudes when compared to the New Society study undertaken almost a decade earlier. Whereas the latter found just 33% felt too much was spent on some social services, when directly asked about social security in the LUCMC study, 46.8% felt too much was spent on welfare and social security (Golding and Middleton 1982: 182 f/n5), with non-‐welfare recipients more inclined to hold such a view (PRO/BN/82/133). The New Society and LUCMC studies offered different response options, so the results cannot be directly compared, but other sources provide some additional evidence to suggest there may have been a hardening of attitudes towards social spending over the course of the late-‐1960s/early 1970s. Butler and Stokes (1974) report the findings from representative surveys of the electorate conducted during this period for their Political Change in Britain project and, as Figure 3 shows, there appears to be a shift towards favouring tax reductions over increases in social spending between 1963 and 1970.
Equally, we should note that there are contradictory elements in the responses to the Political Change in Britain surveys; for example, though in the 1966 survey some 55% of respondents said they favoured tax cuts over more spending on the social services, when asked ‘Do you think the government should spend more on pensions and social services or do you feel that spending for social services should stay about as it is now?’, 55% opted for more spending (Butler and Stokes, 1974: Appendix B). Moreover, these surveys perhaps show how modest changes in question/response options might shape responses. For example, in Figure 4 the story seems to be one of a rapidly declining proportion saying more
0%#
10%#
20%#
30%#
40%#
50%#
60%#
70%#
80%#
1963# 1966# 1969# 1970#!!!
Figure!3:!If!the!Government!had!a!choice!between!reducing!taxes!or!spending!more!on!
social!services,!which!should!it!do?!Reduce#taxes# Increase#services#
Source:#Butler#and#Stokes#(1974)#
0%#
10%#
20%#
30%#
40%#
50%#
60%#
70%#
80%#
90%#
1964# 1966# 1969*# 1970*#
Source:#Butler#and#Stokes#(1974)#
Figure'4:'Do'you'think'the'Government'should'spend'more'on'pensions'and'social'services'or'do'you'feel'that'spending'for'social'services'should'stay'about'as'it'is'
now?''
As#now# More#

13
should be spent on the social services but with a recovery of support in 1970; in fact, in the latter survey respondents could choose ‘more spending’ or ‘more on pensions’ (the figures are combined by Butler and Stokes in the way presented here), and it seems inclusion of the latter explains at least some of the upward shift. These caveats aside, the LUCMC data and Political Change in Britain surveys do seem to suggest a decline in willingness to pay for expanding social services over this period.
The LUCMC survey also seemed to reflect the New Society study in detecting a strong degree of scepticism amongst the public over the efficacy of parts of the welfare state (Data Panel 3). While a large majority of respondents agreed that ‘the welfare state in this country is still something we can be really proud of’, around 70% agreed there is ‘so much welfare now it’s made the people of this country lazy’ and around 80% believed that ‘nowadays too many people depend on welfare’. More detailed probing of views showed, in broad terms, a relatively even division between those choosing ‘pro’ and ‘anti’ welfare state positions. Golding and Middleton (1982: 165) concluded their data showed that ‘Generally it seems there is considerable suspicion of additional public expenditure on social security and welfare among groups who feel they have more to lose as tax-‐payers than gain as beneficiaries’. They also felt they could detect some signs of cracks in social solidarity, as economic insecurity and sometimes stigmatising experiences of welfare combined to create a situation where many of those with the lowest incomes found ‘their fears and resentments readily channelled into a bitter and divisive contempt for those alongside them at the bottom of the economic ladder’ (ibid.: 181). Viewed together, this is a rather mixed picture, not just in terms of whether attitudes hardened but also in terms of the principles endorsed in surveys. However, it seems fair to suggest the ‘moralistic’ element Klein (1974) flagged can also be seen in this batch of data. On a related note, an EEC (1977: Table 28) survey on public perceptions of poverty carried out in May/June 1976 suggested attitudes were rooted in behavioural – as opposed to structural – explanations of poverty much more in the UK than elsewhere; the UK was the only of nine European countries covered in the report where the nation’s respondents ranked ‘laziness’ as the top cause of poverty (some 45% of respondents choosing this from a list of nine options) and the UK had by far the highest proportion of people (20% compared with an average of 7% across all countries) saying ‘the authorities do too much’ by way of contribution to combatting poverty (EEC, 1977: Table 32).
A further source of data that comes on stream in the 1970s is the British Election Study, which followed on from Butler and Stokes’ Political Change in Britain project from 1974 onwards. It provides us with some further clues on some key issues. In particular it seems to suggest support for cutting the welfare state increased between the 1974 and 1979 General Elections. As Figure 5 shows, while a clear majority felt social services should be expanded or stay as they were rather than being cut in 1974 (64% v 32%), by 1979 this was no longer the case, with the two camps fairly evenly sized but with more favouring cuts. Figure 6 shows a similar shift over this period on the question of whether welfare benefits have ‘gone too far’, moving from a position in 1974 where only one-‐third felt the system had gone
11%#
20%#
20%#
30%#
33%#
26%#
31%#
20%#
0%# 5%# 10%# 15%# 20%# 25%# 30%# 35%#
1974#(Feb)#
1979#
Source:(Bri+sh(Elec+on(Study(
Figure(5:(Now(we(would(like(to(ask(what(you(think(about(social(services(and(benefits.(Which(of(these(statements(do(you(feel(comes(closest(to(your(own(
views?((More#are#needed# Stay#as#they#are# Cut#back#a#bit# Cut#back#a#lot#
14
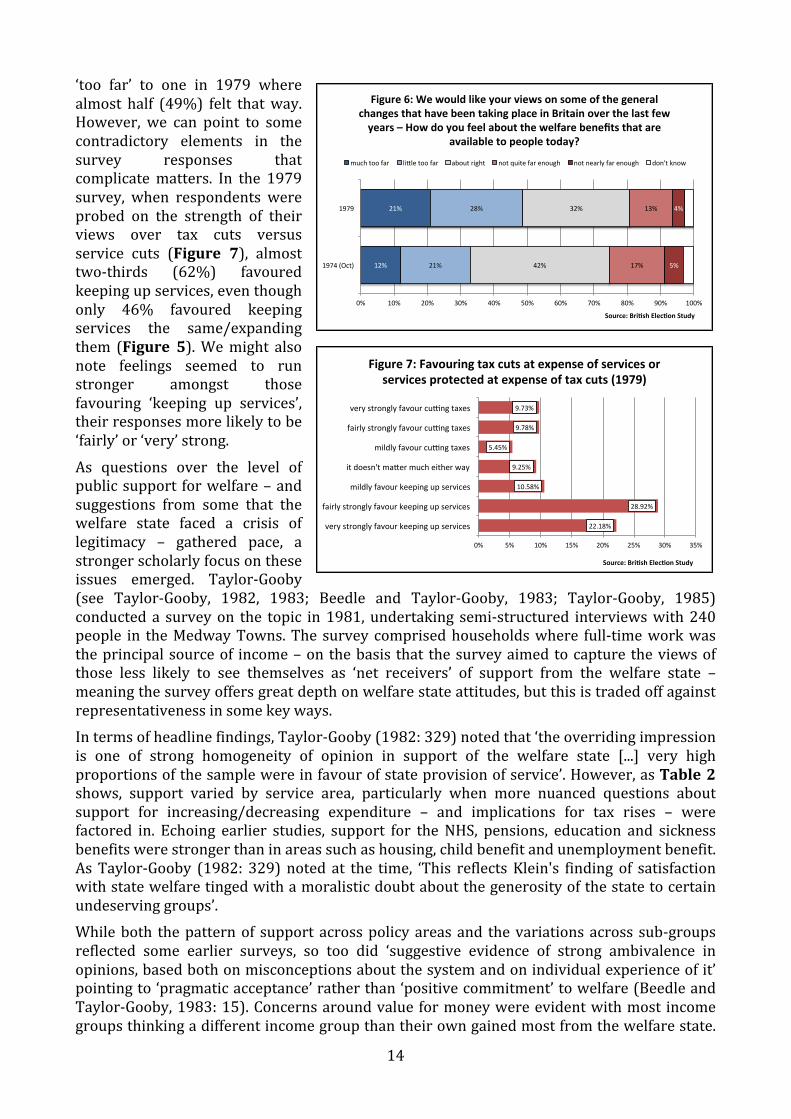
‘too far’ to one in 1979 where almost half (49%) felt that way. However, we can point to some contradictory elements in the survey responses that complicate matters. In the 1979 survey, when respondents were probed on the strength of their views over tax cuts versus service cuts (Figure 7), almost two-‐thirds (62%) favoured keeping up services, even though only 46% favoured keeping services the same/expanding them (Figure 5). We might also note feelings seemed to run stronger amongst those favouring ‘keeping up services’, their responses more likely to be ‘fairly’ or ‘very’ strong.
As questions over the level of public support for welfare – and suggestions from some that the welfare state faced a crisis of legitimacy – gathered pace, a stronger scholarly focus on these issues emerged. Taylor-‐Gooby (see Taylor-‐Gooby, 1982, 1983; Beedle and Taylor-‐Gooby, 1983; Taylor-‐Gooby, 1985) conducted a survey on the topic in 1981, undertaking semi-‐structured interviews with 240 people in the Medway Towns. The survey comprised households where full-‐time work was the principal source of income – on the basis that the survey aimed to capture the views of those less likely to see themselves as ‘net receivers’ of support from the welfare state – meaning the survey offers great depth on welfare state attitudes, but this is traded off against representativeness in some key ways. In terms of headline findings, Taylor-‐Gooby (1982: 329) noted that ‘the overriding impression is one of strong homogeneity of opinion in support of the welfare state [...] very high proportions of the sample were in favour of state provision of service’. However, as Table 2 shows, support varied by service area, particularly when more nuanced questions about support for increasing/decreasing expenditure – and implications for tax rises – were factored in. Echoing earlier studies, support for the NHS, pensions, education and sickness benefits were stronger than in areas such as housing, child benefit and unemployment benefit. As Taylor-‐Gooby (1982: 329) noted at the time, ‘This reflects Klein's finding of satisfaction with state welfare tinged with a moralistic doubt about the generosity of the state to certain undeserving groups’. While both the pattern of support across policy areas and the variations across sub-‐groups reflected some earlier surveys, so too did ‘suggestive evidence of strong ambivalence in opinions, based both on misconceptions about the system and on individual experience of it’ pointing to ‘pragmatic acceptance’ rather than ‘positive commitment’ to welfare (Beedle and Taylor-‐Gooby, 1983: 15). Concerns around value for money were evident with most income groups thinking a different income group than their own gained most from the welfare state.
22.18%&
28.92%&
10.58%&
9.25%&
5.45%&
9.78%&
9.73%&
0%& 5%& 10%& 15%& 20%& 25%& 30%& 35%&
very&strongly&favour&keeping&up&services&
fairly&strongly&favour&keeping&up&services&
mildly&favour&keeping&up&services&
it&doesn't&maAer&much&either&way&
mildly&favour&cuDng&taxes&
fairly&strongly&favour&cuDng&taxes&
very&strongly&favour&cuDng&taxes&
Source:(Bri+sh(Elec+on(Study(
Figure(7:(Favouring(tax(cuts(at(expense(of(services(or(services(protected(at(expense(of(tax(cuts((1979)(
12%$
21%$
21%$
28%$
42%$
32%$
17%$
13%$
5%$
4%$
0%$ 10%$ 20%$ 30%$ 40%$ 50%$ 60%$ 70%$ 80%$ 90%$ 100%$
1974$(Oct)$
1979$
Source:(Bri+sh(Elec+on(Study(
Figure(6:(We(would(like(your(views(on(some(of(the(general(changes(that(have(been(taking(place(in(Britain(over(the(last(few(years(–(How(do(you(feel(about(the(welfare(benefits(that(are(
available(to(people(today?((
much$too$far$ li;le$too$far$ about$right$ not$quite$far$enough$ not$nearly$far$enough$ don't$know$
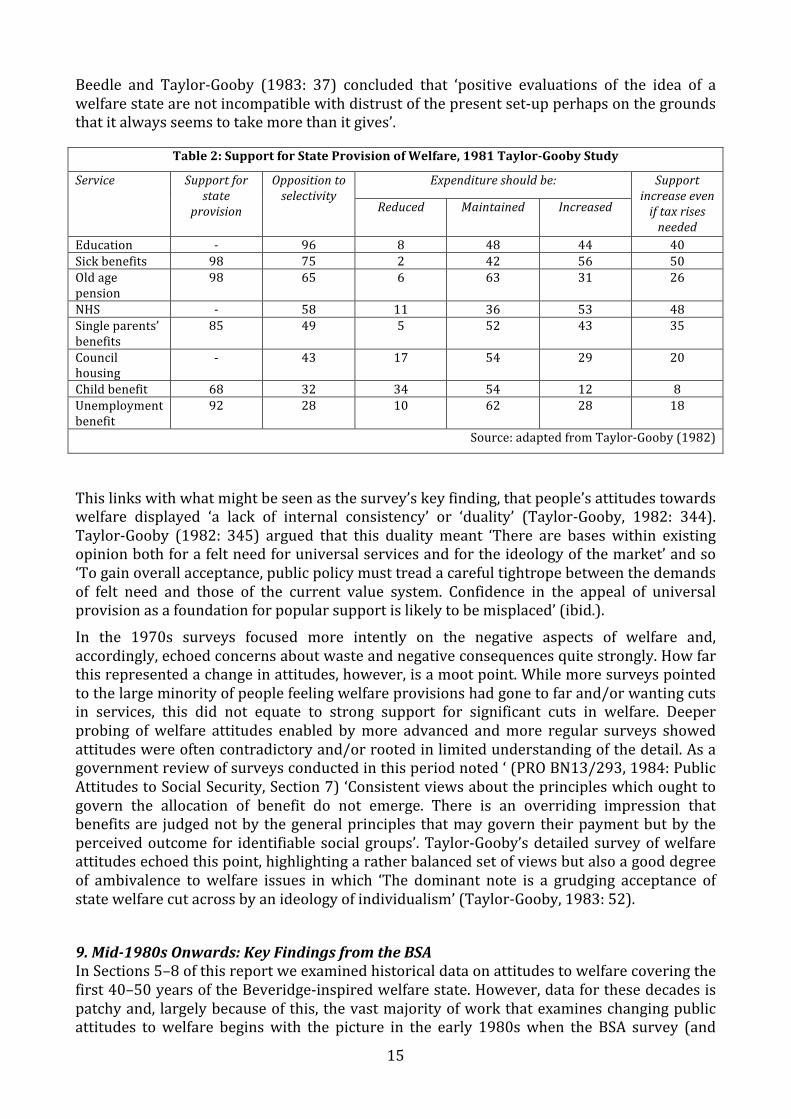
15
Beedle and Taylor-‐Gooby (1983: 37) concluded that ‘positive evaluations of the idea of a welfare state are not incompatible with distrust of the present set-‐up perhaps on the grounds that it always seems to take more than it gives’.
Table 2: Support for State Provision of Welfare, 1981 Taylor-‐Gooby Study
Service Support for state
provision
Opposition to selectivity
Expenditure should be: Support increase even if tax rises needed
Reduced Maintained Increased
Education -‐ 96 8 48 44 40 Sick benefits 98 75 2 42 56 50 Old age pension
98 65 6 63 31 26
NHS -‐ 58 11 36 53 48 Single parents’ benefits
85 49 5 52 43 35
Council housing
-‐ 43 17 54 29 20
Child benefit 68 32 34 54 12 8 Unemployment benefit
92 28 10 62 28 18
Source: adapted from Taylor-‐Gooby (1982)
This links with what might be seen as the survey’s key finding, that people’s attitudes towards welfare displayed ‘a lack of internal consistency’ or ‘duality’ (Taylor-‐Gooby, 1982: 344). Taylor-‐Gooby (1982: 345) argued that this duality meant ‘There are bases within existing opinion both for a felt need for universal services and for the ideology of the market’ and so ‘To gain overall acceptance, public policy must tread a careful tightrope between the demands of felt need and those of the current value system. Confidence in the appeal of universal provision as a foundation for popular support is likely to be misplaced’ (ibid.).
In the 1970s surveys focused more intently on the negative aspects of welfare and, accordingly, echoed concerns about waste and negative consequences quite strongly. How far this represented a change in attitudes, however, is a moot point. While more surveys pointed to the large minority of people feeling welfare provisions had gone to far and/or wanting cuts in services, this did not equate to strong support for significant cuts in welfare. Deeper probing of welfare attitudes enabled by more advanced and more regular surveys showed attitudes were often contradictory and/or rooted in limited understanding of the detail. As a government review of surveys conducted in this period noted ‘ (PRO BN13/293, 1984: Public Attitudes to Social Security, Section 7) ‘Consistent views about the principles which ought to govern the allocation of benefit do not emerge. There is an overriding impression that benefits are judged not by the general principles that may govern their payment but by the perceived outcome for identifiable social groups’. Taylor-‐Gooby’s detailed survey of welfare attitudes echoed this point, highlighting a rather balanced set of views but also a good degree of ambivalence to welfare issues in which ‘The dominant note is a grudging acceptance of state welfare cut across by an ideology of individualism’ (Taylor-‐Gooby, 1983: 52).
9. Mid-‐1980s Onwards: Key Findings from the BSA In Sections 5–8 of this report we examined historical data on attitudes to welfare covering the first 40–50 years of the Beveridge-‐inspired welfare state. However, data for these decades is patchy and, largely because of this, the vast majority of work that examines changing public attitudes to welfare begins with the picture in the early 1980s when the BSA survey (and
16
related studies) began. As we noted earlier, this means the most commonly held positions about the evolution of attitudes to welfare are rooted in interpretations of the data. In this section we provide a brief overview of key messages that emerge from analysis of the BSA data before trying to piece together the data and key data extracted from earlier surveys. When looking beyond headline figures shown in Figure 1, a complex pattern of attitudes towards the welfare state emerges from the BSA data.
Detailed analysis of the BSA data undertaken by Clery et al. (2013a, 2013b) showed there has been relatively little appetite for measures that are overtly hostile to the welfare state; support for reducing taxes and spending less on health, education and social benefits has ranged between 3% to 9% in BSA surveys during this period. Indeed, in 2011 51% of BSA respondents agreed that ‘the creation of the welfare state is one of Britain’s proudest achievements’ compared with just 15% disagreeing with this statement (ibid.), suggesting there is clear public support for the welfare state during this period. Rather than a decline in support for the welfare state per se, it may be that views about which areas of policy should be supported have shifted over time. Again the BSA might help here; it includes a question that asks about ‘First/second priority for extra government spending’, and responses to this question consistently place health and education as being most important during 1983–2011 (ibid.). In 2011, health (68%) and education (60%) were the first and second priorities; for health this represented only a slight fall since the question was first asked in 1983. For social security, support was never high and has fallen further, from 12% to 5% during the period. There is the difficulty of how to interpret these figures – a decline in support for one area as a first/second priority may be partially explained by the increasing priority placed on other areas rather than an absolute drop in support. Moreover, for social security the picture is complicated further by the fact that the views with respect to different types of benefit may differ widely.
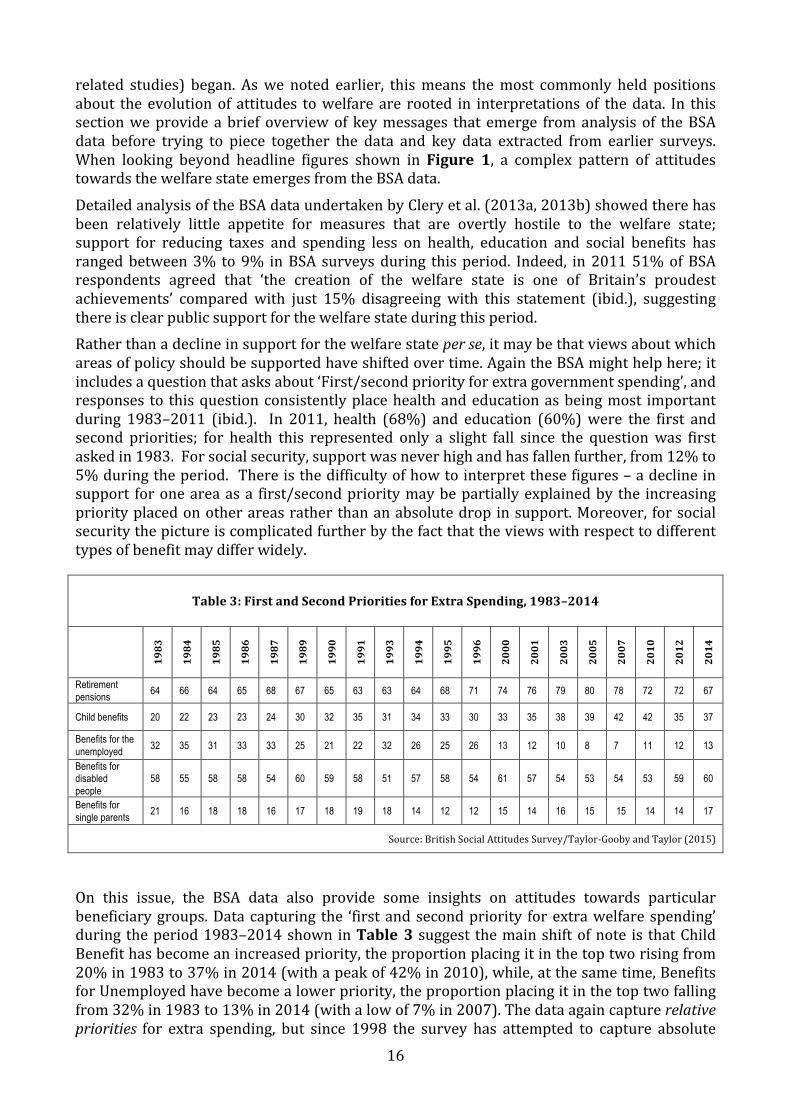
Table 3: First and Second Priorities for Extra Spending, 1983–2014
1983
1984
1985
1986
1987
1989
1990
1991
1993
1994
1995
1996
2000
2001
2003
2005
2007
2010
2012
2014
Retirement pensions 64 66 64 65 68 67 65 63 63 64 68 71 74 76 79 80 78 72 72 67
Child benefits 20 22 23 23 24 30 32 35 31 34 33 30 33 35 38 39 42 42 35 37
Benefits for the unemployed 32 35 31 33 33 25 21 22 32 26 25 26 13 12 10 8 7 11 12 13
Benefits for disabled people
58 55 58 58 54 60 59 58 51 57 58 54 61 57 54 53 54 53 59 60
Benefits for single parents 21 16 18 18 16 17 18 19 18 14 12 12 15 14 16 15 15 14 14 17
Source: British Social Attitudes Survey/Taylor-‐Gooby and Taylor (2015)
On this issue, the BSA data also provide some insights on attitudes towards particular beneficiary groups. Data capturing the ‘first and second priority for extra welfare spending’ during the period 1983–2014 shown in Table 3 suggest the main shift of note is that Child Benefit has become an increased priority, the proportion placing it in the top two rising from 20% in 1983 to 37% in 2014 (with a peak of 42% in 2010), while, at the same time, Benefits for Unemployed have become a lower priority, the proportion placing it in the top two falling from 32% in 1983 to 13% in 2014 (with a low of 7% in 2007). The data again capture relative priorities for extra spending, but since 1998 the survey has attempted to capture absolute
17
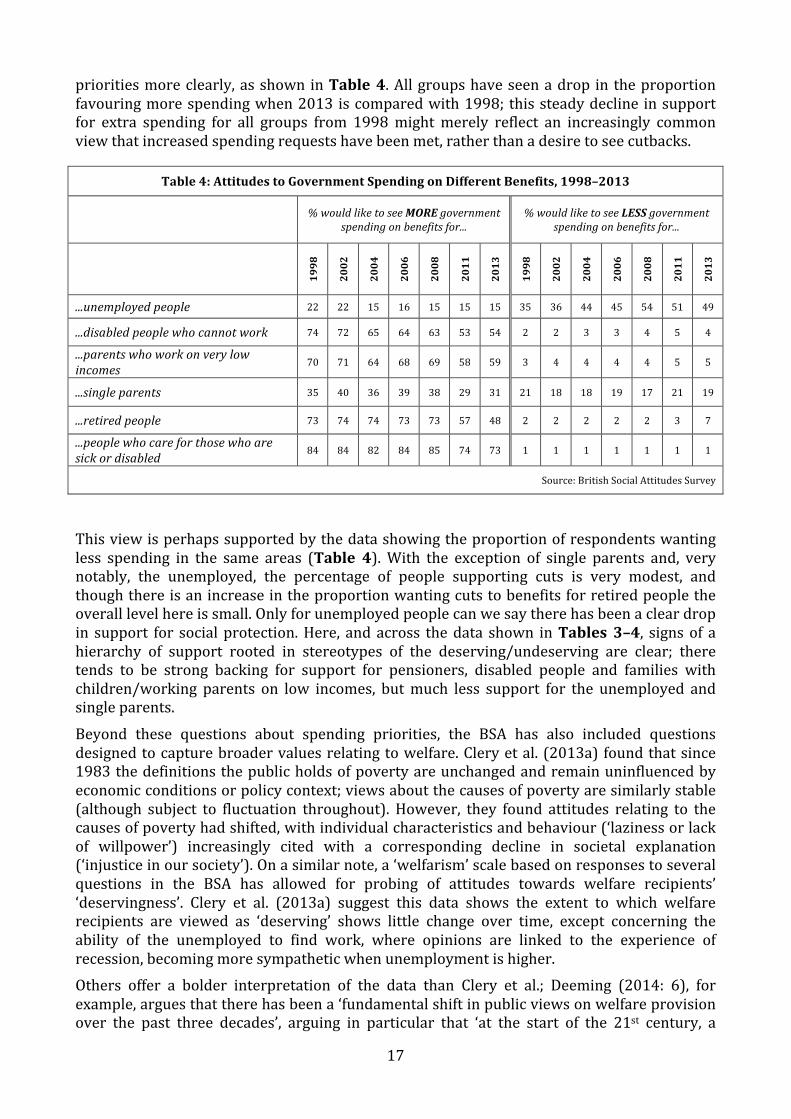
priorities more clearly, as shown in Table 4. All groups have seen a drop in the proportion favouring more spending when 2013 is compared with 1998; this steady decline in support for extra spending for all groups from 1998 might merely reflect an increasingly common view that increased spending requests have been met, rather than a desire to see cutbacks.
Table 4: Attitudes to Government Spending on Different Benefits, 1998–2013
% would like to see MORE government spending on benefits for...
% would like to see LESS government spending on benefits for...
1998
2002
2004
2006
2008
2011
2013
1998
2002
2004
2006
2008
2011
2013
...unemployed people 22 22 15 16 15 15 15 35 36 44 45 54 51 49
...disabled people who cannot work 74 72 65 64 63 53 54 2 2 3 3 4 5 4
...parents who work on very low incomes 70 71 64 68 69 58 59 3 4 4 4 4 5 5
...single parents 35 40 36 39 38 29 31 21 18 18 19 17 21 19
...retired people 73 74 74 73 73 57 48 2 2 2 2 2 3 7
...people who care for those who are sick or disabled 84 84 82 84 85 74 73 1 1 1 1 1 1 1
Source: British Social Attitudes Survey
This view is perhaps supported by the data showing the proportion of respondents wanting less spending in the same areas (Table 4). With the exception of single parents and, very notably, the unemployed, the percentage of people supporting cuts is very modest, and though there is an increase in the proportion wanting cuts to benefits for retired people the overall level here is small. Only for unemployed people can we say there has been a clear drop in support for social protection. Here, and across the data shown in Tables 3–4, signs of a hierarchy of support rooted in stereotypes of the deserving/undeserving are clear; there tends to be strong backing for support for pensioners, disabled people and families with children/working parents on low incomes, but much less support for the unemployed and single parents.
Beyond these questions about spending priorities, the BSA has also included questions designed to capture broader values relating to welfare. Clery et al. (2013a) found that since 1983 the definitions the public holds of poverty are unchanged and remain uninfluenced by economic conditions or policy context; views about the causes of poverty are similarly stable (although subject to fluctuation throughout). However, they found attitudes relating to the causes of poverty had shifted, with individual characteristics and behaviour (‘laziness or lack of willpower’) increasingly cited with a corresponding decline in societal explanation (‘injustice in our society’). On a similar note, a ‘welfarism’ scale based on responses to several questions in the BSA has allowed for probing of attitudes towards welfare recipients’ ‘deservingness’. Clery et al. (2013a) suggest this data shows the extent to which welfare recipients are viewed as ‘deserving’ shows little change over time, except concerning the ability of the unemployed to find work, where opinions are linked to the experience of recession, becoming more sympathetic when unemployment is higher. Others offer a bolder interpretation of the data than Clery et al.; Deeming (2014: 6), for example, argues that there has been a ‘fundamental shift in public views on welfare provision over the past three decades’, arguing in particular that ‘at the start of the 21st century, a
18
distinct attitudinal shift begins to emerge’. He highlights data showing that relatively few see benefits as inadequate and that a clear majority believe that out-‐of-‐work benefits promote a ‘dependency culture’. Disagreements over what the BSA data suggest underline the challenge we face in interpreting attitudes data. Baumberg (2014b) notes complexity is inherent as we wrestle with the implications of survey responses, arguing ‘Benefit attitudes are not simply “hard or “soft” but complex and uneven’.
10. Drawing the Evidence Together: Key Themes Some important themes have emerged from placing the BSA data into a longer context.
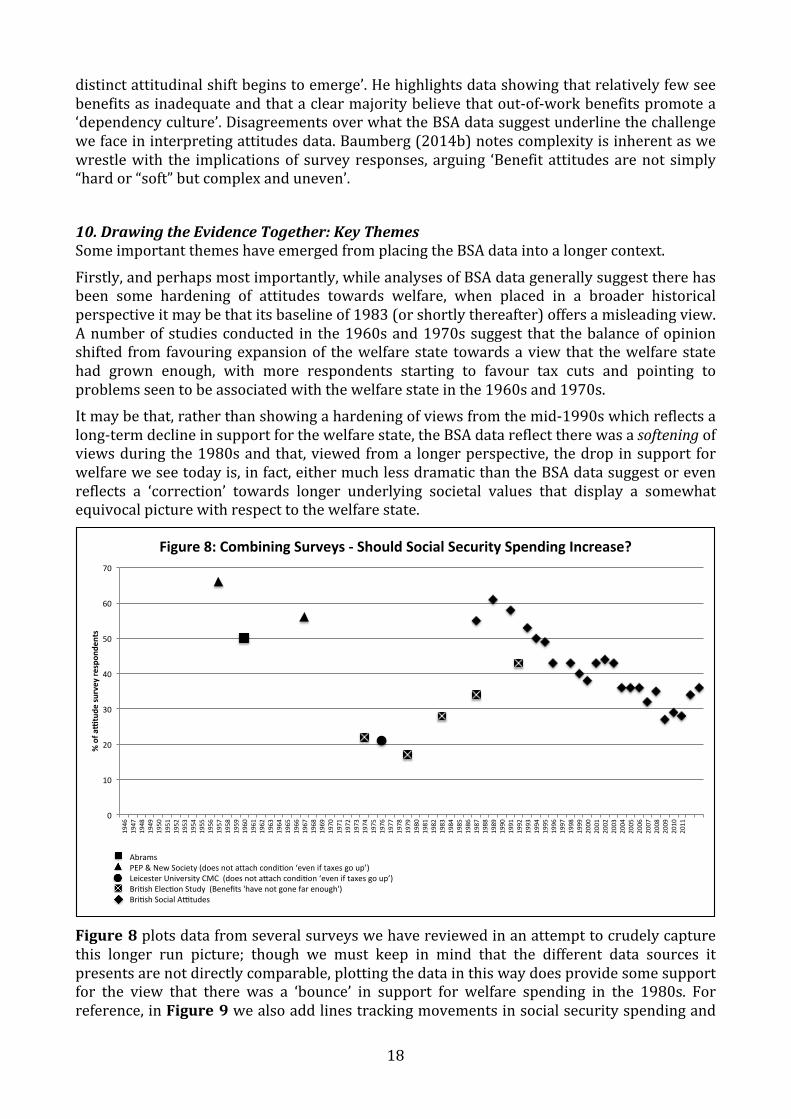
Firstly, and perhaps most importantly, while analyses of BSA data generally suggest there has been some hardening of attitudes towards welfare, when placed in a broader historical perspective it may be that its baseline of 1983 (or shortly thereafter) offers a misleading view. A number of studies conducted in the 1960s and 1970s suggest that the balance of opinion shifted from favouring expansion of the welfare state towards a view that the welfare state had grown enough, with more respondents starting to favour tax cuts and pointing to problems seen to be associated with the welfare state in the 1960s and 1970s. It may be that, rather than showing a hardening of views from the mid-‐1990s which reflects a long-‐term decline in support for the welfare state, the BSA data reflect there was a softening of views during the 1980s and that, viewed from a longer perspective, the drop in support for welfare we see today is, in fact, either much less dramatic than the BSA data suggest or even reflects a ‘correction’ towards longer underlying societal values that display a somewhat equivocal picture with respect to the welfare state.
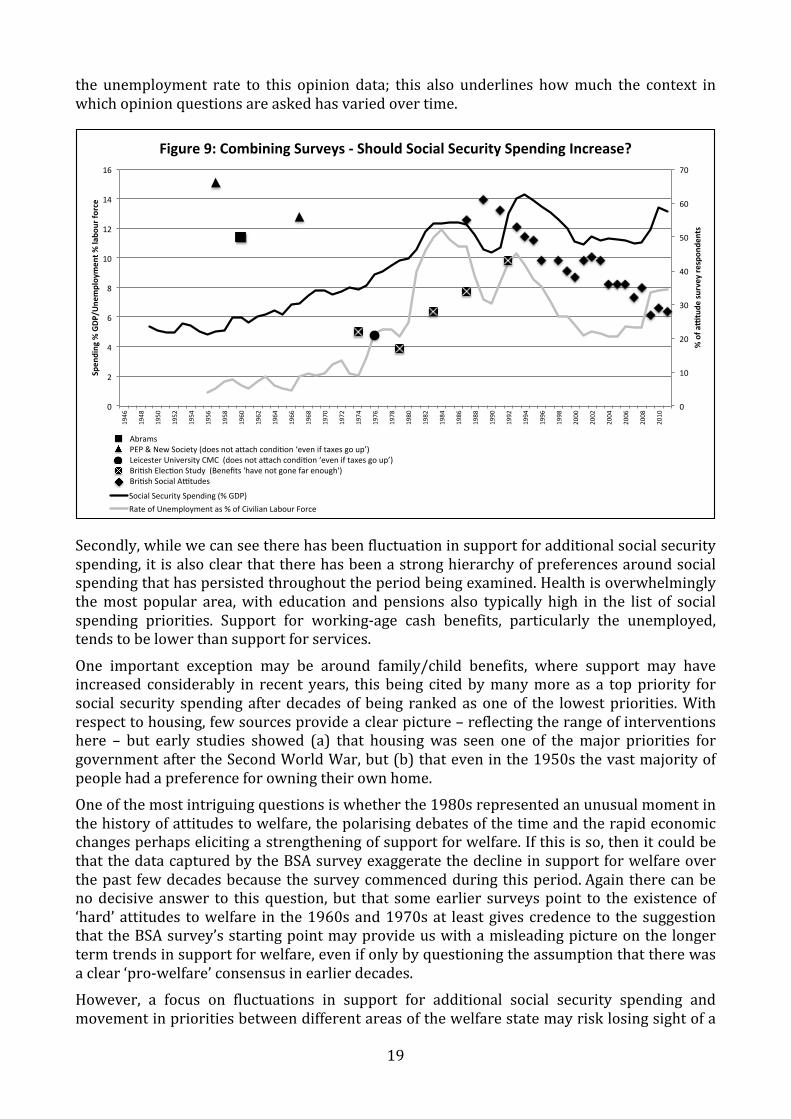
Figure 8 plots data from several surveys we have reviewed in an attempt to crudely capture this longer run picture; though we must keep in mind that the different data sources it presents are not directly comparable, plotting the data in this way does provide some support for the view that there was a ‘bounce’ in support for welfare spending in the 1980s. For reference, in Figure 9 we also add lines tracking movements in social security spending and
0"
10"
20"
30"
40"
50"
60"
70"
1946
"19
47"
1948
"19
49"
1950
"19
51"
1952
"19
53"
1954
"19
55"
1956
"19
57"
1958
"19
59"
1960
"19
61"
1962
"19
63"
1964
"19
65"
1966
"19
67"
1968
"19
69"
1970
"19
71"
1972
"19
73"
1974
"19
75"
1976
"19
77"
1978
"19
79"
1980
"19
81"
1982
"19
83"
1984
"19
85"
1986
"19
87"
1988
"19
89"
1990
"19
91"
1992
"19
93"
1994
"19
95"
1996
"19
97"
1998
"19
99"
2000
"20
01"
2002
"20
03"
2004
"20
05"
2006
"20
07"
2008
"20
09"
2010
"20
11"
%"of"a
&tude
"survey"re
spon
dents"
Abrams""PEP"&"New"Society"(does"not"aAach"condiCon"‘even"if"taxes"go"up’)"Leicester"University"CMC""(does"not"aAach"condiCon"‘even"if"taxes"go"up’)"BriCsh"ElecCon"Study""(Benefits"'have"not"gone"far"enough')"BriCsh"Social"AUtudes""
Figure"8:"Combining"Surveys":"Should"Social"Security"Spending"Increase?"
19
the unemployment rate to this opinion data; this also underlines how much the context in which opinion questions are asked has varied over time.
Secondly, while we can see there has been fluctuation in support for additional social security spending, it is also clear that there has been a strong hierarchy of preferences around social spending that has persisted throughout the period being examined. Health is overwhelmingly the most popular area, with education and pensions also typically high in the list of social spending priorities. Support for working-‐age cash benefits, particularly the unemployed, tends to be lower than support for services.
One important exception may be around family/child benefits, where support may have increased considerably in recent years, this being cited by many more as a top priority for social security spending after decades of being ranked as one of the lowest priorities. With respect to housing, few sources provide a clear picture – reflecting the range of interventions here – but early studies showed (a) that housing was seen one of the major priorities for government after the Second World War, but (b) that even in the 1950s the vast majority of people had a preference for owning their own home. One of the most intriguing questions is whether the 1980s represented an unusual moment in the history of attitudes to welfare, the polarising debates of the time and the rapid economic changes perhaps eliciting a strengthening of support for welfare. If this is so, then it could be that the data captured by the BSA survey exaggerate the decline in support for welfare over the past few decades because the survey commenced during this period. Again there can be no decisive answer to this question, but that some earlier surveys point to the existence of ‘hard’ attitudes to welfare in the 1960s and 1970s at least gives credence to the suggestion that the BSA survey’s starting point may provide us with a misleading picture on the longer term trends in support for welfare, even if only by questioning the assumption that there was a clear ‘pro-‐welfare’ consensus in earlier decades. However, a focus on fluctuations in support for additional social security spending and movement in priorities between different areas of the welfare state may risk losing sight of a
0"
10"
20"
30"
40"
50"
60"
70"
0"
2"
4"
6"
8"
10"
12"
14"
16"
1946
"
1948
"
1950
"
1952
"
1954
"
1956
"
1958
"
1960
"
1962
"
1964
"
1966
"
1968
"
1970
"
1972
"
1974
"
1976
"
1978
"
1980
"
1982
"
1984
"
1986
"
1988
"
1990
"
1992
"
1994
"
1996
"
1998
"
2000
"
2002
"
2004
"
2006
"
2008
"
2010
"
%"of"a
&tude
"survey"re
spon
dents"
Spen
ding"%"GDP
/Une
mploymen
t"%"labo
ur"fo
rce"
Abrams""PEP"&"New"Society"(does"not"aAach"condiCon"‘even"if"taxes"go"up’)"Leicester"University"CMC""(does"not"aAach"condiCon"‘even"if"taxes"go"up’)"BriCsh"ElecCon"Study""(Benefits"'have"not"gone"far"enough')"BriCsh"Social"AUtudes""
Figure"9:"Combining"Surveys"A"Should"Social"Security"Spending"Increase?"
Social"Security"Spending"(%"GDP)"Rate"of"Unemployment"as"%"of"Civilian"Labour"Force"
20
still bigger picture underscored by some studies and much polling data, which is that (a) the welfare state is rarely a matter at the top of the agenda for the public, (b) that over time attitudes have been fairly balanced in terms of support for/against more spending/tax/services, and (c) most of the public have a rather hazy knowledge of the details of policy. It does not seem to be the case, from the data we have uncovered, that public opinion was strongly and enthusiastically behind the ‘welfare state’ but, equally, the converse is also true; the public have not been strongly and enthusiastically behind attempts to cut the welfare state either. The phrase ‘pragmatic acceptance’ was used by one theorist in the 1980s to capture attitudes towards the welfare state, and this perhaps captures the picture since the Beveridge reforms well. Indeed, while support may have hardened in some ways over time this should not be misread for a loss of support; there is still considerable support for the welfare state and there may be more continuity here over the past 70 years than is commonly thought. Indeed, dominant perceptions on the ‘trend’ in public opinions about the welfare state may be shaped by two overly bold characterisations: one concerning a perceived drop in support since the 1980s, the other concerning the overwhelming support for the welfare state in the early post-‐war period. Finally, there does appear to be a moralistic tone reflected in much of the data throughout the period of study. Surveys conducted in the 1950s, 1960s and 1970s often betrayed very clear notions of there being distinct groups of ‘deserving’ and ‘undeserving’ poor. ‘Hard’ attitudes are very much in evidence in surveys conducted in the late 1960s and especially the 1970s, and surveys of attitudes in Britain noticeably differ from those conducted neighbouring countries Respondents in the UK emphasise behavioural explanations of poverty much more strongly, for example, and large majorities in some surveys agree that welfare interventions were making people work less hard and/or that much welfare spending was going to the wrong places. However, the same surveys often showed a good degree of support for expanding welfare, underlining that critical attitudes towards some aspects of welfare (and the groups in receipt of it) do not automatically align with a desire for deep cuts in spending.
Although it is a commonly held view that public support for the welfare state has declined considerably since the ‘golden age of the welfare state’ of the 1950s and 1960s, empirical evidence to support this claim is far from decisive.
One risk in taking a longer term view is that a broader-‐brush analysis ends up emphasising continuity over change, or offering a singular narrative that fails to capture the complexities of change across different policy areas. The nuances of debate in each policy sector and, moreover, the complexity of how changing policy frameworks interact with public attitudes can quickly be lost in a broader analysis. Even ‘gold standard’ surveys of public attitudes such as the BSA survey cannot pinpoint these nuances of, say, how changes in Child Benefit rules and payment levels shape changes in public support for greater or lesser spending in this area. More detailed case-‐study analysis of individual policy areas will shed more light on the finer detail, but the value of undertaking a broad-‐brush analysis of how support for the welfare state ‘project’ over the history of the welfare state has, we hope, been demonstrated here.
21
References Aalberg, T. (2003) Achieving Justice: Comparative Public Opinion on Income Distribution. Leiden: Brill. Abrams, M. and Rose, R. (1960) Must Labour Lose? London: Penguin. Baumberg, B. (2014a) Benefits and the cost of living, British Social Attitudes 31, NatCen Social Research Baumberg, B. (2014b) Attitudes to benefits are not as negative as they seem, The Conversation, 17 June. Beedle, P. and Taylor-‐Gooby, P. (1983) ‘Ambivalence and Altruism: Public Opinion about Taxation and Welfare’, Policy & Politics, 11: 15–39. BIPO [British Institute of Public Opinion] (1942) The Beveridge Report and the Public. London: BIPO. British Election Study (n.d.) ‘British Election Study Cross-‐sectional Data’, available for download at http://www.britishelectionstudy.com/data-‐objects/cross-‐sectional-‐data/ Butler, D. and Stokes, D. (1974) Political change in Britain: the evolution of electoral choice. Basingstoke: Macmillan. Calder, A. (1969) The People’s War. London: Pimlico. Clery, E., Lee, L. and Kunz, S. (2013a) Public Attitudes to Poverty and Welfare, 1983-‐2011: Analysis using British Social Attitudes data. London: National Centre for Social Research. Clery, E., Lee, L. and Kunz, S. (2013b) Public Attitudes to Poverty and Welfare, 1983-‐2011: Analysis using British Social Attitudes data [Online Statistical Appendix]. London: National Centre for Social Research. Deeming, C. (2014) ‘Foundations of the Workfare State – Reflections on the Political Transformation of the Welfare State in Britain’, Social Policy & Administration, online early view version, DOI: 10.1111/spol.12096. Donnison, D. (1967) ‘Education and Opinion’, New Society, 26th October, 583–587.
EEC (1977) The Perception of Poverty in Europe. Brussels, Commission of the European Communities, V/171/77-‐E. Forsyth, G. (1967) ‘Is the Health Service Doing its Job?’, New Society, 19th October, 545-‐550. Gallup, G.H. (1976) The Gallup international public opinion polls, Great Britain, 1937-‐1975. Westport: Greenwood Press. Gelissen, J. (2008) ‘European Scope-‐Of-‐Government Beliefs: the impact of individual, regional and national characteristics’, in van Oorschot, W., Opielka, M. and Pfau-‐Effinger, B. (eds), Culture and Welfare State: Values and Social Policy in Comparative Perspective. Cheltenham: Edward Elgar. Golding, P. and Middleton, S. (1982) Images of Welfare: Press and Public Attitudes to Poverty. Oxford: Martin Robertson. Hinton, J., Thompson, P. and Liddell, I. (1996) British Institute of Public Opinion (Gallup) Polls, 1938-‐1946. Colchester, Essex: UK Data Archive, April 1996. SN: 3331. Hitlin, S. and Piliavin, J.A. (2004) ‘Values: Reviving a Dormant Concept’, Annual Review of Sociology, 30: 359–393. Hudson, J., Jo, N.-‐K. and Keung, A. (2014) Culture and the Politics of Welfare: Exploring Societal Values and Social Choices. Basingstoke: Palgrave. Jacobs, L. (1993) The Health of Nations: Public Opinion and the Making of American and British Health Policy. Ithaca: Cornell University Press. Klein, R. (1974) ‘The Case for Elitism: Public Opinion and Public Policy’, Political Quarterly, 45, 406–417. Nevitt, D. (1967) ‘The State of the Social Services: Housing’, New Society, 5th October, 460–465. New Society (1980) ‘The Public Pulse: Bureaucracy bad, welfare good’, New Society, 4th December, 464–465. Opielka, M. (2008) ‘Christian Foundations of the Welfare State: Strong Cultural Values in Comparative Perspective’, in van
22
Oorschot, W., Opielka, M. and Pfau-‐Effinger, B. (eds), Culture and Welfare State: Values and Social Policy in Comparative Perspective. Cheltenham: Edward Elgar, 89–115. PEP (1961) Family Needs and the Social Services: A Survey. London: George Allen and Unwin. Pfau-‐Effinger, B. (2005) ‘Culture and Welfare State Policies: Reflections on a Complex Interrelation’, Journal of Social Policy, 34 (1): 3–20. PRO/BN/72/31 ‘Survey of The Public’s Attitudes to Social Security’, National Archives Public Record Office Folder, Ministry of Social Security Correspondence from June 1968 to July 1968. PRO/BN/82/133 ‘Opinion Research’, National Archives Public Record Office Folder, Department of Health and Social Security Correspondence from August 1979 to December 1979. PRO/T227/2592 ‘Survey of Public Attitudes to Social Security Contributions and Benefits’, National Archives Public Record Office Folder, Treasury Correspondence from June 1968 to August 1968. PRO/T227/3094 ‘Survey of Public Awareness and Attitudes to Social Security Benefits and Contributions’, National Archives Public Record Office Folder, Treasury Correspondence from August 1968 to August 1970. Seldon, A. (1967) ‘Part I: An Interim Study in Public Preferences and Policy’ in Seldon, A. and Gray, H. (eds), Universal or Selective Social Benefits? London: IEA, 9–46. Seldon, A. and Gray, H. (1967) Universal or Selective Social Benefits? London: IEA. Skocpol,T. and Amenta, E. (1986) ‘States and Social Policies’, Annual Review of Sociology, 12: 131–157. Taylor-‐Gooby, P. (1982) ‘Two Cheers for the Welfare State: Public Opinion and Private Welfare’, Journal of Public Policy, 2: 319–346.
Taylor-‐Gooby, P. (1983) ‘Moralism, Self-‐Interest and Attitudes to Welfare’, Policy & Politics, 11: 145–160. Taylor-‐Gooby, P. (1985) Public Opinion, Ideology and State Welfare. London: Routledge. Taylor-‐Gooby, P. and Taylor, E. (2015) ‘Benefits and Welfare: Long-‐term trends or short-‐term reactions?’ in Curtice, J. and Ormston, R. (eds) British Social Attitudes 32. London: NatCen, 74-‐101. Tyler, D. (1990) British Opinion Polls, 1960–1988. Reading: Research Publications. Work and Pensions Select Committee (2015) ‘Contributory Welfare State Investigated by Committee’, Work and Pensions Select Committee Press Release, 22nd December, online at http://www.parliament.uk/business/committees/committees-‐a-‐z/commons-‐select/work-‐and-‐pensions-‐committee/news-‐parliament-‐2015/contributory-‐welfare-‐state-‐investigation-‐15-‐16/ van Oorschot, W. (2006) ‘Making the Difference in Social Europe: Deservingness Perceptions among Citizens of European Welfare States’, Journal of European Social Policy 16 (1): 23-‐42. Wedderburn, D. (1967) ‘How Adequate are our Cash Benefits?’, New Society, 12th October, 512–516. Wiseman, J. (1967) ‘Our Survey Assessed’, New Society, 2nd November, 625–627.
About the Project This project was commissioned by Shelter in the form of a short desk based review of historical data on public attitudes towards the UK’s social welfare system. This summary report presents an overview of the key findings of our research. About the Authors This research was led John Hudson & Neil Lunt are social policy researchers based in the Department of Social Policy & Social Work at the University of York, UK. They were assisted in undertaking this research by Charlotte Hamilton, Sophie Mackinder, Jed Meers & Chelsea Swift, all of whom were doctoral researchers based in the Research Centre for the Social Sciences (ReCSS) at the University of York. More information about the Department of Social Policy & Social Work at the University of York can be found online at www.york.ac.uk/spsw/
Published: February 2016 ISSN: xxx-‐xxx-‐xxx-‐xxx