Embed Size (px)
Citation preview

Wins for People, Planet and Profits: The E+Co Story
Phil LaRoccoExecutive Director, E+Co
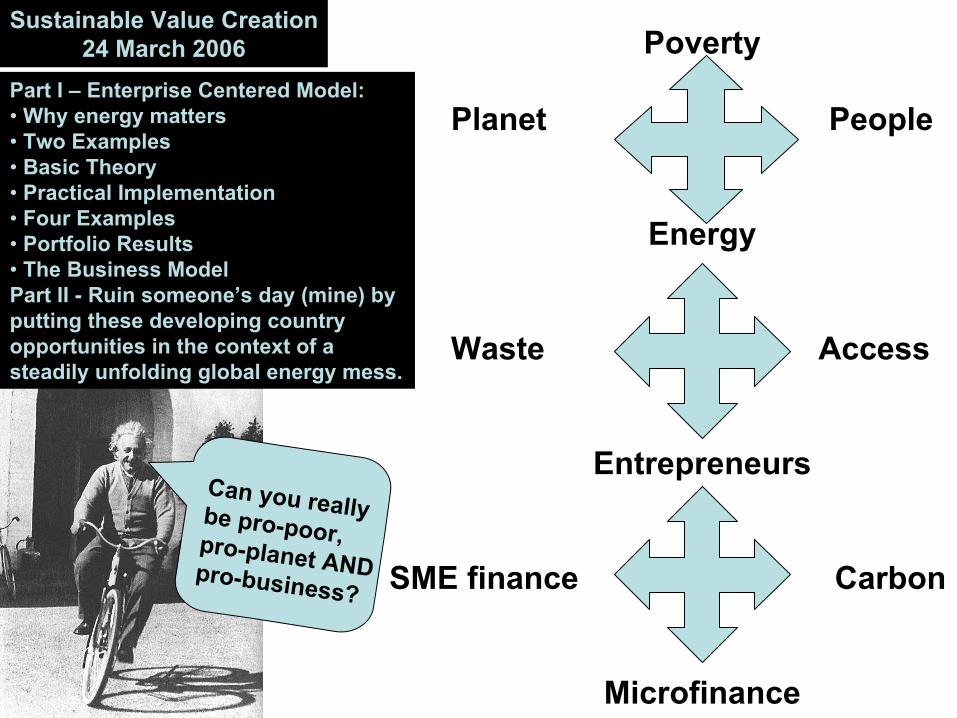
Poverty
Planet People
Energy
Waste Access
Entrepreneurs
SME finance Carbon
Microfinance
Part I – Enterprise Centered Model:• Why energy matters• Two Examples• Basic Theory• Practical Implementation• Four Examples• Portfolio Results• The Business ModelPart II - Ruin someone’s day (mine) by putting these developing country opportunities in the context of a steadily unfolding global energy mess.
Sustainable Value Creation24 March 2006
Can you reallybe pro-poor,pro-planet ANDpro-business?

Energy Enterprise Energy Enterprise Development:Development:The Path to ScaleThe Path to Scale
Identifying energy SME business models that work.
Experimenting with service + investment models andidentifying those that work.
Elaborating energy SME business model and service+ investment models into systems and experience…creating a value chain.
Engaging others to adopt both business and service investment models; building participants in value chain
Filling gaps in and gaining experience with the Value chain
19901990 20002000
Significantly expanding participation in the value chain
20102010
Sustainable Value Creation24 March 2006

• If you care about environment you need to worry about energy.
• If you worry about energy you better focus on the developing world.
• And if you care about environment and worry about energy in the developing world you must speak the language of business. Government cannot do the job alone.
Energy and the Sustainable Enterprise
Thomas Edison, 1913, Inspecting electric car

EnvironmentEnvironment••Indoor air Indoor air ••Local land, water, air, flora & faunaLocal land, water, air, flora & fauna••Global climate, biodiversity & water quality Global climate, biodiversity & water quality
Quality of Life Quality of Life •• Better healthBetter health•• Time for educationTime for education•• Reduced drudgeryReduced drudgery
for women for women and childrenand children
DevelopmentDevelopment•• Employment Employment •• Greater productivity Greater productivity •• Income generationIncome generation
Modern Modern Energy Energy ImpactsImpacts

Energy Poverty+
Energy Waste
One ProblemNot Two

Energy PovertyOpportunity
Energy Waste
Enterprises such as
KWTE (Thailand)
US$ 300,000Term: 6 yearsJobs Created:13 Impact: PV systems replace use of kerosene and candles.
US$ 197,500Co-Financing: US$3,400,000Jobs Created:20 Yearly Impact:: 8 million liters of fuel oil replaced, CO2 reduced by 250,000 tpy
Enterprises such as
TecnoSol (Nicaragua)

Enterprise Centered ModelThe Basic Theory
Investors Donors Philanthropies
Services
SMEEntrepreneurs
Capital
Their Customers
Public Purpose Specialty Organizations
1. Blending Resources2. Specialty Organization3. Expertise + Money4. Local Empowerment5. Sustainable Businesses

Ghana
Services Capital
Entrepreneurse.g., Gladymanual,
TranslegacyTheir Customers
MaliSenegal Tanzania Zambia
AREED
PracticalApplication

Example Enterprises
Usiss, Mali• Business: Solar Crop Drying• Stage of Sector Dev.: Very Early proof of concept phase • AREED Support: $18,000, 4 yr loan and enterprise
development support from MFC, E+Co• Status: Operating. Repayments current.
BETL, Tanzania• Business: Logistics company coordinating ag. wastes for fuel
substitution• Stage of Sector Development: Early commercialization phase • AREED Support: $50,000 3-yr loan and Enterprise Dev.
Support from Tatedo, E+Co• Status: Increased sales from 500 Mt to 1200 Mt per month
Repayments current.

Example EnterprisesAnasset, Ghana• Business: LPG distribution• Stage of Sector Dev.: replication phase • AREED Support: $38,000, 4 yr loan and enterprise
development support from KITE, E+Co• Status: Repayments current, expanding with bank financing.
KPBS, Zambia• Business: Charcoal production from sawmill waste• Stage of Sector Dev.: Proof of concept phase • AREED Support: $73,000, 4 yr loan and enterprise
development support from CEEEZ, E+Co• Status: Construction of 15 kilns completed. Production,
distribution and sales of charcoal started Feb 2003. Enterprise folded in 2004

876,378,641 79,715 3 manuals in 5
languages 10$ 3,100,000
Articles Published
Firewood displaced in kg
Customers installing EE equipment
Manuals Developed in how many languages
NGOs receiving capacity building
Amount E+Co has repaid to investors
36,084,597 99,724 1,173 10295
Awards ReceivedLiters of Kerosene
DisplacedEnergy saved from EE
initiatives MWHEntrepreneurs
IdentifiedClean Energy
Enterprises
Financial Institutions trained on RE financing
10$ 1,443,100 28,862 685$ 6,858,113 $ 244,950,000
Productive Use Companies
Dollar Value of Oil DisplacedBarrels of Oil DisplacedEntrepreneurs trainedImproved Income
Potential Amount of Growth Capital
238,25044,550,000 5092,063,954$ 105,863,262
Policy Activities
Households with access to clean water
Water Improvement/ liters of clean water
Entrepreneurs receiving EDS
People with Access to Modern Energy Services
Leveraged from 3rd parties
35$ 43,331,427 36,168 9412,791 $ 14,691,316
Geographic Distribution (# of
countries)
Value of CO2 Offsets for life of project
Reforested Land/number of trees planted
Women Ownership/ Shareholding/ Micro-Entrepreneur
Households served
Money E+Co Leveraged from Entrepreneurs
148,666,285 479,867 1825374,071 $ 11,771,786
Clean Energy Technologies
CO2 Offset for life of Project, tons of CO2
CO2 Offset Annually in tonsJobs Sustained
Clean Energy Generated in MWHMoney E+Co Invested
Clean Energy PromotionEnvironmentalSocialFinancial
31 Dec 05 TRIPLE BOTTOM LINE
One hundred plus investments totaling almost $12 million
Combined with highly specialized services for entrepreneurs has produced
$132 million in total investment2.1 million people served with
modern energy44 million liters of clean water in
38,000 households.
These enterprises have offset the need for 76,000 tonnes of fuel wood and collectively will save 8 million tonnes of carbon dioxide over their lives.

876,378,641 79,715 3 manuals in 5
languages 10$ 3,100,000
Articles Published
Firewood displaced in kg
Customers installing EE equipment
Manuals Developed in how many languages
NGOs receiving capacity building
Amount E+Co has repaid to investors
36,084,597 99,724 1,173 10295
Awards ReceivedLiters of Kerosene
DisplacedEnergy saved from EE
initiatives MWHEntrepreneurs
IdentifiedClean Energy
Enterprises
Financial Institutions trained on RE financing
10$ 1,443,100 28,862 685$ 6,858,113 $ 244,950,000
Productive Use Companies
Dollar Value of Oil DisplacedBarrels of Oil DisplacedEntrepreneurs trainedImproved Income
Potential Amount of Growth Capital
238,25044,550,000 5092,063,954$ 105,863,262
Policy Activities
Households with access to clean water
Water Improvement/ liters of clean water
Entrepreneurs receiving EDS
People with Access to Modern Energy Services
Leveraged from 3rd parties
35$ 43,331,427 36,168 9412,791 $ 14,691,316
Geographic Distribution (# of
countries)
Value of CO2 Offsets for life of project
Reforested Land/number of trees planted
Women Ownership/ Shareholding/ Micro-Entrepreneur
Households served
Money E+Co Leveraged from Entrepreneurs
148,666,285 479,867 1825374,071 $ 11,771,786
Clean Energy Technologies
CO2 Offset for life of Project, tons of CO2
CO2 Offset Annually in tonsJobs Sustained
Clean Energy Generated in MWHMoney E+Co Invested
Clean Energy PromotionEnvironmentalSocialFinancial
31 Dec 05 TRIPLE BOTTOM LINE Financial Summary
January 1998-June 2005112 Investments
17 written off= 10.4 % by amt of investment= 15.1% of the number
Loans = 89% of investmentEquity = 11%
19 Loans fully repaid with ROI of 10.2%
Projected Blended Return = 8.4%
ROI Only…Does not include cost of services to enterprises

Use of Proceeds
Investment, 50.0
Services, 11.0
Operations, 6.5
Investment
Services
Operations
$1.35 Model 1.00 : 0.22 : 0.13• Return on
– 50mm = 8% (after portfolio losses)
– 61mm = 4.3% (after services cost)
- 67.5mm = 2.5%= all-in
• 3 to 4 year investment period
• 7 year returns
Capital………..Services……….Operations

Investment 75000 CASE 1 = ROI on $75k+donation 7.3%
Gift 25000 CASE 2 = ROI on $100k 0.3%Investment Interest Rate 5%
Tax Rate 30%Year 0 1 2 3 4 5-75000 3750 3750 3750 3750 3750-25000 7500-100000 11250 3750 3750 3750 3750
Return of Principal 75000-100000 11250 3750 3750 3750 78750 0.3% CASE 2
-75000 11250 3750 3750 3750 78750 7.3% CASE 1

August 2003:Midwest, NE USA
And Ontario Canada:Blackout hits
50 Million people
73% of world’s oil is locatedin Saudi Arabia, Iran, Iraq,Russia, Libya and Venezuela
44% of world’s oilGoes through five milewide channel inStrait of Hormuz
May 2005Train derailmentForces cutbackIn low sulfur fuelfor power plants
27% of the world’s natural gas and 32% of oil goes through the 1.5 mile wide point in the Strait of Malacca
World Energy Outlook, US-Canada Task Force on Power Outage, Utilipoint Issue Alert, N.Y. Times
August 2005Katrina disrupts oil
and natural gas supplies…
Energy Op Art:
Worry? Me worry?
AND I THOUGHT THE SPACE SHUTTLE WAS RISKYExcept for Alfred E., © 2006, LaRocco
March 2006Colorado snow
packs below normal 8 of 9 years
March 12, 2006:100 tornados
1.6 B in poor countries w/o electricity2.4 B using traditional fuels
Basically unchanged by 2030
Energy SupplyEnergy DemandEnergy SecurityClimate Change
Natural Resource Depletion
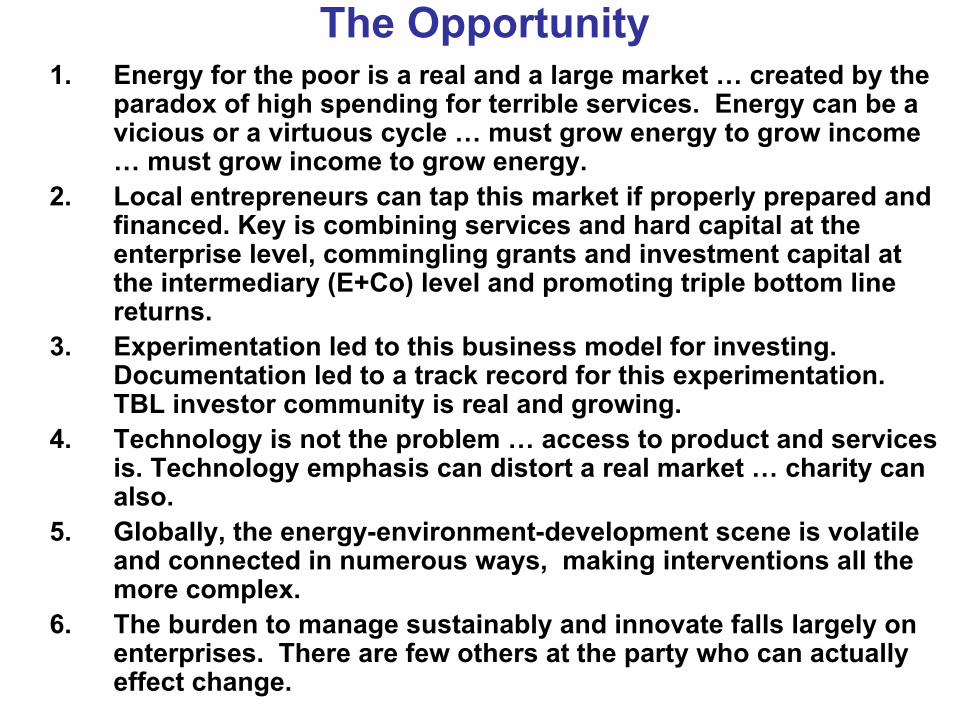
The Opportunity1. Energy for the poor is a real and a large market … created by the
paradox of high spending for terrible services. Energy can be avicious or a virtuous cycle … must grow energy to grow income … must grow income to grow energy.
2. Local entrepreneurs can tap this market if properly prepared andfinanced. Key is combining services and hard capital at the enterprise level, commingling grants and investment capital at the intermediary (E+Co) level and promoting triple bottom line returns.
3. Experimentation led to this business model for investing. Documentation led to a track record for this experimentation. TBL investor community is real and growing.
4. Technology is not the problem … access to product and services is. Technology emphasis can distort a real market … charity can also.
5. Globally, the energy-environment-development scene is volatile and connected in numerous ways, making interventions all the more complex.
6. The burden to manage sustainably and innovate falls largely on enterprises. There are few others at the party who can actuallyeffect change.

02000400060008000
1000012000140001600018000
Mtoe
1971 2002 2010 2020 2030
Years
World Energy Demand
Transition CountriesOECD CountriesDeveloping Countries
Energy • Energy Waste + Energy Poverty
– Energy Per Capita per year = 1650 kg of oil equivalent
• Africa 650 kg• Latin America 1070 kg• China 970 kg• Other Asia 600 kg• Non-OECD Europe 1720 kg• FSU 3250 kg• Middle East 2500 kg• OECD North America 6430 kg• OECD Pacific 4280 • OECD Europe 3410 kg
– 1.6 B w/o electricity, 2.4 B using traditional fuels
– Health, Productivity, Environmental Implications
– Energy (TPES) = 10,345 Million Tonnes of Oil Equivalent = 23,579 Mt CO2e
– IEA Energy Balances ’01-’02
• Plan A = – 60% increase by 2030– 85% from fossil fuels– = 16,487 Mtoe and 38,214 Mt of
CO2e– 2/3rds of increase in developing
countries, – 1.4 billion still w/o electricity,– 2.6 billion still using traditional
fuels…– $16 Trillion invested, more than
½ in developing countries– WEO 2004, IEA
Plan B = 14,654 Mtoe by 2030…31,686 Mt of CO2e…completely different investment pattern and
paradigm…1/2 of improvements from vehicles, electric appliances, lighting and industrial efficiency;
1/2 from renewable energy supplies and nuclear power.
Energy Poor Still In The Dark

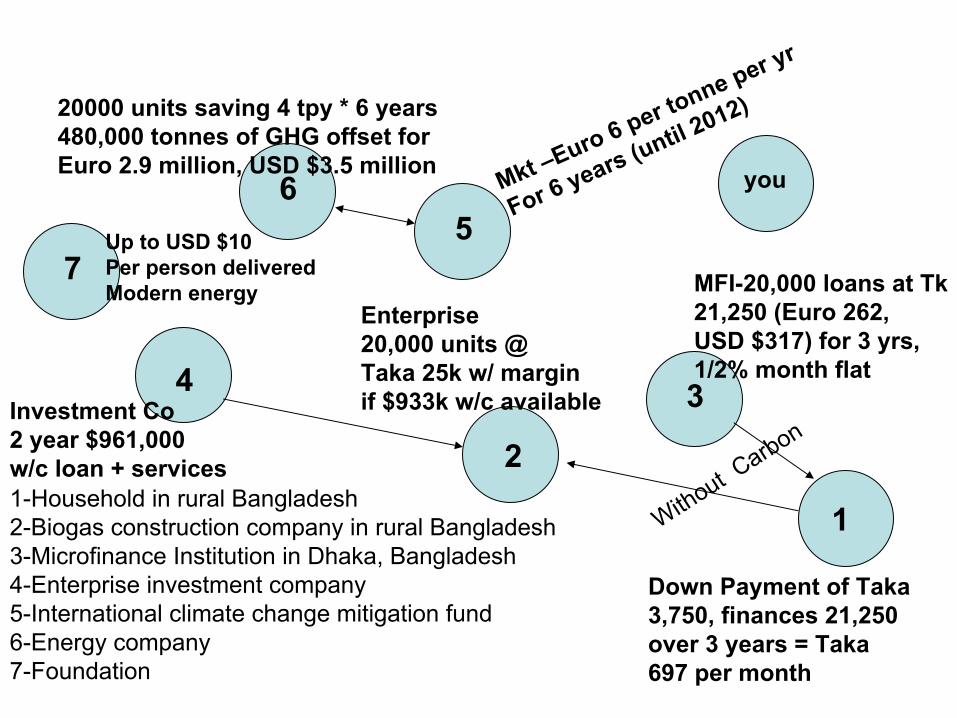
1-Household in rural Bangladesh2-Biogas construction company in rural Bangladesh3-Microfinance Institution in Dhaka, Bangladesh4-Enterprise investment company5-International climate change mitigation fund 6-Energy company 7-Foundation
1
2
34
56
7
you
Connecting the Dots, March 24, 2006

1-Household in rural Bangladesh2-Biogas construction company in rural Bangladesh3-Microfinance Institution in Dhaka, Bangladesh4-Enterprise investment company5-International climate change mitigation fund6-Energy company 7-Foundation
1
2
34
56
7
you
March 14, 2006
Uses 2700 kg per year of unsustainable firewood (Taka 7300) + kerosene
Builds hh biogas units At Taka 25k w. profit margin
MFI-makes $100+ loans for3 yrs, ½ % month “flat”
Supports enterprises
Supports sustainableinitiatives
Needs 500,000 tonnescarbon offsets Organizes purchases
And sales of GHGs
1-Household in rural Bangladesh2-Biogas construction company in rural Bangladesh3-Microfinance Institution in Dhaka, Bangladesh4-Enterprise investment company 5-International climate change mitigation fund6-Energy company 7-Foundation
1
2
34
56
7
you
Down Payment of Taka 3,750, finances 21,250 over 3 years = Taka 697 per month
Enterprise20,000 units @Taka 25k w/ marginif $933k w/c available
MFI-20,000 loans at Tk21,250 (Euro 262, USD $317) for 3 yrs, 1/2% month flat
Investment Co2 year $961,000w/c loan + services
20000 units saving 4 tpy * 6 years480,000 tonnes of GHG offset forEuro 2.9 million, USD $3.5 million
Mkt –Euro 6 per tonne per yr
For 6 years (until 2012)
Up to USD $10Per person deliveredModern energy
Without Carbon

1-Household in rural Bangladesh2-Biogas construction company in rural Bangladesh3-Microfinance Institution in Dhaka, Bangladesh4-Enterprise investment company 5-International climate change mitigation fund 6-Energy company in the Netherlands7-Foundation
1
2
34
56
7
you
Taka 474 per month withTaka 2551 down payment
Enterprise20,000 units
MFI-20,000 loansat Taka 14,456
Investment co2 year w/c loan + services
Support for start-up& services = $750,000
480,000 tonnes of GHG offsets
E 6 per tonne per yrFor 6 years, NPV @12% = E 99 or Taka7993

1-Household in rural Bangladesh2-Biogas construction company in rural Bangladesh3-Microfinance Institution in Dhaka, Bangladesh4-Enterprise investment company in multiple countries5-International climate change mitigation fund 6-Energy company 7-Foundation
1
2
34
56
7
you
32% first cost and monthly payment reduction
Enterprise20,000 units
MFI-20,000 loans
Investment co2 year w/c loan + services
Support for start-up& services
480,000 tonnes of GHG
E6 per tonne per yrFor 6 years E 6.2 million,
8.2%IRR

32%which represents a cost reduction of about
Taka17,007leaving a balance of
Taka per unit7,993 The resulting cost reduction will equal about7
will be applied to reducing the first cost to households.
100%A portion of this net present value equal to6
Discount Rate12%A net present value of the CO2 savings will be calculated over a six year period using a
5
Euro per tonne6.00CO2 equivalent will be sold for 4
of avoided CO2 equivalent per year and the sponsor retains ownership of this benefit.
tonnes4Household biogas units will average about3
€ 6,172,840 Euro309Which equals about:
Taka25,000Each household unit will cost on average:2
households20,000
A sponsor such as Grameen Shakti decides to create a large scale household biogas program, which will be implemented in phases of:
1

4.61%
After deducting "allowances" for the cost of operating the special fund, collecting loans and verifying carbon credits, there will be sufficent cash flow in the special fund to make Euro based payments to investors equal to their original principal and a return of about
13
Euro6,087,840 The balance of the funds will be sought from investors. This totals
12
for application to future phases
0%and a percentage will be recovered / reserved
Euro250,000 Initial grants will be obtained totalling11
Euro6,337,840
Including an allowance for setting up the new fund and obtaining the approvals needed to sell carbon credits the cost of this phase totals
10
per year, simple interest or "flat"6%including a service charge of
months36The balance will be financed over a period of9
Taka14456leaving a balance to be financed of
Taka2551which equals a payment of
15%Households will make down payments of8
If Euro 750,000 = E7,5 per person
Then 4.61% = 8.2%

697
If no CER / CDM Credit,
monthly payment =
32%4.6%474100%
29%6.1%49690%
10.0%1000000If26%7.6%51880%
8.2%750000If22%9.2%54170%
6.4%500000If19%10.7%56360%
Fund IRR
Assumes Grants of Euro 250000
CER/CDM Cost
Reduction to the PoorFund IRR
Monthly Payment
(Taka)
Portion of CER / CDM
Credited to Poor
25000 Cost, 4 TPY, 6 Yrs, Euro 6 PTPY, Euro 1 =Taka 81, 12% Discount Rate, 15%DP, 6% "Flat" Charge, 3 years