Embed Size (px)
Citation preview
NOAA | National Weather Service Chicago, IL
Ricky CastroMeteorologist
NWS Chicago, ILweather.gov/Chicago
@NWSChicago
Winter 2020-21 OutlookWhat can we expect the rest of this winter?
Roadmap⦿ La Niña Conditions in Place: How could this affect our winter weather?
⦿ Typical Winter Temperatures and Snowfall
⦿ Where have we been & where are we going? Warm Nov. & CPC Outlooks
⦿ Precipitation and Snowfall Data
⦿ Conclusion: NWS Chicago’s Winter Outlook Thoughts!
⦿ Bonus! Lake Michigan remains very high → elevated lakeshore flood risk
⦿ Time for Questions!
La Niña Likely to Influence Our Winter Season La Niña conditions favored thru winter season.
� Cooler than normal Sea Surface Temps (SST’s) in the eastern and central equatorial Pacific, which can impact storm track across North America.
What could this mean for us?• An active weather pattern across our region, with
good potential for above average winter precipitation (rain or snow).
• Periods of both very mild weather and cold.� Highly variable day-to-day and week to week
temperatures possible.� Possible that we lean more towards a warmer
overall period, but confidence on predominate regime is low.
Below Average Sea Surface Temperatures
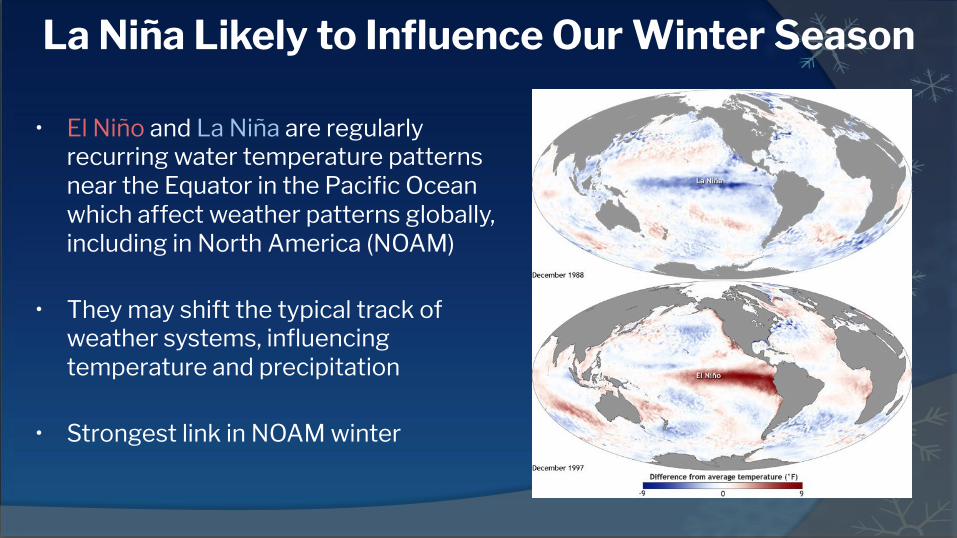
• El Niño and La Niña are regularly recurring water temperature patterns near the Equator in the Pacific Ocean which affect weather patterns globally, including in North America (NOAM)
• They may shift the typical track of weather systems, influencing temperature and precipitation
• Strongest link in NOAM winter
La Niña Likely to Influence Our Winter Season La Niña conditions favored thru winter season.
� Cooler than normal Sea Surface Temps (SST’s) in the eastern and central equatorial Pacific, which can impact storm track across North America.
What could this mean for us?• An active weather pattern across our region, with
good potential for above average winter precipitation (rain or snow).
• Periods of both very mild weather and cold.� Highly variable day-to-day and week to week
temperatures possible.� Possible that we lean more towards a warmer
overall period, but confidence on predominate regime is low.
Below Average Sea Surface Temperatures
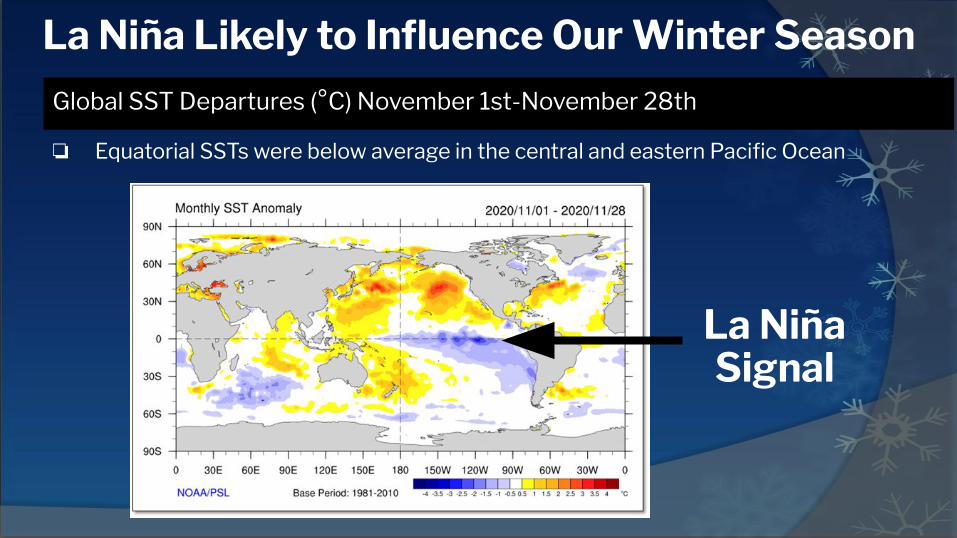
❏ Equatorial SSTs were below average in the central and eastern Pacific Ocean
Global SST Departures (°C) November 1st-November 28th
La NiñaSignal
La Niña Likely to Influence Our Winter Season
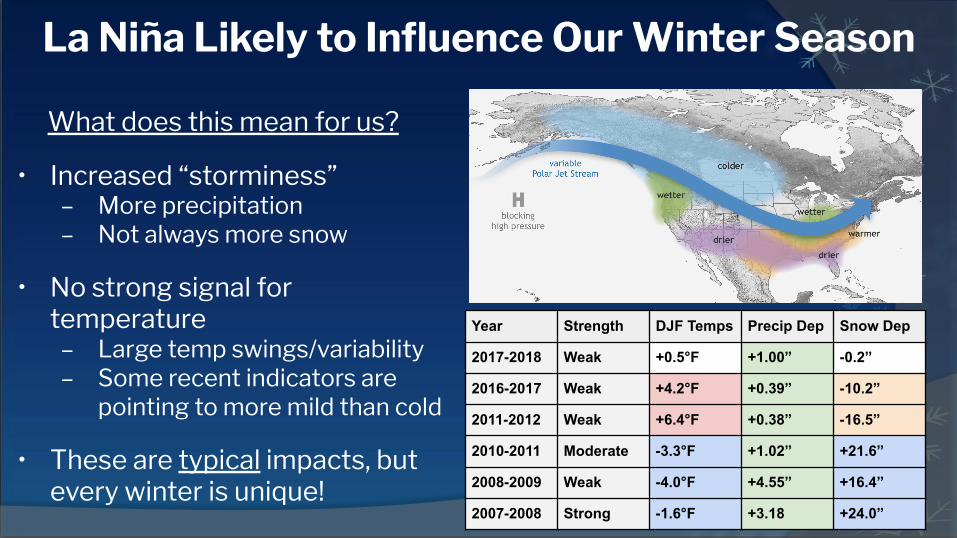
What does this mean for us?
• Increased “storminess”– More precipitation– Not always more snow
• No strong signal for temperature
– Large temp swings/variability– Some recent indicators are
pointing to more mild than cold
• These are typical impacts, but every winter is unique!
Year Strength DJF Temps Precip Dep Snow Dep
2017-2018 Weak +0.5°F +1.00” -0.2”
2016-2017 Weak +4.2°F +0.39” -10.2”
2011-2012 Weak +6.4°F +0.38” -16.5”
2010-2011 Moderate -3.3°F +1.02” +21.6”
2008-2009 Weak -4.0°F +4.55” +16.4”
2007-2008 Strong -1.6°F +3.18 +24.0”
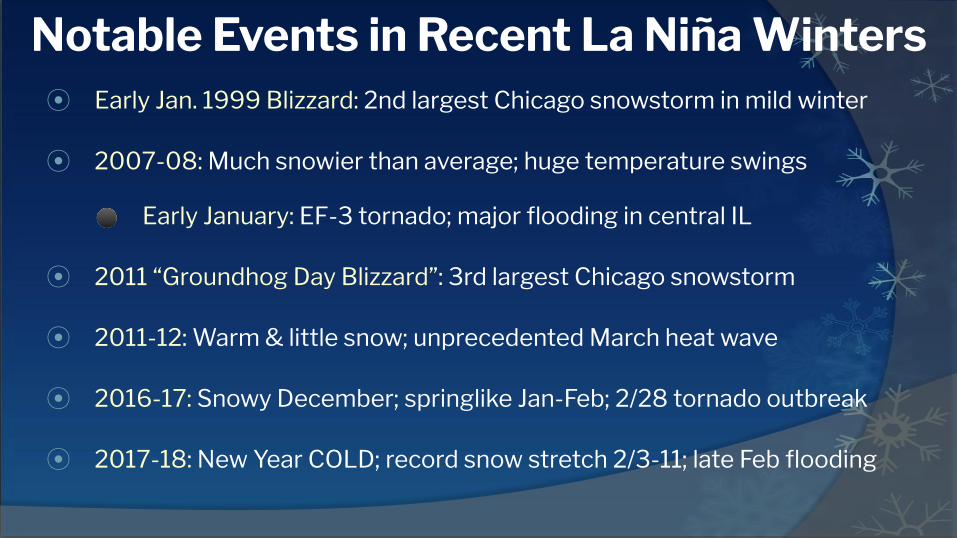
Notable Events in Recent La Niña Winters⦿ Early Jan. 1999 Blizzard: 2nd largest Chicago snowstorm in mild winter
⦿ 2007-08: Much snowier than average; huge temperature swings
⚫ Early January: EF-3 tornado; major flooding in central IL
⦿ 2011 “Groundhog Day Blizzard”: 3rd largest Chicago snowstorm
⦿ 2011-12: Warm & little snow; unprecedented March heat wave
⦿ 2016-17: Snowy December; springlike Jan-Feb; 2/28 tornado outbreak
⦿ 2017-18: New Year COLD; record snow stretch 2/3-11; late Feb flooding
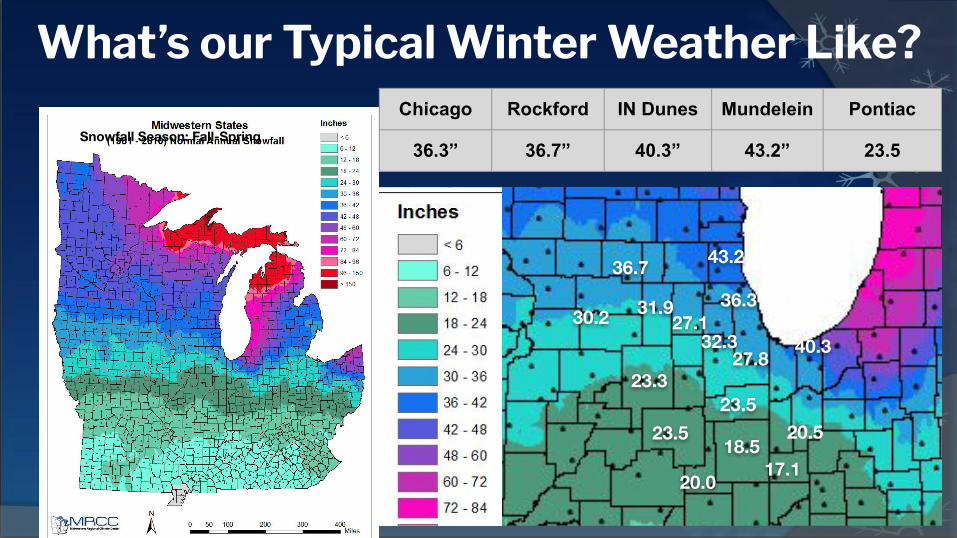
What’s our Typical Winter Weather Like? Chicago Rockford IN Dunes Mundelein Pontiac
36.3” 36.7” 40.3” 43.2” 23.5
42”+
43.2
40.3
36.7
36.3
Snowfall Season: Fall-Spring
23.5
31.9
23.3
20.5
32.3
20.0
30.2
23.5
18.5
27.1
17.1
27.8
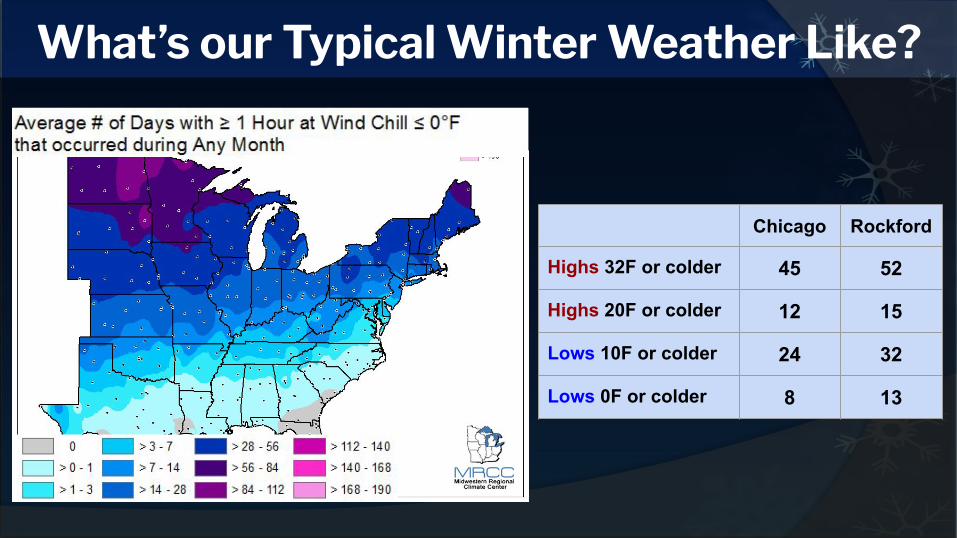
Chicago Rockford
Highs 32F or colder 45 52
Highs 20F or colder 12 15
Lows 10F or colder 24 32
Lows 0F or colder 8 13
What’s our Typical Winter Weather Like?
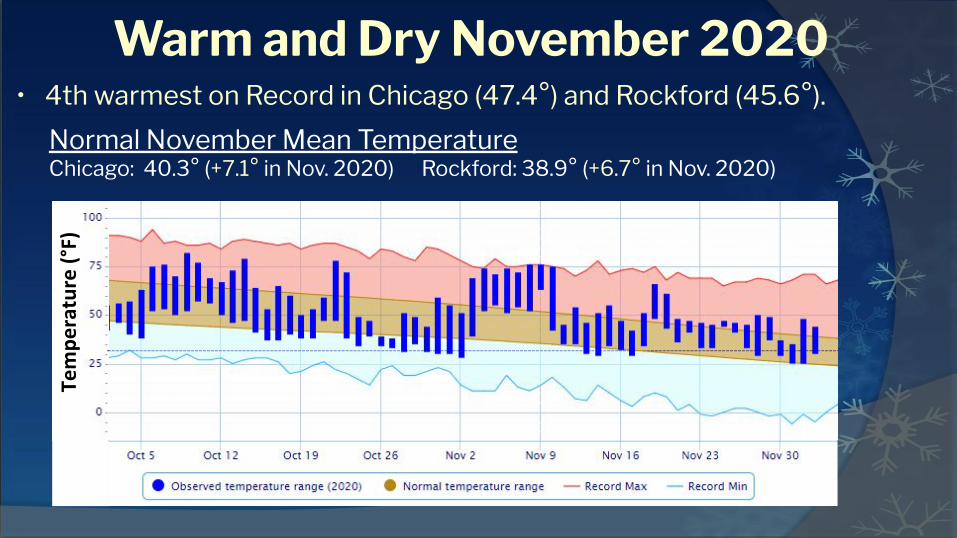
Warm and Dry November 2020 • 4th warmest on Record in Chicago (47.4°) and Rockford (45.6°).
Normal November Mean TemperatureChicago: 40.3° (+7.1° in Nov. 2020) Rockford: 38.9° (+6.7° in Nov. 2020)
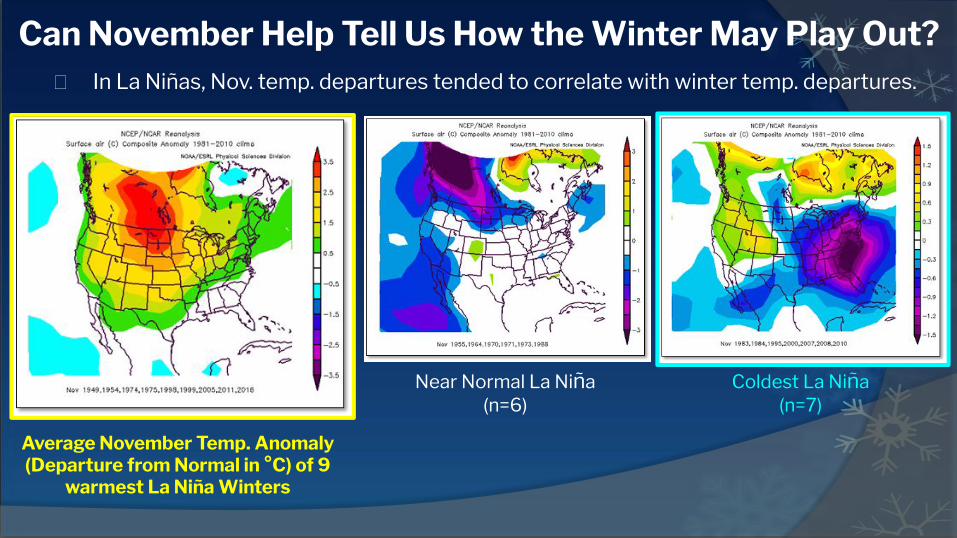
Can November Help Tell Us How the Winter May Play Out?La Niña conditions favored through the winter season.
� Cooler than normal Sea Surface Temps (SST’s) in the eastern and central equatorial Pacific, which can impact storm track across North America.
What could this mean for us?• An active weather pattern across our region, with good potential for above average winter precipitation (rain or snow).
• Periods of both very mild weather and cold.� Highly variable day-to-day and week to week temperatures possible.� Possible that we lean more towards a warmer overall period, but confidence on predominate regime is low.
Average November Temp. Anomaly (Departure from Normal in °C) of 9
warmest La Niña Winters
� In La Niñas, Nov. temp. departures tended to correlate with winter temp. departures.
Near Normal La Niña(n=6)
Coldest La Niña(n=7)
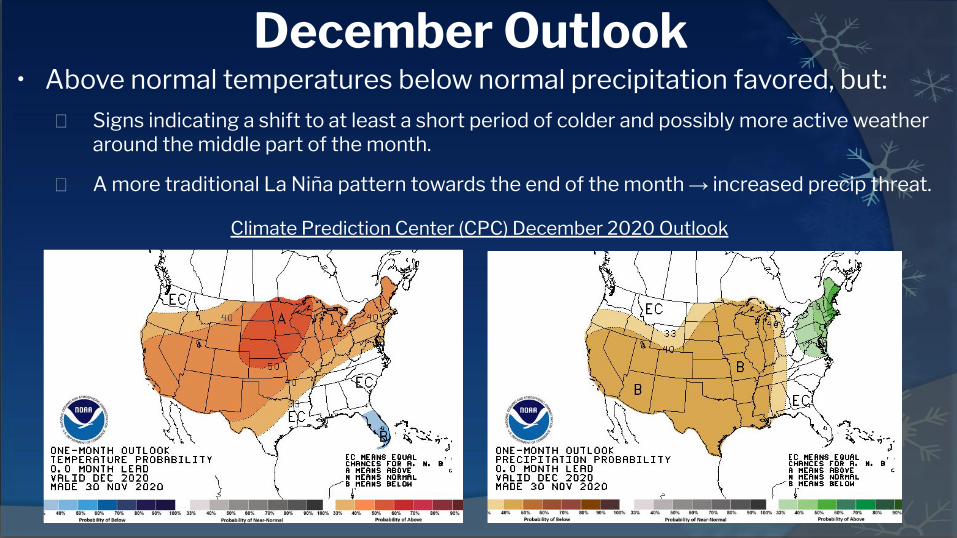
December Outlook
Climate Prediction Center (CPC) December 2020 Outlook
• Above normal temperatures below normal precipitation favored, but:
� Signs indicating a shift to at least a short period of colder and possibly more active weather around the middle part of the month.
� A more traditional La Niña pattern towards the end of the month → increased precip threat.
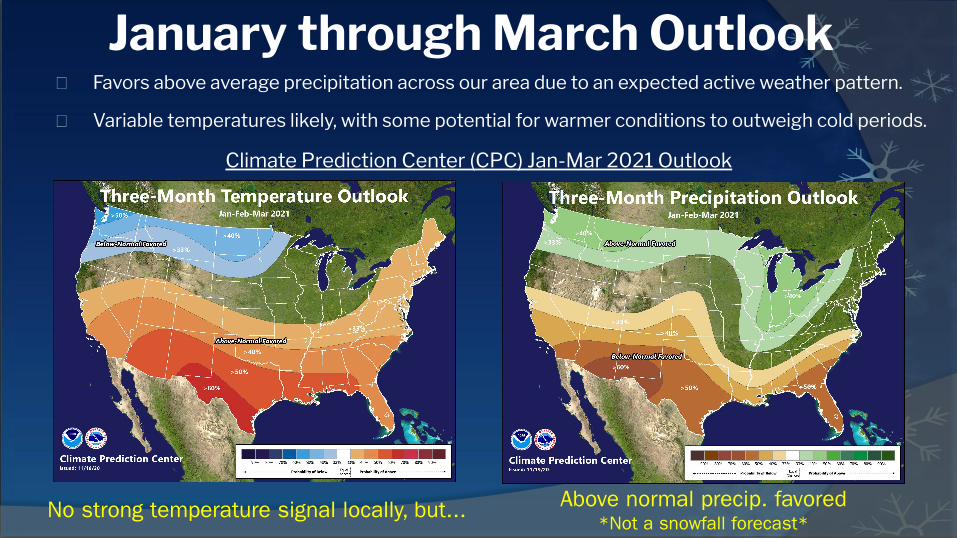
January through March OutlookLa Niña conditions favored through the winter season.
� Cooler than normal Sea Surface Temps (SST’s) in the eastern and central equatorial Pacific, which can impact storm track across North America.
What could this mean for us?• An active weather pattern across our region, with good potential for above average winter precipitation (rain or snow).
• Periods of both very mild weather and cold.� Highly variable day-to-day and week to week temperatures possible.� Possible that we lean more towards a warmer overall period, but confidence on predominate regime is low.
Climate Prediction Center (CPC) Jan-Mar 2021 Outlook
No strong temperature signal locally, but... Above normal precip. favored*Not a snowfall forecast*
� Favors above average precipitation across our area due to an expected active weather pattern.
� Variable temperatures likely, with some potential for warmer conditions to outweigh cold periods.
Does Above Average Precip. Support More Snow?
Not necessarily! But, historically, more winter precip → more snow
• Wettest 25% of all winters tended to be snowier than normal
• Drier winters trended towards below average snow.
Bottom Line: While an above average precipitation forecast does not always lead to more snow, it increases the odds of having above average snow. Predominant temperature pattern is a big wild card.
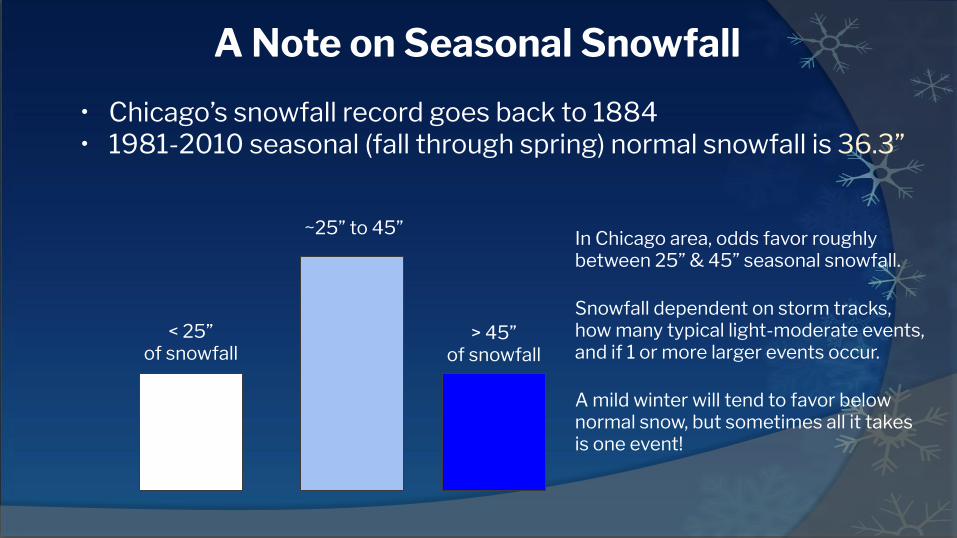
A Note on Seasonal Snowfall• Chicago’s snowfall record goes back to 1884• 1981-2010 seasonal (fall through spring) normal snowfall is 36.3”
< 25” of snowfall
~25” to 45”
> 45” of snowfall
In Chicago area, odds favor roughly between 25” & 45” seasonal snowfall.
Snowfall dependent on storm tracks, how many typical light-moderate events, and if 1 or more larger events occur.
A mild winter will tend to favor below normal snow, but sometimes all it takes is one event!
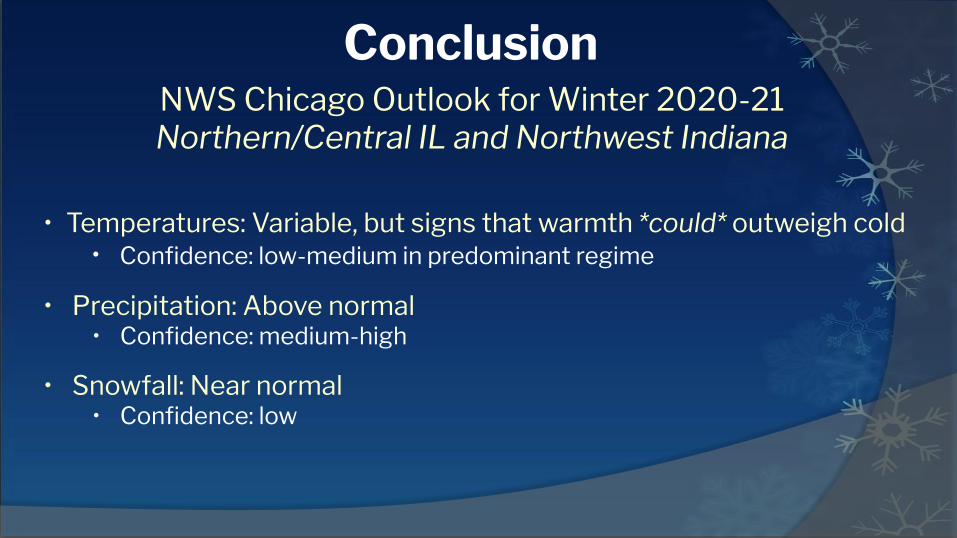
ConclusionNWS Chicago Outlook for Winter 2020-21 Northern/Central IL and Northwest Indiana
• Temperatures: Variable, but signs that warmth *could* outweigh cold• Confidence: low-medium in predominant regime
• Precipitation: Above normal• Confidence: medium-high
• Snowfall: Near normal• Confidence: low
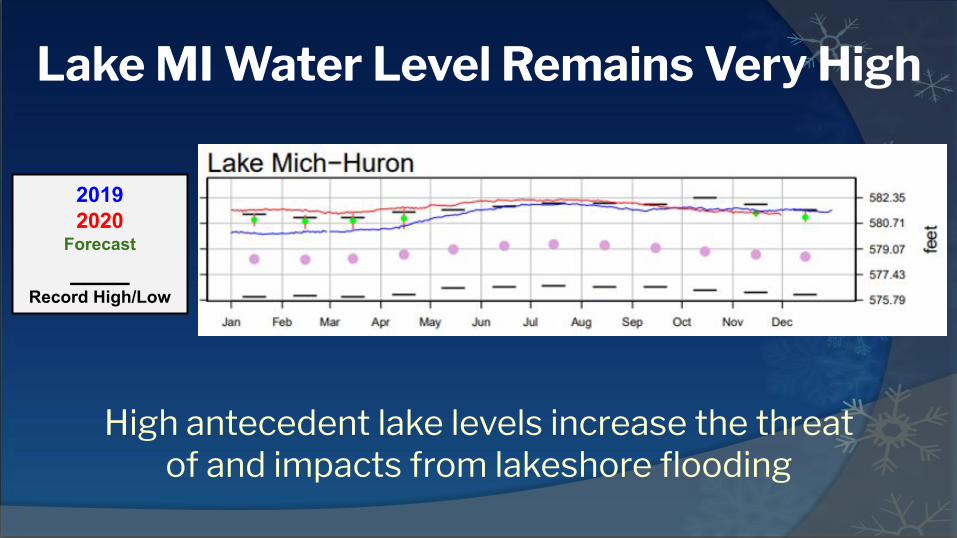
Lake MI Water Level Remains Very High
20192020
Forecast____
Record High/Low
High antecedent lake levels increase the threat of and impacts from lakeshore flooding
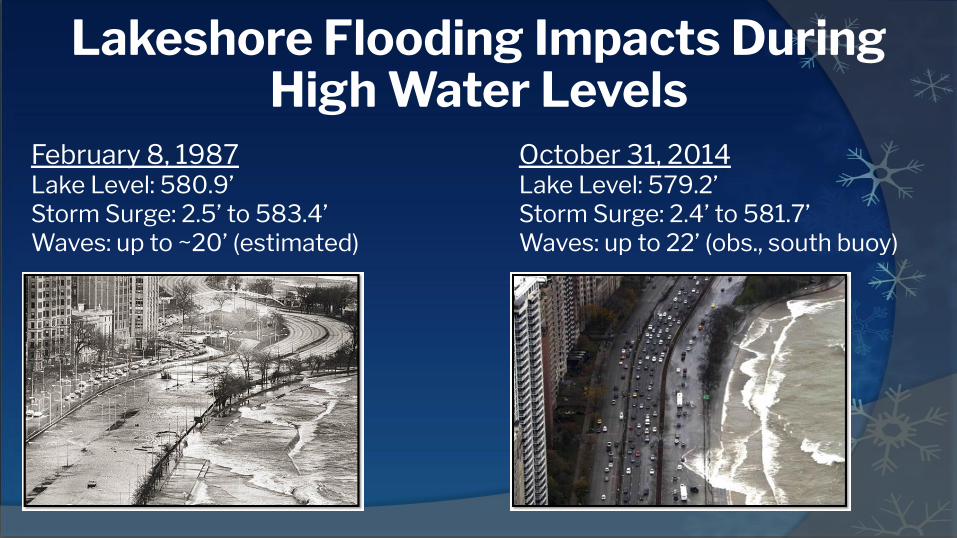
Lakeshore Flooding Impacts During High Water Levels
February 8, 1987Lake Level: 580.9’Storm Surge: 2.5’ to 583.4’Waves: up to ~20’ (estimated)
October 31, 2014Lake Level: 579.2’Storm Surge: 2.4’ to 581.7’Waves: up to 22’ (obs., south buoy)
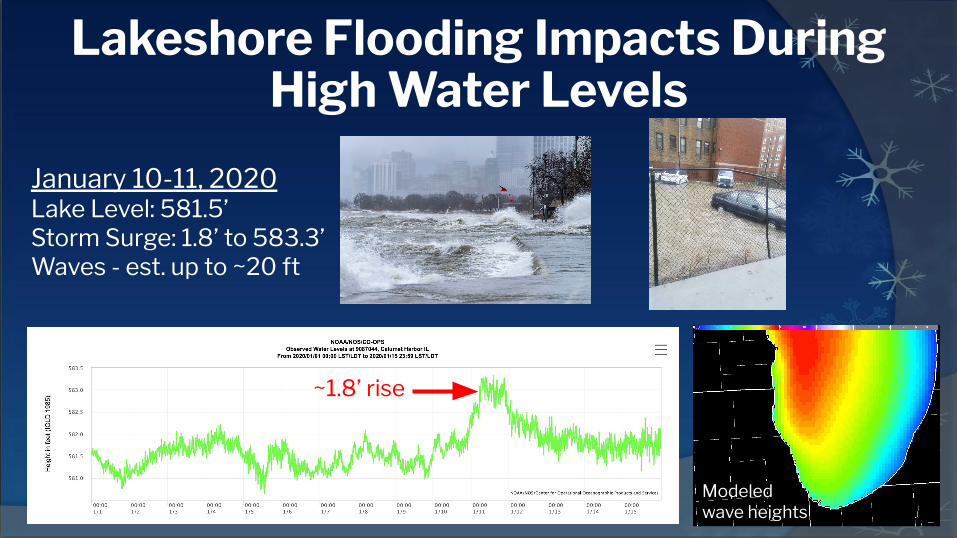
Lakeshore Flooding Impacts During High Water Levels
January 10-11, 2020Lake Level: 581.5’Storm Surge: 1.8’ to 583.3’Waves - est. up to ~20 ft
~1.8’ rise
Modeled wave heights
NOAA | National Weather Service Chicago, IL
Ricky CastroMeteorologist
NWS Chicago, ILweather.gov/Chicago
@NWSChicago
Thank You for Reading!