Embed Size (px)
Citation preview

Winter Persistence Barrier of Sea Surface Temperature in the Northern TropicalAtlantic Associated with ENSO
RUIQIANG DING AND JIANPING LI
State Key Laboratory of Numerical Modeling for Atmospheric Sciences and Geophysical Fluid Dynamics
(LASG), Institute of Atmospheric Physics, Chinese Academy of Sciences, Beijing, China
(Manuscript received 13 April 2010, in final form 29 January 2011)
ABSTRACT
This study investigates the persistence characteristics of the sea surface temperature anomaly (SSTA) in the
northern tropical Atlantic (NTA). It is found that a persistence barrier exists around December and January.
This winter persistence barrier (WPB) is prominent during the mature phase of strong ENSO events but
becomes indistinct during weak ENSO and normal (non-ENSO) events. During strong El Nino events, the
NTA SSTA shows a reversal in sign and a rapid warming during December and January. It is possible that this
SSTA sign reversal reduces the persistence, leading to the occurrence of the NTA WPB. The present analyses
indicate a dynamic relationship among the Pacific ENSO, the NTA SSTA, and the NTA WPB on a quasi-
biennial time scale: a strong El Nino event is usually preceded by a strong La Nina event, which leads to a sign
reversal of the NTA SSTA in winter as a delayed response to ENSO, finally resulting in the NTA WPB.
Analyses also suggest that the NTA WPB is affected by the North Atlantic Oscillation (NAO). The NAO
enhances the persistence of the NTA SSTA during winter, tending to weaken the NTA WPB.
1. Introduction
The El Nino–Southern Oscillation, originating in the
tropical Pacific, has a widespread effect on the global cli-
mate system. Considerable research effort has been de-
voted to predicting ENSO at seasonal lead times using
dynamical and statistical models, both of which have met
with great success (e.g., Latif et al. 1998; Barnston et al.
1999; Jin et al. 2008). However, most models developed to
predict ENSO suffer from a rapid decrease in forecast skill
in the boreal spring months of March–May, reflecting the
existence of a spring persistence barrier (SPB) in ENSO
anomalies (Webster and Yang 1992). The causes of this
phenomenon are not yet fully understood. Some studies
have suggested that it may reflect the relatively weak
ocean–atmosphere coupling over the Pacific during bo-
real spring (Zebiak and Cane 1987; Blumenthal 1991;
Goswami and Shukla 1991). More recent studies have
emphasized the phase locking of ENSO to the annual
cycle (Torrence and Webster 1998; An and Wang 2001)
and the biennial component of ENSO (Clarke and Van
Gorder 1999; Yu 2005).
In addition to the well-known SPB in the tropical
central-eastern Pacific, persistence barriers also occur in
other ocean areas during seasons other than spring.
Wajsowicz (2005) reported a winter persistence barrier
(WPB) of the sea surface temperature anomaly (SSTA) in
the southeastern tropical Indian Ocean (STIO), associated
with strong seasonal phase locking of the Indian Ocean
dipole (IOD) (Saji et al. 1999; Luo et al. 2007). In the
extratropical North Pacific and North Atlantic, a persis-
tence barrier of the SSTA exists around July–September
(Namias and Born 1970, 1974; Deser et al. 2003; Ding and
Li 2009; Zhao and Li 2010), related to diminished wind
stress and vertical mixing in ocean surface layers during
the boreal summer. Chen et al. (2007) reported a fall per-
sistence barrier (FPB) of the SSTA in the South China
Sea (SCS), which is well recognized during the developing
phase of strong ENSO cases but becomes vague in weak
ENSO and non-ENSO cases. Zhao and Li (2009) showed
that the persistence barrier of SSTA exists not only in the
SCS but also in the vicinity of Indonesia. The SCS barrier
occurs around October and November, while the bar-
rier in the Indonesia region occurs around November and
Corresponding author address: Dr. Jianping Li, State Key Lab-
oratory of Numerical Modeling for Atmospheric Sciences and
Geophysical Fluid Dynamics, Institute of Atmospheric Physics,
Chinese Academy of Sciences, Beijing 10029, China.
E-mail: [email protected]
1 MAY 2011 D I N G A N D L I 2285
DOI: 10.1175/2011JCLI3784.1
� 2011 American Meteorological Society
December. These persistence barriers may strongly in-
fluence the skill of SST predictions when predictions are
made across the season in which the barriers occur.
SSTA variability in the tropical Atlantic (TA) is typ-
ically weaker than ENSO and is generally given little
attention in global seasonal forecast systems. Yet SSTA
variability in the TA is by no means negligible and could
have a strong influence on regional climate. A number of
well-known climatic phenomena in the TA sector (e.g.,
rainfall over northeast Brazil and sub-Saharan drought)
are closely linked to SSTA variability in the TA (Moura
and Shukla 1981; Folland et al. 1986; Xie and Carton 2004;
Taschetto and Wainer 2008). Given the importance of the
TA SSTA in terms of its influence on regional climate, it is
of interest to investigate the seasonal dependence of the
SSTA persistence in the TA. Recent studies have suggested
that the ENSO-related SSTA in the tropical eastern Pa-
cific has a significant remote influence on SSTA variability
in the TA sector (e.g., Enfield and Mayer 1997; Penland
and Matrosova 1998; Latif and Grotzner 2000; Saravanan
and Chang 2000; Elliott et al. 2001; Mo and Hakkinen
2001; Chang et al. 2003; Huang 2004). The main region
affected by ENSO is the northern tropical Atlantic (NTA),
where significant warming occurs approximately 4–5
months after the mature phase of Pacific warm events
(Enfield 1996; Enfield and Mayer 1997).
The mechanisms responsible for the link between
ENSO and the NTA variability have been extensively
studied (e.g., Nobre and Shukla 1996; Saravanan and
Chang 2000; Sutton et al. 2000; Wang 2002, 2004; Handoh
et al. 2006). There are at least two mechanisms via which
ENSO may influence the NTA region: 1) changes to the
tropical Walker and Hadley circulations and associated
patterns of deep convection (Bjerknes 1969; Oort and
Rasmusson 1970) and 2) tropical–extratropical interaction
via the Pacific–North American (PNA) teleconnection
pattern (Wallace and Gutzler 1981). Some controversy
remains regarding which of the above mechanisms plays a
major role in the link between ENSO and NTA variability
(Chang et al. 2006). Handoh et al. (2006) emphasized the
important role of tropical–extratropical interaction in in-
ducing anomalous SST over the NTA. Their analysis
suggests that the ENSO-associated NTA SSTA is forced
by an extratropical PNA-like wave train emanating from
the Pacific, rather than by a change in the Walker cir-
culation. Nobre and Shukla (1996) also found that off-
equatorial TA (warm or cold) events are unlikely to be
induced by a change in the Walker circulation. How-
ever, the modeling study of Saravanan and Chang (2000)
showed that the teleconnection between the eastern
tropical Pacific and the NTA is explained by an anom-
alous Walker circulation and that there is no need to
invoke any extratropical teleconnection mechanism
such as the PNA pattern. Wang (2002, 2004) suggested
that the Pacific El Nino can affect the NTA through the
Walker and Hadley circulations, favoring NTA warming
in the subsequent spring of Pacific El Nino years. Sutton
et al. (2000) speculated that the two mechanisms compete
in influencing the NTA variability, with different regions
of the NTA being dominated by different mechanisms:
north of 7.58N, the PNA pattern dominates; south of 7.58N,
changes in the Walker and Hadley circulations dominate.
In fact, both mechanisms generate a similar local re-
sponse of the NTA to ENSO: changes in surface winds
induce changes in surface heat fluxes that in turn generate
anomalous SST (Carton et al. 1996; Nobre and Shukla
1996; Chang et al. 1997; Saravanan and Chang 2000; Foltz
and McPhaden 2006). Bates (2008) reported that tropical
Atlantic variability is initiated by atmospheric perturba-
tions acting on the easterly trade winds, the presence of
which is necessary to trigger anomalies in various regions
of the TA (including the NTA). Specifically, a perturba-
tion of the northeast trade winds results in the SSTA in
the NTA region, which is generated by influences such as
ENSO, the North Atlantic Oscillation (NAO), and the
annual cycle (Bates 2010).
ENSO forces a delayed (relative to the mature phase
of ENSO) warming of the NTA SST via weakening of
the northeasterly trade winds and consequent reduction in
surface heat fluxes. This delayed warming forces a north-
ward displacement of the Atlantic intertropical conver-
gence zone (ITCZ), resulting in increased precipitation
over the Caribbean and reduced precipitation over north-
east Brazil during the boreal spring following the mature
phase of ENSO (Nobre and Shukla 1996; Giannini et al.
2001a). In this way, the ENSO information in winter is
passed to the following TA spring rainfall via the NTA
SSTA. The aforementioned studies have shown a close
linkage between ENSO and the NTA SSTA. However, a
detailed analysis of how ENSO influences the persistence
of the NTA SSTA is still lacking. The evolutionary features
of the NTA SSTA associated with different ENSO cases
may be different; therefore, it is interesting to investigate
the persistence features of the NTA SSTA associated with
different ENSO cases. A better understanding of the
persistence features of the NTA SSTA would result in
improved climate predictions for the TA. The dynamic
relationships that exist between the NTA SSTA and
ENSO give rise to two interesting questions: Does the
ENSO remote influence lead to a persistence barrier in
the NTA SSTA? If so, what are possible mechanisms re-
sponsible for the occurrence of this barrier? The objective
of the present study is to answer these two questions. The
present findings are expected to be helpful in studying
TA climate variability and in improving predictions of
the TA SSTA.
2286 J O U R N A L O F C L I M A T E VOLUME 24
2. Data and methodology
The basic SST dataset used in this study is version 2 of
monthly NOAA Extended Reconstructed SST (ERSST)
data on a 28 3 28 spatial grid for the period 1950–2002
(Smith and Reynolds 2004). The results obtained from
ERSST are verified using the Hadley Center Sea Ice and
SST dataset (HadISST) on a 18 3 18 spatial grid for the
same period. For the analyses of atmospheric circula-
tion, 2.58 3 2.58 National Centers for Environmental
Prediction–National Center for Atmospheric Research
reanalysis data (1950–2002) (Kalnay et al. 1996) are em-
ployed. Prior to analysis, the area-averaged SST data
were obtained over the NTA (58–158N, 208–608W). To
obtain the NTA SSTA, the climatological mean annual
cycle is removed from the area-averaged NTA SST time
series, which are then passed through a 7-yr high-pass
Gaussian filter. In this way, the annual cycle and decadal
components are removed from the NTA SST. Autocor-
relation analysis was used to measure the persistence of
the NTA SSTA, which is defined as the correlation be-
tween the time series of the starting calendar month
(January–December) and the time series of a succeeding
lag month in a period of given duration.
3. Persistence characteristics of the NTA SST
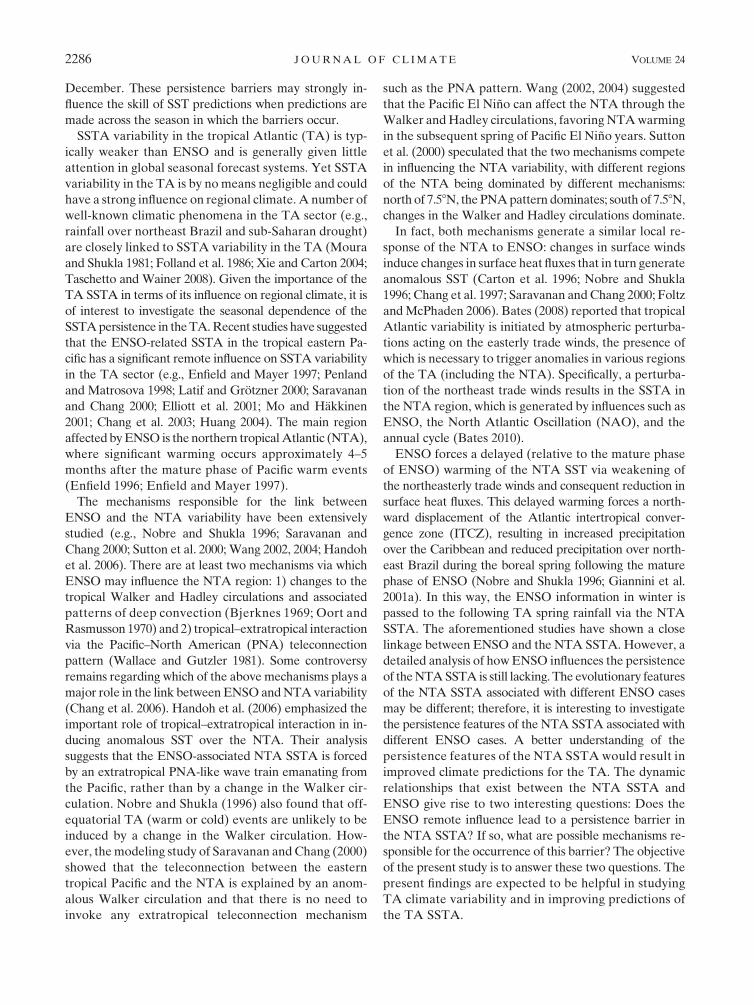
Figure 1a shows the autocorrelations of the NTA SSTA
from the ERSST dataset for the entire analysis period
(1950–2002). In Fig. 1a, the reference year [year (0)] is
assigned as each year from 1951 to 2002, while the pre-
vious year [year (21)] is assigned as each year from 1950
to 2001. An annual cycle, from June of year (21) to May of
year (0), is considered when calculating the autocorrela-
tions. Autocorrelations significant at the 0.05 level ($0.27)
are shaded in the figure. The time taken for autocorrela-
tions to attain the 0.05 significance level can be regarded as
a measure of SST persistence starting from that month.
Figure 1b is similar to plots in Webster and Yang (1992),
which contains the same information as Fig. 1a but clearly
shows the occurrence time of a persistence barrier. Ac-
cording to Webster and Yang (1992), the persistence bar-
rier refers to a phenomenon of autocorrelations showing
FIG. 1. (a) Autocorrelations of the area-averaged SSTA over the NTA from the ERSST dataset as a function of
starting calendar month and lag time for the period 1950–2002. Contour interval is 0.1; the zero contour is highlighted.
Autocorrelations significant at the 0.05 level ($0.27) are shaded. (b) As in (a), but for autocorrelation curves of the
NTA SSTA. Each curve has been shifted to align the starting month (shown at the top, where FAJAOD is February,
April, June, August, October, December) with the corresponding lag month (x axis). The horizontal dashed line
indicates the 0.05 significance level. (c) As in (a), but (b) for the NTA SSTA from the HadISST dataset and (d) for the
NTA SSTA from the HadISST dataset.
1 MAY 2011 D I N G A N D L I 2287

a rapid and significant decrease (autocorrelation reduces to
half its value) from one month to the next, regardless of the
starting month.
Figure 1a shows that the NTA SSTA has the high
persistence in the starting months of June and July in year
(21) (the coefficients fall below the 0.05 significance level
after about 6 months). From June to December of year
(21), the persistence of the NTA SSTA shows a contin-
uous drop, with a minimum occurring from December to
January. From January to February of year (0), the per-
sistence of the NTA SSTA shows a sharp rise. These re-
sults clearly demonstrate that the persistence of the NTA
SSTA reaches a minimum in December and January (the
coefficients fall below the 0.05 significance level after
about 2 months). From Fig. 1b, autocorrelations of the
NTA SSTA show a rapid decrease in December–January,
regardless of the starting month. Although autocorrela-
tions starting from February to May lose statistical signif-
icance after 4–5 months, they still experience a significant
decrease from a positive value to near zero in December–
January after significance is lost. Moreover, the autocor-
relation value in December is about half or less of that in
January for most of the starting months (Table not shown).
According to the Webster and Yang (1992) criterion,
there is a WPB in the NTA SSTA. Autocorrelations
calculated from the Met Office Hadley Centre Sea Ice
and SST (HadISST) dataset (Figs. 1c and 1d) are very
similar to those shown in Figs. 1a and 1b, confirming the
results obtained from the ERSST dataset.
To investigate the relationship between ENSO and the
NTA WPB, ENSO cases are classified into three types
according to the intensity of the winter [December–
February (DJF)] SSTA in the Nino-3 region. The year
assigned to each winter is that including January and
February. The assigned year and the previous year are
referred to as year (0) and year (21), respectively. A
strong (weak, normal) ENSO case is defined as a year in
which the winter Nino-3 SSTA has an intensity greater
than 1.0 (0.5–1.0, smaller than 0.5) standard deviation
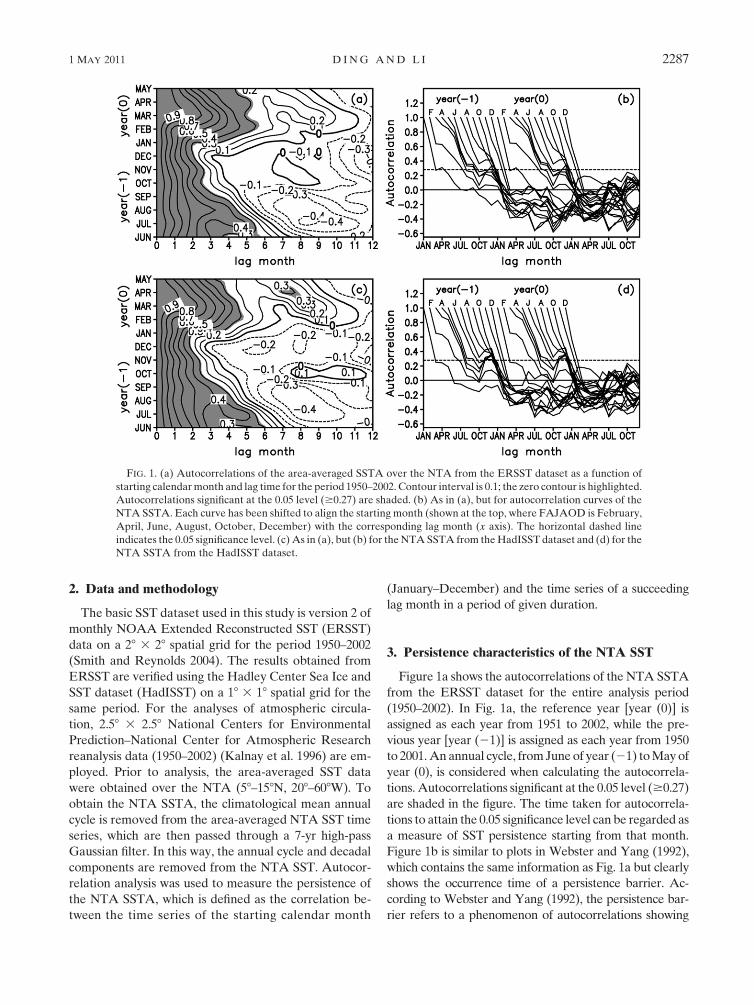
(SD) of its 1950–2002 time series (Table 1). Figure 2 ex-
amines the persistence characteristics of the NTA SSTA
for these three cases. For strong ENSO cases (Fig. 2a), the
NTA SSTA shows a minimum persistence during
December and January, while it shows a relatively high
persistence for other starting months. Autocorrelations
of the NTA SSTA for strong ENSO cases, regardless of
the starting month, decrease quickly from positive values
to negative values in December–January (Fig. 2b). Clearly,
there exists a well-defined WPB in the NTA SSTA for
strong ENSO cases. For weak ENSO (Fig. 2c) and normal
cases (Fig. 2e), a two-humped structure is present with
longer persistence in around July–August and March–
April (compared with other starting months). The NTA
SSTA shows relatively low persistence from September
to February during normal cases, while it shows a rela-
tively low persistence around February, May, and October
during weak ENSO cases. In both cases, the minimum
persistence does not occur in December or January;
autocorrelations starting from January to October do
not show a rapid decrease in December–January (Figs.
2d,f). Although the sign structure appears similar dur-
ing strong ENSO and normal cases (Figs. 2a,c), it will
be shown later that the evolutionary features of the
NTA SSTA during normal cases are completely dif-
ferent from those during strong ENSO cases (see Fig. 7
in Section 4). The WPB of the NTA SSTA is absent in
weak ENSO and normal cases.
To further investigate the influence of ENSO on the
persistence of the NTA SSTA, the ENSO signal is re-
moved from the original NTA SSTA by a multiple linear
regression method, yielding the residual NTA SSTA.
Although it is impossible to remove all ENSO aspects
from the original NTA SSTA by the multiple linear re-
gression method, linear removal of the ENSO signal can
reduce the influence of ENSO on the persistence of the
NTA SSTA to a certain extent. Figure 3 shows the au-
tocorrelations of the residual NTA SSTA for the entire
analysis period 1950–2002. With removal of the ENSO
signal, the persistence characteristics of the NTA SSTA
show a prominent change, and the WPB phenomenon
becomes less significant than that obtained from the
original NTA SSTA, as shown in Fig. 1. The difference
between Fig. 3a and Fig. 1a shows that, with the ENSO
signal removed, autocorrelations starting from November
to January are largely enhanced for lag times of 1–4
months; those starting from July to September are slightly
enhanced for lag times of 1–4 months (a marked increase
for lag times greater than 5 months is due to the negative
correlation not being as strong in Fig. 3a as in Fig. 1a, not
due to the NTA SSTA persisting longer) (Fig. 4). On the
TABLE 1. Member years of strong ENSO, weak ENSO, and normal
(non-ENSO) cases.
Strong ENSO El Nino 1958, 1966, 1973, 1983, 1987, 1992,
1995, 1998
La Nina 1956, 1968, 1971, 1974, 1976, 1985,
1989, 1999, 2000
Weak ENSO El Nino 1964, 1969, 1970, 1977, 1978, 1980,
1988, 1993
La Nina 1951, 1955, 1963, 1965, 1972, 1975,
1996, 1997
Normal Positive 1952, 1953, 1954, 1959, 1979, 1982,
1990, 1991, 1994
Negative 1957, 1960, 1961, 1962, 1967, 1981,
1984, 1986, 2001, 2002
2288 J O U R N A L O F C L I M A T E VOLUME 24
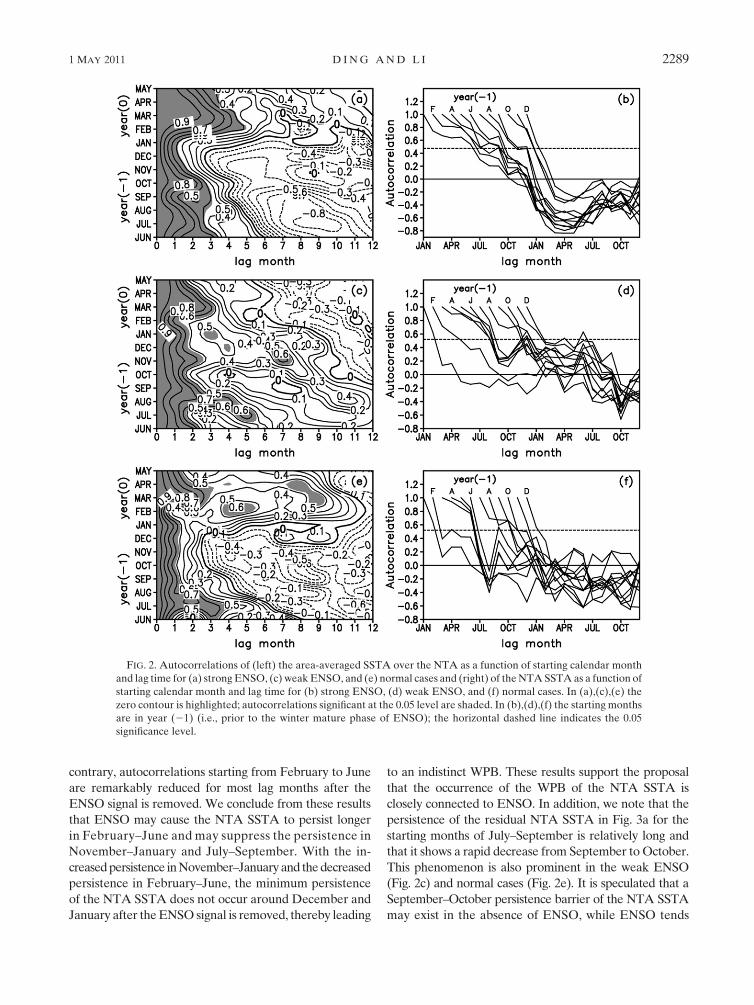
contrary, autocorrelations starting from February to June
are remarkably reduced for most lag months after the
ENSO signal is removed. We conclude from these results
that ENSO may cause the NTA SSTA to persist longer
in February–June and may suppress the persistence in
November–January and July–September. With the in-
creased persistence in November–January and the decreased
persistence in February–June, the minimum persistence
of the NTA SSTA does not occur around December and
January after the ENSO signal is removed, thereby leading
to an indistinct WPB. These results support the proposal
that the occurrence of the WPB of the NTA SSTA is
closely connected to ENSO. In addition, we note that the
persistence of the residual NTA SSTA in Fig. 3a for the
starting months of July–September is relatively long and
that it shows a rapid decrease from September to October.
This phenomenon is also prominent in the weak ENSO
(Fig. 2c) and normal cases (Fig. 2e). It is speculated that a
September–October persistence barrier of the NTA SSTA
may exist in the absence of ENSO, while ENSO tends
FIG. 2. Autocorrelations of (left) the area-averaged SSTA over the NTA as a function of starting calendar month
and lag time for (a) strong ENSO, (c) weak ENSO, and (e) normal cases and (right) of the NTA SSTA as a function of
starting calendar month and lag time for (b) strong ENSO, (d) weak ENSO, and (f) normal cases. In (a),(c),(e) the
zero contour is highlighted; autocorrelations significant at the 0.05 level are shaded. In (b),(d),(f) the starting months
are in year (21) (i.e., prior to the winter mature phase of ENSO); the horizontal dashed line indicates the 0.05
significance level.
1 MAY 2011 D I N G A N D L I 2289

to remove this barrier. The study of such a September–
October barrier is beyond the objective of the present
paper, but is a good topic for future research.
Is the WPB robust in the NTA region? According to
Enfield and Mayer (1997), ENSO exerts a remote influence
over an extensive region of the NTA from northwest Af-
rica to the Caribbean Sea. Autocorrelations of the area-
averaged SST over a larger region of the NTA (58–208N,
108–708W) including the coast of northwest Africa and the
eastern part of the Caribbean Sea) were computed for all
cases and strong ENSO cases. Their persistence features
(not shown) are relatively consistent with those obtained
using the original SST index. The results indicate that the
WPB is not sensitive to the analysis domain and is robust
in the NTA region.
4. Evolution of the NTA SSTA associatedwith ENSO
Previous studies have discussed the evolution of the
NTA SSTA pattern and potential influences (including
ENSO) in different seasons (e.g., Huang and Shukla
2005; Handoh et al. 2006; Bates 2008). However, few
studies have performed detailed investigations of the
evolutionary features of the NTA SSTA associated with
different ENSO cases, which is necessary to identify the
mechanisms that induce the NTA WPB. In this section,
we compare in detail the evolutionary features of the
NTA SSTA among different ENSO cases, with the aim of
identifying the mechanisms that induce the NTA WPB.
Figure 5 shows composite difference patterns of the
SSTA (strong El Nino minus strong La Nina) during the
developing, mature, and decaying phases of ENSO
[October of year (21) to May of year (0)]. In the tropical
Pacific, the SSTA patterns reflect the dominant features
of El Nino evolution. The central and eastern equatorial
Pacific is dominated by strong and sustained warming,
while the tropical western Pacific shows a minor cooling.
The El Nino reaches its mature phase during December
and January when the maximum warming occurs in the
eastern equatorial Pacific. After February, the significant
warming in the eastern equatorial Pacific begins to weaken
and El Nino enters its decaying stage. The NTA shows a
different pattern of SSTA change. Before December, the
NTA is dominated by weak negative SSTA. An anoma-
lous warming in the NTA begins to emerge in January and
becomes significant in February. It extends southward to
cover the entire NTA in March and then persist for several
months. The maximum warming center is located off the
coast of northwest Africa, stretching farther westward into
the central NTA from March to May. In general, the
FIG. 3. As in Fig. 1a and Fig. 1b, respectively, but for the residual NTA SSTA obtained by removing the ENSO
signal from the original NTA SSTA. The lead–lag correlations with Nino-3 SSTA show that the NTA SSTA has
significant correlations with the Nino-3 SSTA with lead times of 3–5 months. Therefore, the ENSO signal in the NTA
SSTA is obtained by regressing the NTA SSTA upon the Nino-3 SSTA with lead times of 3–5 months.
FIG. 4. Difference between autocorrelations obtained from the
residual NTA SSTA (as in Fig. 3a) and those obtained from the
original NTA SSTA (as in Fig. 1a). Contour interval is 0.05; the dif-
ference greater than 0.1 or less than20.1 is shaded.
2290 J O U R N A L O F C L I M A T E VOLUME 24
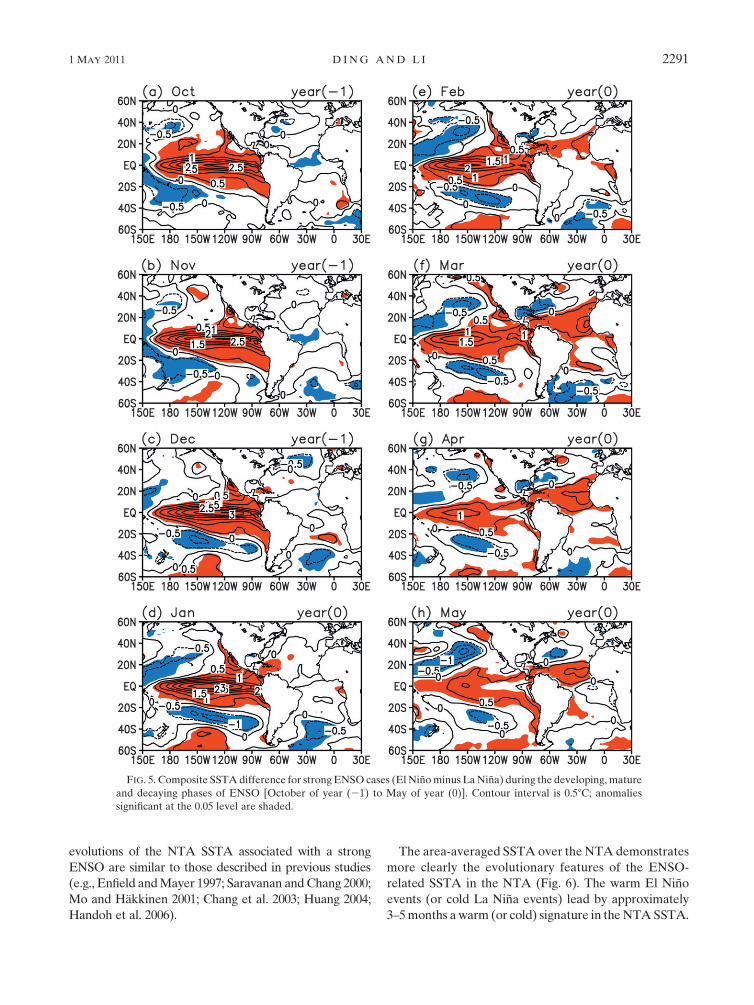
evolutions of the NTA SSTA associated with a strong
ENSO are similar to those described in previous studies
(e.g., Enfield and Mayer 1997; Saravanan and Chang 2000;
Mo and Hakkinen 2001; Chang et al. 2003; Huang 2004;
Handoh et al. 2006).
The area-averaged SSTA over the NTA demonstrates
more clearly the evolutionary features of the ENSO-
related SSTA in the NTA (Fig. 6). The warm El Nino
events (or cold La Nina events) lead by approximately
3–5 months a warm (or cold) signature in the NTA SSTA.
FIG. 5. Composite SSTA difference for strong ENSO cases (El Nino minus La Nina) during the developing, mature
and decaying phases of ENSO [October of year (21) to May of year (0)]. Contour interval is 0.58C; anomalies
significant at the 0.05 level are shaded.
1 MAY 2011 D I N G A N D L I 2291
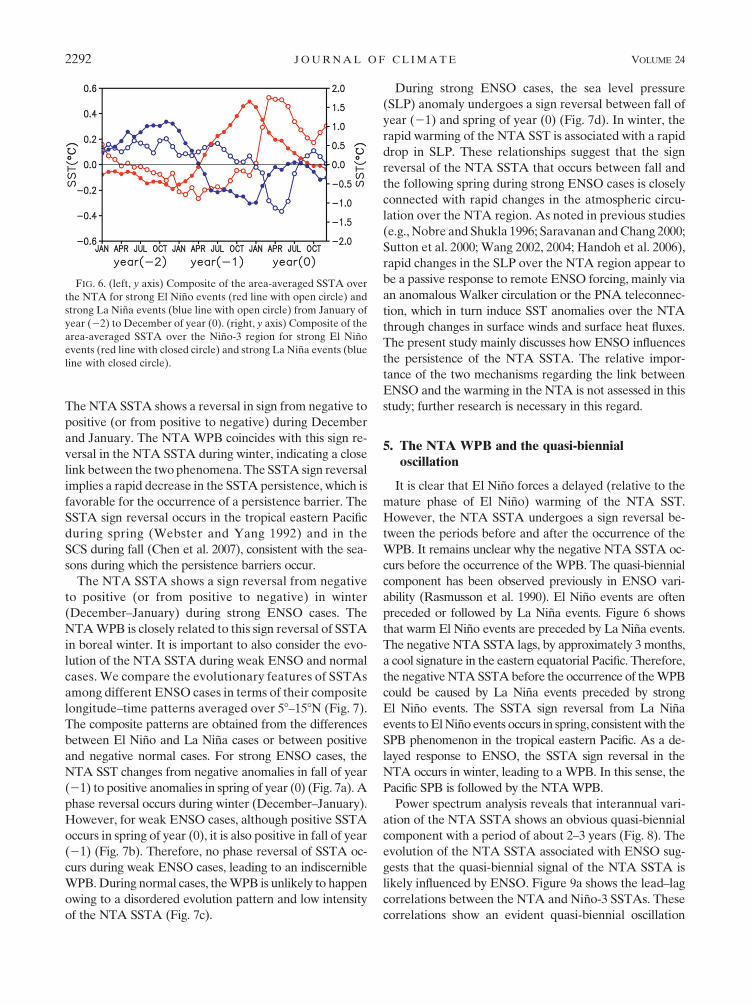
The NTA SSTA shows a reversal in sign from negative to
positive (or from positive to negative) during December
and January. The NTA WPB coincides with this sign re-
versal in the NTA SSTA during winter, indicating a close
link between the two phenomena. The SSTA sign reversal
implies a rapid decrease in the SSTA persistence, which is
favorable for the occurrence of a persistence barrier. The
SSTA sign reversal occurs in the tropical eastern Pacific
during spring (Webster and Yang 1992) and in the
SCS during fall (Chen et al. 2007), consistent with the sea-
sons during which the persistence barriers occur.
The NTA SSTA shows a sign reversal from negative
to positive (or from positive to negative) in winter
(December–January) during strong ENSO cases. The
NTA WPB is closely related to this sign reversal of SSTA
in boreal winter. It is important to also consider the evo-
lution of the NTA SSTA during weak ENSO and normal
cases. We compare the evolutionary features of SSTAs
among different ENSO cases in terms of their composite
longitude–time patterns averaged over 58–158N (Fig. 7).
The composite patterns are obtained from the differences
between El Nino and La Nina cases or between positive
and negative normal cases. For strong ENSO cases, the
NTA SST changes from negative anomalies in fall of year
(21) to positive anomalies in spring of year (0) (Fig. 7a). A
phase reversal occurs during winter (December–January).
However, for weak ENSO cases, although positive SSTA
occurs in spring of year (0), it is also positive in fall of year
(21) (Fig. 7b). Therefore, no phase reversal of SSTA oc-
curs during weak ENSO cases, leading to an indiscernible
WPB. During normal cases, the WPB is unlikely to happen
owing to a disordered evolution pattern and low intensity
of the NTA SSTA (Fig. 7c).
During strong ENSO cases, the sea level pressure
(SLP) anomaly undergoes a sign reversal between fall of
year (21) and spring of year (0) (Fig. 7d). In winter, the
rapid warming of the NTA SST is associated with a rapid
drop in SLP. These relationships suggest that the sign
reversal of the NTA SSTA that occurs between fall and
the following spring during strong ENSO cases is closely
connected with rapid changes in the atmospheric circu-
lation over the NTA region. As noted in previous studies
(e.g., Nobre and Shukla 1996; Saravanan and Chang 2000;
Sutton et al. 2000; Wang 2002, 2004; Handoh et al. 2006),
rapid changes in the SLP over the NTA region appear to
be a passive response to remote ENSO forcing, mainly via
an anomalous Walker circulation or the PNA teleconnec-
tion, which in turn induce SST anomalies over the NTA
through changes in surface winds and surface heat fluxes.
The present study mainly discusses how ENSO influences
the persistence of the NTA SSTA. The relative impor-
tance of the two mechanisms regarding the link between
ENSO and the warming in the NTA is not assessed in this
study; further research is necessary in this regard.
5. The NTA WPB and the quasi-biennialoscillation
It is clear that El Nino forces a delayed (relative to the
mature phase of El Nino) warming of the NTA SST.
However, the NTA SSTA undergoes a sign reversal be-
tween the periods before and after the occurrence of the
WPB. It remains unclear why the negative NTA SSTA oc-
curs before the occurrence of the WPB. The quasi-biennial
component has been observed previously in ENSO vari-
ability (Rasmusson et al. 1990). El Nino events are often
preceded or followed by La Nina events. Figure 6 shows
that warm El Nino events are preceded by La Nina events.
The negative NTA SSTA lags, by approximately 3 months,
a cool signature in the eastern equatorial Pacific. Therefore,
the negative NTA SSTA before the occurrence of the WPB
could be caused by La Nina events preceded by strong
El Nino events. The SSTA sign reversal from La Nina
events to El Nino events occurs in spring, consistent with the
SPB phenomenon in the tropical eastern Pacific. As a de-
layed response to ENSO, the SSTA sign reversal in the
NTA occurs in winter, leading to a WPB. In this sense, the
Pacific SPB is followed by the NTA WPB.
Power spectrum analysis reveals that interannual vari-
ation of the NTA SSTA shows an obvious quasi-biennial
component with a period of about 2–3 years (Fig. 8). The
evolution of the NTA SSTA associated with ENSO sug-
gests that the quasi-biennial signal of the NTA SSTA is
likely influenced by ENSO. Figure 9a shows the lead–lag
correlations between the NTA and Nino-3 SSTAs. These
correlations show an evident quasi-biennial oscillation
FIG. 6. (left, y axis) Composite of the area-averaged SSTA over
the NTA for strong El Nino events (red line with open circle) and
strong La Nina events (blue line with open circle) from January of
year (22) to December of year (0). (right, y axis) Composite of the
area-averaged SSTA over the Nino-3 region for strong El Nino
events (red line with closed circle) and strong La Nina events (blue
line with closed circle).
2292 J O U R N A L O F C L I M A T E VOLUME 24

FIG. 7. Composite longitude–time patterns of SST–SLP difference anomalies averaged over 58–158N for (a),(d)
strong ENSO (El Nino minus La Nina); (b),(e) weak ENSO (El Nino minus La Nina); and (c),(f) normal (positive
minus negative) cases. Contour intervals are 0.18C for SSTA and 0.2 mb for SLP anomaly; positive values are shaded.
The analyzed NTA region is bounded by two thick vertical lines.
1 MAY 2011 D I N G A N D L I 2293

(QBO) relationship throughout the year, except during
winter months (December and January) when the NTA
SSTA has a weak lead–lag correlation with ENSO.
Clarke and Van Gorder (1999) reported that the biennial
oscillation embedded in the ENSO index might be respon-
sible for the SPB in the eastern equatorial Pacific, which is
phase locked to the calendar year. The quasi-biennial os-
cillation of the NTA SSTA also tends to be locked to the
calendar year, with ENSO peaking in winter and the NTA
SSTA peaking in the following spring (Fig. 6). These find-
ings lead us to speculate that the NTA WPB might result
from the quasi-biennial signal of the NTA SSTA, which is
closely linked to ENSO. As shown in Fig. 7, the NTA WPB
is well developed when the quasi-biennial variability of the
NTA SSTA is prominent during strong ENSO cases. In
contrast, the NTA WPB is poorly developed when the
quasi-biennial variability of the NTA SSTA becomes in-
distinct during weak ENSO and normal cases. These results
indicate the possible existence of a systematic relationship
between the WPB, the NTA SST, and the quasi-biennial
component of ENSO as follows: a strong El Nino event is
usually preceded by a strong La Nina event, which leads to
a sign reversal of the NTA SSTA in winter as a delayed
response to ENSO, ultimately resulting in the NTA WPB.
It is necessary to further examine the dynamic relationships
among these phenomena and to consider the implications
of these relationships in terms of improving predictions of
the NTA SSTA and ENSO.
6. Influences of the NAO on the NTA WPB
In addition to the influence of ENSO, the SSTA over
the NTA area is moderated by atmospheric circulation
and heat flux anomalies related to the NAO. The heat
flux anomalies associated with the NAO can enhance or
diminish the impact of ENSO, depending on the NAO
phase (e.g., Grotzner et al. 1998; Giannini et al. 2001b;
Czaja et al. 2002). It has been demonstrated that atmo-
spheric anomalies associated with NAO produce tri-
polelike SSTA in the North Atlantic (Deser and Timlin
1997; Marshall et al. 2001; Pan 2005). As the tropical
Atlantic signature of the NAO-forced SST tripole in the
North Atlantic, the NTA SST variability is also modulated
by the NAO. This leads us to question the influence of
NAO on the NTA WPB. The NAO index (NAOI) used in
this study is defined as the difference in the normalized
monthly SLP zonal-averaged over the North Atlantic sec-
tor between 358 and 658N from 808W to 308E (Li and Wang
2003). According to the winter (DJF) NAOI, positive
FIG. 8. Power spectrum (dotted solid line) of the monthly NTA
SSTA time series for the period 1950–2002. The dashed line shows
the 0.05 confidence upper limit of red noise spectrum.
FIG. 9. (a) Lead–lag correlations between the area-averaged
SSTAs over the NTA and the Nino-3 region for the period 1950–
2002; (b) lead–lag correlations between the area-averaged SSTA
over the NTA and the NAO index. The NTA SSTA from June of
year (21) to May of year (0) is used as the reference to compute the
lead–lag correlation coefficients. Contour interval is 0.1; correla-
tions significant at the 0.05 level are shaded.
2294 J O U R N A L O F C L I M A T E VOLUME 24
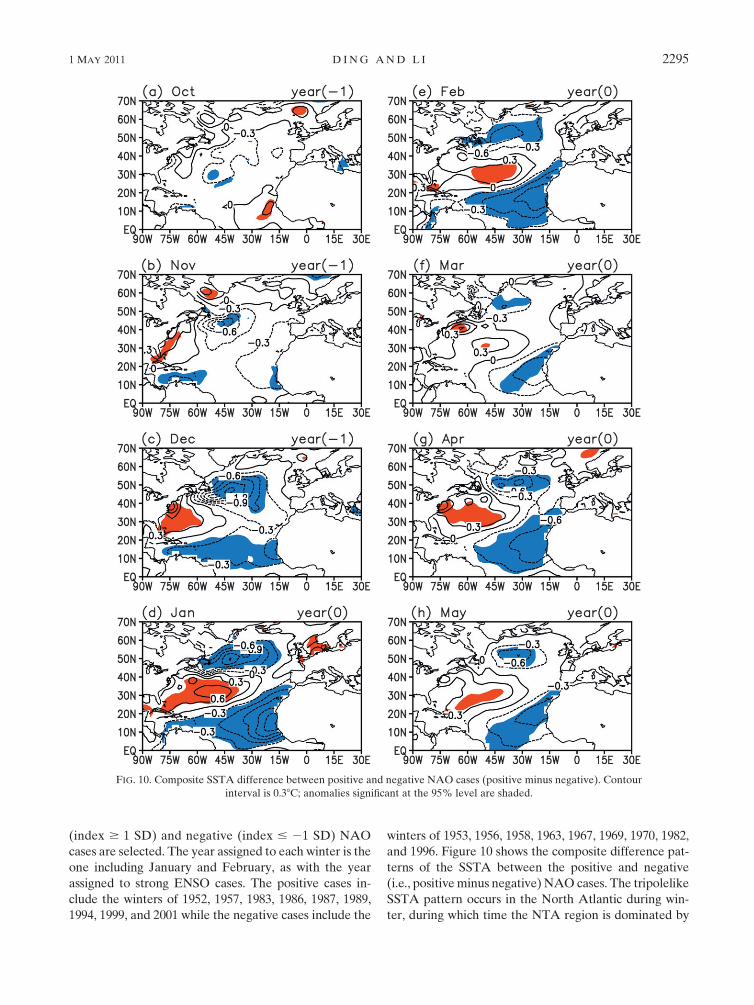
(index $ 1 SD) and negative (index # 21 SD) NAO
cases are selected. The year assigned to each winter is the
one including January and February, as with the year
assigned to strong ENSO cases. The positive cases in-
clude the winters of 1952, 1957, 1983, 1986, 1987, 1989,
1994, 1999, and 2001 while the negative cases include the
winters of 1953, 1956, 1958, 1963, 1967, 1969, 1970, 1982,
and 1996. Figure 10 shows the composite difference pat-
terns of the SSTA between the positive and negative
(i.e., positive minus negative) NAO cases. The tripolelike
SSTA pattern occurs in the North Atlantic during win-
ter, during which time the NTA region is dominated by
FIG. 10. Composite SSTA difference between positive and negative NAO cases (positive minus negative). Contour
interval is 0.38C; anomalies significant at the 95% level are shaded.
1 MAY 2011 D I N G A N D L I 2295
negative SSTA. The tripolelike SSTA pattern persists
from winter through spring, meaning that the NTA SSTA
associated with NAO does not experience a persistence
barrier during winter. In contrast, it shows good persis-
tence for the starting months of December and January.
Therefore, in terms of the evolution of the NTA SSTA
associated with the NAO, it appears that the NAO en-
hances persistence of the NTA SSTA during winter, which
is unfavorable for the occurrence of the WPB.
However, because ENSO has greater influence in the
tropics and subtropics, whereas the NAO dominates the
midhigh latitudes (Kushnir et al. 2006), the NAO influ-
ence on the persistence of the NTA SSTA is generally
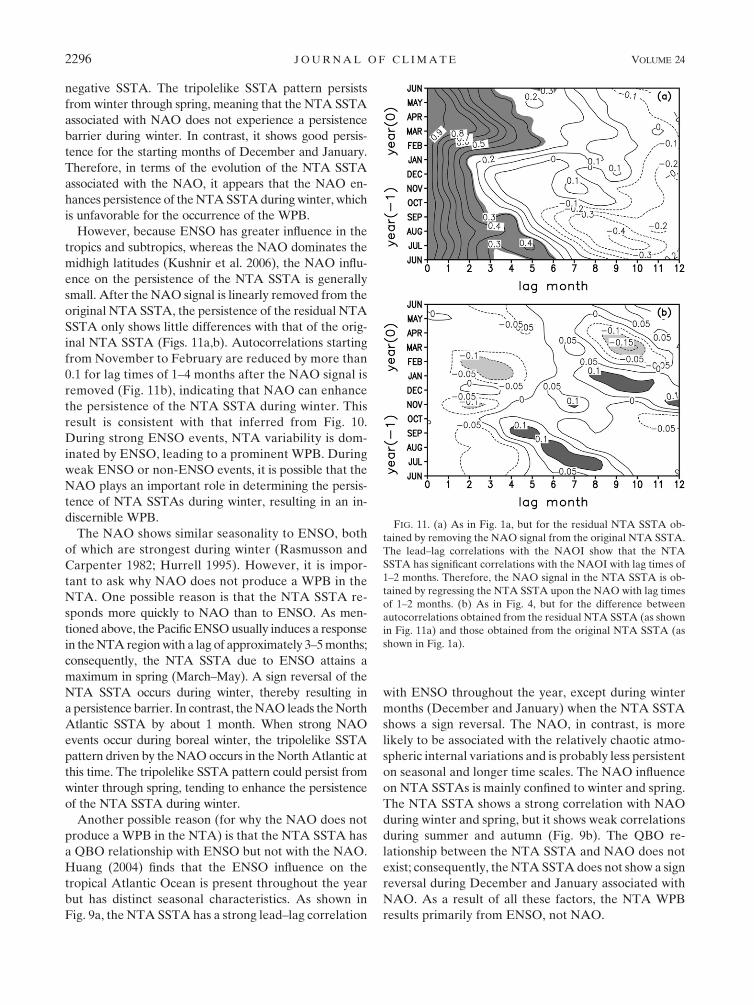
small. After the NAO signal is linearly removed from the
original NTA SSTA, the persistence of the residual NTA
SSTA only shows little differences with that of the orig-
inal NTA SSTA (Figs. 11a,b). Autocorrelations starting
from November to February are reduced by more than
0.1 for lag times of 1–4 months after the NAO signal is
removed (Fig. 11b), indicating that NAO can enhance
the persistence of the NTA SSTA during winter. This
result is consistent with that inferred from Fig. 10.
During strong ENSO events, NTA variability is dom-
inated by ENSO, leading to a prominent WPB. During
weak ENSO or non-ENSO events, it is possible that the
NAO plays an important role in determining the persis-
tence of NTA SSTAs during winter, resulting in an in-
discernible WPB.
The NAO shows similar seasonality to ENSO, both
of which are strongest during winter (Rasmusson and
Carpenter 1982; Hurrell 1995). However, it is impor-
tant to ask why NAO does not produce a WPB in the
NTA. One possible reason is that the NTA SSTA re-
sponds more quickly to NAO than to ENSO. As men-
tioned above, the Pacific ENSO usually induces a response
in the NTA region with a lag of approximately 3–5 months;
consequently, the NTA SSTA due to ENSO attains a
maximum in spring (March–May). A sign reversal of the
NTA SSTA occurs during winter, thereby resulting in
a persistence barrier. In contrast, the NAO leads the North
Atlantic SSTA by about 1 month. When strong NAO
events occur during boreal winter, the tripolelike SSTA
pattern driven by the NAO occurs in the North Atlantic at
this time. The tripolelike SSTA pattern could persist from
winter through spring, tending to enhance the persistence
of the NTA SSTA during winter.
Another possible reason (for why the NAO does not
produce a WPB in the NTA) is that the NTA SSTA has
a QBO relationship with ENSO but not with the NAO.
Huang (2004) finds that the ENSO influence on the
tropical Atlantic Ocean is present throughout the year
but has distinct seasonal characteristics. As shown in
Fig. 9a, the NTA SSTA has a strong lead–lag correlation
with ENSO throughout the year, except during winter
months (December and January) when the NTA SSTA
shows a sign reversal. The NAO, in contrast, is more
likely to be associated with the relatively chaotic atmo-
spheric internal variations and is probably less persistent
on seasonal and longer time scales. The NAO influence
on NTA SSTAs is mainly confined to winter and spring.
The NTA SSTA shows a strong correlation with NAO
during winter and spring, but it shows weak correlations
during summer and autumn (Fig. 9b). The QBO re-
lationship between the NTA SSTA and NAO does not
exist; consequently, the NTA SSTA does not show a sign
reversal during December and January associated with
NAO. As a result of all these factors, the NTA WPB
results primarily from ENSO, not NAO.
FIG. 11. (a) As in Fig. 1a, but for the residual NTA SSTA ob-
tained by removing the NAO signal from the original NTA SSTA.
The lead–lag correlations with the NAOI show that the NTA
SSTA has significant correlations with the NAOI with lag times of
1–2 months. Therefore, the NAO signal in the NTA SSTA is ob-
tained by regressing the NTA SSTA upon the NAO with lag times
of 1–2 months. (b) As in Fig. 4, but for the difference between
autocorrelations obtained from the residual NTA SSTA (as shown
in Fig. 11a) and those obtained from the original NTA SSTA (as
shown in Fig. 1a).
2296 J O U R N A L O F C L I M A T E VOLUME 24
7. Summary and discussion
This study investigated the persistence characteristics
of the SST anomaly (SSTA) in the northern tropical At-
lantic (NTA). Autocorrelations of the NTA SSTA (area
mean of the domain 58–158N, 208–608W) for the period
195022002 show a rapid decrease in December–January,
regardless of the starting month, revealing the existence
of a winter persistence barrier (WPB) in the NTA SST.
The NTA WPB is prominent during the mature phase of
strong ENSO cases but becomes indistinct in the weak
ENSO and normal (i.e., non-ENSO) cases, indicating a
close connection between the NTA WPB and ENSO.
During strong El Nino cases, the NTA SSTA experiences
a reversal in sign and rapid warming during winter. This
SSTA sign reversal may reduce the persistence, creating
favorable conditions for the occurrence of the NTA WPB.
The NTA SSTA undergoes a sign reversal between the
periods before and after the occurrence of the WPB,
which implicates a possible connection between the WPB
and the quasi-biennial oscillation (QBO) of the NTA
SST. There may be a dynamic relationship among the
Pacific ENSO, the NTA SSTA, and the NTA WPB on the
quasi-biennial time scale as follows: a strong El Nino
event is usually preceded by a strong La Nina event,
which leads to a sign reversal of the NTA SSTA in winter
as a delayed response to ENSO, ultimately resulting in the
NTA WPB. During weak ENSO and normal cases, the
NTA SSTA shows weak intensity and no phase reversal in
winter; and the WPB of the NTA SST becomes in-
discernible in these cases.
Because the atmospheric circulation and heat flux
anomalies related to the North Atlantic Oscillation
(NAO) modulate the SSTA over the NTA area, the NTA
WPB also tends to be affected by the NAO. The present
results show that NAO events are able to enhance the
persistence of the NTA SSTA during winter, thereby
weakening the NTA WPB. However, because ENSO has
greater influence in the tropics and subtropics, whereas the
NAO dominates the midhigh latitudes, the NAO tends to
weaken (but not completely eliminate) the NTA WPB.
In addition to remote forcing of ENSO and the NAO,
regional ocean–atmosphere interaction is a dominant
factor affecting climate variability in the NTA. Regional
ocean–atmosphere interaction includes a positive ther-
modynamic feedback among the surface trade wind,
evaporation, and SST (WES) (Chang et al. 1997; Xie
1999) and dynamic feedback among the zonal wind,
oceanic thermocline, and SST along the equator (Zebiak
1993). Recent studies have suggested that regional ocean–
atmosphere interaction can be effective in producing
anomalous SST fluctuations in the tropical Atlantic
Ocean. Huang et al. (2002) noted that the SSTA in the
NTA is strongly affected by the Pacific ENSO with local
coupling accounting for an enhanced effect. Chang et al.
(1998) investigated the predictability of SST in the NTA
region, reporting a short lead time for predictability re-
lated to ENSO and enhanced predictability due to re-
gional ocean–atmosphere interactions within the tropical
Atlantic. Huang and Shukla (2005) found that the NTA
SSTA is likely to persist within the subtropics for more
than one season after it is generated, possibly caused by
a local positive feedback between SST anomalies and the
atmospheric anticyclone in the subtropics.
The above findings lead us to speculate that regional
ocean–atmosphere interaction may have a strong influ-
ence on the persistence of the NTA SST. The evolutions
of the NTA SSTA are driven by several mechanisms with
comparable influences, involving both regional ocean–
atmosphere interaction and remote forcings. These mech-
anisms may be seasonally dependent, which in turn
determines the seasonal variations of SST persistence.
Because it is difficult to isolate the individual influence
of various mechanisms on SST persistence in the NTA
region, further study is required using a coupling ocean–
atmosphere general circulation model (CGCM).
Huang (2004) and Bates (2008, 2010) showed that the
tropical Atlantic variability is composed of three major
patterns: the southern tropical Atlantic (STA) pattern
with SST variability expanding from the Angola coast to
the central equatorial Atlantic and the Gulf of Guinea, the
northern tropical Atlantic (NTA) pattern centered near
the northern African coast, and the southern subtropical
Atlantic (SSA) pattern in the open subtropical Atlantic.
This study identifies a WPB associated with ENSO in the
NTA. However, ENSO has been shown to affect SST in
all regions of the tropical Atlantic, including the STA and
the SSA (Enfield and Mayer 1997; Saravanan and Chang
2000; Elliott et al. 2001; Mo and Hakkinen 2001; Huang
2004; Bates 2008, 2010). Warming in the Gulf of Guinea
has been shown to be related to ENSO warming (Horel
et al. 1986; Carton and Huang 1994; Latif and Barnett
1995; Latif and Grotzner 2000). The connection between
ENSO and SSA is thought to occur via a Pacific–South
American (PSA) pattern (Mo and Higgins 1998; Bates
2010). Apart from ENSO, the SSA region is also affected
by extratropical fluctuations (Bates 2010), such as the
southern annular mode (SAM) (Gong and Wang 1999).
The remote forcings of ENSO and SAM show seasonal
influences on the SSA. Ciasto and Thompson (2008)
found the influence in the South Atlantic to be mainly
from ENSO in austral winter and SAM in austral summer.
The mechanisms driving the SST fluctuations in the STA
are similar to those in the NTA. However, the ENSO
connection is thought to be weaker over the South At-
lantic than over the North Atlantic (Enfield and Mayer
1 MAY 2011 D I N G A N D L I 2297

1997; Klein et al. 1999; Huang et al. 2004; Xie and Carton
2004). Bates (2008) showed that SSTA in the NTA region
is related to a weakening of the northeast trade winds and
that the wind stress anomalies act to enhance and main-
tain the NTA variability through the WES mechanism,
which can lead to variability in the STA region through
the influence of cross-equatorial winds. From the findings
of Bates we can conclude that the SST persistence in the
STA may be related to SST persistence in the NTA. A
more thorough study of SST persistence remains to be
done for the South Atlantic at a later date.
Another important point to be considered is the in-
fluence of the WPB on predictions of the NTA SSTA. It is
well known that the spring persistence barrier (SPB) re-
sults in a decrease in forecast skill for most ENSO forecast
models during boreal spring (March–May). If predictions
are made across the boreal winter, it is highly likely that the
NTA SSTA affected by the WPB has a low forecast skill.
However, considering the delayed response of the NTA
region to ENSO, the winter ENSO SST may be used to
predict the ensuing spring and summer NTA SSTA. We
speculate that, if strong El Nino events could be success-
fully predicted, warming in the NTA would be expected
and the influence of the WPB on predictions of the NTA
SSTA would be reduced. Further study is required to verify
this speculation and to perform a concrete analysis of the
influence of the WPB on predictions of the NTA SSTA.
Acknowledgments. We wish to thank two anonymous
reviewers for helpful comments and suggestions, which
helped to substantially improve the quality of this paper.
This research was funded by an NSFC Project (40805022)
and the 973 program (2010CB950400).
REFERENCES
An, S. I., and B. Wang, 2001: Mechanisms of locking the El Nino and
La Nina mature phases to boreal winter. J. Climate, 14, 2164–2176.
Barnston, A. G., M. H. Glanz, and Y. He, 1999: Predictive skill of
statistical and dynamical climate models in forecasts of SST
during the 1997–98 El Nino episode and the 1998 La Nina
onset. Bull. Amer. Meteor. Soc., 80, 217–243.
Bates, S. C., 2008: Coupled ocean–atmosphere interaction and
variability in the tropical Atlantic Ocean with and without an
annual cycle. J. Climate, 21, 5501–5523.
——, 2010: Seasonal influences on coupled ocean–atmosphere var-
iability in the tropical Atlantic Ocean. J. Climate, 23, 582–604.
Bjerknes, J., 1969: Atmospheric teleconnections from the equato-
rial Pacific. Mon. Wea. Rev., 97, 163–172.
Blumenthal, M. B., 1991: Predictability of a coupled ocean–atmosphere
model. J. Climate, 4, 766–784.
Carton, J. A., and B. Huang, 1994: Warm events in the tropical
Atlantic. J. Phys. Oceanogr., 24, 888–903.
——, X. H. Cao, B. S. Giese, and A. M. da Silva, 1996: Decadal and
interannual SST variability in the tropical Atlantic ocean.
J. Phys. Oceanogr., 26, 1165–1175.
Chang, P., L. Ji, and H. Li, 1997: A decadal climate variation in the
tropical Atlantic Ocean from thermodynamic air-sea in-
teractions. Nature, 385, 516–518.
——, ——, ——, C. Penland, and L. Matrosova, 1998: Prediction of
tropical Atlantic sea surface temperature. Geophys. Res. Lett.,
25, 1193–1196.
——, R. Saravanan, and L. Ji, 2003: Tropical Atlantic seasonal
predictability: The roles of El Nino remote influence and
thermodynamic air-sea feedback. Geophys. Res. Lett., 30,
1501, doi:10.1029/2002GL016119.
——, and Coauthors, 2006: Climate fluctuations of tropical coupled
system—The role of ocean dynamics. J. Climate, 19, 5122–5174.
Chen, J.-M., L. Tim, and C.-F. Shih, 2007: Fall persistence barrier of
sea surface temperature in the South China Sea associated
with ENSO. J. Climate, 20, 158–172.
Ciasto, L. M., and D. W. Thompson, 2008: Observations of large-
scale ocean–atmosphere interaction in the Southern Hemi-
sphere. J. Climate, 21, 1244–1259.
Clarke, A. J., and S. Van Gorder, 1999: The correlation between
the boreal spring Southern Oscillation persistence barrier and
biennial variability. J. Climate, 12, 610–620.
Czaja, A., P. van der Varrt, and J. Marshall, 2002: A diagnostic
study of the role of remote forcing in tropical Atlantic vari-
ability. J. Climate, 15, 3280–3290.
Deser, C., and M. Timlin, 1997: Atmosphere–ocean interaction on
weekly timescales in the North Atlantic and Pacific. J. Climate, 10,
393–408.
——, M. A. Alexander, and M. S. Timlin, 2003: Understanding the
persistence of sea surface temperature anomalies in mid-
latitudes. J. Climate, 16, 57–72.
Ding, R. Q., and J. P. Li, 2009: Decadal and seasonal dependence of
North Pacific SST persistence. J. Geophys. Res., 114, D01105,
doi:10.1029/2008JD010723.
Elliott, J., S. P. Jewson, and R. T. Sutton, 2001: The impact of the
1997/98 El Nino events on the Atlantic Ocean. J. Climate, 14,
1069–1077.
Enfield, D. B., 1996: Relationships of inter-American rainfall to
tropical Atlantic and Pacific SST variability. Geophys. Res.
Lett., 23, 3305–3308.
——, and D. A. Mayer, 1997: Tropical Atlantic sea surface tem-
perature variability and its relation to El Nino–Southern Os-
cillation. J. Geophys. Res., 102, 929–945.
Folland, C. K., T. N. Palmer, and D. E. Parker, 1986: Sahel rainfall
and worldwide sea temperatures, 1901–85. Nature, 320, 602–607.
Foltz, G. R., and M. J. McPhaden, 2006: The role of oceanic heat
advection in the evolution of tropical north and south Atlantic
SST anomalies. J. Climate, 19, 6122–6138.
Giannini, A., J. C. H. Chiang, M. A. Cane, Y. Kushnir, and R. Seager,
2001a: The ENSO teleconnection to the tropical Atlantic Ocean:
Contributions of the remote and local SSTs to rainfall variability
in the tropical Americas. J. Climate, 14, 4530–4544.
——, M. A. Cane, and Y. Kushnir, 2001b: Interdecadal changes in
the ENSO teleconnection to the Caribbean region and the
North Atlantic Oscillation. J. Climate, 14, 2867–2879.
Gong, D., and S. Wang, 1999: Definition of Antarctic oscillation
index. Geophys. Res. Lett., 26, 459–462.
Goswami, B. N., and J. Shukla, 1991: Predictability of a coupled
ocean–atmosphere model. J. Climate, 4, 3–22.
Grotzner, A., M. Latif, and T. P. Barnett, 1998: A decadal climate
cycle in the North Atlantic Ocean as simulated by the ECHO
coupled GCM. J. Climate, 11, 831–847.
Handoh, I. C., A. J. Matthews, G. R. Bigg, and D. P. Stevens, 2006:
Interannual variability of the tropical Atlantic independent of
2298 J O U R N A L O F C L I M A T E VOLUME 24

and associated with ENSO: Part I. The North Tropical At-
lantic. Int. J. Climatol., 26, 1937–1956.
Horel, J. D., V. E. Kousky, and M. T. Kagaro, 1986: Atmospheric
conditions in the tropical Atlantic during 1983–1984. Nature,
322, 243–245.
Huang, B., 2004: Remotely forced variability in the tropical At-
lantic Ocean. Climate Dyn., 23, 133–152.
——, and J. Shukla, 2005: Ocean–atmosphere interactions in the
tropical and subtropical Atlantic Ocean. J. Climate, 18, 1652–1672.
——, P. S. Schopf, and Z. Q. Pan, 2002: The ENSO effect on the
tropical Atlantic variability: A regionally coupled model
study. Geophys. Res. Lett., 29, doi:10.1029/2002GL014872.
——, ——, and J. Shukla, 2004: Intrinsic ocean–atmosphere vari-
ability of the tropical Atlantic ocean. J. Climate, 17, 2058–2077.
Hurrell, J. W., 1995: Decadal trends in the North Atlantic Oscil-
lation: Regional temperatures and precipitation. Science, 269,
676–679.
Jin, E. K., and Coauthors, 2008: Current status of ENSO prediction
skill in coupled ocean-atmosphere models. Climate Dyn., 31,647–664.
Kalnay, E., and Coauthors, 1996: The NCEP–NCAR 40-Year
Reanalysis Project. Bull. Amer. Meteor. Soc., 77, 437–471.
Klein, S. A., B. J. Soden, and N.-C. Lau, 1999: Remote sea surface
temperature variations during ENSO: Evidence for a tropical
atmospheric bridge. J. Climate, 12, 917–932.
Kushnir, Y., W. A. Robinson, P. Chang, and A. W. Robertson, 2006:
The physical basis for predicting Atlantic sector seasonal-to-
interannual climate variability. J. Climate, 19, 5949–5970.
Latif, M., and T. P. Barnett, 1995: Interactions of the tropical
oceans. J. Climate, 8, 952–968.
——, and A. Grotzner, 2000: The equatorial Atlantic oscillation
and its response to ENSO. Climate Dyn., 16, 213–218.
——, and Coauthors, 1998: A review of the predictability and
prediction of ENSO. J. Geophys. Res., 103, 14 375–14 393.
Li, J., and J. Wang, 2003: A new North Atlantic Oscillation index
and its variability. Adv. Atmos. Sci., 20, 661–676.
Luo, J. J., S. Masson, S. Behera, and T. Yamagata, 2007: Experi-
mental forecasts of Indian Ocean dipole using a coupled
OAGCM. J. Climate, 20, 2178–2190.
Marshall, J., and Coauthors, 2001: North Atlantic climate vari-
ability: Phenomena, impacts, and mechanisms. Int. J. Clima-
tol., 21, 1863–1898.
Mo, K. C., and R. W. Higgins, 1998: The Pacific–South American
modes and tropical convection during the Southern Hemi-
sphere winter. Mon. Wea. Rev., 126, 1581–1596.
——, and S. Hakkinen, 2001: Interannual variability in the tropical
Atlantic and linkages to the Pacific. J. Climate, 14, 2740–2762.
Moura, A. D., and J. Shukla, 1981: On the dynamics of droughts in
northeast Brazil: Observations, theory, and numerical exper-
iments with a general circulation model. J. Atmos. Sci., 38,
2653–2675.
Namias, J., and R. M. Born, 1970: Temporal coherence in North
Pacific sea surface temperature patterns. J. Geophys. Res., 75,
5952–5955.
——, and ——, 1974: Further studies of temporal coherence in
North Pacific sea surface temperature patterns. J. Geophys.
Res., 79, 797–798.
Nobre, P., and J. Shukla, 1996: Variations of sea surface temper-
ature, wind stress, and rainfall over the tropical Atlantic and
South America. J. Climate, 9, 2464–2479.
Oort, A. H., and E. M. Rasmusson, 1970: On the annual variation
of the monthly mean meridional circulation. Mon. Wea. Rev.,
98, 423–442.
Pan, L., 2005: Observed positive feedback between the NAO and
the North Atlantic SSTA tripole. Geophys. Res. Lett., 32,
L06707, doi:10.1029/2005GL022427.
Penland, C., and L. Matrosova, 1998: Prediction of tropical At-
lantic sea surface temperatures using linear inverse modeling.
J. Climate, 11, 483–496.
Rasmusson, E. M., and T. H. Carpenter, 1982: Variations in tropical
sea surface temperature and surface wind fields associated with
the Southern Oscillation–El Nino. Mon. Wea. Rev., 110, 354–384.
——, X. Wang, and C. F. Ropelewski, 1990: The biennial compo-
nent of ENSO variability. J. Mar. Syst., 1, 71–96.
Saji, N. H., B. N. Goswami, P. N. Vinayachandran, and T. Yamagata,
1999: A dipole mode in the tropical Indian Ocean. Nature, 401,
360–363.
Saravanan, R., and P. Chang, 2000: Interaction between tropical
Atlantic variability and El Nino–Southern Oscillation. J. Cli-
mate, 13, 2177–2194.
Smith, T. M., and R. W. Reynolds, 2004: Improved extended re-
construction of SST (1854–1997). J. Climate, 17, 2466–2477.
Sutton, R. T., S. P. Jewson, and D. P. Rowell, 2000: The elements of
climate variability in the tropical Atlantic region. J. Climate,
13, 3261–3284.
Taschetto, A. S., and I. Wainer, 2008: The impact of the subtropical
South Atlantic SST on South American precipitation. Ann.
Geophys., 26, 3457–3476.
Torrence, C., and P. J. Webster, 1998: The annual cycle of persis-
tence in the El Nino–Southern Oscillation. Quart. J. Roy.
Meteor. Soc., 124, 1985–2004.
Wajsowicz, R. C., 2005: Potential predictability of tropical Indian
Ocean SST anomalies. Geophys. Res. Lett., 32, L24702,
doi:10.1029/2005GL024169.
Wallace, J. M., and D. S. Gutzler, 1981: Teleconnections in the
geopotential height field during the Northern Hemisphere
winter. Mon. Wea. Rev., 109, 784–812.
Wang, C., 2002: Atlantic climate variability and its associated at-
mospheric cells. J. Climate, 15, 1516–1536.
——, 2004: ENSO, Atlantic climate variability, and the Walker and
Hadley circulations. The Hadley Circulation: Past, Present and
Future, H. F. Diaz and R. S. Bradley, Eds., Advances in Global
Change Research, Vol. 21, Kluwer Academic Publishers,
85–120.
Webster, P. J., and S. Yang, 1992: Monsoon and ENSO: Selectively
interactive systems. Quart. J. Roy. Meteor. Soc., 118, 877–925.
Xie, S.-P., 1999: A dynamic ocean–atmosphere model of the
tropical Atlantic decadal variability. J. Climate, 12, 64–70.
——, and J. A. Carton, 2004: Tropical Atlantic variability: Patterns,
mechanisms, and impacts. Earth Climate: The Ocean–Atmosphere
Interaction, C. Wang, et al., Eds., Geophys. Monorgr., No. 147,
Amer. Geophys. Union, 121–142.
Yu, J. Y., 2005: Enhancement of ENSO’s persistence barrier by
biennial variability in a coupled atmosphere-ocean general
circulation model. J. Geophys. Res., 32, L13707, doi:10.1029/
2005GL023406.
Zebiak, S. E., 1993: Air–sea interaction in the equatorial Atlantic
region. J. Climate, 6, 1567–1586.
——, and M. A. Cane, 1987: A model El Nino–Southern Oscilla-
tion. Mon. Wea. Rev., 115, 2262–2278.
Zhao, X., and J. P. Li, 2009: Possible causes for the persistence
barrier of SSTA in the South China Sea and the vicinity of
Indonesia. Adv. Atmos. Sci., 26, 1125–1136.
——, and ——, 2010: Winter-to-winter recurrence of sea surface
temperature anomalies in the Northern Hemisphere. J. Cli-
mate, 23, 3835–3854.
1 MAY 2011 D I N G A N D L I 2299