Embed Size (px)
Citation preview
WIP CIP ASAP
Anne Arundel County’s
Watershed Cure Strategy
July 16, 2013
Presented by: Anne Arundel County Department of Public Works
Chris Phipps, Acting Director
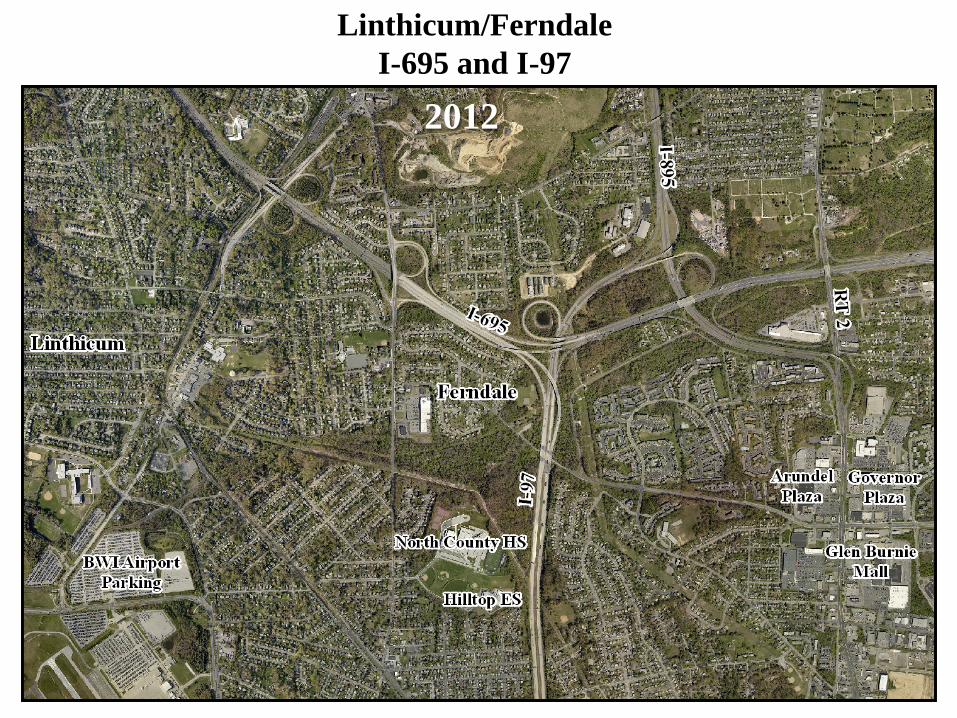
1952 2012
Linthicum/Ferndale I-695 and I-97
3 3 3 3 3 3
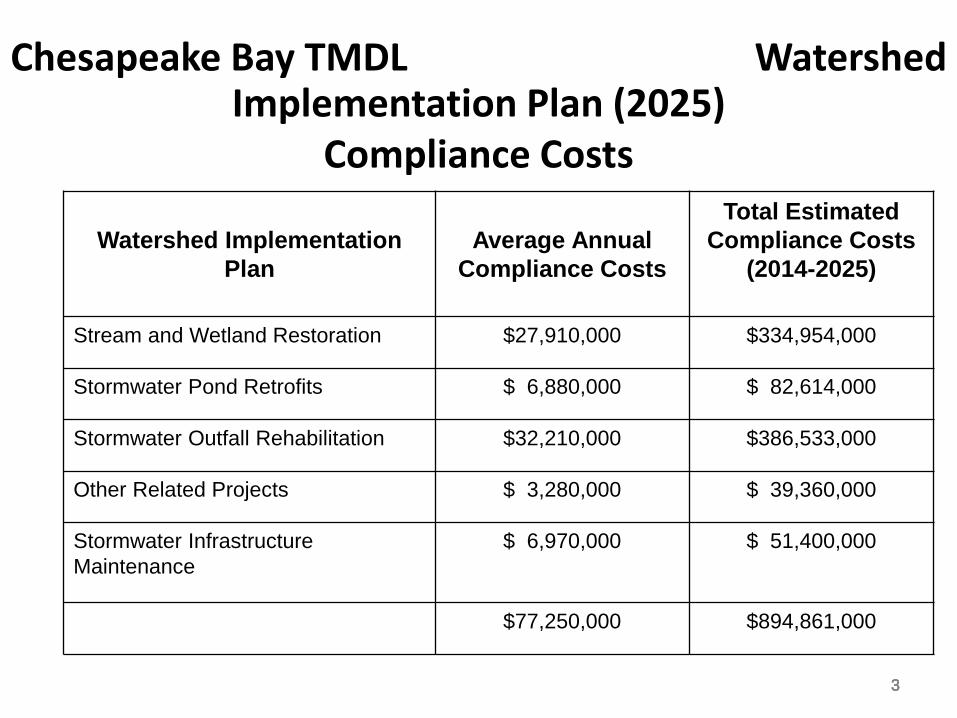
Chesapeake Bay TMDL Watershed Implementation Plan (2025)
Compliance Costs
Watershed Implementation Plan
Average Annual
Compliance Costs
Total Estimated Compliance Costs
(2014-2025)
Stream and Wetland Restoration $27,910,000 $334,954,000
Stormwater Pond Retrofits $ 6,880,000 $ 82,614,000
Stormwater Outfall Rehabilitation $32,210,000 $386,533,000
Other Related Projects $ 3,280,000 $ 39,360,000
Stormwater Infrastructure Maintenance
$ 6,970,000 $ 51,400,000
$77,250,000 $894,861,000
4
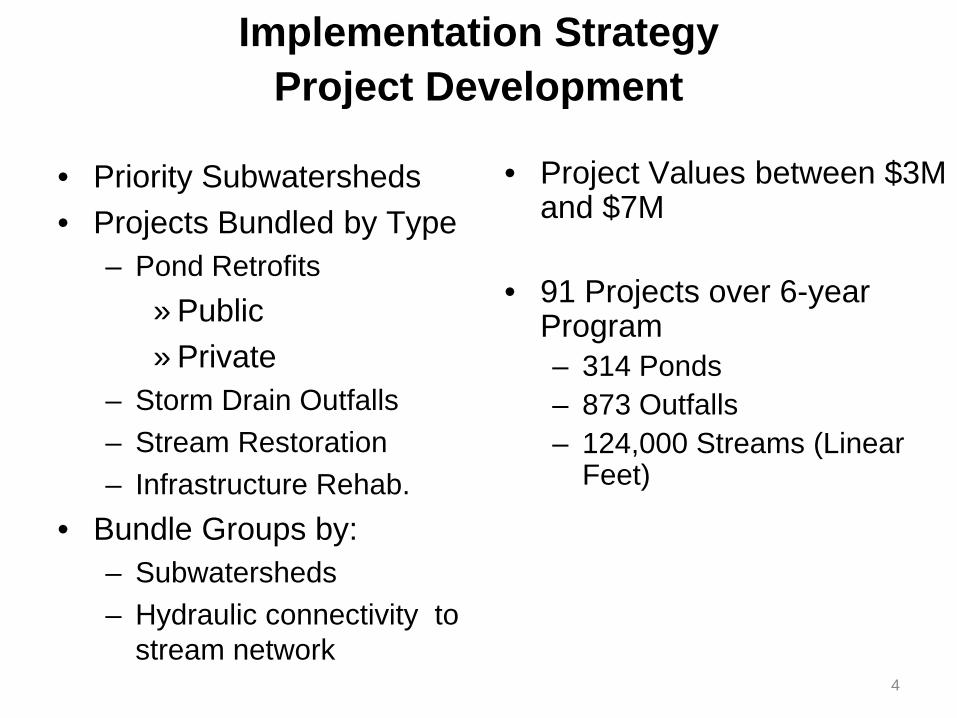
Implementation Strategy Project Development
• Priority Subwatersheds • Projects Bundled by Type
– Pond Retrofits » Public » Private
– Storm Drain Outfalls – Stream Restoration – Infrastructure Rehab.
• Bundle Groups by: – Subwatersheds – Hydraulic connectivity to
stream network
• Project Values between $3M and $7M
• 91 Projects over 6-year Program – 314 Ponds – 873 Outfalls – 124,000 Streams (Linear
Feet)
5
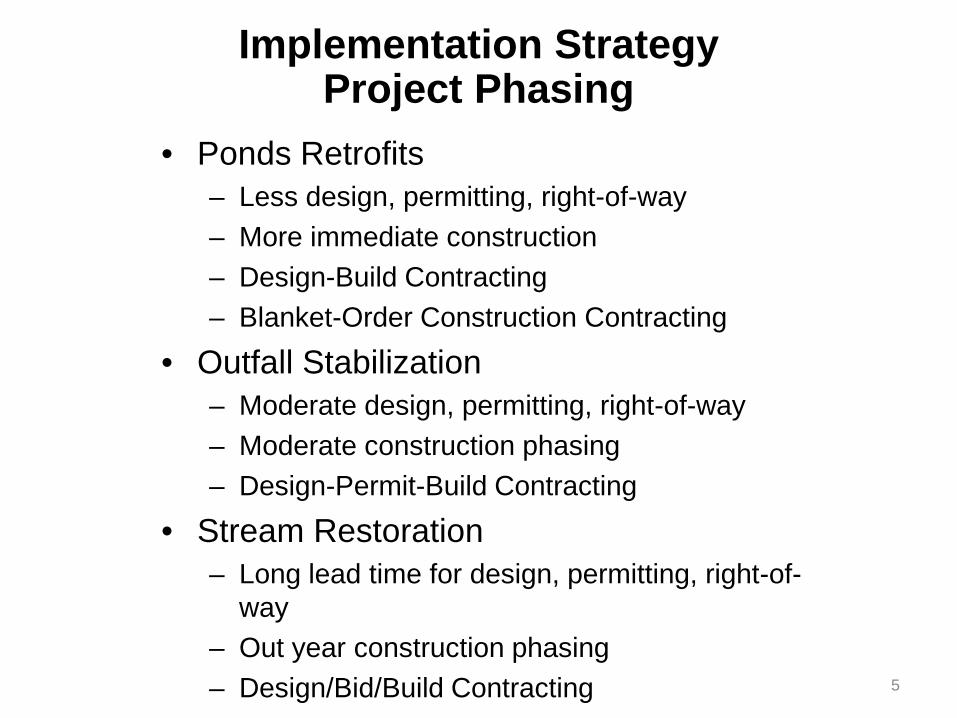
Implementation Strategy Project Phasing
• Ponds Retrofits – Less design, permitting, right-of-way – More immediate construction – Design-Build Contracting – Blanket-Order Construction Contracting
• Outfall Stabilization – Moderate design, permitting, right-of-way – Moderate construction phasing – Design-Permit-Build Contracting
• Stream Restoration – Long lead time for design, permitting, right-of-
way – Out year construction phasing – Design/Bid/Build Contracting
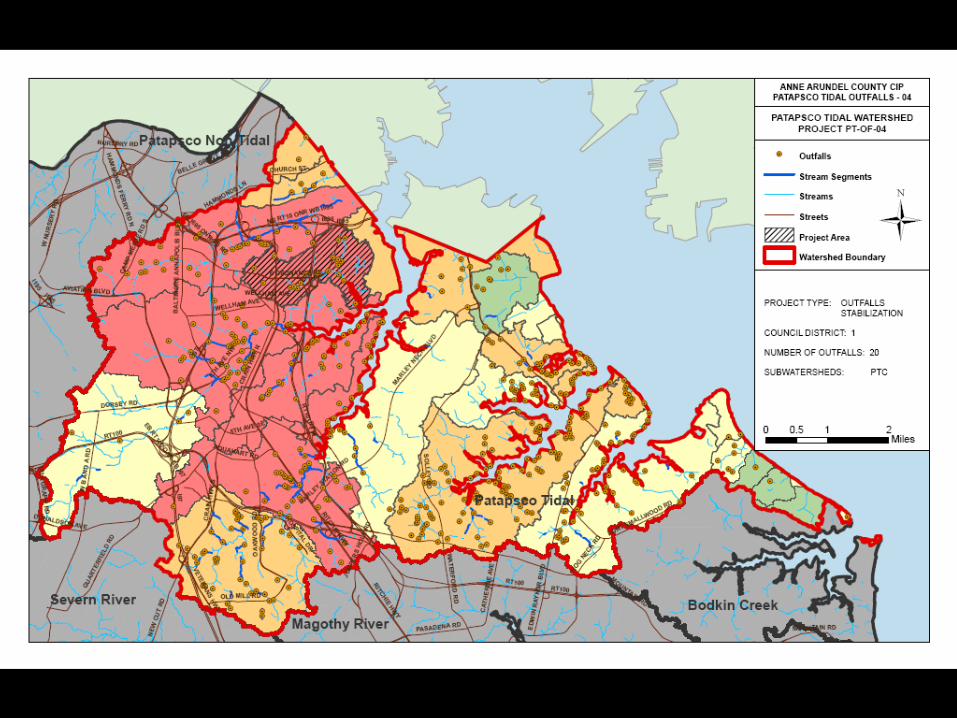

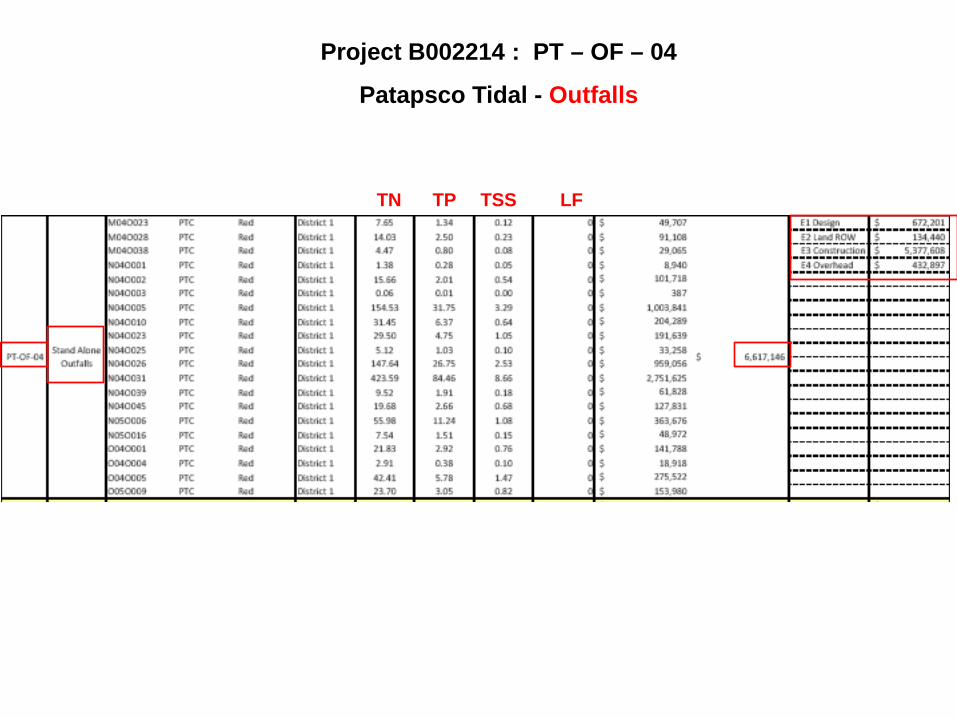
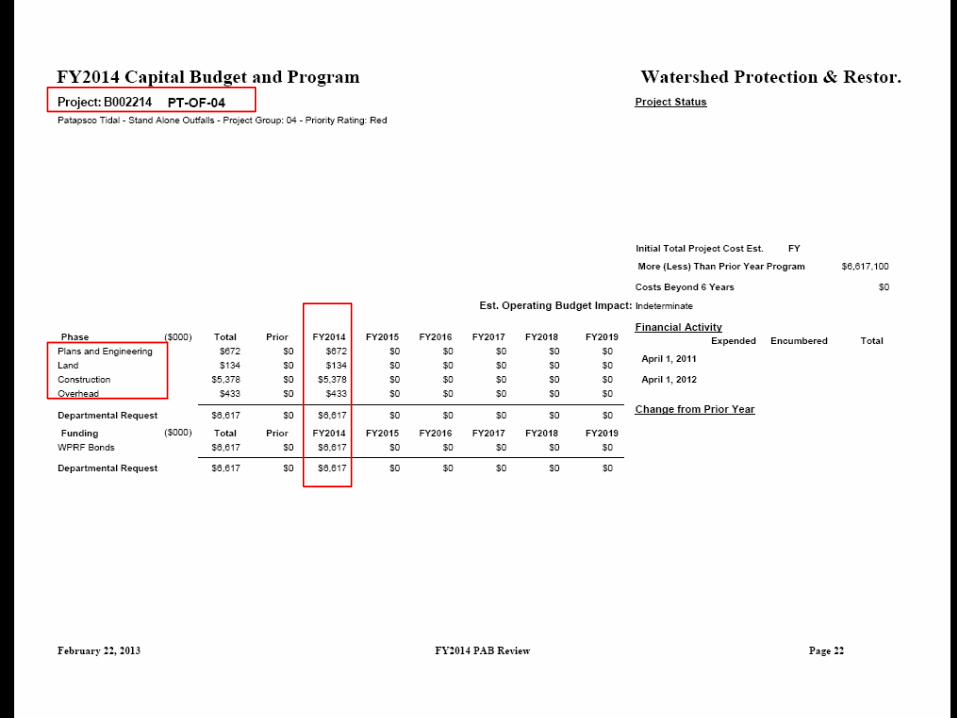
Project B002214 : PT – OF – 04
Patapsco Tidal - Outfalls
TN TP TSS LF
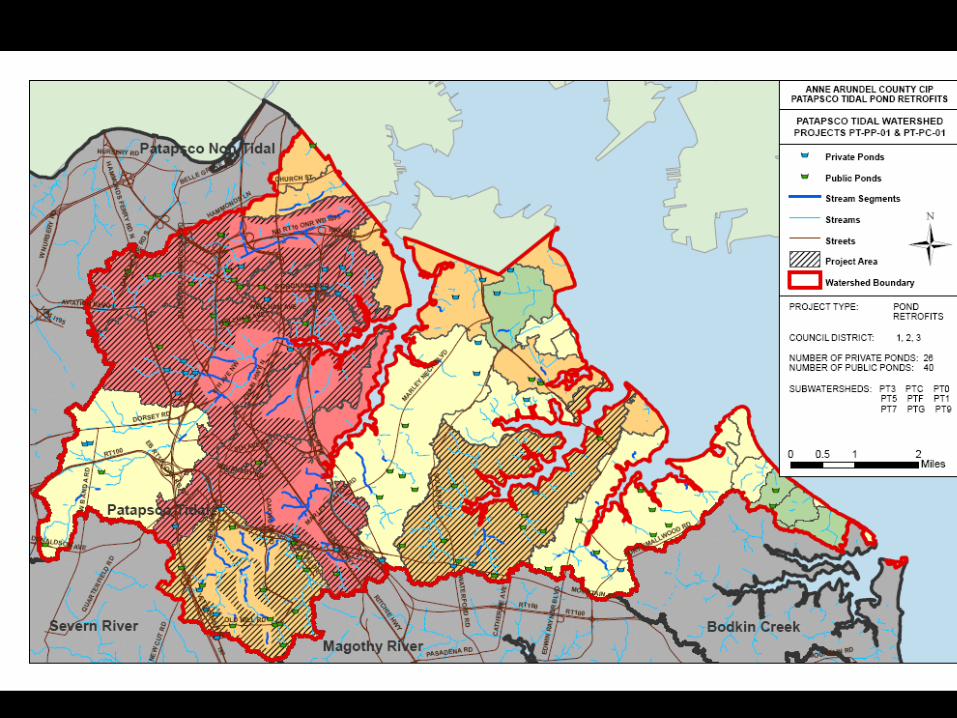
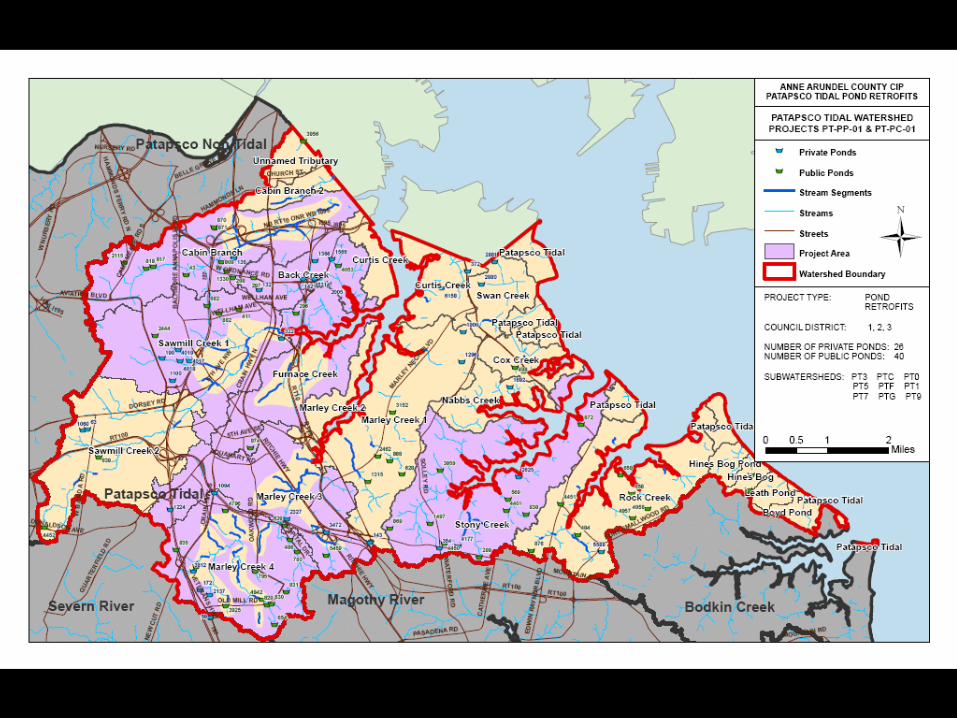
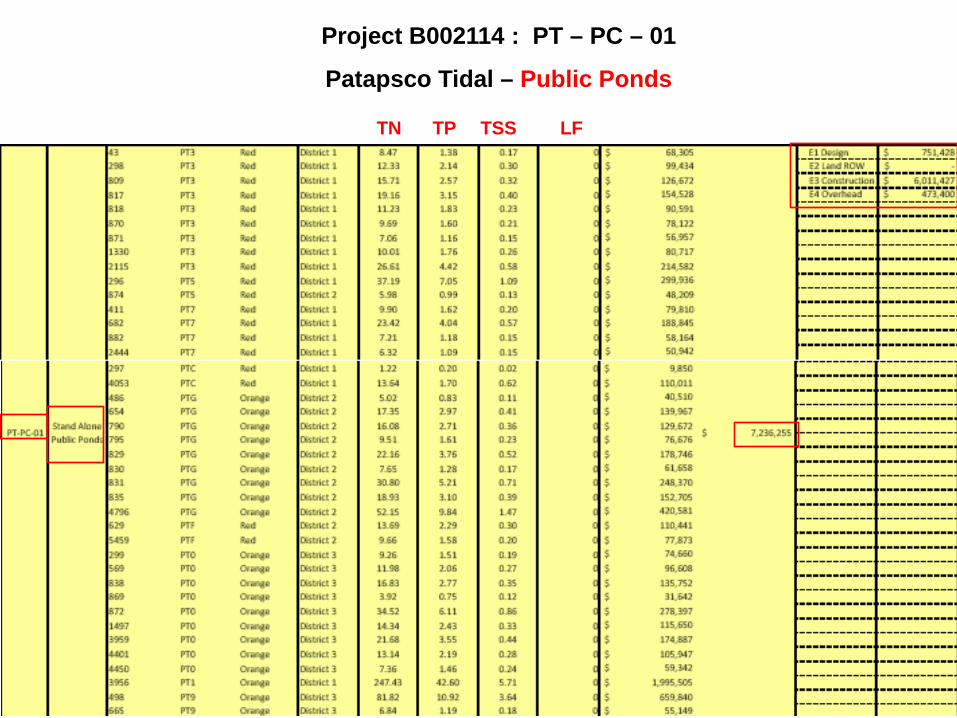
Project B002114 : PT – PC – 01
Patapsco Tidal – Public Ponds
TN TP TSS LF

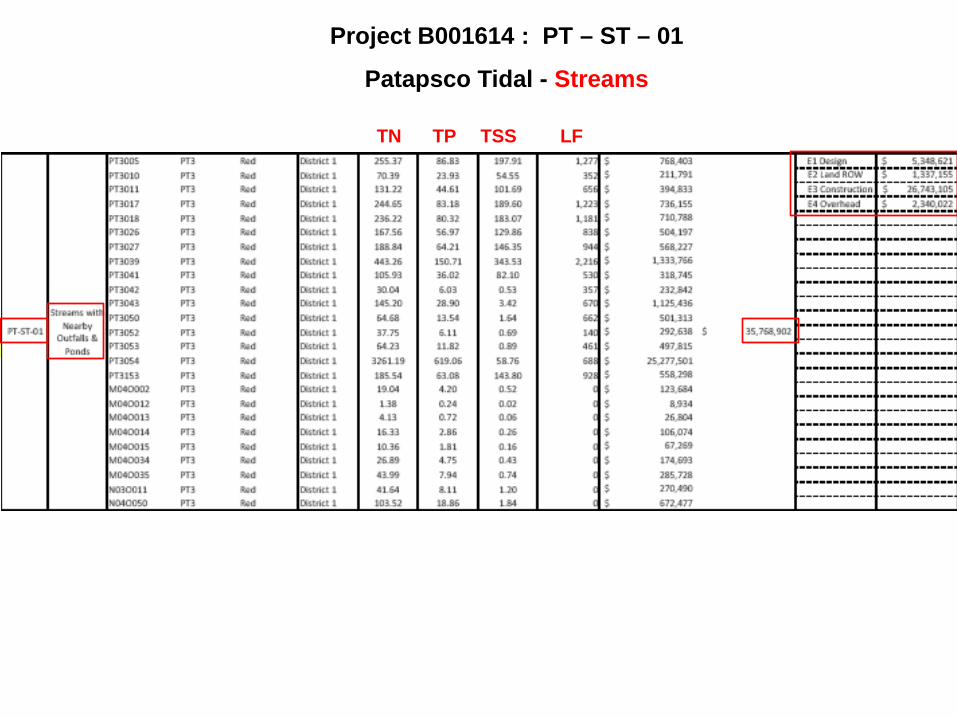
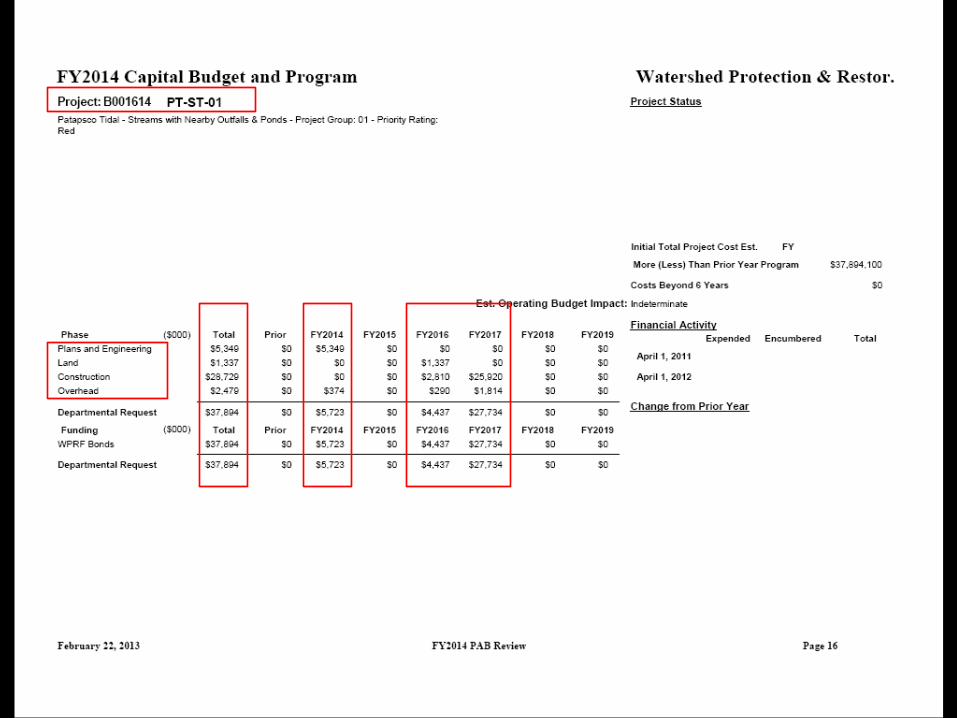
Project B001614 : PT – ST – 01
Patapsco Tidal - Streams
TN TP TSS LF
Mill
ions
of D
olla
rs
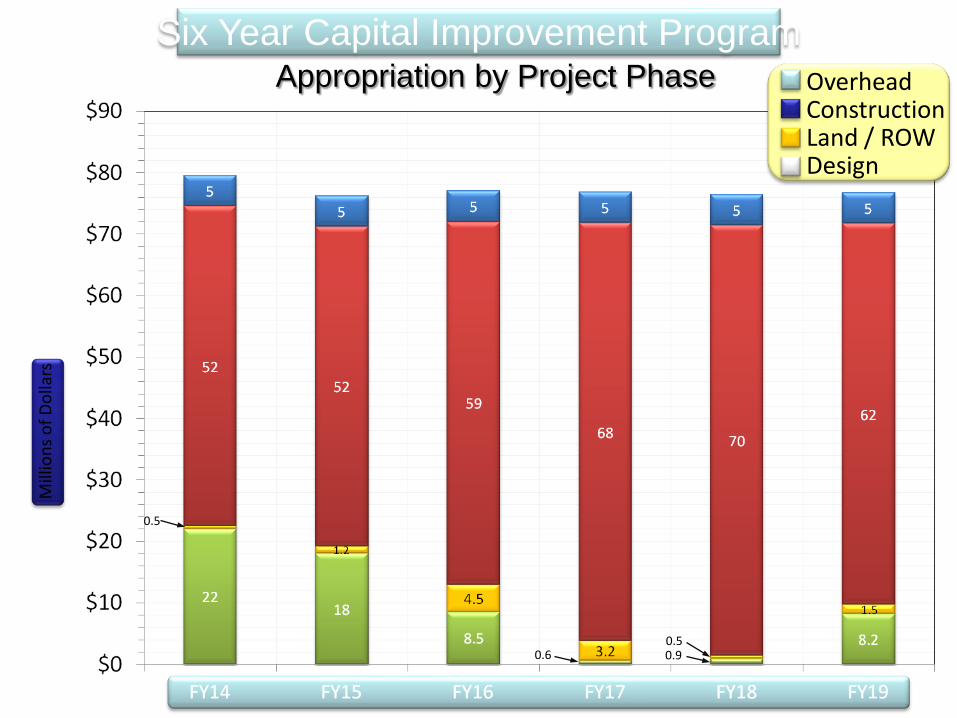
Overhead Construction Land / ROW Design
0.5 0.9 0.6
0.5
Appropriation by Project Phase Six Year Capital Improvement Program
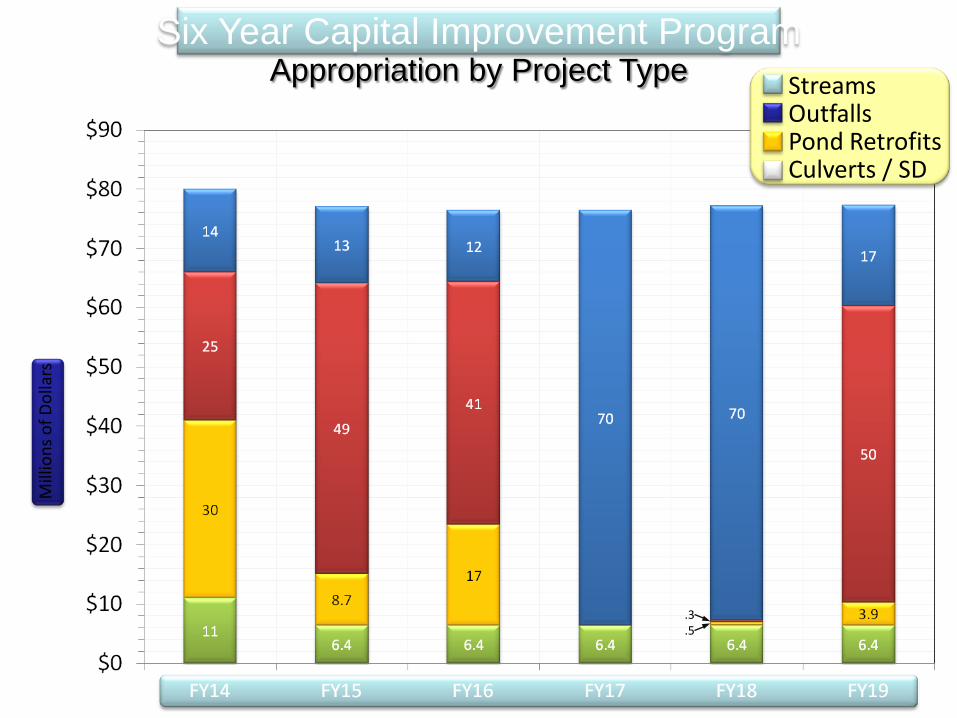
Appropriation by Project Type Six Year Capital Improvement Program
Mill
ions
of D
olla
rs
Streams Outfalls Pond Retrofits Culverts / SD
.5
.3
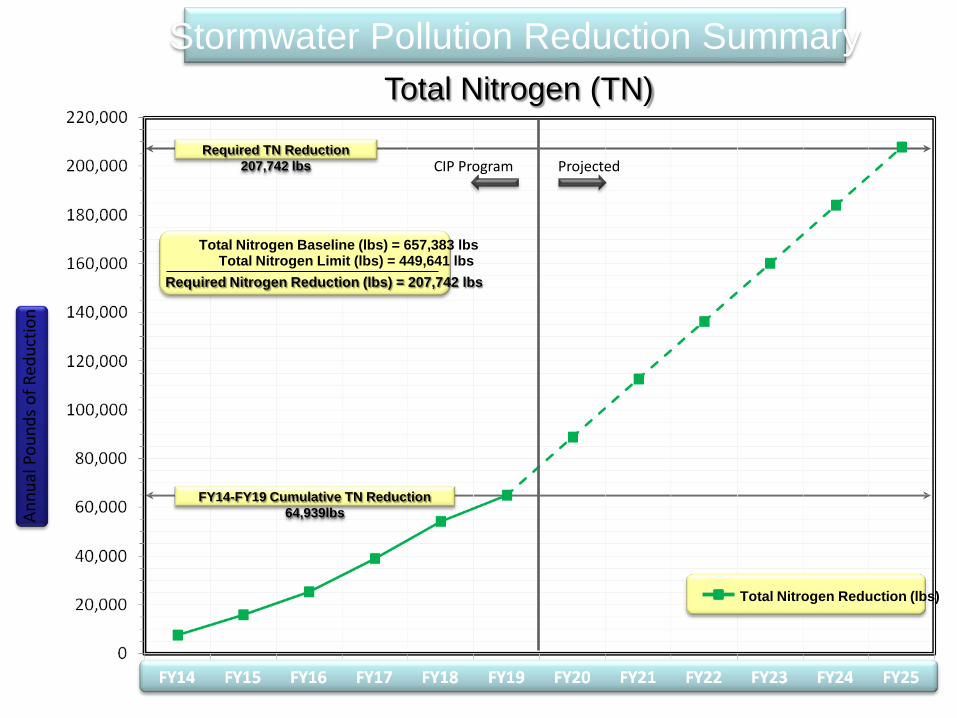
Total Nitrogen (TN) Stormwater Pollution Reduction Summary
Required TN Reduction 207,742 lbs
Total Nitrogen Reduction (lbs)
Total Nitrogen Baseline (lbs) = 657,383 lbs Total Nitrogen Limit (lbs) = 449,641 lbs
Required Nitrogen Reduction (lbs) = 207,742 lbs
CIP Program Projected
Annu
al P
ound
s of R
educ
tion
FY14-FY19 Cumulative TN Reduction 64,939lbs
Annu
al P
ound
s of R
educ
tion
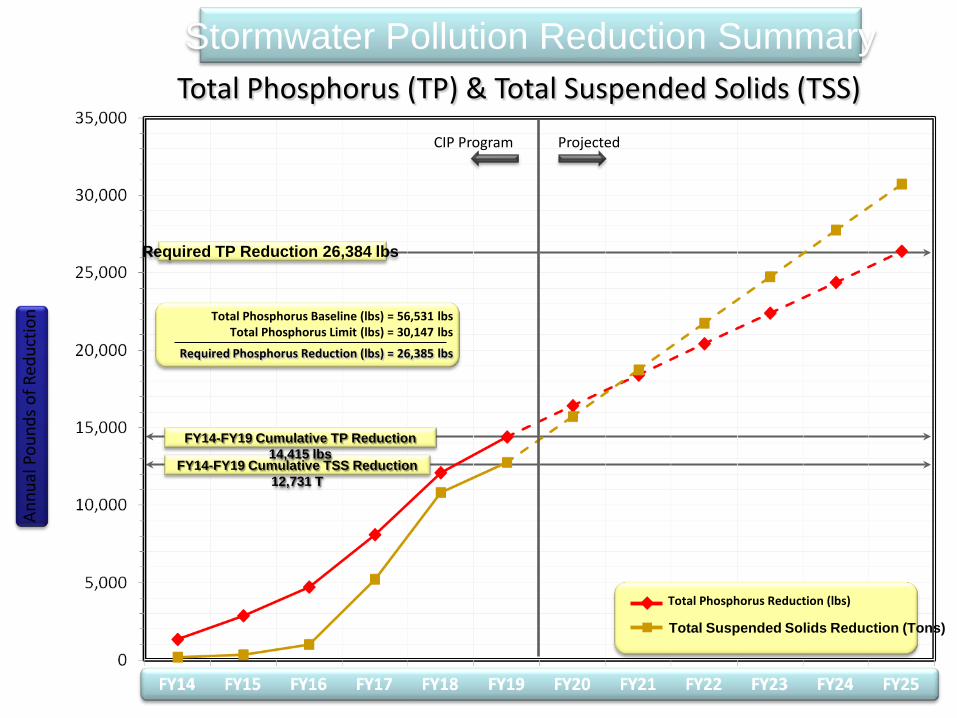
Stormwater Pollution Reduction Summary
Total Phosphorus Baseline (lbs) = 56,531 lbs Total Phosphorus Limit (lbs) = 30,147 lbs
Required Phosphorus Reduction (lbs) = 26,385 lbs
CIP Program Projected
Required TP Reduction 26,384 lbs
Total Phosphorus (TP) & Total Suspended Solids (TSS)
Total Suspended Solids Reduction (Tons)
Total Phosphorus Reduction (lbs)
FY14-FY19 Cumulative TSS Reduction 12,731 T
FY14-FY19 Cumulative TP Reduction 14,415 lbs
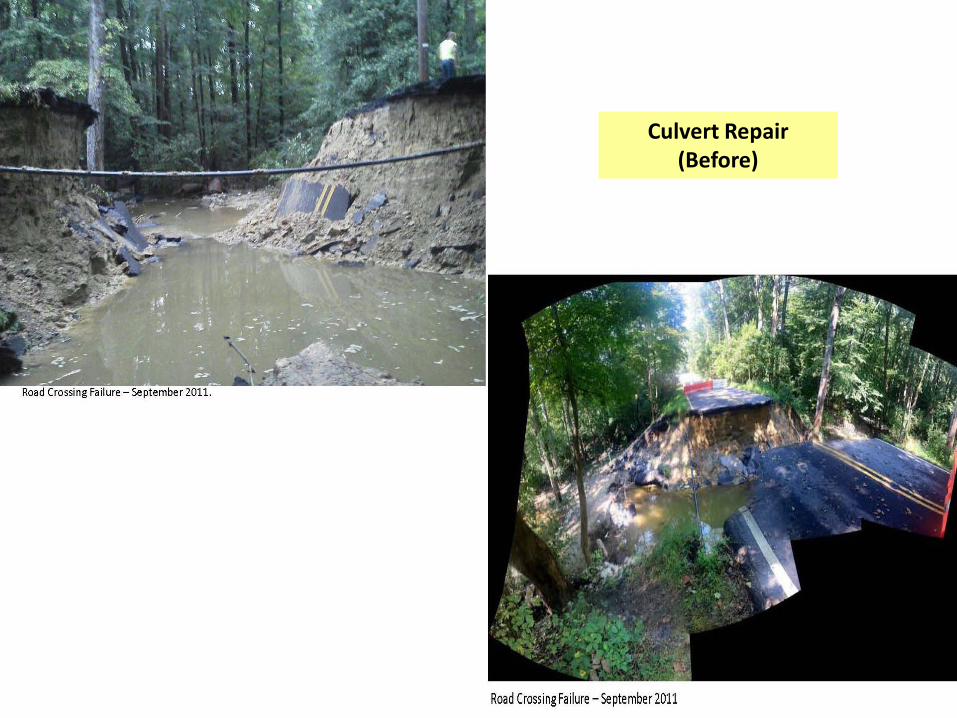
Culvert Repair (Before)
23
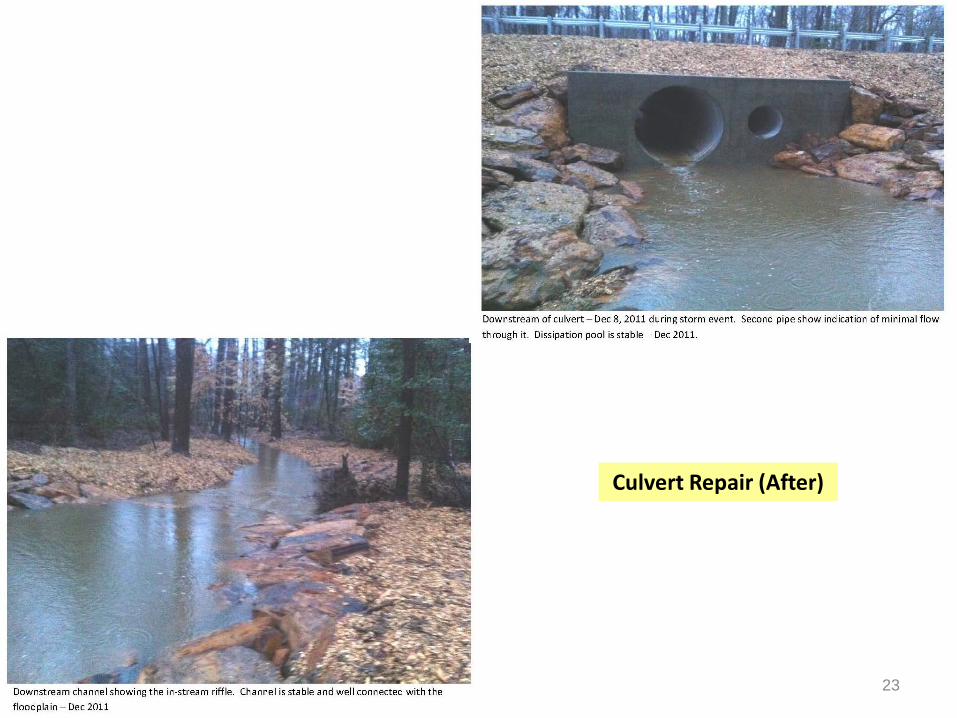
Culvert Repair (After)
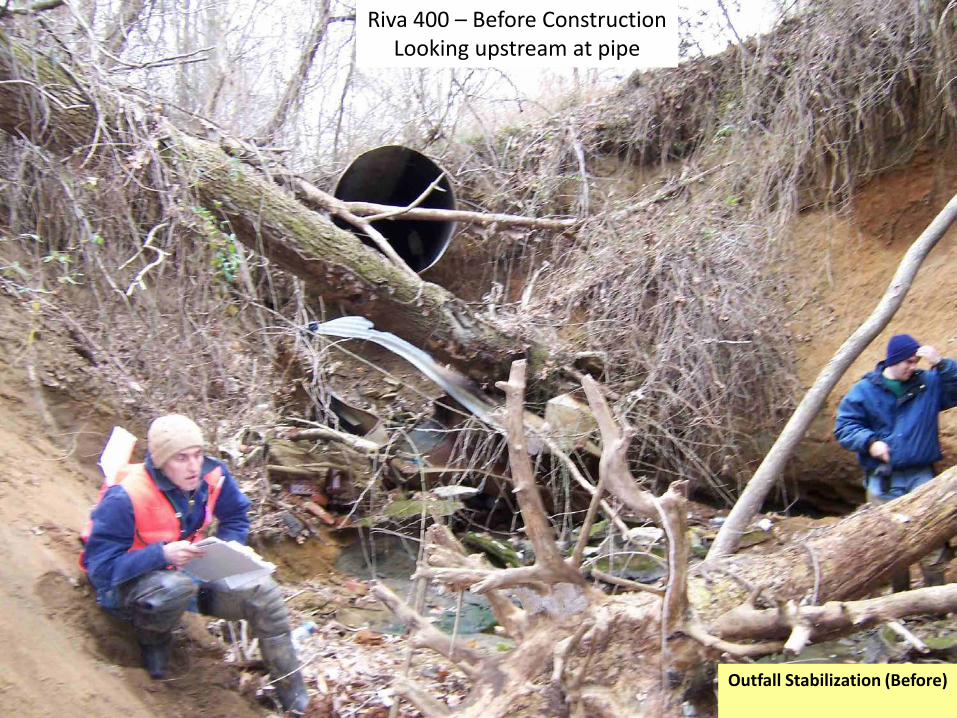
Riva 400 – Before Construction Looking upstream at pipe
Outfall Stabilization (Before)
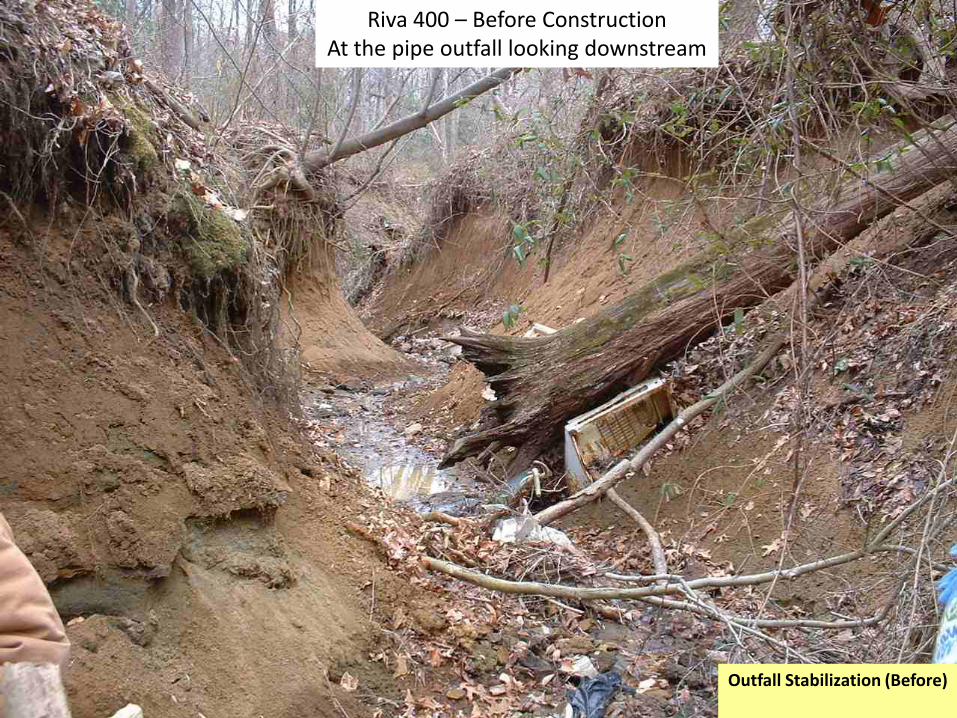
Riva 400 – Before Construction At the pipe outfall looking downstream
Outfall Stabilization (Before)
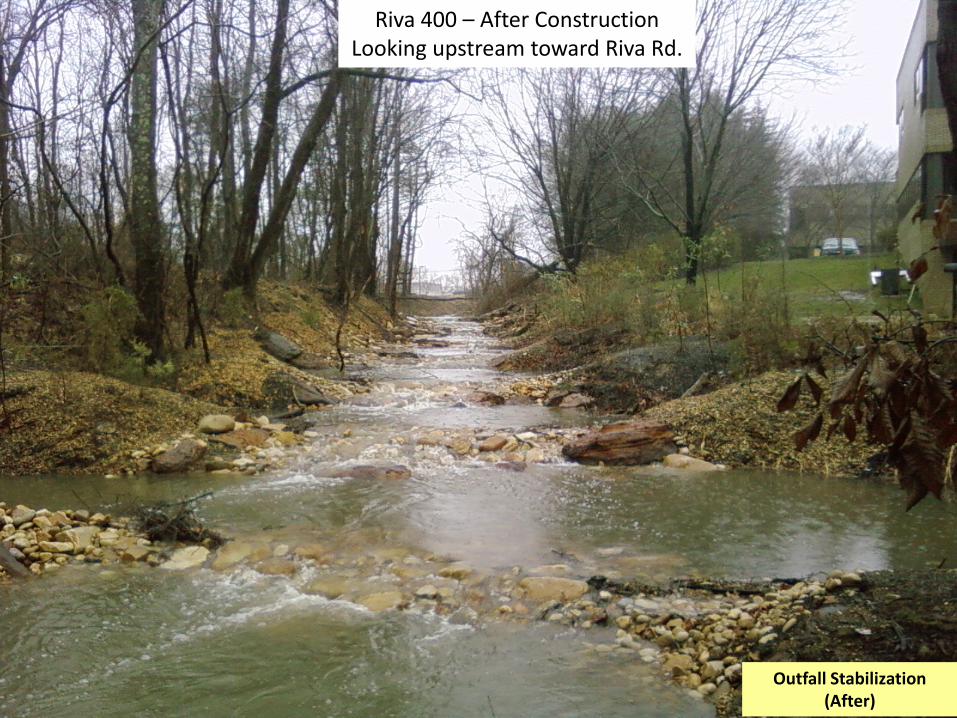
Riva 400 – After Construction Looking upstream toward Riva Rd.
Outfall Stabilization (After)
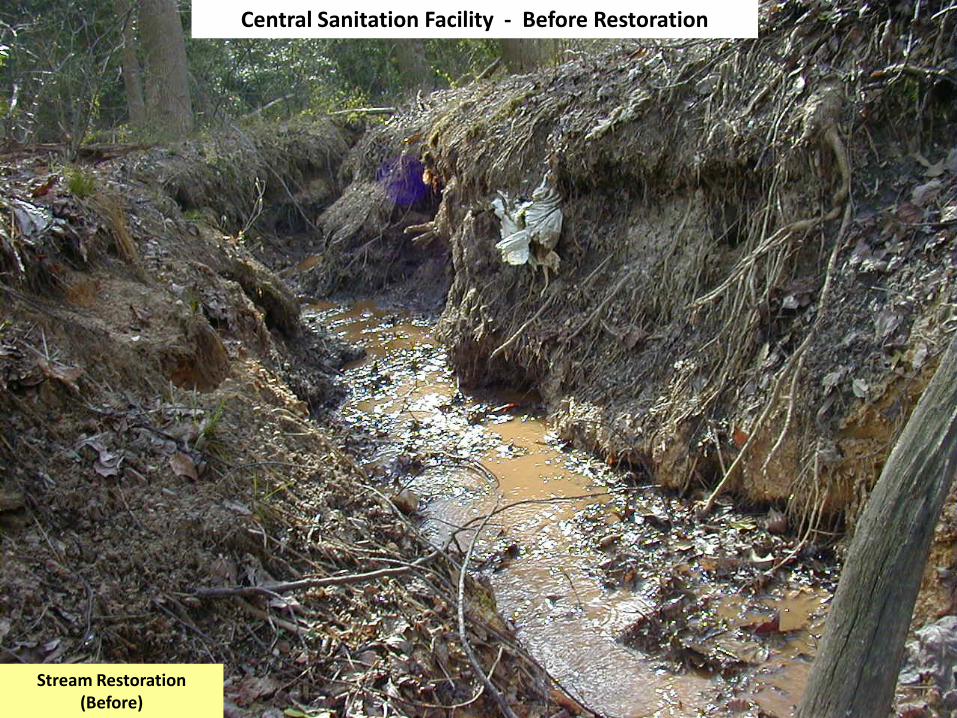
Central Sanitation Facility - Before Restoration
Stream Restoration (Before)
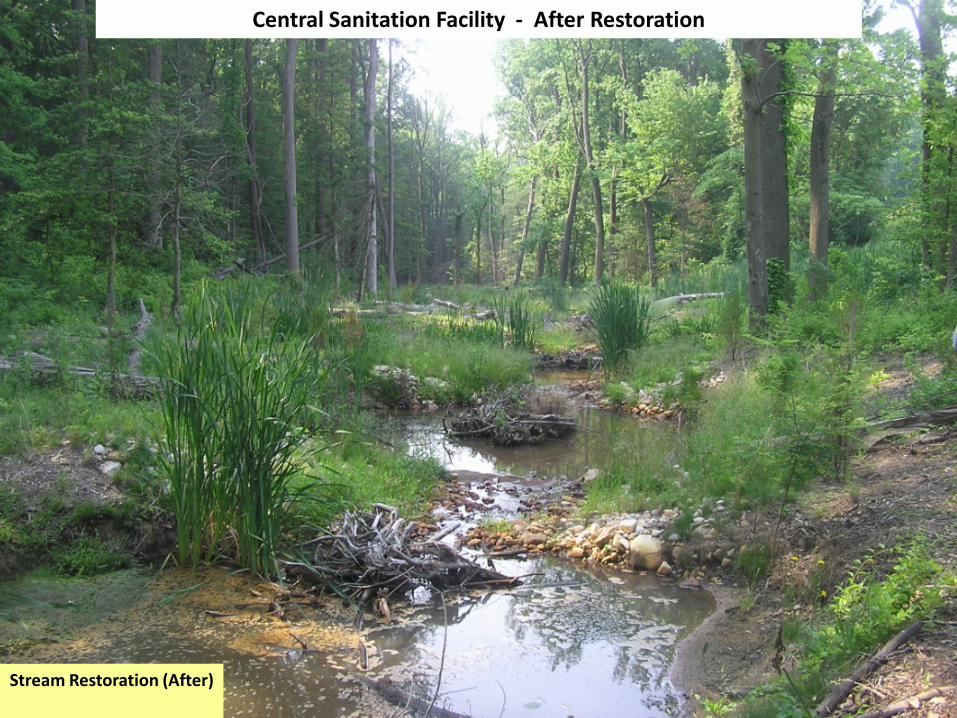
Central Sanitation Facility - After Restoration
Stream Restoration (After)
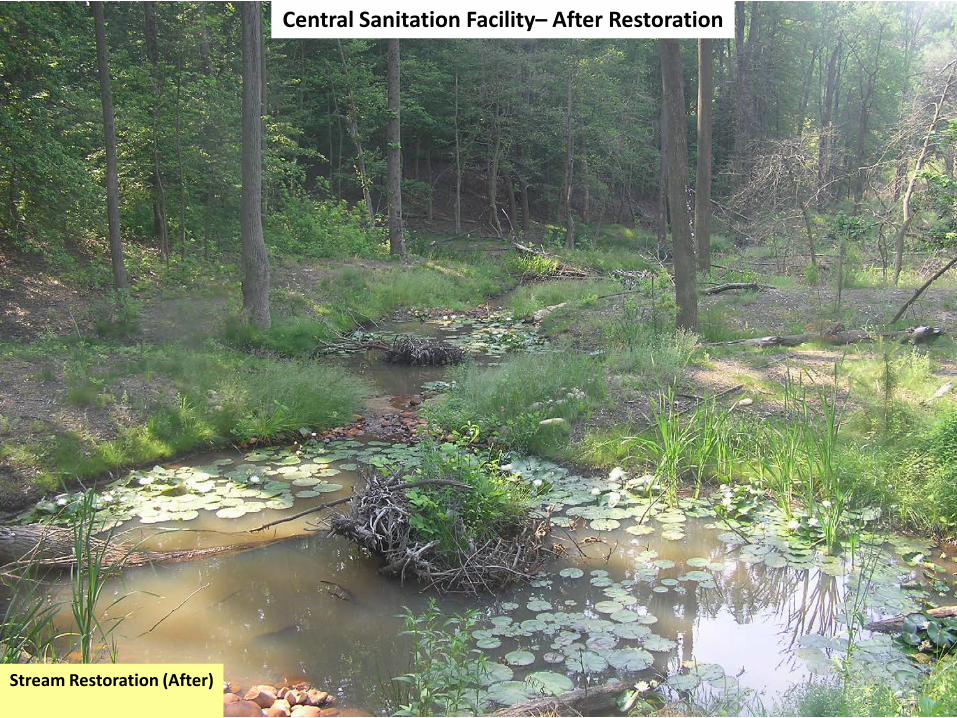
Central Sanitation Facility– After Restoration
Stream Restoration (After)