Embed Size (px)
Citation preview

WisconsinAgriculturalLandPrices
2016 Low commodity prices did not dampen average agricultural land prices in 2016. The WI Department of Revenue transfer return data finds average agricultural land values have increased slightly in 2016.
Aglandvaluessteadyin2016.

2
Wisconsin Agricultural Land Prices 2011-2016
A.J. Brannstrom12
University of Wisconsin Center for Dairy Profitability February 2017
The weighted average price of agricultural land sold in Wisconsin in 2016 was $4,021 per acre. This is a 3.5% increase from 2015 and nearly identical to the average from 2014. There were 14% fewer acres sold in 2016 and 14% fewer reported transactions. Declining farm incomes prices helped to dampen demand. With low commodity prices expected again in 2017, producer competition for land will likely soften again. Farmland is the most valuable asset on most farmer’s balance sheet. However, estimating land values is always difficult. There is nothing more unique than an individual parcel of land. While many thousand homes are sold each year, only a small fraction of the state’s agricultural land changes hands on the open market in any given year. Surveys of farmers, bankers, realtors and appraisers are sometimes used to estimate changes in land values. While easy to conduct, these opinion surveys are subjective and can be hard to interpret. News of high priced sales travels quickly – but these sales are often the exceptions and not reflective of the market. The Wisconsin Department of Revenue (DOR) collects an alternative source of agricultural land sales data. A transfer return tax is collected when a property is sold, and a transfer return form is collected with the tax payment. Information from these transfer return forms is the source for this paper. Wisconsin’s agricultural land values are low compared to some of our highly productive neighboring states – but a larger portion of our land is not suitable for continuous row crop farming and more of our land is used for forage production, woodlots and pasture. The shorter growing season in northern Wisconsin also limits the potential agricultural value of the land.
Figure 1. State-wide Ag Land Value Trends 2011-2016
1 Arlin Brannstrom is a Faculty Associate at the UW-Madison Center for Dairy Profitability and Secretary/Treasurer for the Wisconsin Chapter of the American Society of Farm Managers and Rural Appraisers. 2 This paper was reviewed by Dr. Simon Jette Nantel, Assistant Professor - UW Center for Dairy Profitability, and Mr. Tom Kriegl, UWEX Professor Emeritus.
3
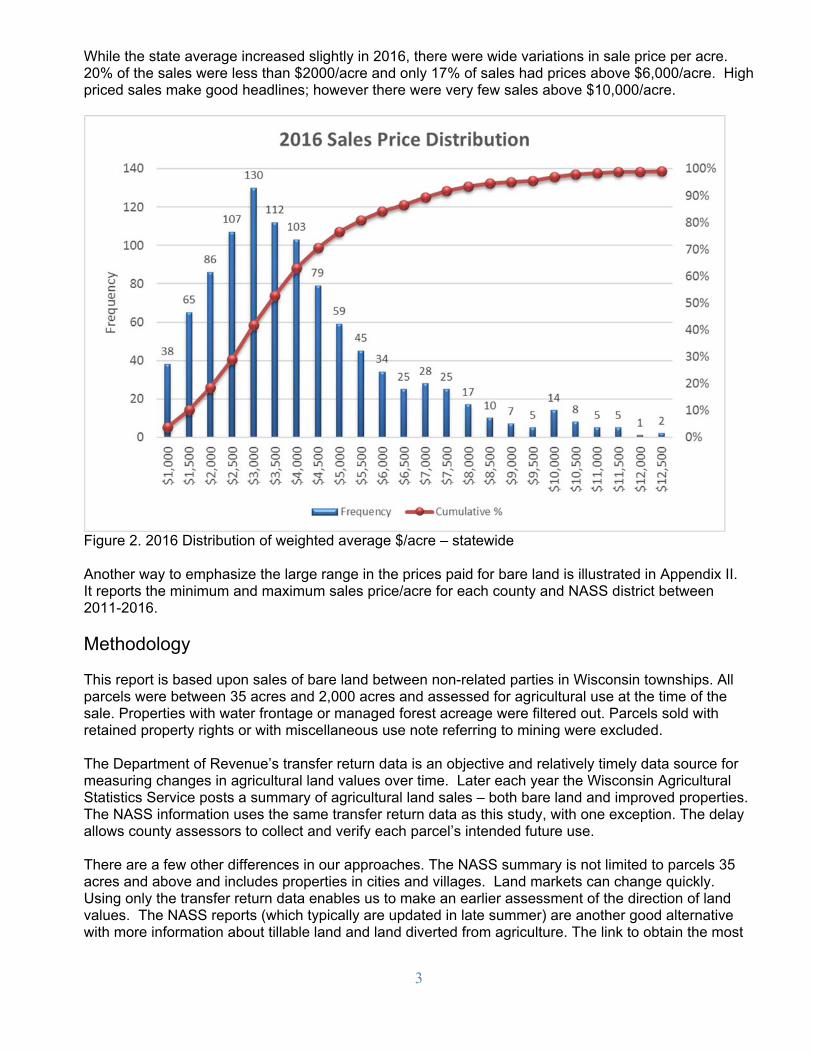
While the state average increased slightly in 2016, there were wide variations in sale price per acre. 20% of the sales were less than $2000/acre and only 17% of sales had prices above $6,000/acre. High priced sales make good headlines; however there were very few sales above $10,000/acre.
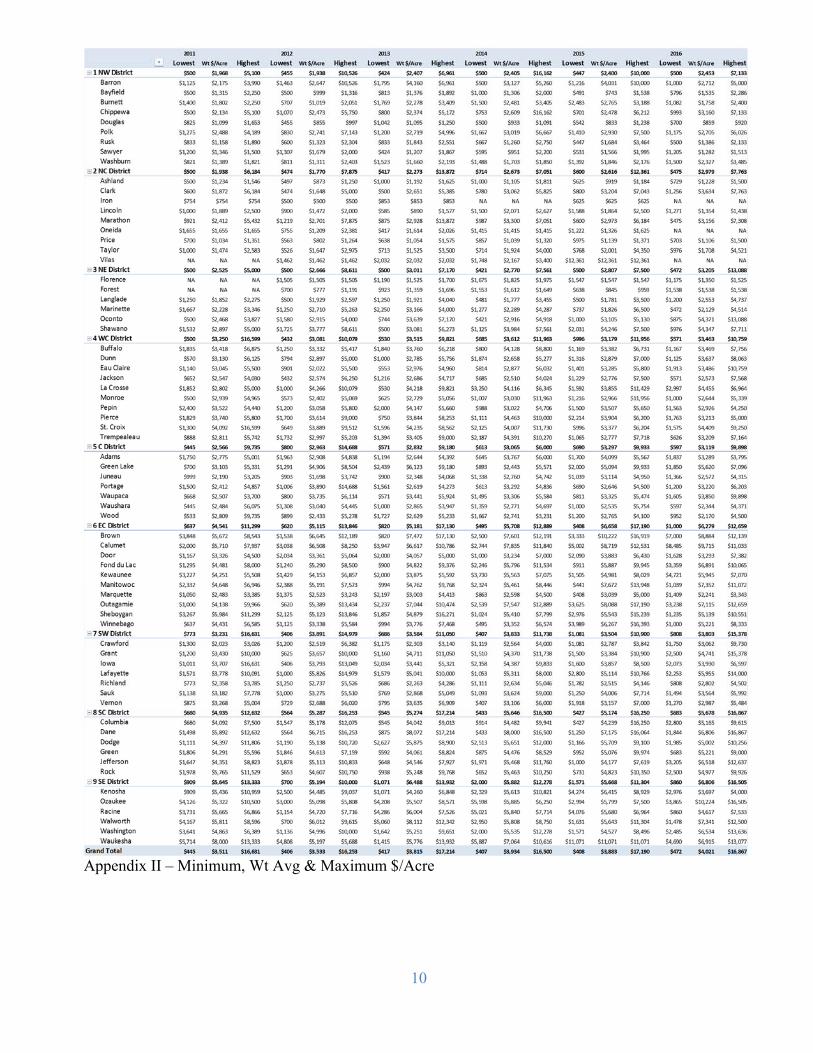
Figure 2. 2016 Distribution of weighted average $/acre – statewide Another way to emphasize the large range in the prices paid for bare land is illustrated in Appendix II. It reports the minimum and maximum sales price/acre for each county and NASS district between 2011-2016.
Methodology This report is based upon sales of bare land between non-related parties in Wisconsin townships. All parcels were between 35 acres and 2,000 acres and assessed for agricultural use at the time of the sale. Properties with water frontage or managed forest acreage were filtered out. Parcels sold with retained property rights or with miscellaneous use note referring to mining were excluded. The Department of Revenue’s transfer return data is an objective and relatively timely data source for measuring changes in agricultural land values over time. Later each year the Wisconsin Agricultural Statistics Service posts a summary of agricultural land sales – both bare land and improved properties. The NASS information uses the same transfer return data as this study, with one exception. The delay allows county assessors to collect and verify each parcel’s intended future use. There are a few other differences in our approaches. The NASS summary is not limited to parcels 35 acres and above and includes properties in cities and villages. Land markets can change quickly. Using only the transfer return data enables us to make an earlier assessment of the direction of land values. The NASS reports (which typically are updated in late summer) are another good alternative with more information about tillable land and land diverted from agriculture. The link to obtain the most

4
current land summary is: http://www.nass.usda.gov/Statistics_by_State/Wisconsin/Publications/Land_Sales/.
Between 2011 and 2016, nearly eight thousand bare agricultural land transfer returns were used to compute weighted average sale prices per acre. All reported sale prices are weighted averages. Weighted averages reduce the influence of sales with unusually high or low sale prices. Weighted averages are computed by summing the dollars paid for all sales and the total acres sold in the county or NASS unit and then dividing the totals. For example, if four 100-acre tracts sold for $2000/acre and a 5th sold for $4000, but was only 50 acres - the weighted average would be (400*$2,000) + (50*$4,000)) /450 or $2,222/acre as opposed to the simple average of $2,400. Location is an important determinant of value. In addition to the state-wide averages, land prices are reported using National Agricultural Statistics Service districts. The adjacent map displays the borders of the various National Agricultural Statistics Service (NASS)
Table 1. Weighted Average Wisconsin Bare Ag Land Sales 2011-2016.
Table 1 contains the number of sales, the number of acres sold and the average price ($/acre) in each of the nine NASS reporting districts. (Complete county details are included in Appendix I.) In 2016, there were fewer acres transferred in 6 out of the 9 NASS districts. There are often wide variations in the value of individual parcels even within the same township or county.
Row Labels Sales Acres Wt $/Ac Sales Acres Wt $/Ac Sales Acres Wt $/Ac
1 NW District 123 8,304 $1,968 170 15,653 $1,938 141 11,192 $2,407
2 NC District 105 7,351 $1,938 159 15,267 $1,770 135 9,511 $2,273
3 NE District 68 4,263 $2,525 86 6,482 $2,666 56 3,628 $3,011
4 WC District 289 22,193 $3,250 315 24,900 $3,081 244 18,964 $3,515
5 C District 116 8,175 $2,566 151 12,706 $2,963 130 9,729 $2,832
6 EC District 196 14,811 $4,541 271 18,428 $5,115 175 13,329 $5,133
7 SW District 175 14,806 $3,231 271 22,123 $3,891 186 14,158 $3,584
8 SC District 198 16,230 $4,935 234 17,286 $5,287 175 13,183 $5,204
9 SE District 49 3,691 $5,645 65 5,205 $5,194 67 5,316 $6,488
Grand Total 1319 99,824 $3,511 1722 138,050 $3,533 1309 99,010 $3,797
Row Labels Sales Acres Wt $/Ac Sales Acres Wt $/Ac Sales Acres Wt $/Ac
1 NW District 111 9,425 $2,405 122 10,907 $2,400 110 8,771 $2,453
2 NC District 137 9,785 $2,673 118 7,384 $2,616 96 7,261 $2,979
3 NE District 87 6,095 $2,770 70 4,566 $2,807 90 6,666 $3,205
4 WC District 193 15,747 $3,612 220 17,623 $3,179 212 16,426 $3,463
5 C District 125 10,182 $3,065 116 8,840 $3,297 88 6,490 $3,119
6 EC District 157 11,080 $5,708 158 10,463 $6,577 123 9,646 $6,279
7 SW District 159 12,917 $3,833 165 14,110 $3,504 148 11,700 $3,803
8 SC District 170 13,289 $5,646 164 13,305 $5,174 116 9,085 $5,678
9 SE District 39 3,394 $5,882 57 3,907 $5,668 38 2,697 $6,806
Grand Total 1178 91,914 $3,934 1190 91,105 $3,872 1021 78,742 $4,021
2011 2012 2013
2014 2015 2016
NASS District Boundaries

5
Figure 3. Relative % of Land Sold by District Figure 3 displays the percentage of total land area sales by NASS District. Southeast and Northeast districts have had the least agricultural land sold over recent years. Southeast WI is influenced by urban pressures of Milwaukee, Racine and Kenosha. The small acreage in Northeast Wisconsin reflects the large amount of forest and recreation land in that district. The three districts with the largest farm land sales have been the West Central, Southwest and South Central. The total acres sold in 2016 declined approximately 14% from 2014 and nearly 42% from the peak in 2012.
Figure 4. Weighted average price/acre by NASS district. Figure 4 represents the changes in the weighted average sale price/acre within each of the nine statistical reporting districts over the six-year span. Average land values increased in seven of the nine reported areas. The two exceptions were the East Central, and Central. The highest average prices paid for ag land were in Southeastern Wisconsin. There have been very few bare land sales in Southeastern Wisconsin in recent years - which makes it difficult to gauge market value trends. East Central sales saw the largest weighted average price increase in 2015 as a strong dairy industry and land auctions in this case helped to drive up sales prices. East Central average prices declined in 2016. The average price per acre for bare land in the northern districts increased slightly in 2016. East Central Wisconsin contains the largest concentration of large dairy farm. This is also the fastest growing milk production region in the state. The Southwest, South Central districts experienced small increases in average sale prices in 2016. The large increase in Southeast average value/acre was on a relatively small number of sales.

6
Land Values vs Rental Rates State-wide land rental rates are reported annually by NASS. Figure 5 on page six combines the state average land values with reported average rental rates. Even within a county, rental rates are highly variable. Some of the factors which affect rental rates are soil quality, field size, social contracts and demand for nutrient management. The 2016 NASS average rental rate was $131/acre which is about 3.2% of the state-wide average sale price. There has been a high demand for additional rented land in recent years and tenants bid up rental rates as a result. The following Wisconsin corn budget for 2016 illustrates the tight profit margins that are likely to exist this year if yields and harvest time prices are typical. Table 2 illustrates anticipated input costs associated with producing an acre of corn in 2017. Note that some of these costs are cash inputs and others non-cash such as repairs and depreciation. In the short run these fixed costs can be ignored – but they must be covered in the longer run.
Table 2. 2017 Wisconsin Corn Budget3 The returns to labor and management with different yield and corn price assumptions are in table 3. As an example, with these revenue and cost projections (including the state average $131/acre for rent) an
3 This budget was developed by Mr. Jim Leverich, UWEX On-Farm Research Coordinator.
2017 Corn Budget
Variable Costs
Input Units Cost Cost/ Unit Value % of Total
NH3 140 $725 $0.36 $50.75
AMS 125 $225 $0.11 $14.06
K2O 100 $325 $0.16 $16.25
Starter 100 $465 $0.23 $23.25
Lime 0.5 $15 $15.00 $7.50
Seed 30000 $280 $0.00350 $105.00
Chemicals $35 $35.00
Insurance $28 $28.00
Testing & Scouting $10 $10.00
Subtotal $289.81 46.31%
Field Operations
Nitrogen Application $12 $12.00
Spreading Fertilizer $3 $3.00
Primary Tillage $15 $15.00
Secondary Tillage $15 $15.00
Planting $20 $20.00
Spraying $15 $15.00
Combining $30 $30.00
Subtotal $110.00 17.58%
Trucking, Drying and Storage Costs
Trucking $30 $30.00
Drying $35 $35.00
Storage $30 $30.00
Subtotal $95.00 15.18%
Rent $131.00 20.93%
Total Costs $625.81
7
operator would lose $100 /acre with a yield of 150 bu. and average corn price of $3.50/bu. In this case renters are not able to cover their full cost of production and must hope for above average yields or improved commodity prices or both. The outlook for 2017 is not encouraging.
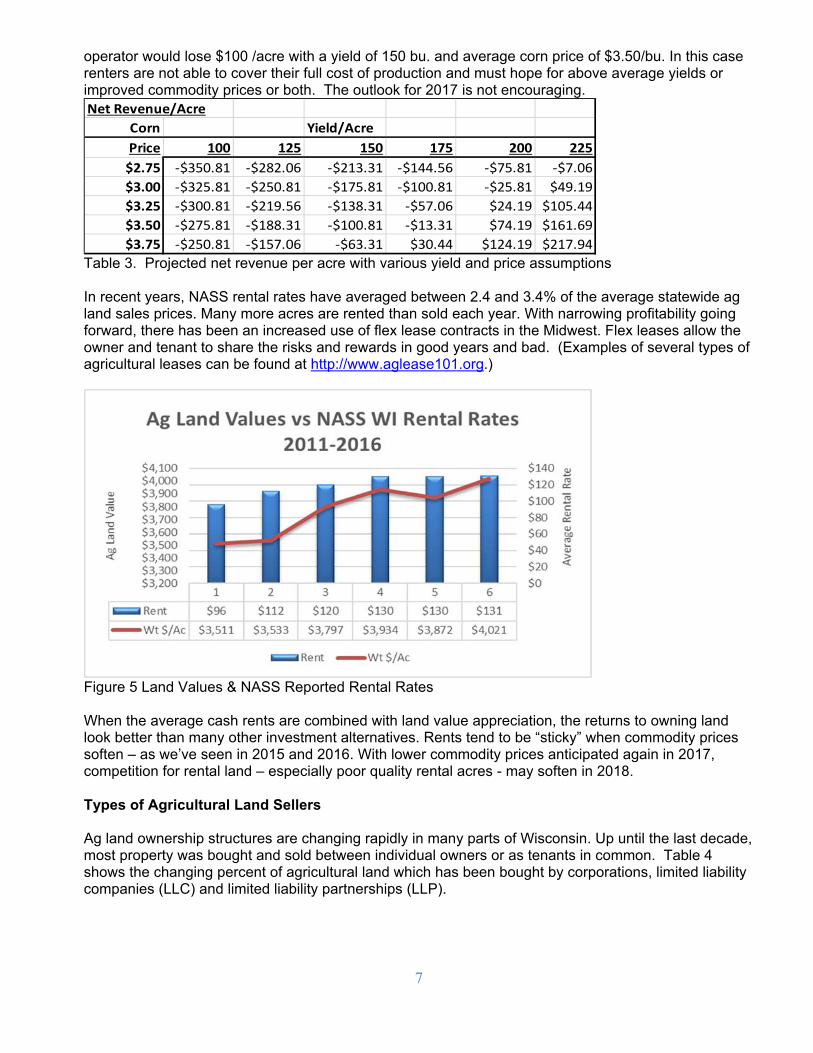
Table 3. Projected net revenue per acre with various yield and price assumptions In recent years, NASS rental rates have averaged between 2.4 and 3.4% of the average statewide ag land sales prices. Many more acres are rented than sold each year. With narrowing profitability going forward, there has been an increased use of flex lease contracts in the Midwest. Flex leases allow the owner and tenant to share the risks and rewards in good years and bad. (Examples of several types of agricultural leases can be found at http://www.aglease101.org.)
Figure 5 Land Values & NASS Reported Rental Rates When the average cash rents are combined with land value appreciation, the returns to owning land look better than many other investment alternatives. Rents tend to be “sticky” when commodity prices soften – as we’ve seen in 2015 and 2016. With lower commodity prices anticipated again in 2017, competition for rental land – especially poor quality rental acres - may soften in 2018. Types of Agricultural Land Sellers Ag land ownership structures are changing rapidly in many parts of Wisconsin. Up until the last decade, most property was bought and sold between individual owners or as tenants in common. Table 4 shows the changing percent of agricultural land which has been bought by corporations, limited liability companies (LLC) and limited liability partnerships (LLP).
Net Revenue/Acre
Corn Yield/Acre
Price 100 125 150 175 200 225
$2.75 ‐$350.81 ‐$282.06 ‐$213.31 ‐$144.56 ‐$75.81 ‐$7.06
$3.00 ‐$325.81 ‐$250.81 ‐$175.81 ‐$100.81 ‐$25.81 $49.19
$3.25 ‐$300.81 ‐$219.56 ‐$138.31 ‐$57.06 $24.19 $105.44
$3.50 ‐$275.81 ‐$188.31 ‐$100.81 ‐$13.31 $74.19 $161.69
$3.75 ‐$250.81 ‐$157.06 ‐$63.31 $30.44 $124.19 $217.94
8
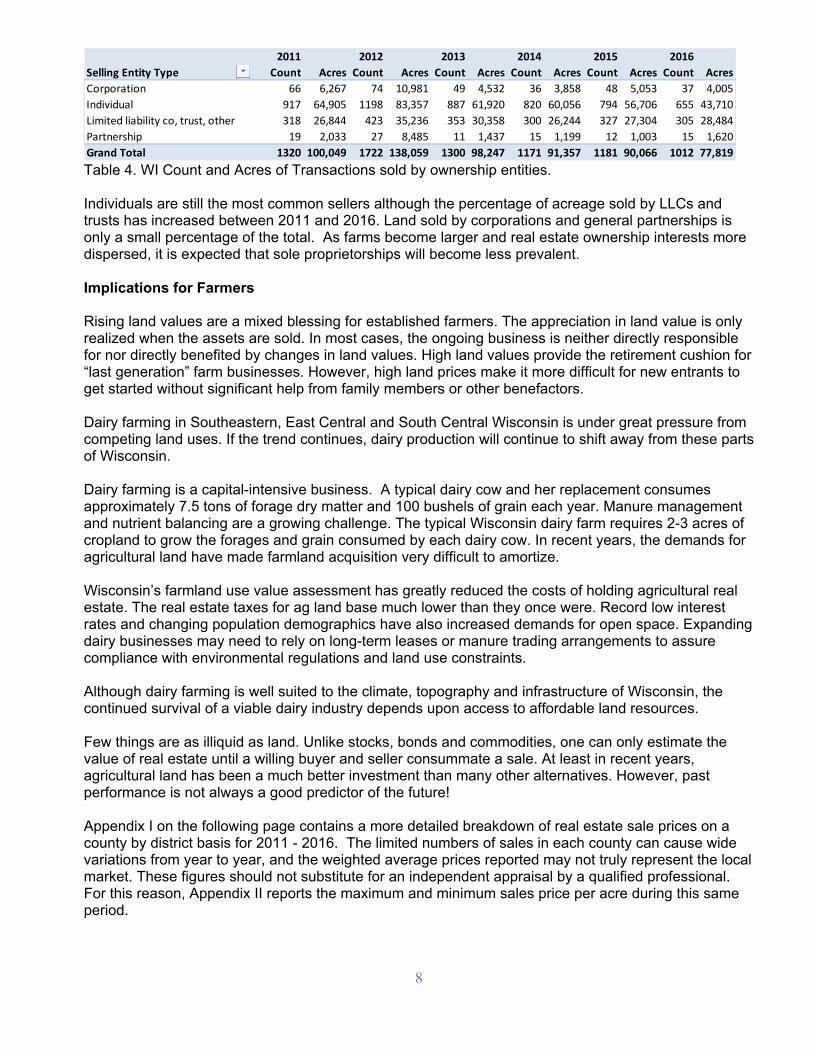
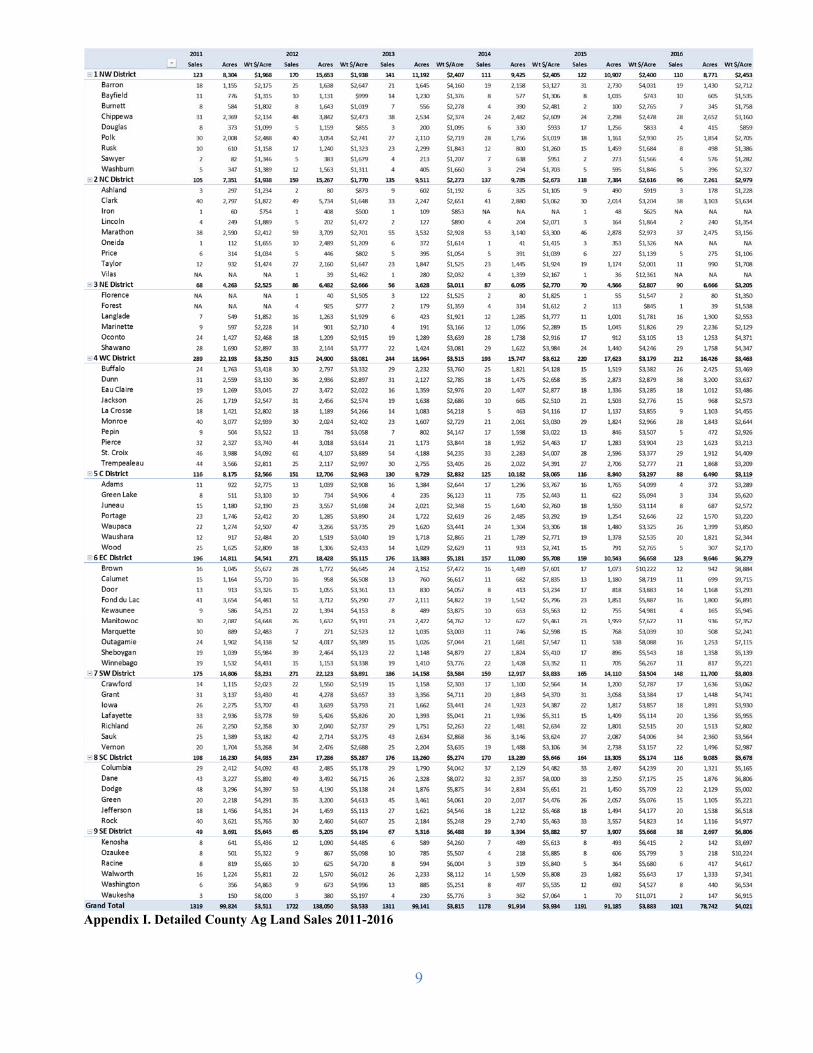
Table 4. WI Count and Acres of Transactions sold by ownership entities. Individuals are still the most common sellers although the percentage of acreage sold by LLCs and trusts has increased between 2011 and 2016. Land sold by corporations and general partnerships is only a small percentage of the total. As farms become larger and real estate ownership interests more dispersed, it is expected that sole proprietorships will become less prevalent. Implications for Farmers Rising land values are a mixed blessing for established farmers. The appreciation in land value is only realized when the assets are sold. In most cases, the ongoing business is neither directly responsible for nor directly benefited by changes in land values. High land values provide the retirement cushion for “last generation” farm businesses. However, high land prices make it more difficult for new entrants to get started without significant help from family members or other benefactors. Dairy farming in Southeastern, East Central and South Central Wisconsin is under great pressure from competing land uses. If the trend continues, dairy production will continue to shift away from these parts of Wisconsin. Dairy farming is a capital-intensive business. A typical dairy cow and her replacement consumes approximately 7.5 tons of forage dry matter and 100 bushels of grain each year. Manure management and nutrient balancing are a growing challenge. The typical Wisconsin dairy farm requires 2-3 acres of cropland to grow the forages and grain consumed by each dairy cow. In recent years, the demands for agricultural land have made farmland acquisition very difficult to amortize. Wisconsin’s farmland use value assessment has greatly reduced the costs of holding agricultural real estate. The real estate taxes for ag land base much lower than they once were. Record low interest rates and changing population demographics have also increased demands for open space. Expanding dairy businesses may need to rely on long-term leases or manure trading arrangements to assure compliance with environmental regulations and land use constraints. Although dairy farming is well suited to the climate, topography and infrastructure of Wisconsin, the continued survival of a viable dairy industry depends upon access to affordable land resources. Few things are as illiquid as land. Unlike stocks, bonds and commodities, one can only estimate the value of real estate until a willing buyer and seller consummate a sale. At least in recent years, agricultural land has been a much better investment than many other alternatives. However, past performance is not always a good predictor of the future! Appendix I on the following page contains a more detailed breakdown of real estate sale prices on a county by district basis for 2011 - 2016. The limited numbers of sales in each county can cause wide variations from year to year, and the weighted average prices reported may not truly represent the local market. These figures should not substitute for an independent appraisal by a qualified professional. For this reason, Appendix II reports the maximum and minimum sales price per acre during this same period.
2011 2012 2013 2014 2015 2016
Selling Entity Type Count Acres Count Acres Count Acres Count Acres Count Acres Count Acres
Corporation 66 6,267 74 10,981 49 4,532 36 3,858 48 5,053 37 4,005
Individual 917 64,905 1198 83,357 887 61,920 820 60,056 794 56,706 655 43,710
Limited liability co, trust, other 318 26,844 423 35,236 353 30,358 300 26,244 327 27,304 305 28,484
Partnership 19 2,033 27 8,485 11 1,437 15 1,199 12 1,003 15 1,620
Grand Total 1320 100,049 1722 138,059 1300 98,247 1171 91,357 1181 90,066 1012 77,819
9
Appendix I. Detailed County Ag Land Sales 2011-2016
10
Appendix II – Minimum, Wt Avg & Maximum $/Acre