Embed Size (px)
Citation preview
Wisconsin Bicycle and Pedestrian Trail Use Study
Research Report 2005-3
November 2005
TRAFFIC OPERATIONS AND SAFETY LABORATORY University of Wisconsin-Madison
Department of Civil and Environmental Engineering
Wisconsin Bicycle and Pedestrian Trail Use Study
by
David A. Noyce, Ph.D., P.E. Assistant Professor
University of Wisconsin - Madison Co-Director, TOPS
and
Arup Dutta
Graduate Research Assistant University of Wisconsin - Madison
Research Project Number: 144-MA81 Study Title: Wisconsin Bicycle/Pedestrian Trail Use Study
Sponsored by the
Wisconsin Department of Transportation
November, 2005
TRAFFIC OPERATIONS AND SAFETY LABORATORY University of Wisconsin-Madison
Department of Civil and Environmental Engineering 1415 Engineering Drive
Madison, WI 53706 www.topslab.wisc.edu
TOPS LAB REPORT 2005-003
iii
DISCLAIMER This research was funded by the Wisconsin Department of Transportation (WisDOT). The contents of this report reflect the views of the authors who are responsible for the facts and accuracy of the data presented herein. The contents do not necessarily reflect the official views or policies of the WisDOT or the University of Wisconsin. This document is disseminated under the sponsorship of WisDOT in the interest of information exchange. The agencies listed above assume no liability for its contents or use thereof. This report does not constitute a standard, specification, or regulation, and its contents are not intended for construction, bidding or permit purposes. The name of any products or manufacturers listed herein does not imply an endorsement of those products or manufacturers. Trade and manufacturers’ names appear in this report only because they are considered essential to the object of the document.
iv
ACKNOWLEDGEMENTS This research project was conducted under a cooperative program between the Traffic Operations and Safety (TOPS) Laboratory and the Wisconsin Department of Transportation (WisDOT). The authors acknowledge and appreciate the guidance of the WisDOT Bicycle and Pedestrian Coordinator, Mr. Thomas Huber. The contributions of the graduate and undergraduate research students in the University of Wisconsin - Madison, involved in the data collection process are gratefully acknowledged.
v
ABSTRACT Quantifying pedestrian and bicycle data continues to be a significant need for planning and operations decisions in transportation. This report documents the usage trends for several pedestrian/bicycle trails in the state of Wisconsin. Trail usage data was collected from sunrise to sunset at various locations selected by Wisconsin Department of Transportation (WisDOT) personnel. The data collected included the volume of users for fifteen minute intervals throughout the day, the various categories of trail users, and their estimated age groups. The two major categories of trail users were bicycles and pedestrians. Both these categories were further divided into demographic and user type subcategories in order to record more specific data for trail users. For trails intersecting with major roadways, the wait time for trail users to cross these roads was also recorded. Although the usage volumes differed from one trail to another, the data exhibited fairly similar usage trends over time. For long trails, usage volumes differed considerably in different sections of the same trail. Considerable user wait times were discovered for some of the trails intersecting with roadways, especially during peak hour traffic conditions. This crossing delay may indicate a safety issue for some trail users if significant delays result in trail users taking ad hoc risks to cross the roadway.
vi
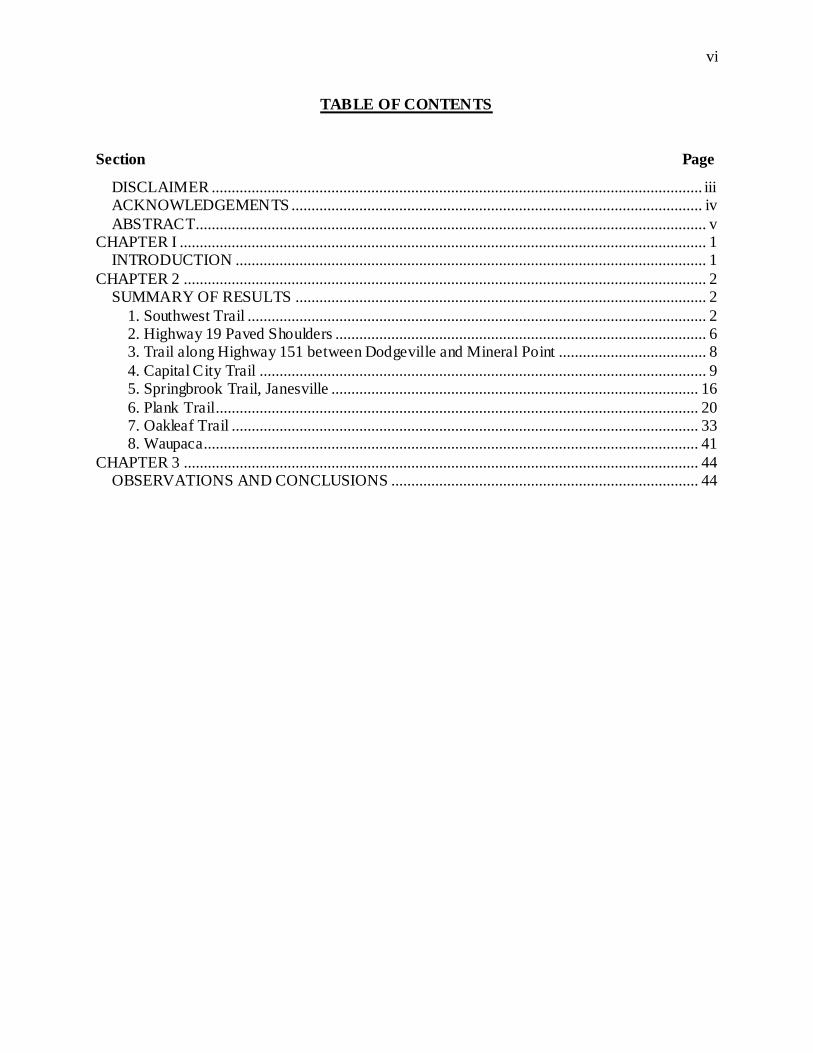
TABLE OF CONTENTS
Section Page
DISCLAIMER ........................................................................................................................... iii ACKNOWLEDGEMENTS ....................................................................................................... iv ABSTRACT................................................................................................................................ v
CHAPTER I .................................................................................................................................... 1 INTRODUCTION ...................................................................................................................... 1
CHAPTER 2 ................................................................................................................................... 2 SUMMARY OF RESULTS ....................................................................................................... 2
1. Southwest Trail ................................................................................................................... 2 2. Highway 19 Paved Shoulders ............................................................................................. 6 3. Trail along Highway 151 between Dodgeville and Mineral Point ..................................... 8 4. Capital City Trail ................................................................................................................ 9 5. Springbrook Trail, Janesville ............................................................................................ 16 6. Plank Trail......................................................................................................................... 20 7. Oakleaf Trail ..................................................................................................................... 33 8. Waupaca............................................................................................................................ 41
CHAPTER 3 ................................................................................................................................. 44 OBSERVATIONS AND CONCLUSIONS ............................................................................. 44
Wisconsin Bicycle and Pedestrian Trail Use Study Page 1
Traffic Operations and Safety Laboratory 8/29/2012
CHAPTER I
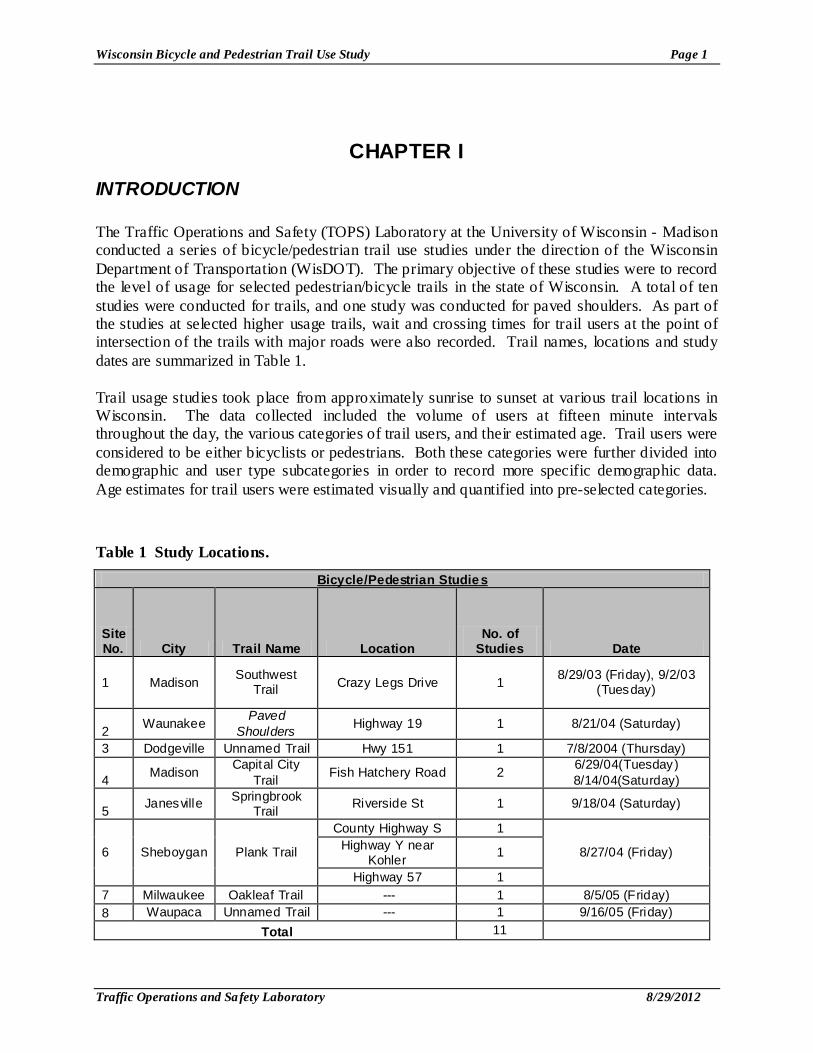
INTRODUCTION The Traffic Operations and Safety (TOPS) Laboratory at the University of Wisconsin - Madison conducted a series of bicycle/pedestrian trail use studies under the direction of the Wisconsin Department of Transportation (WisDOT). The primary objective of these studies were to record the level of usage for selected pedestrian/bicycle trails in the state of Wisconsin. A total of ten studies were conducted for trails, and one study was conducted for paved shoulders. As part of the studies at selected higher usage trails, wait and crossing times for trail users at the point of intersection of the trails with major roads were also recorded. Trail names, locations and study dates are summarized in Table 1. Trail usage studies took place from approximately sunrise to sunset at various trail locations in Wisconsin. The data collected included the volume of users at fifteen minute intervals throughout the day, the various categories of trail users, and their estimated age. Trail users were considered to be either bicyclists or pedestrians. Both these categories were further divided into demographic and user type subcategories in order to record more specific demographic data. Age estimates for trail users were estimated visually and quantified into pre-selected categories.
Table 1 Study Locations.
Bicycle/Pedestrian Studies
Site No. City Trail Name Location
No. of Studies Date
1 Madison Southwest Trail Crazy Legs Drive 1 8/29/03 (Friday), 9/2/03
(Tuesday)
2 Waunakee Paved Shoulders Highway 19 1 8/21/04 (Saturday)
3 Dodgeville Unnamed Trail Hwy 151 1 7/8/2004 (Thursday)
4 Madison Capital City Trail Fish Hatchery Road 2 6/29/04(Tuesday)
8/14/04(Saturday)
5 Janesville Springbrook Trail Riverside St 1 9/18/04 (Saturday)
6 Sheboygan Plank Trail
County Highway S 1
8/27/04 (Friday) Highway Y near Kohler 1
Highway 57 1 7 Milwaukee Oakleaf Trail --- 1 8/5/05 (Friday) 8 Waupaca Unnamed Trail --- 1 9/16/05 (Friday)
Total 11
Wisconsin Bicycle and Pedestrian Trail Use Study Page 2
Traffic Operations and Safety Laboratory 8/29/2012
CHAPTER 2
SUMMARY OF RESULTS This section presents a detailed graphical/tabular summary of study results. A graphical summary is provided for the movement counts. For the studies in which wait times were recorded, these data are also displayed graphically. The black and gray bars in the wait time graphs have been stacked on top of each other for clarity; however, the values for each bar should be read off the Y axis independently. Each black (or gray) bar is simply the average wait time (15 minute interval) for the entities representing the black (or gray) bar. ‘Demographic’ and ‘User Type’ information is also included in tables for each of the studies. ‘Demographic’ information includes the age estimation for the trail users. Age was estimated visually - these data should be considered with this in mind. ‘User Type’ data refers to the various subcategories of the pedestrian and bicycle users that were observed. The details for these have been summarized in tables for each of the studies. In the ‘Demographic and User Type’ tables, the summation of observed counts for user types is equal to the summation of the counts for the age related demographic information. Both equal to the total number of users for the trail. In some cases, however, there may be slight differences in these count totals due to demographic or user type information occasionally being missed (especially during high trail usage). Nevertheless, the count totals provide an adequate estimation of the demographic and user type.
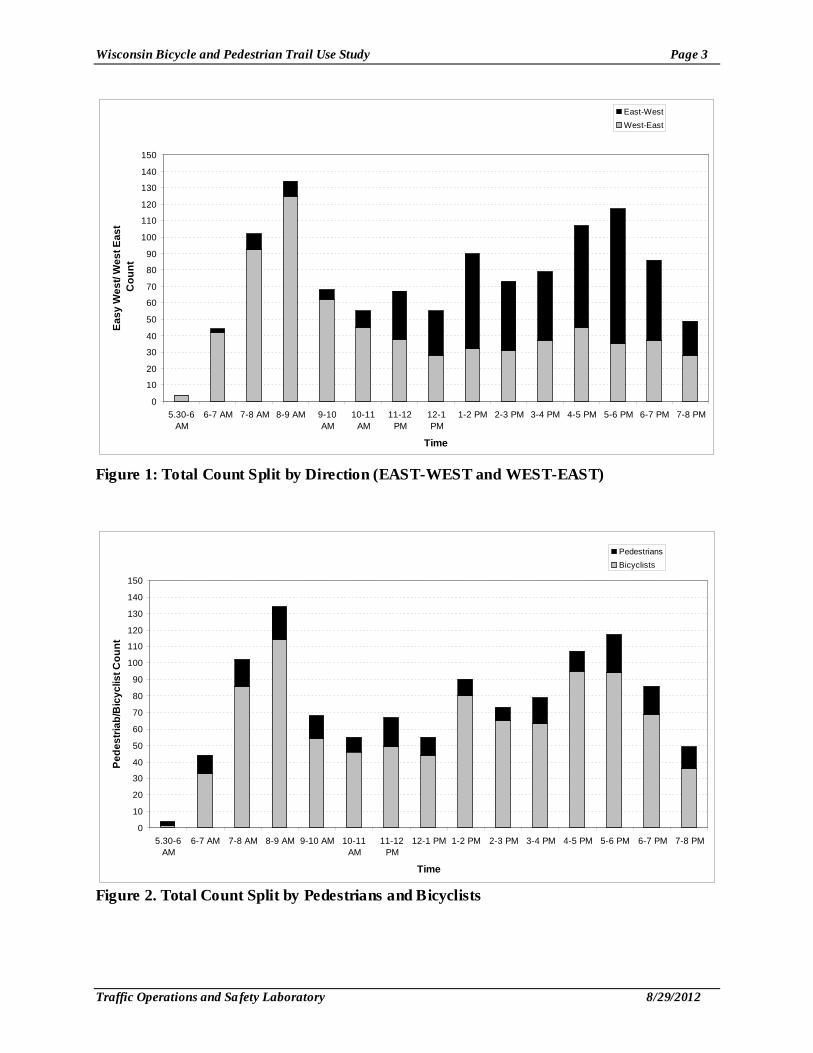
1. Southwest Trail TRAIL NAME: Southwest Trail DATE: 8/29/03 (Friday), 9/2/03 (Tuesday) LOCATION: Madison, WI - Southwest Bike Path just west of Breese Terrace WEATHER: Partly cloudy TEMPERATURE: 70 to 80 degrees HUMIDITY: Low (Around 50%) DATA COLLECTION TIME: 5:30 AM to 8:00 PM For this trail, data was collected from 8:00 AM to 8:00 PM on August 29, 2003 and 5:30 AM to 8:00 PM on September 2, 2005. Total number of trail users for this trail was 1,130, consisting of 929 bicyclists and 201 pedestrians. The 8:00 AM to 8:00 PM study on August 29 consisted of 980 users, out of which 809 were bicyclists and 171 were pedestrians. The 5:30 AM to 8:00 AM study on September 2 consisted of 150 users, out of which 120 were bicyclists and 130 were pedestrians. There were two peak periods of usage, one in the morning (8:00 AM to 9:00 AM) and the other in the evening (5:00 PM to 6:00 PM). Morning peak was dominated by trail users moving in the west to east direction. In the evening peak period, usage in the east to west direction was more pronounced. The number of bicyclists was higher than the number of pedestrians throughout the study period.
Wisconsin Bicycle and Pedestrian Trail Use Study Page 3
Traffic Operations and Safety Laboratory 8/29/2012
0
10
20
30
40
50
60
70
80
90
100
110
120
130
140
150
5.30-6AM
6-7 AM 7-8 AM 8-9 AM 9-10AM
10-11AM
11-12PM
12-1PM
1-2 PM 2-3 PM 3-4 PM 4-5 PM 5-6 PM 6-7 PM 7-8 PM
Time
Easy
Wes
t/ W
est E
ast
Cou
nt
East-WestWest-East
Figure 1: Total Count Split by Direction (EAST-WEST and WEST-EAST)
0
10
20
30
40
50
60
70
80
90
100
110
120
130
140
150
5.30-6AM
6-7 AM 7-8 AM 8-9 AM 9-10 AM 10-11AM
11-12PM
12-1 PM 1-2 PM 2-3 PM 3-4 PM 4-5 PM 5-6 PM 6-7 PM 7-8 PM
Time
Pede
stria
b/B
icyc
list C
ount
PedestriansBicyclists
Figure 2. Total Count Split by Pedestrians and Bicyclists
Wisconsin Bicycle and Pedestrian Trail Use Study Page 4
Traffic Operations and Safety Laboratory 8/29/2012
0
1020
30
40
5060
70
8090
100
110
120130
140
5.30-6AM
6-7 AM 7-8 AM 8-9 AM 9-10 AM 10-11AM
11-12PM
12-1 PM 1-2 PM 2-3 PM 3-4 PM 4-5 PM 5-6 PM 6-7 PM 7-8 PM
Time
Ped
estr
ian/
Bic
yclis
t Cou
ntPedestrianssBicyclistss
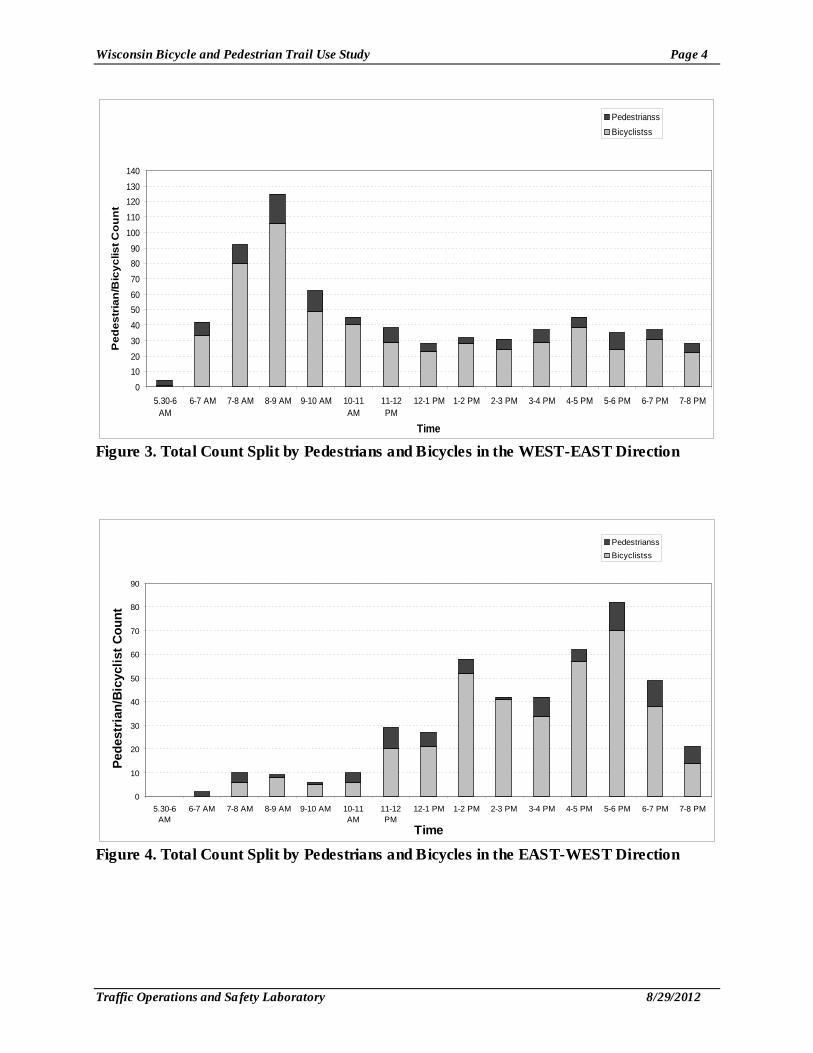
Figure 3. Total Count Split by Pedestrians and Bicycles in the WEST-EAST Direction
0
10
20
30
40
50
60
70
80
90
5.30-6AM
6-7 AM 7-8 AM 8-9 AM 9-10 AM 10-11AM
11-12PM
12-1 PM 1-2 PM 2-3 PM 3-4 PM 4-5 PM 5-6 PM 6-7 PM 7-8 PM
Time
Pede
stri
an/B
icyc
list C
ount
PedestrianssBicyclistss
Figure 4. Total Count Split by Pedestrians and Bicycles in the EAST-WEST Direction
Wisconsin Bicycle and Pedestrian Trail Use Study Page 5
Traffic Operations and Safety Laboratory 8/29/2012
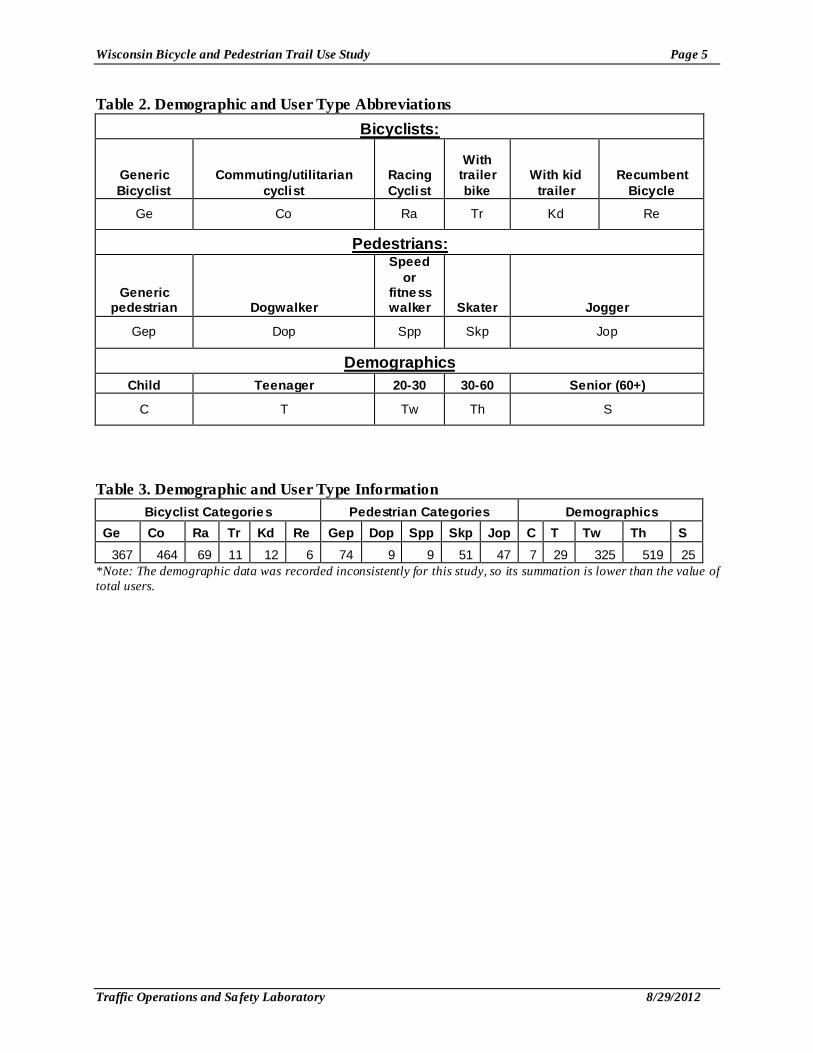
Table 2. Demographic and User Type Abbreviations Bicyclists:
Generic Bicyclist
Commuting/utilitarian cyclist
Racing Cyclist
With trailer bike
With kid trailer
Recumbent Bicycle
Ge Co Ra Tr Kd Re
Pedestrians:
Generic pedestrian Dogwalker
Speed or
fitness walker Skater Jogger
Gep Dop Spp Skp Jop
Demographics Child Teenager 20-30 30-60 Senior (60+)
C T Tw Th S
Table 3. Demographic and User Type Information
Bicyclist Categories Pedestrian Categories Demographics Ge Co Ra Tr Kd Re Gep Dop Spp Skp Jop C T Tw Th S
367 464 69 11 12 6 74 9 9 51 47 7 29 325 519 25 *Note: The demographic data was recorded inconsistently for this study, so its summation is lower than the value of total users.
Wisconsin Bicycle and Pedestrian Trail Use Study Page 6
Traffic Operations and Safety Laboratory 8/29/2012
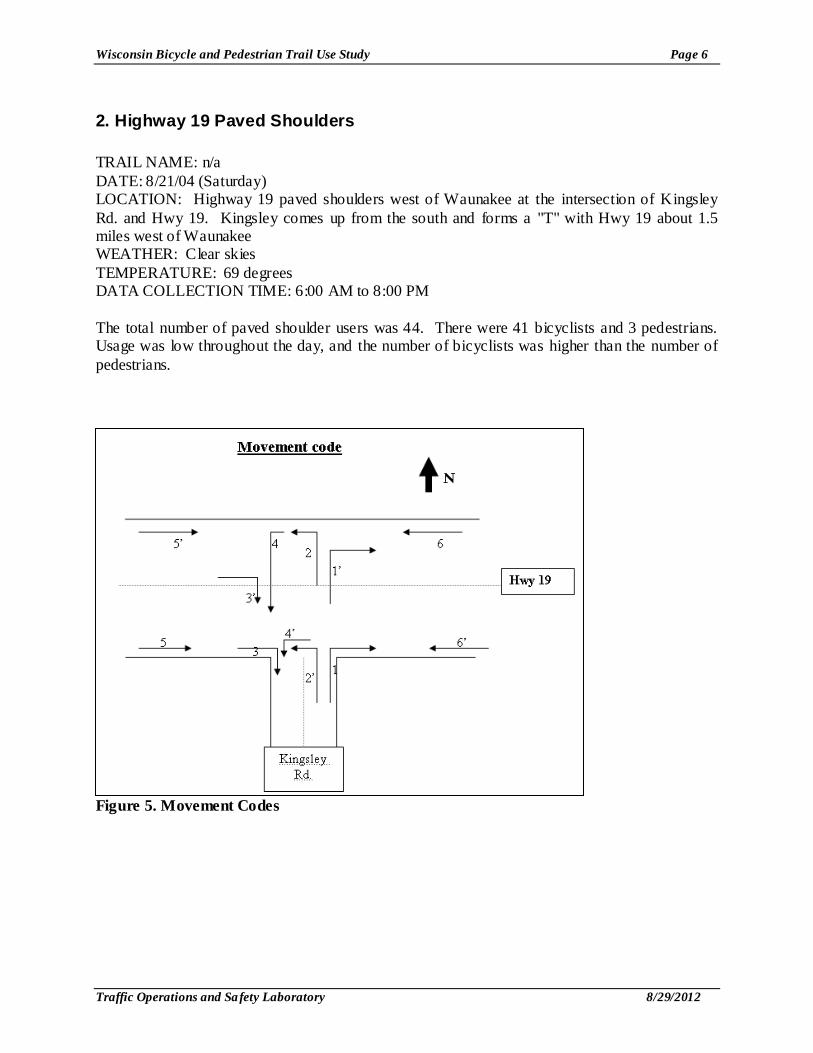
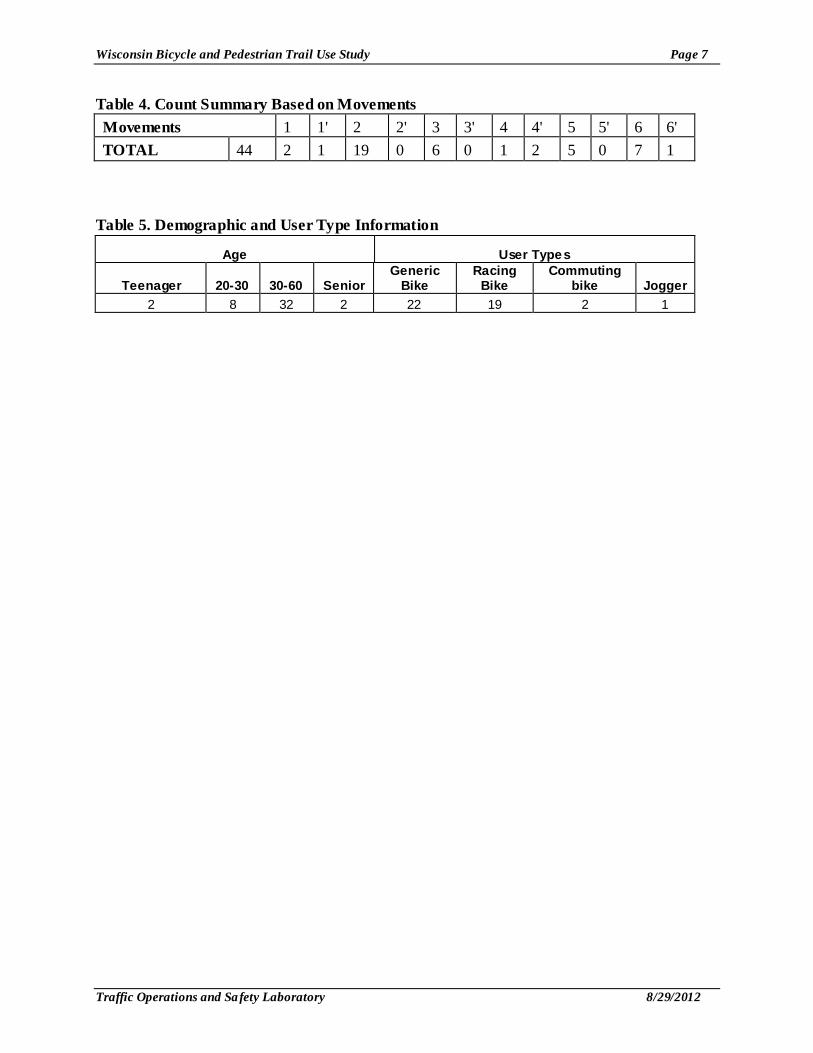
2. Highway 19 Paved Shoulders TRAIL NAME: n/a DATE: 8/21/04 (Saturday) LOCATION: Highway 19 paved shoulders west of Waunakee at the intersection of Kingsley Rd. and Hwy 19. Kingsley comes up from the south and forms a "T" with Hwy 19 about 1.5 miles west of Waunakee WEATHER: Clear skies TEMPERATURE: 69 degrees DATA COLLECTION TIME: 6:00 AM to 8:00 PM The total number of paved shoulder users was 44. There were 41 bicyclists and 3 pedestrians. Usage was low throughout the day, and the number of bicyclists was higher than the number of pedestrians.
Figure 5. Movement Codes
Wisconsin Bicycle and Pedestrian Trail Use Study Page 7
Traffic Operations and Safety Laboratory 8/29/2012
Table 4. Count Summary Based on Movements Movements 1 1' 2 2' 3 3' 4 4' 5 5' 6 6' TOTAL 44 2 1 19 0 6 0 1 2 5 0 7 1
Table 5. Demographic and User Type Information
Age User Types
Teenager 20-30 30-60 Senior Generic
Bike Racing
Bike Commuting
bike Jogger 2 8 32 2 22 19 2 1
Wisconsin Bicycle and Pedestrian Trail Use Study Page 8
Traffic Operations and Safety Laboratory 8/29/2012
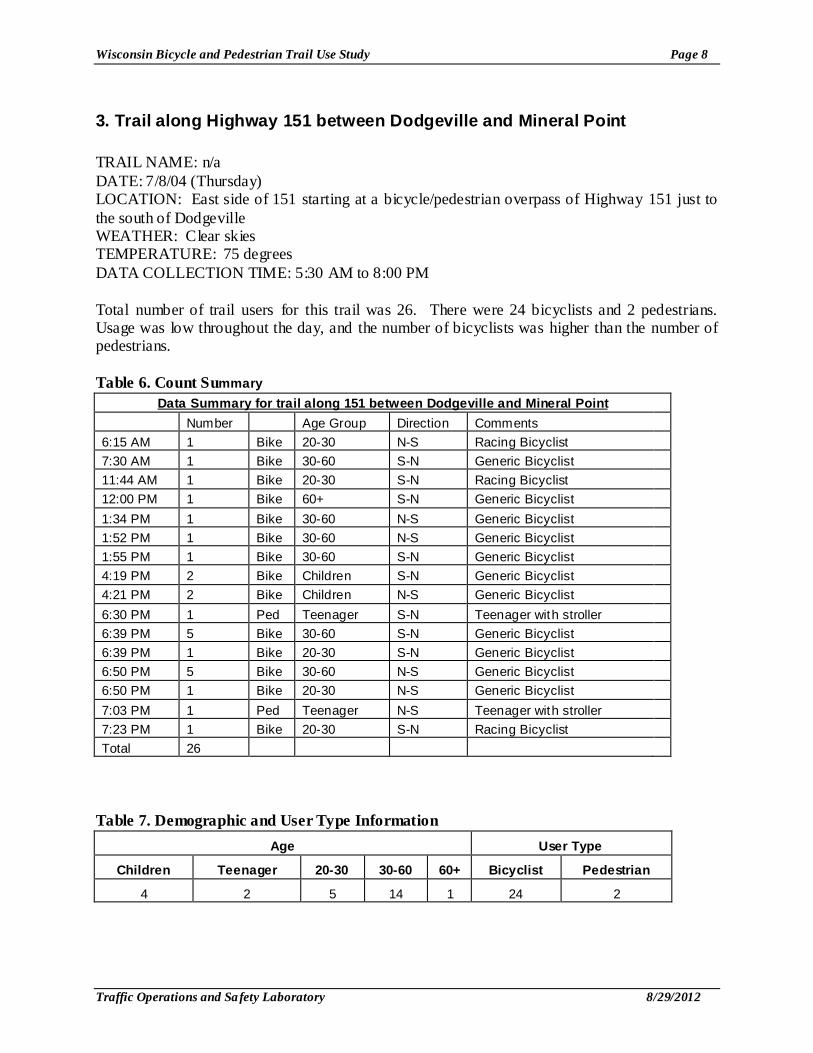
3. Trail along Highway 151 between Dodgeville and Mineral Point TRAIL NAME: n/a DATE: 7/8/04 (Thursday) LOCATION: East side of 151 starting at a bicycle/pedestrian overpass of Highway 151 just to the south of Dodgeville WEATHER: Clear skies TEMPERATURE: 75 degrees DATA COLLECTION TIME: 5:30 AM to 8:00 PM Total number of trail users for this trail was 26. There were 24 bicyclists and 2 pedestrians. Usage was low throughout the day, and the number of bicyclists was higher than the number of pedestrians. Table 6. Count Summary
Data Summary for trail along 151 between Dodgeville and Mineral Point Number Age Group Direction Comments 6:15 AM 1 Bike 20-30 N-S Racing Bicyclist 7:30 AM 1 Bike 30-60 S-N Generic Bicyclist 11:44 AM 1 Bike 20-30 S-N Racing Bicyclist 12:00 PM 1 Bike 60+ S-N Generic Bicyclist 1:34 PM 1 Bike 30-60 N-S Generic Bicyclist 1:52 PM 1 Bike 30-60 N-S Generic Bicyclist 1:55 PM 1 Bike 30-60 S-N Generic Bicyclist 4:19 PM 2 Bike Children S-N Generic Bicyclist 4:21 PM 2 Bike Children N-S Generic Bicyclist 6:30 PM 1 Ped Teenager S-N Teenager with stroller 6:39 PM 5 Bike 30-60 S-N Generic Bicyclist 6:39 PM 1 Bike 20-30 S-N Generic Bicyclist 6:50 PM 5 Bike 30-60 N-S Generic Bicyclist 6:50 PM 1 Bike 20-30 N-S Generic Bicyclist 7:03 PM 1 Ped Teenager N-S Teenager with stroller 7:23 PM 1 Bike 20-30 S-N Racing Bicyclist Total 26
Table 7. Demographic and User Type Information
Age User Type
Children Teenager 20-30 30-60 60+ Bicyclist Pedestrian
4 2 5 14 1 24 2
Wisconsin Bicycle and Pedestrian Trail Use Study Page 9
Traffic Operations and Safety Laboratory 8/29/2012
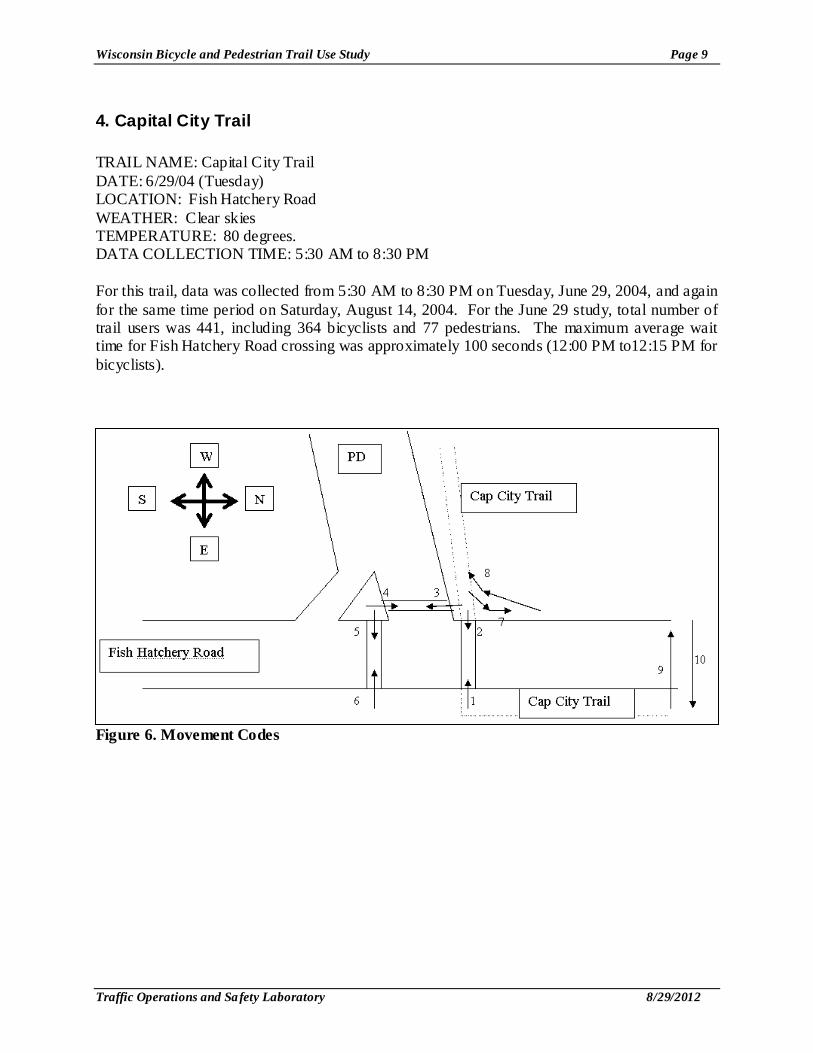
4. Capital City Trail TRAIL NAME: Capital City Trail DATE: 6/29/04 (Tuesday) LOCATION: Fish Hatchery Road WEATHER: Clear skies TEMPERATURE: 80 degrees. DATA COLLECTION TIME: 5:30 AM to 8:30 PM For this trail, data was collected from 5:30 AM to 8:30 PM on Tuesday, June 29, 2004, and again for the same time period on Saturday, August 14, 2004. For the June 29 study, total number of trail users was 441, including 364 bicyclists and 77 pedestrians. The maximum average wait time for Fish Hatchery Road crossing was approximately 100 seconds (12:00 PM to12:15 PM for bicyclists).
Figure 6. Movement Codes
Wisconsin Bicycle and Pedestrian Trail Use Study Page 10
Traffic Operations and Safety Laboratory 8/29/2012
0
5
10
15
20
25
5:30
-5:4
5
6:15
-6:3
0
7:00
-7:1
5
7:45
-8:0
0
8:30
:8:4
5
9:15
:9:3
0
10:0
0-10
:15
10:4
5-11
:00
11:3
0-11
:45
12:1
5-12
:30
1:00
-1:1
5
1:45
-2:0
0
2:30
-2:4
5
3:15
-3:3
0
4:00
-4:1
5
4:45
-5:0
0
5:30
-5:4
5
6:15
-6:3
0
7:00
-7:1
5
7:45
-8:0
0
Time Intervals
Tota
l Cou
ntTotal Pedestrians (All Movements)Total Bicyclists (All Movements)
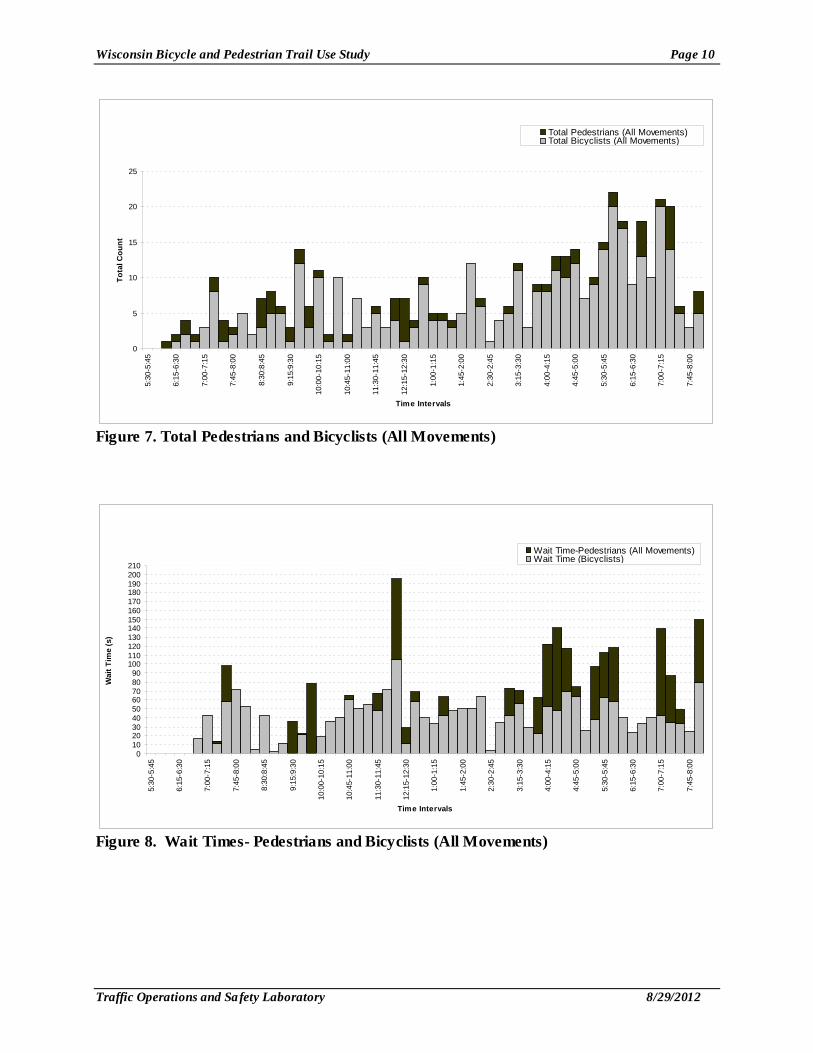
Figure 7. Total Pedestrians and Bicyclists (All Movements)
0102030405060708090
100110120130140150160170180190200210
5:30
-5:4
5
6:15
-6:3
0
7:00
-7:1
5
7:45
-8:0
0
8:30
:8:4
5
9:15
:9:3
0
10:0
0-10
:15
10:4
5-11
:00
11:3
0-11
:45
12:1
5-12
:30
1:00
-1:1
5
1:45
-2:0
0
2:30
-2:4
5
3:15
-3:3
0
4:00
-4:1
5
4:45
-5:0
0
5:30
-5:4
5
6:15
-6:3
0
7:00
-7:1
5
7:45
-8:0
0
Time Intervals
Wai
t Tim
e (s
)
Wait Time-Pedestrians (All Movements)Wait Time (Bicyclists)
Figure 8. Wait Times- Pedestrians and Bicyclists (All Movements)
Wisconsin Bicycle and Pedestrian Trail Use Study Page 11
Traffic Operations and Safety Laboratory 8/29/2012
0
2
4
6
8
10
12
14
16
5:30
-5:4
5
6:15
-6:3
0
7:00
-7:1
5
7:45
-8:0
0
8:30
:8:4
5
9:15
:9:3
0
10:0
0-10
:15
10:4
5-11
:00
11:3
0-11
:45
12:1
5-12
:30
1:00
-1:1
5
1:45
-2:0
0
2:30
-2:4
5
3:15
-3:3
0
4:00
-4:1
5
4:45
-5:0
0
5:30
-5:4
5
6:15
-6:3
0
7:00
-7:1
5
7:45
-8:0
0
Time Intervals
Tota
l Cou
ntTotal Bicyclists+Pedestrians (Movement1+6)Total Bicyclists+Pedestrians (Movement2+5)
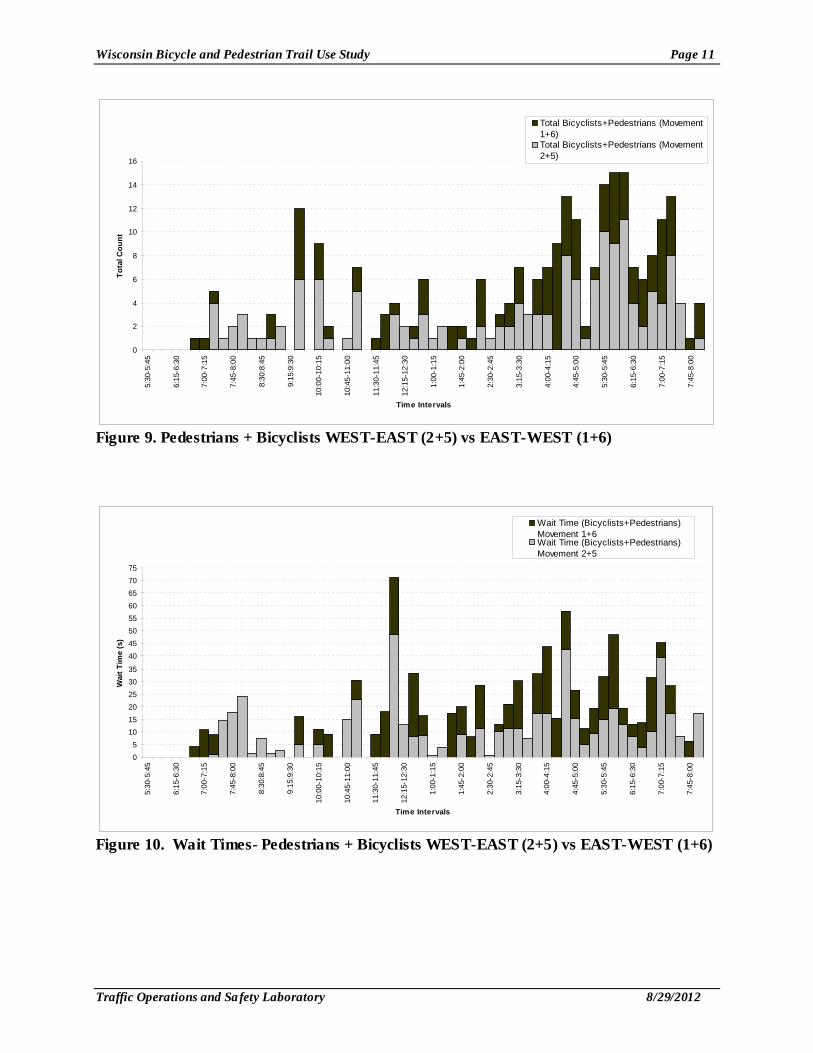
Figure 9. Pedestrians + Bicyclists WEST-EAST (2+5) vs EAST-WEST (1+6)
05
101520253035
4045505560657075
5:30
-5:4
5
6:15
-6:3
0
7:00
-7:1
5
7:45
-8:0
0
8:30
:8:4
5
9:15
:9:3
0
10:0
0-10
:15
10:4
5-11
:00
11:3
0-11
:45
12:1
5-12
:30
1:00
-1:1
5
1:45
-2:0
0
2:30
-2:4
5
3:15
-3:3
0
4:00
-4:1
5
4:45
-5:0
0
5:30
-5:4
5
6:15
-6:3
0
7:00
-7:1
5
7:45
-8:0
0
Time Intervals
Wai
t Tim
e (s
)
Wait Time (Bicyclists+Pedestrians)Movement 1+6Wait Time (Bicyclists+Pedestrians)Movement 2+5
Figure 10. Wait Times- Pedestrians + Bicyclists WEST-EAST (2+5) vs EAST-WEST (1+6)
Wisconsin Bicycle and Pedestrian Trail Use Study Page 12
Traffic Operations and Safety Laboratory 8/29/2012
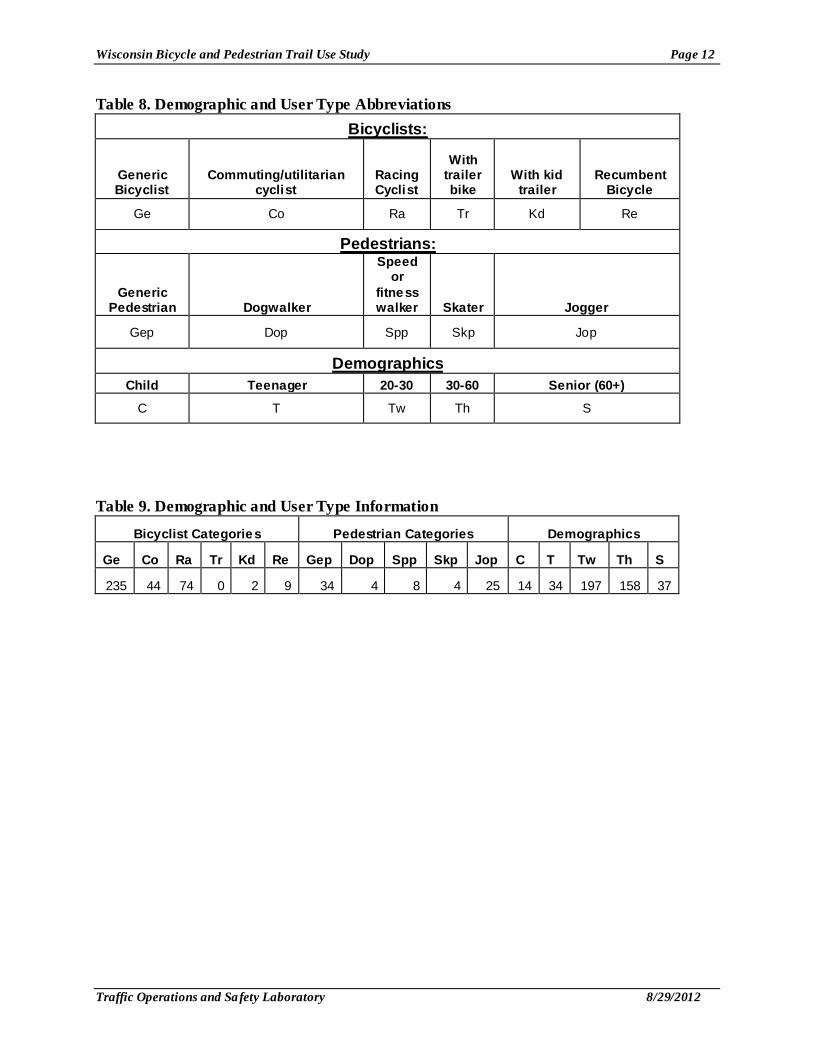
Table 8. Demographic and User Type Abbreviations Bicyclists:
Generic Bicyclist
Commuting/utilitarian cyclist
Racing Cyclist
With trailer bike
With kid trailer
Recumbent Bicycle
Ge Co Ra Tr Kd Re
Pedestrians:
Generic Pedestrian Dogwalker
Speed or
fitness walker Skater Jogger
Gep Dop Spp Skp Jop
Demographics Child Teenager 20-30 30-60 Senior (60+)
C T Tw Th S
Table 9. Demographic and User Type Information
Bicyclist Categories Pedestrian Categories Demographics
Ge Co Ra Tr Kd Re Gep Dop Spp Skp Jop C T Tw Th S
235 44 74 0 2 9 34 4 8 4 25 14 34 197 158 37
Wisconsin Bicycle and Pedestrian Trail Use Study Page 13
Traffic Operations and Safety Laboratory 8/29/2012
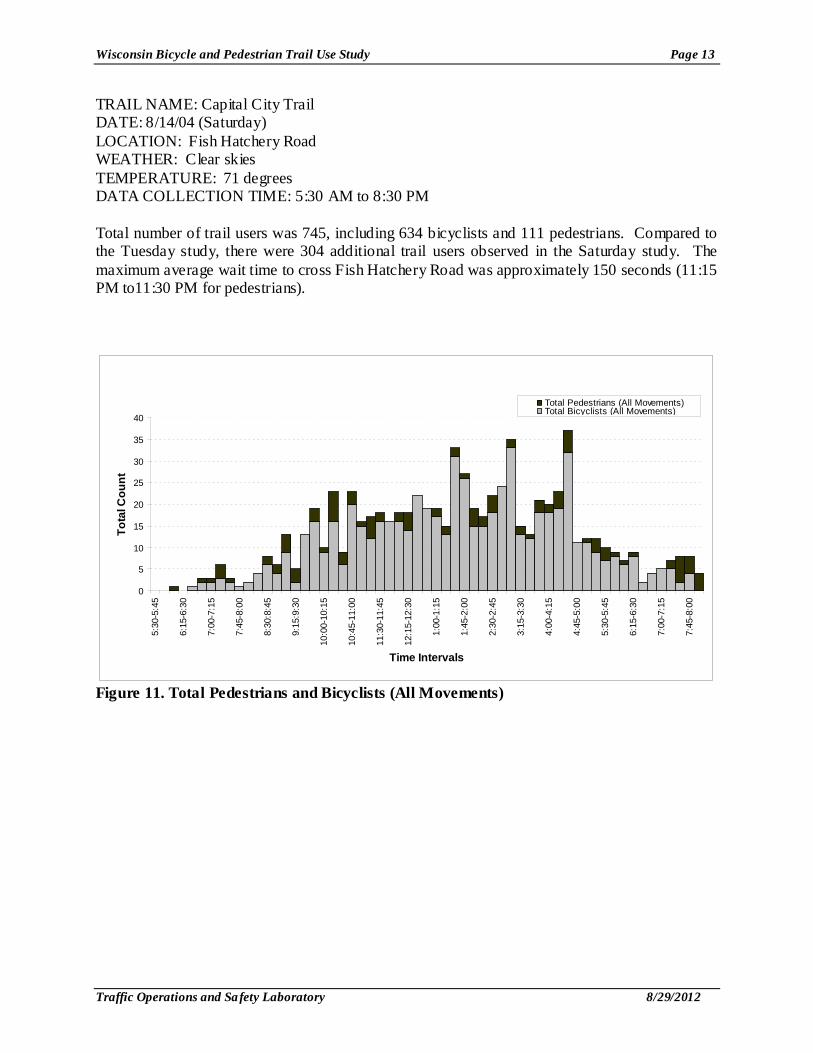
TRAIL NAME: Capital City Trail DATE: 8/14/04 (Saturday) LOCATION: Fish Hatchery Road WEATHER: Clear skies TEMPERATURE: 71 degrees DATA COLLECTION TIME: 5:30 AM to 8:30 PM Total number of trail users was 745, including 634 bicyclists and 111 pedestrians. Compared to the Tuesday study, there were 304 additional trail users observed in the Saturday study. The maximum average wait time to cross Fish Hatchery Road was approximately 150 seconds (11:15 PM to11:30 PM for pedestrians).
0
5
10
15
20
25
30
35
40
5:30
-5:4
5
6:15
-6:3
0
7:00
-7:1
5
7:45
-8:0
0
8:30
:8:4
5
9:15
:9:3
0
10:0
0-10
:15
10:4
5-11
:00
11:3
0-11
:45
12:1
5-12
:30
1:00
-1:1
5
1:45
-2:0
0
2:30
-2:4
5
3:15
-3:3
0
4:00
-4:1
5
4:45
-5:0
0
5:30
-5:4
5
6:15
-6:3
0
7:00
-7:1
5
7:45
-8:0
0
Time Intervals
Tota
l Cou
nt
Total Pedestrians (All Movements)Total Bicyclists (All Movements)
Figure 11. Total Pedestrians and Bicyclists (All Movements)
Wisconsin Bicycle and Pedestrian Trail Use Study Page 14
Traffic Operations and Safety Laboratory 8/29/2012
0102030405060708090
100110120130140150160170180190200
5:30
-5:4
5
6:15
-6:3
0
7:00
-7:1
5
7:45
-8:0
0
8:30
:8:4
5
9:15
:9:3
0
10:0
0-10
:15
10:4
5-11
:00
11:3
0-11
:45
12:1
5-12
:30
1:00
-1:1
5
1:45
-2:0
0
2:30
-2:4
5
3:15
-3:3
0
4:00
-4:1
5
4:45
-5:0
0
5:30
-5:4
5
6:15
-6:3
0
7:00
-7:1
5
7:45
-8:0
0
Time Intervals
Wai
t Tim
e (s
)
Wait Time (Pedestrians)Wait Time (Bicyclists)
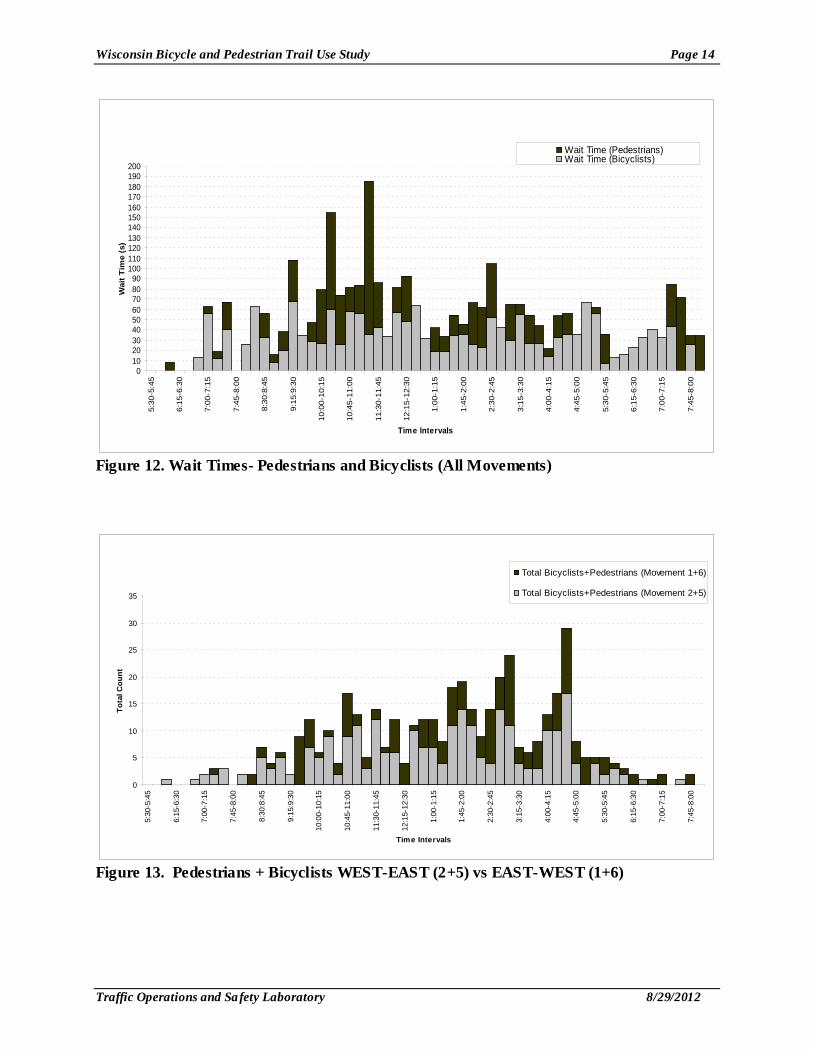
Figure 12. Wait Times- Pedestrians and Bicyclists (All Movements)
0
5
10
15
20
25
30
35
5:30
-5:4
5
6:15
-6:3
0
7:00
-7:1
5
7:45
-8:0
0
8:30
:8:4
5
9:15
:9:3
0
10:0
0-10
:15
10:4
5-11
:00
11:3
0-11
:45
12:1
5-12
:30
1:00
-1:1
5
1:45
-2:0
0
2:30
-2:4
5
3:15
-3:3
0
4:00
-4:1
5
4:45
-5:0
0
5:30
-5:4
5
6:15
-6:3
0
7:00
-7:1
5
7:45
-8:0
0
Time Intervals
Tota
l Cou
nt
Total Bicyclists+Pedestrians (Movement 1+6)
Total Bicyclists+Pedestrians (Movement 2+5)
Figure 13. Pedestrians + Bicyclists WEST-EAST (2+5) vs EAST-WEST (1+6)
Wisconsin Bicycle and Pedestrian Trail Use Study Page 15
Traffic Operations and Safety Laboratory 8/29/2012
0
5
10
15
20
25
30
35
40
45
50
55
60
5:30
-5:4
5
6:15
-6:3
0
7:00
-7:1
5
7:45
-8:0
0
8:30
:8:4
5
9:15
:9:3
0
10:0
0-10
:15
10:4
5-11
:00
11:3
0-11
:45
12:1
5-12
:30
1:00
-1:1
5
1:45
-2:0
0
2:30
-2:4
5
3:15
-3:3
0
4:00
-4:1
5
4:45
-5:0
0
5:30
-5:4
5
6:15
-6:3
0
7:00
-7:1
5
7:45
-8:0
0
Time Intervals
Wai
t Tim
e (s
)Wait Time-Bicyclists+Pedestrians(Movement 1+6)Wait Time-Bicyclists+Pedestrians(Movement 2+5)
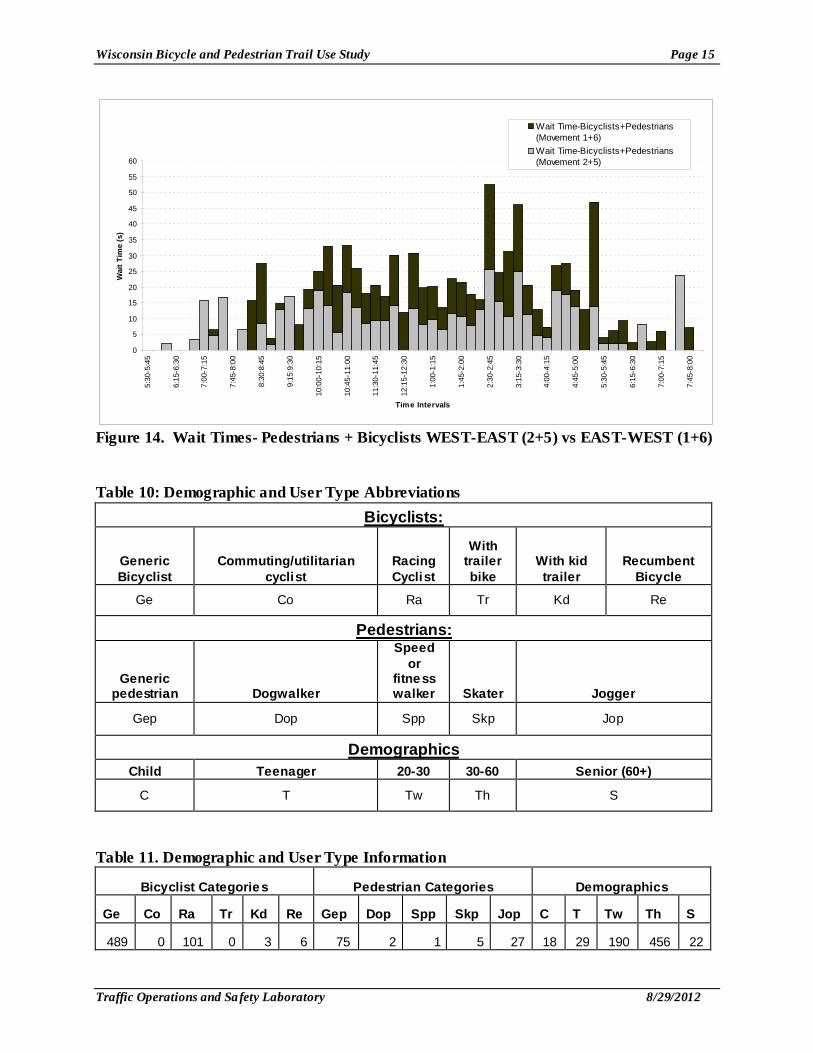
Figure 14. Wait Times- Pedestrians + Bicyclists WEST-EAST (2+5) vs EAST-WEST (1+6) Table 10: Demographic and User Type Abbreviations
Bicyclists:
Generic Bicyclist
Commuting/utilitarian cyclist
Racing Cyclist
With trailer bike
With kid trailer
Recumbent Bicycle
Ge Co Ra Tr Kd Re
Pedestrians:
Generic pedestrian Dogwalker
Speed or
fitness walker Skater Jogger
Gep Dop Spp Skp Jop
Demographics Child Teenager 20-30 30-60 Senior (60+)
C T Tw Th S
Table 11. Demographic and User Type Information
Bicyclist Categories Pedestrian Categories Demographics
Ge Co Ra Tr Kd Re Gep Dop Spp Skp Jop C T Tw Th S
489 0 101 0 3 6 75 2 1 5 27 18 29 190 456 22
Wisconsin Bicycle and Pedestrian Trail Use Study Page 16
Traffic Operations and Safety Laboratory 8/29/2012
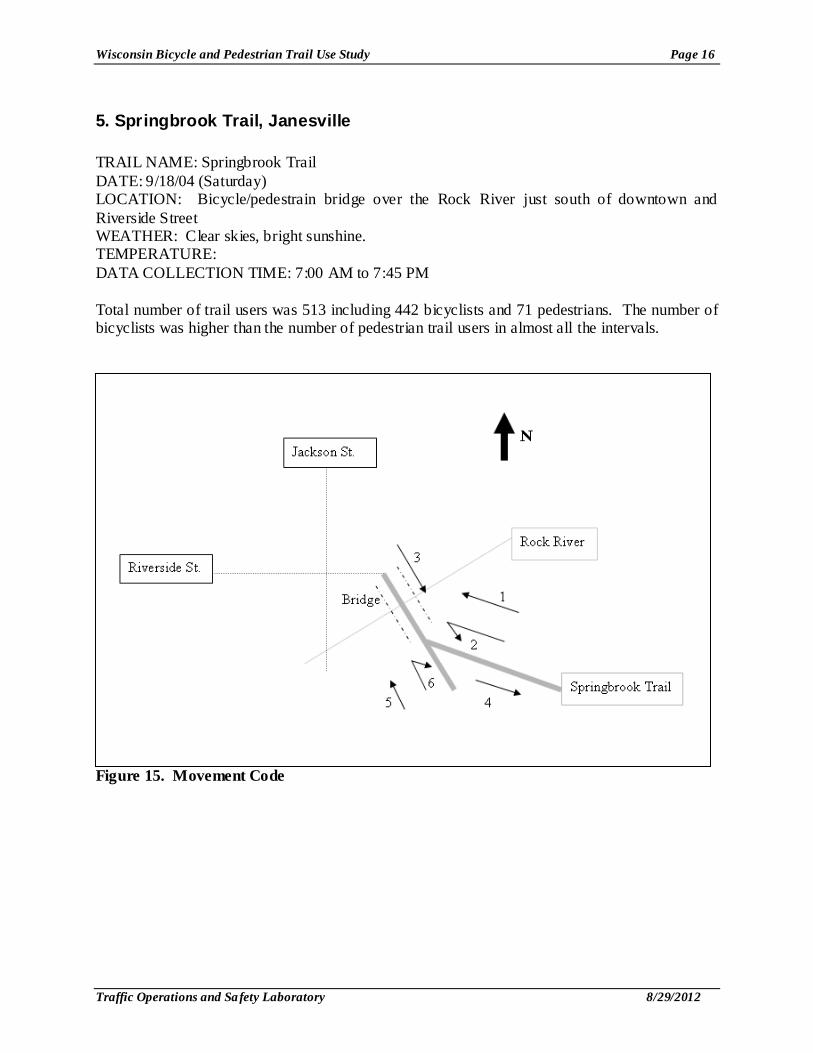
5. Springbrook Trail, Janesville TRAIL NAME: Springbrook Trail DATE: 9/18/04 (Saturday) LOCATION: Bicycle/pedestrain bridge over the Rock River just south of downtown and Riverside Street WEATHER: Clear skies, bright sunshine. TEMPERATURE: DATA COLLECTION TIME: 7:00 AM to 7:45 PM Total number of trail users was 513 including 442 bicyclists and 71 pedestrians. The number of bicyclists was higher than the number of pedestrian trail users in almost all the intervals.
Figure 15. Movement Code
Wisconsin Bicycle and Pedestrian Trail Use Study Page 17
Traffic Operations and Safety Laboratory 8/29/2012
0
3
6
9
12
15
18
21
24
27
7:0
0-7
:15
7:4
5-8
:00
8:3
0:8
:45
9:1
5:9
:30
10:0
0-1
0:1
5
10:4
5-1
1:0
0
11:3
0-1
1:4
5
12:1
5-1
2:3
0
1:0
0-1
:15
1:4
5-2
:00
2:3
0-2
:45
3:1
5-3
:30
4:0
0-4
:15
4:4
5-5
:00
5:3
0-5
:45
6:1
5-6
:30
7:0
0-7
:15
Time Intervals
To
tal C
ou
nt
Total Pedestrians (All Movements)
Total Bicyclists (All Movements)
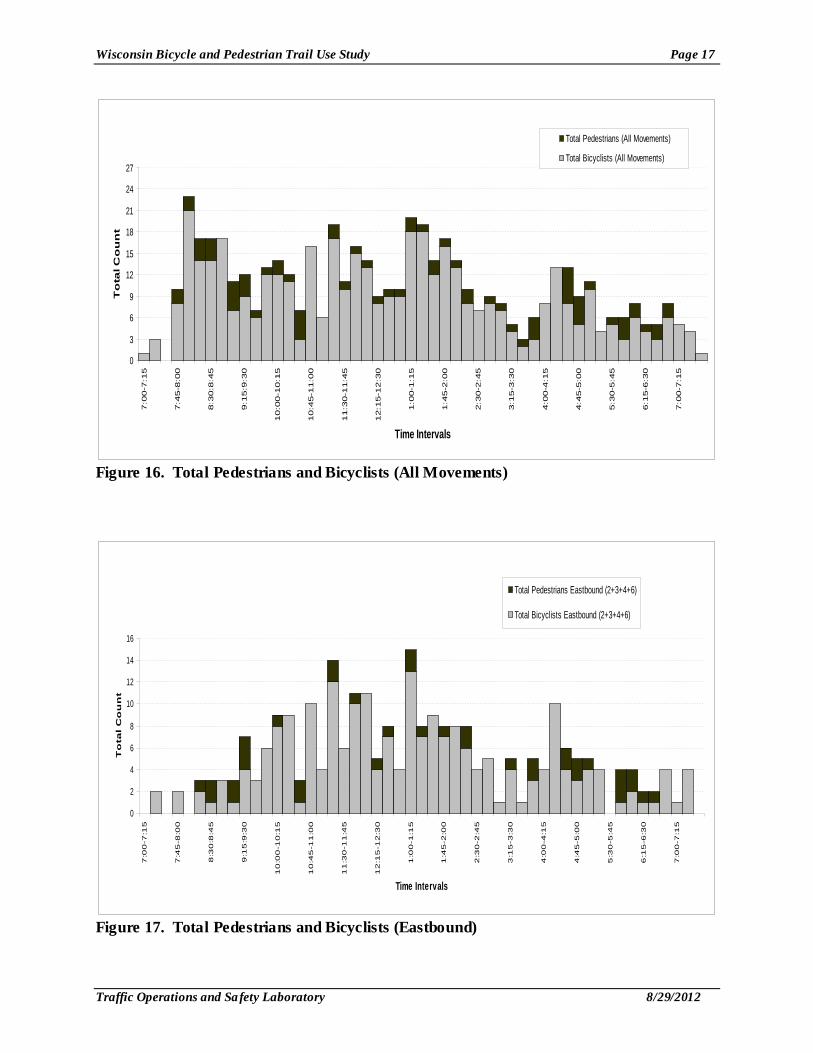
Figure 16. Total Pedestrians and Bicyclists (All Movements)
0
2
4
6
8
10
12
14
16
7:0
0-7
:15
7:4
5-8
:00
8:3
0:8
:45
9:1
5:9
:30
10
:00
-10
:15
10
:45
-11
:00
11
:30
-11
:45
12
:15
-12
:30
1:0
0-1
:15
1:4
5-2
:00
2:3
0-2
:45
3:1
5-3
:30
4:0
0-4
:15
4:4
5-5
:00
5:3
0-5
:45
6:1
5-6
:30
7:0
0-7
:15
Time Intervals
To
tal
Co
un
t
Total Pedestrians Eastbound (2+3+4+6)
Total Bicyclists Eastbound (2+3+4+6)
Figure 17. Total Pedestrians and Bicyclists (Eastbound)
Wisconsin Bicycle and Pedestrian Trail Use Study Page 18
Traffic Operations and Safety Laboratory 8/29/2012
0
5
10
15
20
25
7:0
0-7
:15
7:4
5-8
:00
8:3
0:8
:45
9:1
5:9
:30
10
:00
-10
:15
10
:45
-11
:00
11
:30
-11
:45
12
:15
-12
:30
1:0
0-1
:15
1:4
5-2
:00
2:3
0-2
:45
3:1
5-3
:30
4:0
0-4
:15
4:4
5-5
:00
5:3
0-5
:45
6:1
5-6
:30
7:0
0-7
:15
Time Intervals
To
tal
Co
un
t
Total Pedestrians Westbound (1+5)
Total Bicyclists Westbound (1+5)
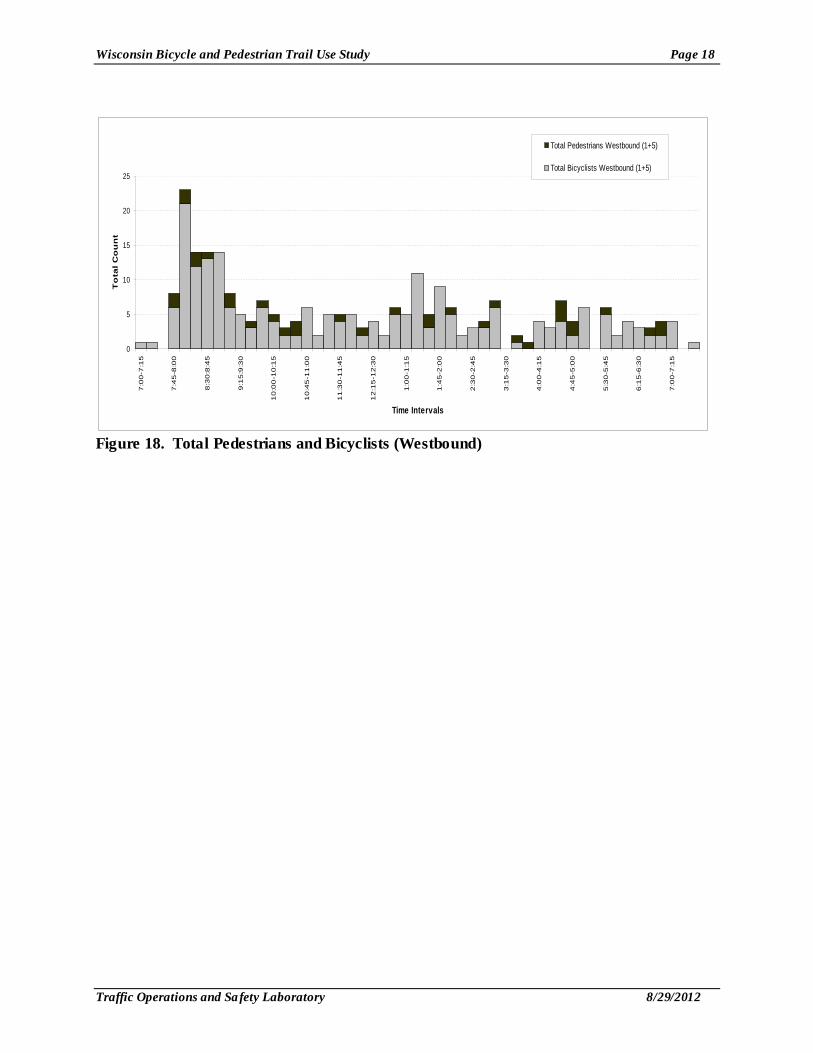
Figure 18. Total Pedestrians and Bicyclists (Westbound)
Wisconsin Bicycle and Pedestrian Trail Use Study Page 19
Traffic Operations and Safety Laboratory 8/29/2012
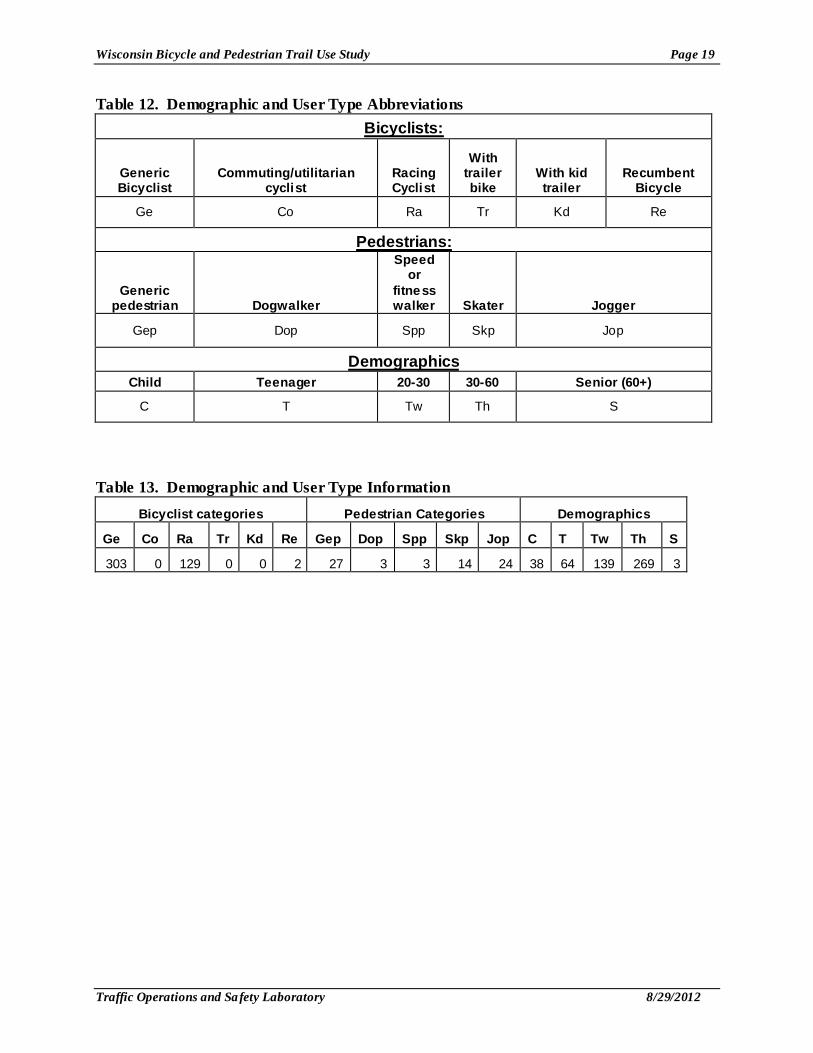
Table 12. Demographic and User Type Abbreviations Bicyclists:
Generic Bicyclist
Commuting/utilitarian cyclist
Racing Cyclist
With trailer bike
With kid trailer
Recumbent Bicycle
Ge Co Ra Tr Kd Re
Pedestrians:
Generic pedestrian Dogwalker
Speed or
fitness walker Skater Jogger
Gep Dop Spp Skp Jop
Demographics Child Teenager 20-30 30-60 Senior (60+)
C T Tw Th S
Table 13. Demographic and User Type Information
Bicyclist categories Pedestrian Categories Demographics
Ge Co Ra Tr Kd Re Gep Dop Spp Skp Jop C T Tw Th S
303 0 129 0 0 2 27 3 3 14 24 38 64 139 269 3
Wisconsin Bicycle and Pedestrian Trail Use Study Page 20
Traffic Operations and Safety Laboratory 8/29/2012
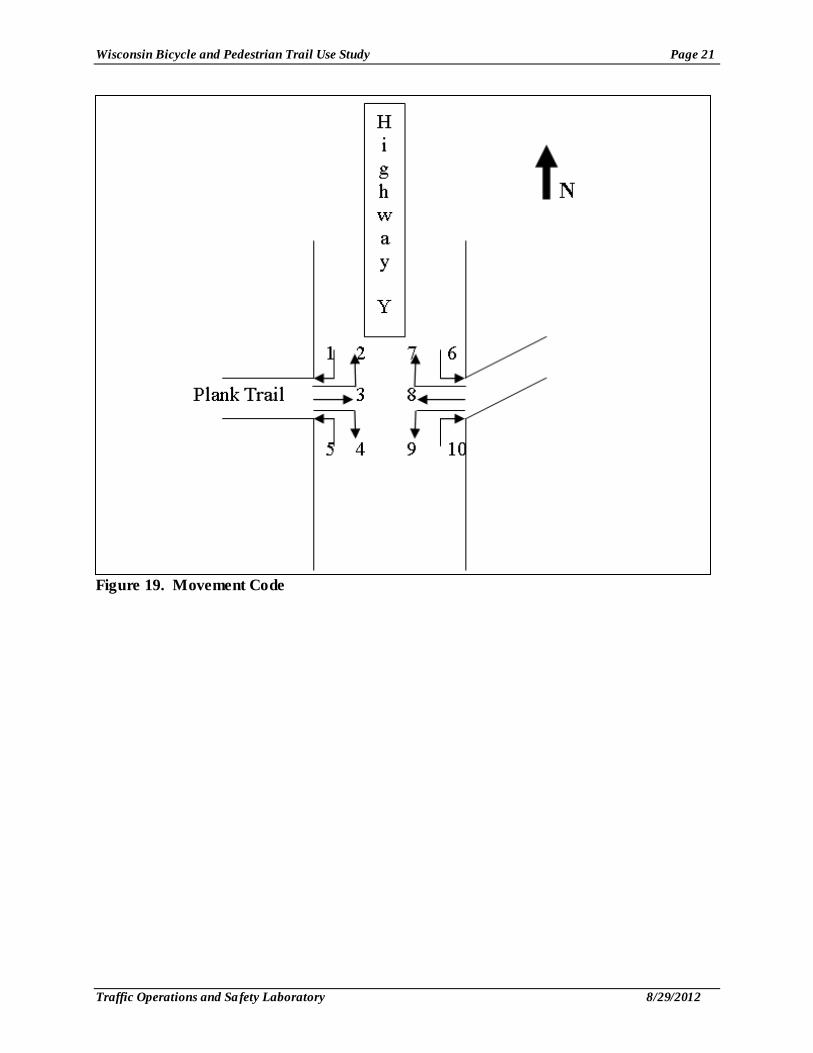
6. Plank Trail TRAIL NAME: Plank Trail DATE: 8/27/04 (Friday); 8/28/04 (Saturday) LOCATION: Highway Y near Kohler WEATHER: 8/27/04: AM scattered thundershowers, PM weather clear skies, bright sunshine, maximum temperature 82 degrees, minimum 66 degrees 8/28/04: Light drizzle between 9.00 AM and 10.00 AM. Morning winds, maximum temperature 67 degrees, minimum 52 degrees DATA COLLECTION TIME: 8/27/04 (Friday) 1:15 PM to 8:15 PM; 8/28/04 (Saturday) 5:30 AM to 1:15 PM For this site, there were three data collection sites. The three data collection sites were located at the intersection of the trail with following roads:
- Highway Y near Kohler - Highway 57 - County Highway S
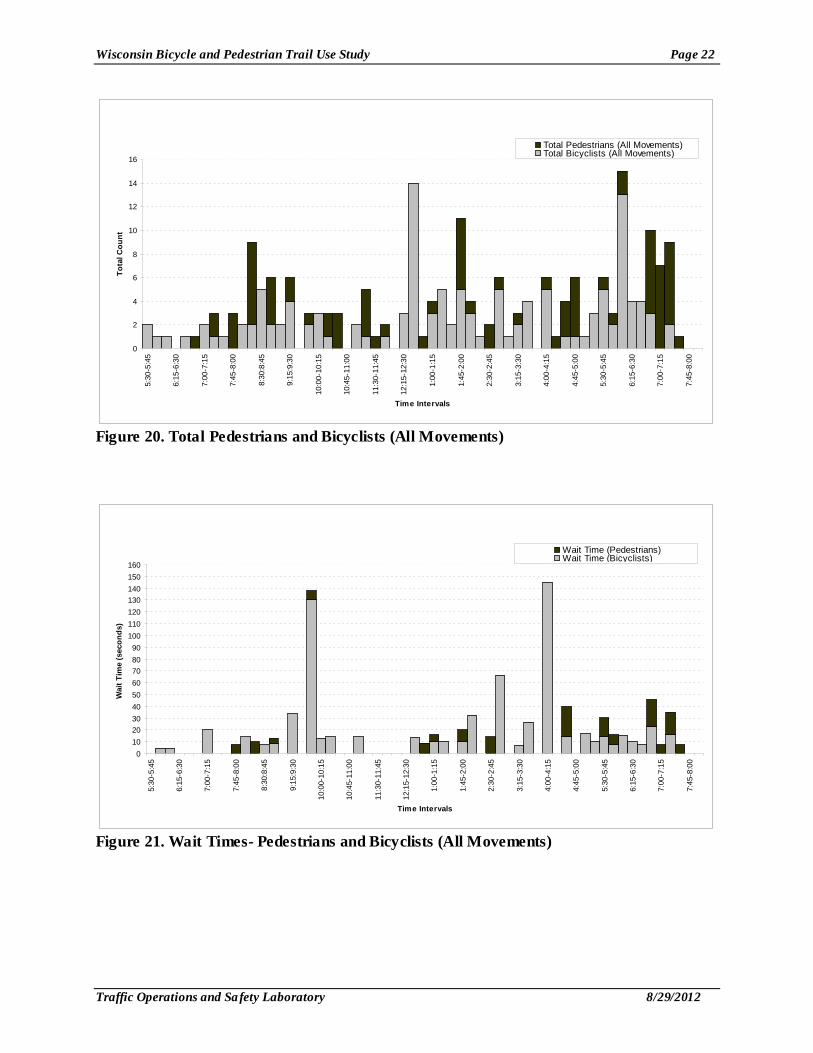
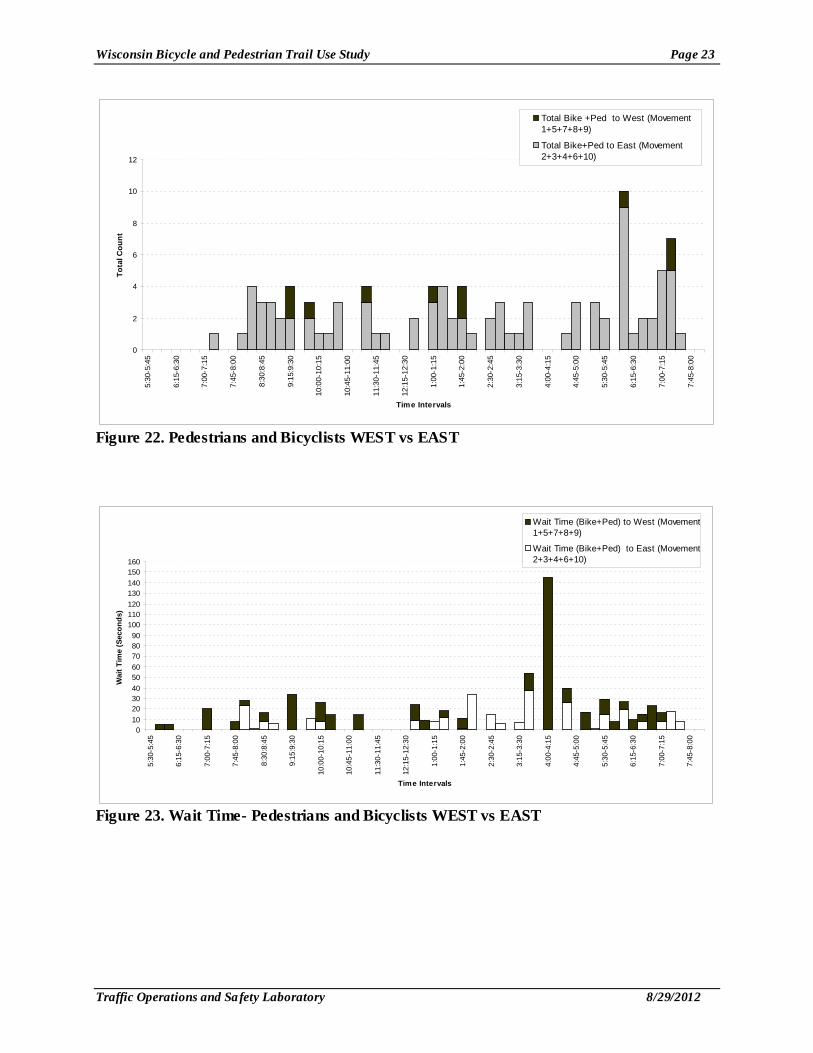
Data was collected over two days in order to minimize data collection during adverse weather conditions since such weather conditions would not appropriately reflect usage during a ‘good weather’ day. The only precipitation occurred between 9:00 AM and 10:00 AM on August 28, 2004. It is acknowledged that due to cloudy skies and a chance of rain at the time the study was conducted, the observed trail usage may have been slightly lower than usual. At the intersection of the trail with Highway Y, the total number of trail users observed was 208, including 128 bicyclists and 80 pedestrians. The maximum average wait time to cross Highway Y was over 140 seconds (6:00 PM to 6:15 PM).
Wisconsin Bicycle and Pedestrian Trail Use Study Page 21
Traffic Operations and Safety Laboratory 8/29/2012
Figure 19. Movement Code
Wisconsin Bicycle and Pedestrian Trail Use Study Page 22
Traffic Operations and Safety Laboratory 8/29/2012
0
2
4
6
8
10
12
14
165:
30-5
:45
6:15
-6:3
0
7:00
-7:1
5
7:45
-8:0
0
8:30
:8:4
5
9:15
:9:3
0
10:0
0-10
:15
10:4
5-11
:00
11:3
0-11
:45
12:1
5-12
:30
1:00
-1:1
5
1:45
-2:0
0
2:30
-2:4
5
3:15
-3:3
0
4:00
-4:1
5
4:45
-5:0
0
5:30
-5:4
5
6:15
-6:3
0
7:00
-7:1
5
7:45
-8:0
0
Time Intervals
Tota
l Cou
nt
Total Pedestrians (All Movements)Total Bicyclists (All Movements)
Figure 20. Total Pedestrians and Bicyclists (All Movements)
0102030405060708090
100110120130140150160
5:30
-5:4
5
6:15
-6:3
0
7:00
-7:1
5
7:45
-8:0
0
8:30
:8:4
5
9:15
:9:3
0
10:0
0-10
:15
10:4
5-11
:00
11:3
0-11
:45
12:1
5-12
:30
1:00
-1:1
5
1:45
-2:0
0
2:30
-2:4
5
3:15
-3:3
0
4:00
-4:1
5
4:45
-5:0
0
5:30
-5:4
5
6:15
-6:3
0
7:00
-7:1
5
7:45
-8:0
0
Time Intervals
Wai
t Tim
e (s
econ
ds)
Wait Time (Pedestrians)Wait Time (Bicyclists)
Figure 21. Wait Times- Pedestrians and Bicyclists (All Movements)
Wisconsin Bicycle and Pedestrian Trail Use Study Page 23
Traffic Operations and Safety Laboratory 8/29/2012
0
2
4
6
8
10
125:
30-5
:45
6:15
-6:3
0
7:00
-7:1
5
7:45
-8:0
0
8:30
:8:4
5
9:15
:9:3
0
10:0
0-10
:15
10:4
5-11
:00
11:3
0-11
:45
12:1
5-12
:30
1:00
-1:1
5
1:45
-2:0
0
2:30
-2:4
5
3:15
-3:3
0
4:00
-4:1
5
4:45
-5:0
0
5:30
-5:4
5
6:15
-6:3
0
7:00
-7:1
5
7:45
-8:0
0
Time Intervals
Tota
l Cou
ntTotal Bike +Ped to West (Movement1+5+7+8+9)
Total Bike+Ped to East (Movement2+3+4+6+10)
Figure 22. Pedestrians and Bicyclists WEST vs EAST
0102030405060708090
100110120130140150160
5:30
-5:4
5
6:15
-6:3
0
7:00
-7:1
5
7:45
-8:0
0
8:30
:8:4
5
9:15
:9:3
0
10:0
0-10
:15
10:4
5-11
:00
11:3
0-11
:45
12:1
5-12
:30
1:00
-1:1
5
1:45
-2:0
0
2:30
-2:4
5
3:15
-3:3
0
4:00
-4:1
5
4:45
-5:0
0
5:30
-5:4
5
6:15
-6:3
0
7:00
-7:1
5
7:45
-8:0
0
Time Intervals
Wai
t Tim
e (S
econ
ds)
Wait Time (Bike+Ped) to West (Movement1+5+7+8+9)
Wait Time (Bike+Ped) to East (Movement2+3+4+6+10)
Figure 23. Wait Time- Pedestrians and Bicyclists WEST vs EAST
Wisconsin Bicycle and Pedestrian Trail Use Study Page 24
Traffic Operations and Safety Laboratory 8/29/2012
Table 14. Demographic and User Type Abbreviations Bicyclists:
Generic Bicyclist
Commuting/utilitarian cyclist
Racing Cyclist
With trailer bike
With kid trailer
Recumbent Bicycle
Ge Co Ra Tr Kd Re
Pedestrians:
Generic pedestrian Dogwalker
Speed or
fitness walker Skater Jogger
Gep Dop Spp Skp Jop
Demographics Child Teenager 20-30 30-60 Senior (60+)
C T Tw Th S
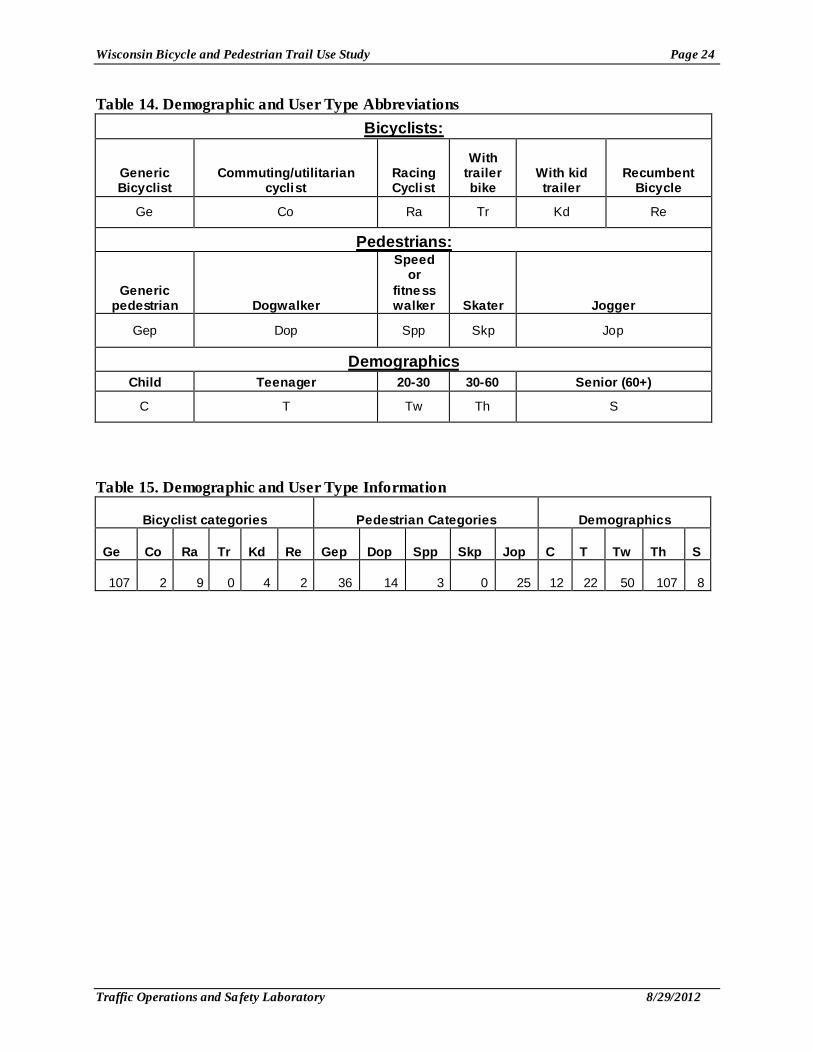
Table 15. Demographic and User Type Information
Bicyclist categories Pedestrian Categories Demographics
Ge Co Ra Tr Kd Re Gep Dop Spp Skp Jop C T Tw Th S
107 2 9 0 4 2 36 14 3 0 25 12 22 50 107 8
Wisconsin Bicycle and Pedestrian Trail Use Study Page 25
Traffic Operations and Safety Laboratory 8/29/2012
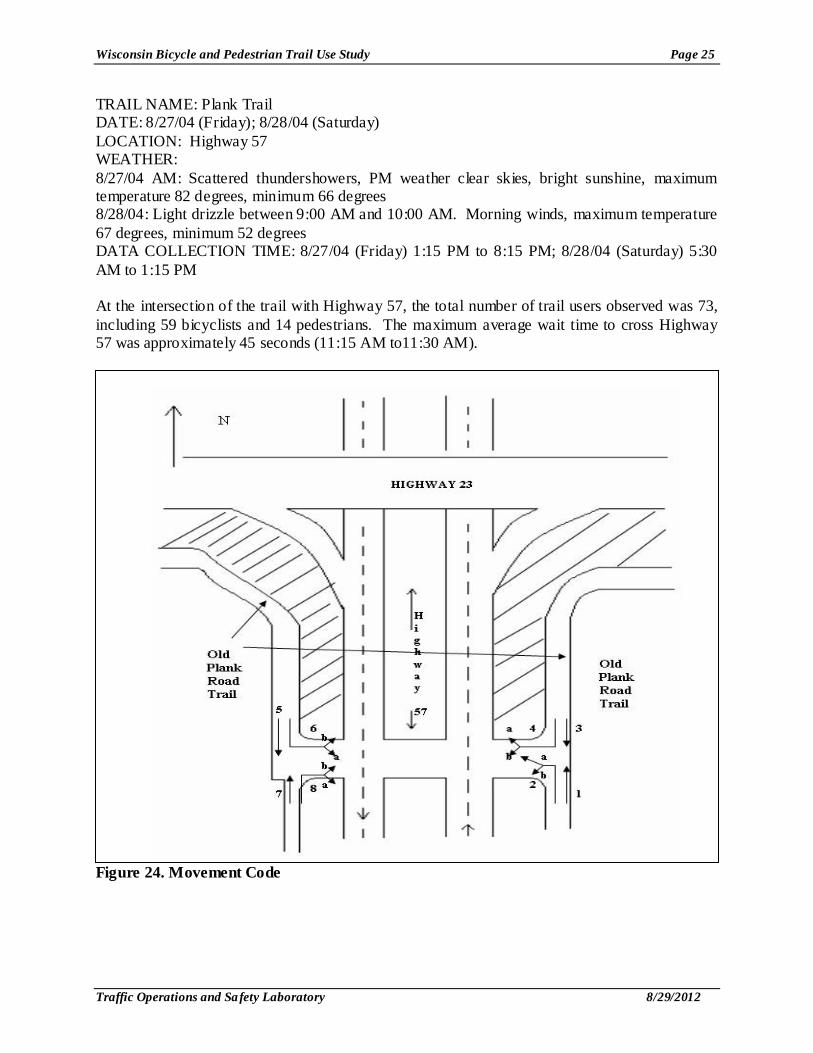
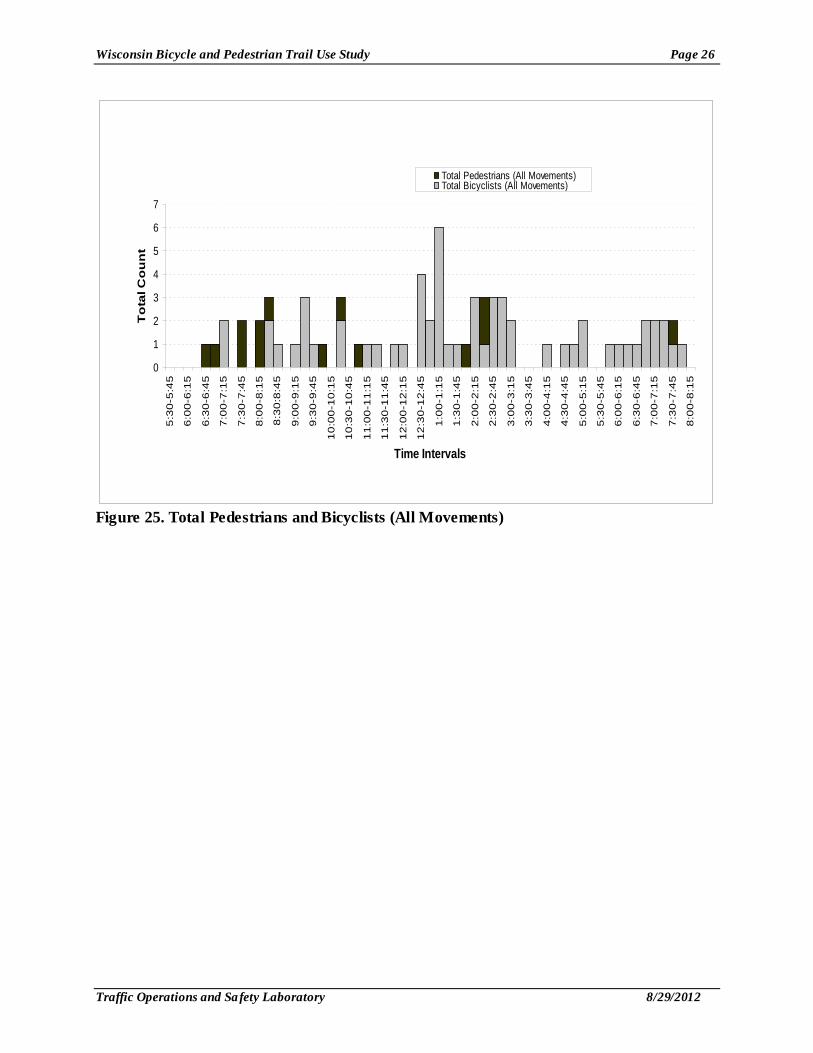
TRAIL NAME: Plank Trail DATE: 8/27/04 (Friday); 8/28/04 (Saturday) LOCATION: Highway 57 WEATHER: 8/27/04 AM: Scattered thundershowers, PM weather clear skies, bright sunshine, maximum temperature 82 degrees, minimum 66 degrees 8/28/04: Light drizzle between 9:00 AM and 10:00 AM. Morning winds, maximum temperature 67 degrees, minimum 52 degrees DATA COLLECTION TIME: 8/27/04 (Friday) 1:15 PM to 8:15 PM; 8/28/04 (Saturday) 5:30 AM to 1:15 PM At the intersection of the trail with Highway 57, the total number of trail users observed was 73, including 59 bicyclists and 14 pedestrians. The maximum average wait time to cross Highway 57 was approximately 45 seconds (11:15 AM to11:30 AM).
Figure 24. Movement Code
Wisconsin Bicycle and Pedestrian Trail Use Study Page 26
Traffic Operations and Safety Laboratory 8/29/2012
0
1
2
3
4
5
6
7
5:3
0-5
:45
6:0
0-6
:15
6:3
0-6
:45
7:0
0-7
:15
7:3
0-7
:45
8:0
0-8
:15
8:3
0:8
:45
9:0
0-9
:15
9:3
0-9
:45
10
:00
-10
:15
10
:30
-10
:45
11
:00
-11
:15
11
:30
-11
:45
12
:00
-12
:15
12
:30
-12
:45
1:0
0-1
:15
1:3
0-1
:45
2:0
0-2
:15
2:3
0-2
:45
3:0
0-3
:15
3:3
0-3
:45
4:0
0-4
:15
4:3
0-4
:45
5:0
0-5
:15
5:3
0-5
:45
6:0
0-6
:15
6:3
0-6
:45
7:0
0-7
:15
7:3
0-7
:45
8:0
0-8
:15
Time Intervals
To
tal C
ou
nt
Total Pedestrians (All Movements)Total Bicyclists (All Movements)
Figure 25. Total Pedestrians and Bicyclists (All Movements)
Wisconsin Bicycle and Pedestrian Trail Use Study Page 27
Traffic Operations and Safety Laboratory 8/29/2012
0
5
10
15
20
25
30
35
40
45
50
5:30
-5:4
5
6:15
-6:3
0
7:00
-7:1
5
7:45
-8:0
0
8:30
:8:4
5
9:15
:9:3
0
10:0
0-10
:15
10:4
5-11
:00
11:3
0-11
:45
12:1
5-12
:30
1:00
-1:1
5
1:45
-2:0
0
2:30
-2:4
5
3:15
-3:3
0
4:00
-4:1
5
4:45
-5:0
0
5:30
-5:4
5
6:15
-6:3
0
7:00
-7:1
5
7:45
-8:0
0
Time Intervals
Wai
t Tim
e (s
econ
ds)
Wait Time (Pedestrians)Wait Time (Bicyclists)
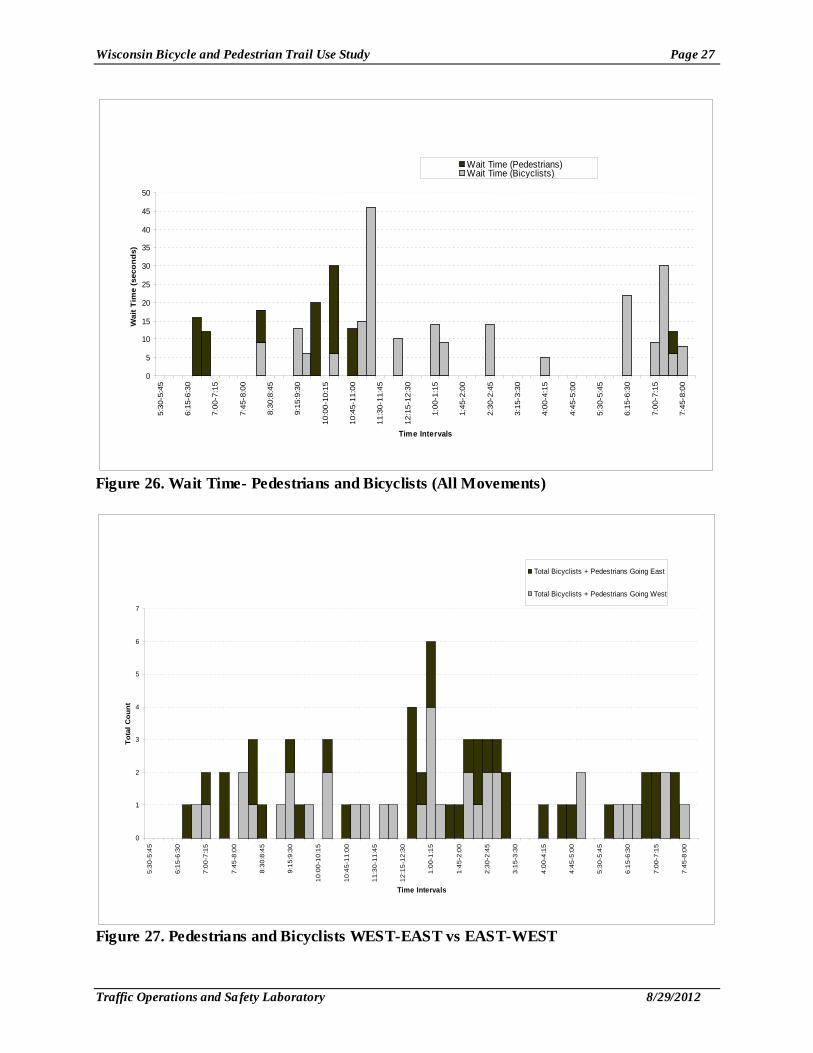
Figure 26. Wait Time- Pedestrians and Bicyclists (All Movements)
0
1
2
3
4
5
6
7
5:30
-5:4
5
6:15
-6:3
0
7:00
-7:1
5
7:45
-8:0
0
8:30
:8:4
5
9:15
:9:3
0
10:0
0-10
:15
10:4
5-11
:00
11:3
0-11
:45
12:1
5-12
:30
1:00
-1:1
5
1:45
-2:0
0
2:30
-2:4
5
3:15
-3:3
0
4:00
-4:1
5
4:45
-5:0
0
5:30
-5:4
5
6:15
-6:3
0
7:00
-7:1
5
7:45
-8:0
0
Time Intervals
Tota
l Cou
nt
Total Bicyclists + Pedestrians Going East
Total Bicyclists + Pedestrians Going West
Figure 27. Pedestrians and Bicyclists WEST-EAST vs EAST-WEST
Wisconsin Bicycle and Pedestrian Trail Use Study Page 28
Traffic Operations and Safety Laboratory 8/29/2012
0
5
10
15
20
25
30
5:3
0-5
:45
6:1
5-6
:30
7:0
0-7
:15
7:4
5-8
:00
8:3
0:8
:45
9:1
5:9
:30
10
:00
-10
:15
10
:45
-11
:00
11
:30
-11
:45
12
:15
-12
:30
1:0
0-1
:15
1:4
5-2
:00
2:3
0-2
:45
3:1
5-3
:30
4:0
0-4
:15
4:4
5-5
:00
5:3
0-5
:45
6:1
5-6
:30
7:0
0-7
:15
7:4
5-8
:00
Time Intervals
Wai
t T
ime
(sec
on
ds)
Wait Time (Bicyclists+Pedestrians GoingEast)
Wait Time (Bicyclists+Pedestrians GoingWest)
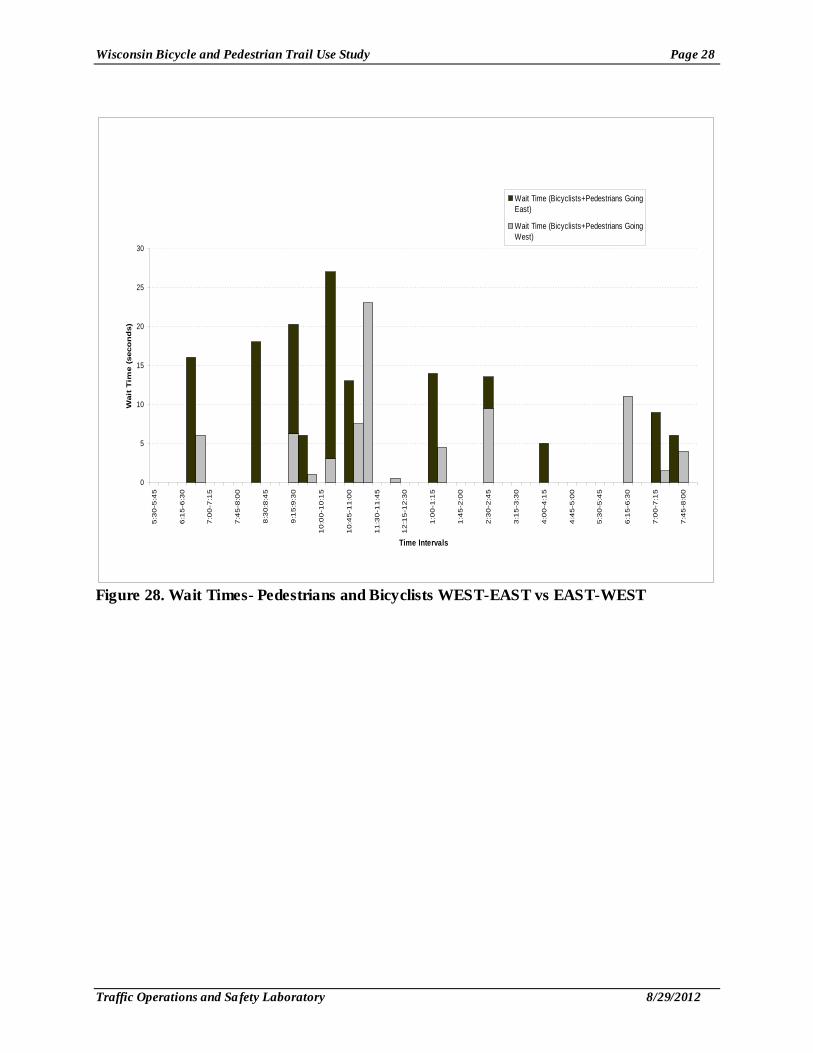
Figure 28. Wait Times- Pedestrians and Bicyclists WEST-EAST vs EAST-WEST
Wisconsin Bicycle and Pedestrian Trail Use Study Page 29
Traffic Operations and Safety Laboratory 8/29/2012
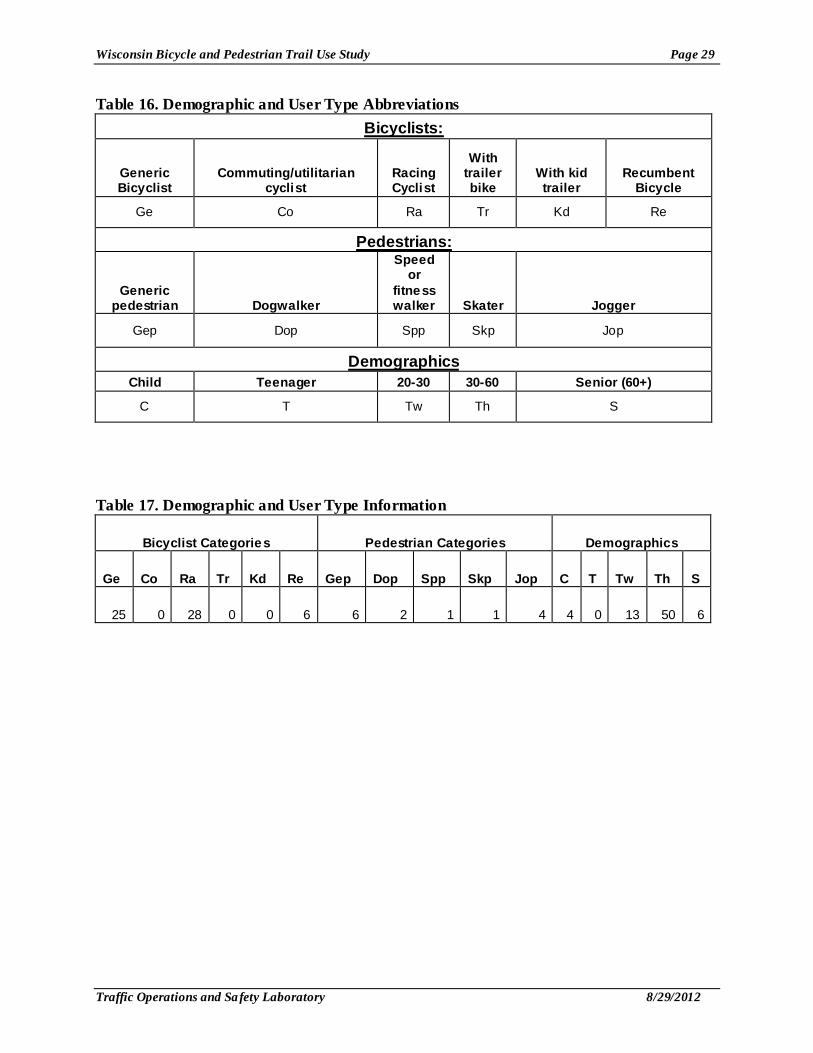
Table 16. Demographic and User Type Abbreviations Bicyclists:
Generic Bicyclist
Commuting/utilitarian cyclist
Racing Cyclist
With trailer bike
With kid trailer
Recumbent Bicycle
Ge Co Ra Tr Kd Re
Pedestrians:
Generic pedestrian Dogwalker
Speed or
fitness walker Skater Jogger
Gep Dop Spp Skp Jop
Demographics Child Teenager 20-30 30-60 Senior (60+)
C T Tw Th S
Table 17. Demographic and User Type Information
Bicyclist Categories Pedestrian Categories Demographics
Ge Co Ra Tr Kd Re Gep Dop Spp Skp Jop C T Tw Th S
25 0 28 0 0 6 6 2 1 1 4 4 0 13 50 6
Wisconsin Bicycle and Pedestrian Trail Use Study Page 30
Traffic Operations and Safety Laboratory 8/29/2012
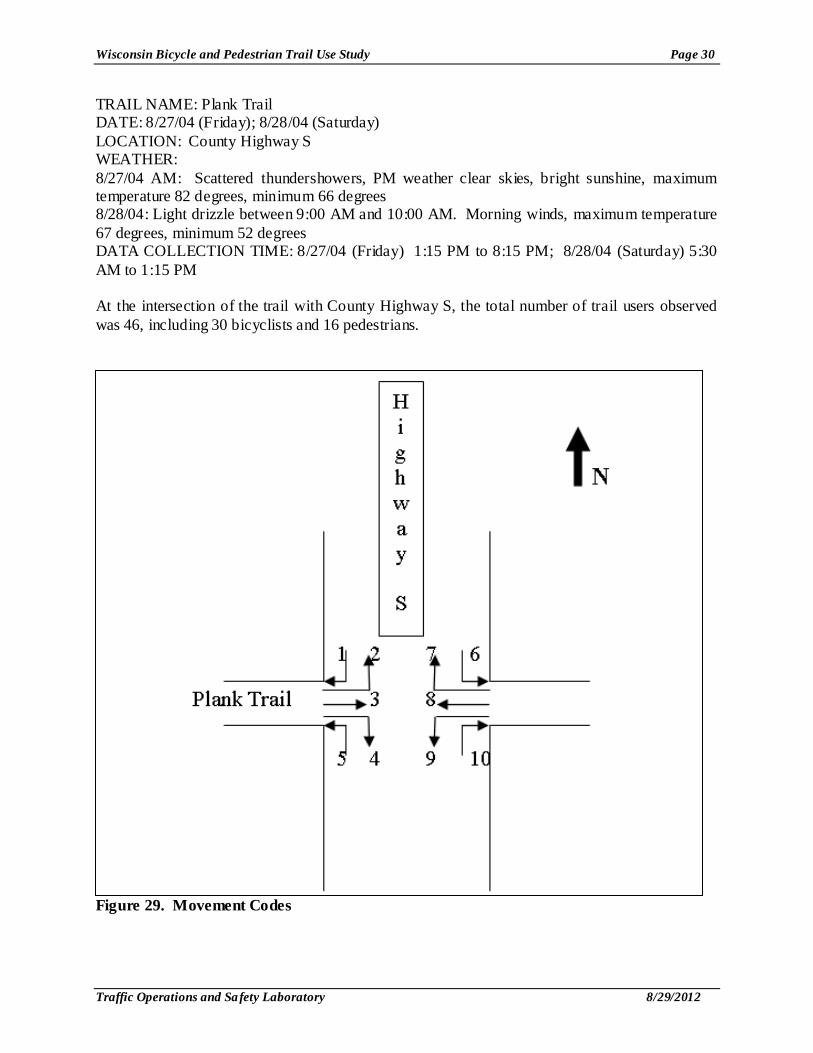
TRAIL NAME: Plank Trail DATE: 8/27/04 (Friday); 8/28/04 (Saturday) LOCATION: County Highway S WEATHER: 8/27/04 AM: Scattered thundershowers, PM weather clear skies, bright sunshine, maximum temperature 82 degrees, minimum 66 degrees 8/28/04: Light drizzle between 9:00 AM and 10:00 AM. Morning winds, maximum temperature 67 degrees, minimum 52 degrees DATA COLLECTION TIME: 8/27/04 (Friday) 1:15 PM to 8:15 PM; 8/28/04 (Saturday) 5:30 AM to 1:15 PM At the intersection of the trail with County Highway S, the total number of trail users observed was 46, including 30 bicyclists and 16 pedestrians.
Figure 29. Movement Codes
Wisconsin Bicycle and Pedestrian Trail Use Study Page 31
Traffic Operations and Safety Laboratory 8/29/2012
0
1
2
3
4
5
5:30
-5:4
5
6:15
-6:3
0
7:00
-7:1
5
7:45
-8:0
0
8:30
:8:4
5
9:15
:9:3
0
10:0
0-10
:15
10:4
5-11
:00
11:3
0-11
:45
12:1
5-12
:30
1:00
-1:1
5
1:45
-2:0
0
2:30
-2:4
5
3:15
-3:3
0
4:00
-4:1
5
4:45
-5:0
0
5:30
-5:4
5
6:15
-6:3
0
7:00
-7:1
5
7:45
-8:0
0
Time Intervals
Tota
l Cou
nt
Total Pedestrians (All Movements)Total Bicyclists (All Movements)
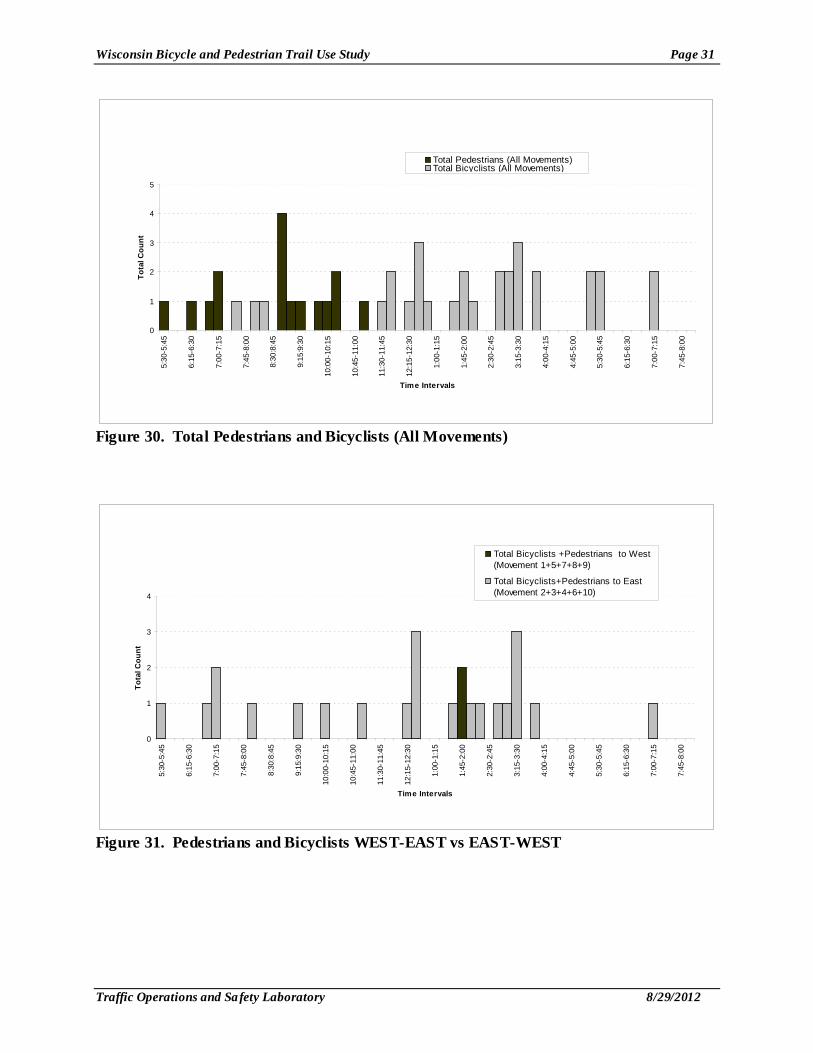
Figure 30. Total Pedestrians and Bicyclists (All Movements)
0
1
2
3
4
5:30
-5:4
5
6:15
-6:3
0
7:00
-7:1
5
7:45
-8:0
0
8:30
:8:4
5
9:15
:9:3
0
10:0
0-10
:15
10:4
5-11
:00
11:3
0-11
:45
12:1
5-12
:30
1:00
-1:1
5
1:45
-2:0
0
2:30
-2:4
5
3:15
-3:3
0
4:00
-4:1
5
4:45
-5:0
0
5:30
-5:4
5
6:15
-6:3
0
7:00
-7:1
5
7:45
-8:0
0
Time Intervals
Tota
l Cou
nt
Total Bicyclists +Pedestrians to West(Movement 1+5+7+8+9)
Total Bicyclists+Pedestrians to East(Movement 2+3+4+6+10)
Figure 31. Pedestrians and Bicyclists WEST-EAST vs EAST-WEST
Wisconsin Bicycle and Pedestrian Trail Use Study Page 32
Traffic Operations and Safety Laboratory 8/29/2012
Table 18. Demographic and User Type Abbreviations Bicyclists:
Generic Bicyclist
Commuting/utilitarian cyclist
Racing Cyclist
With trailer bike
With kid trailer
Recumbent Bicycle
Ge Co Ra Tr Kd Re
Pedestrians:
Generic pedestrian Dogwalker
Speed or
fitness walker Skater Jogger
Gep Dop Spp Skp Jop
Demographics Child Teenager 20-30 30-60 Senior (60+)
C T Tw Th S
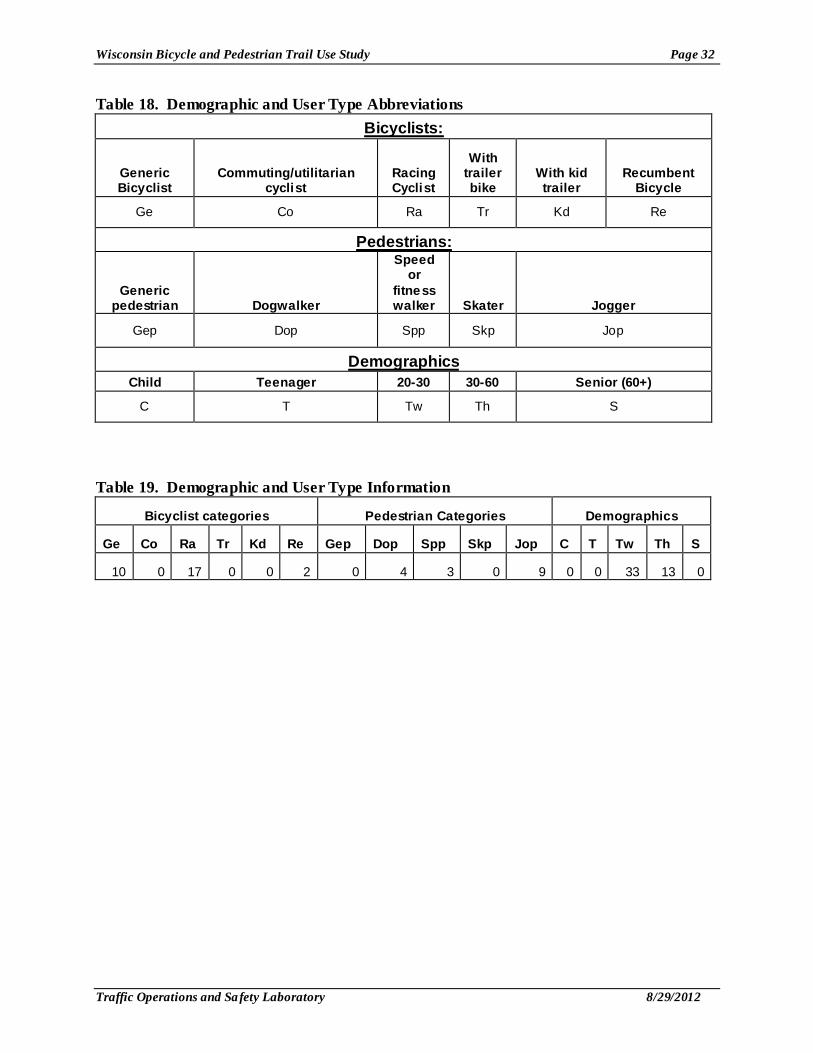
Table 19. Demographic and User Type Information
Bicyclist categories Pedestrian Categories Demographics
Ge Co Ra Tr Kd Re Gep Dop Spp Skp Jop C T Tw Th S
10 0 17 0 0 2 0 4 3 0 9 0 0 33 13 0
Wisconsin Bicycle and Pedestrian Trail Use Study Page 33
Traffic Operations and Safety Laboratory 8/29/2012
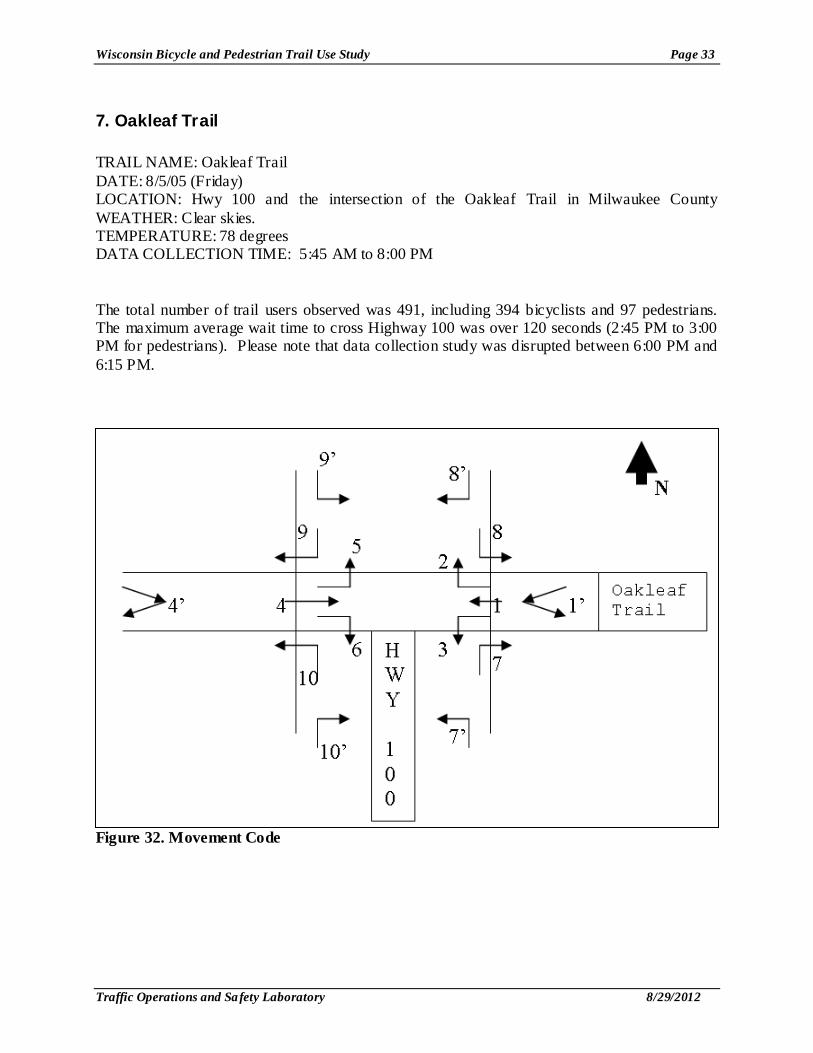
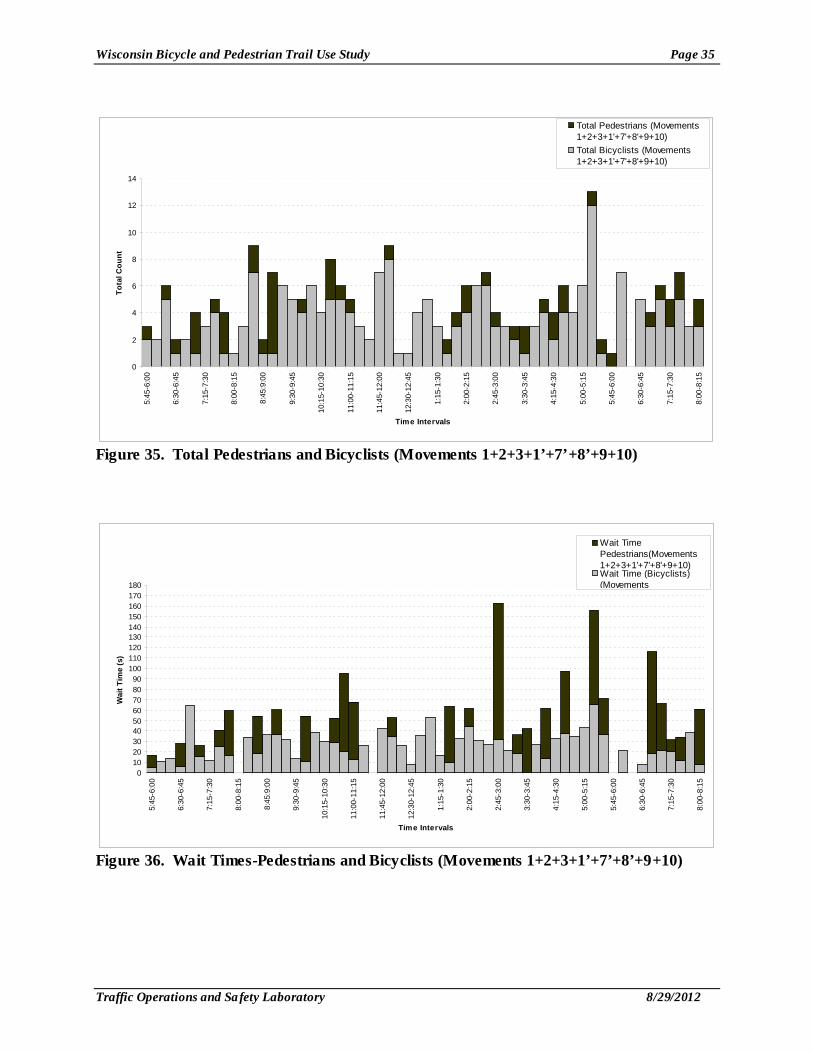
7. Oakleaf Trail TRAIL NAME: Oakleaf Trail DATE: 8/5/05 (Friday) LOCATION: Hwy 100 and the intersection of the Oakleaf Trail in Milwaukee County WEATHER: Clear skies. TEMPERATURE: 78 degrees DATA COLLECTION TIME: 5:45 AM to 8:00 PM The total number of trail users observed was 491, including 394 bicyclists and 97 pedestrians. The maximum average wait time to cross Highway 100 was over 120 seconds (2:45 PM to 3:00 PM for pedestrians). Please note that data collection study was disrupted between 6:00 PM and 6:15 PM.
Figure 32. Movement Code
Wisconsin Bicycle and Pedestrian Trail Use Study Page 34
Traffic Operations and Safety Laboratory 8/29/2012
0
2
4
6
8
10
12
14
16
18
205:
45-6
:00
6:15
-6:3
0
6:45
-7:0
0
7:15
-7:3
0
7:45
-8:0
0
8:15
-8:3
0
8:45
:9:0
0
9:15
:9:3
0
9:45
-10:
00
10:1
5-10
:30
10:4
5-11
:00
11:1
5-11
:30
11:4
5-12
:00
12:1
5-12
:30
12:4
5-1:
00
1:15
-1:3
0
1:45
-2:0
0
2:15
-2:3
0
2:45
-3:0
0
3:15
-3:3
0
3:45
-4.0
0
4:15
-4:3
0
4:45
-5:0
0
5:15
-5:3
0
5:45
-6:0
0
6:15
-6:3
0
6:45
-7:0
0
7:15
-7:3
0
7:45
-8:0
0
Time Intervals
Tota
l Cou
nt
Total Pedestrians (All Movements)Total Bicyclists (All Movements)
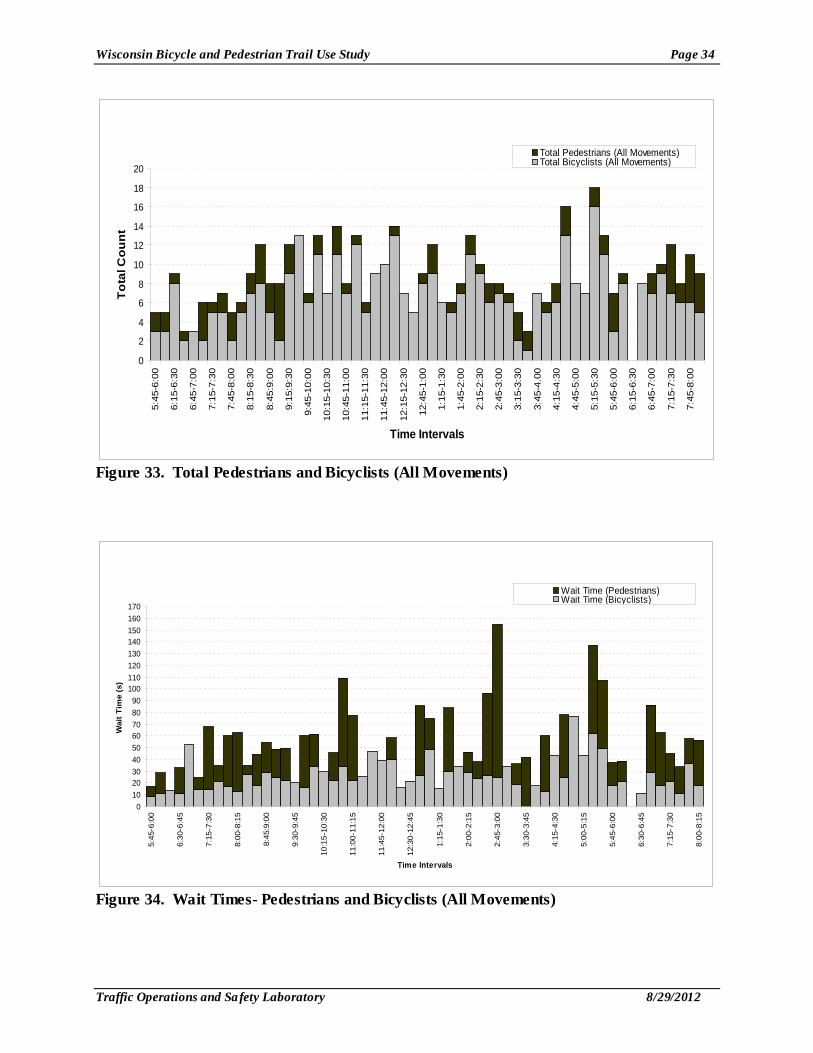
Figure 33. Total Pedestrians and Bicyclists (All Movements)
0102030405060708090
100110120130140150160170
5:45
-6:0
0
6:30
-6:4
5
7:15
-7:3
0
8:00
-8:1
5
8:45
:9:0
0
9:30
-9:4
5
10:1
5-10
:30
11:0
0-11
:15
11:4
5-12
:00
12:3
0-12
:45
1:15
-1:3
0
2:00
-2:1
5
2:45
-3:0
0
3:30
-3:4
5
4:15
-4:3
0
5:00
-5:1
5
5:45
-6:0
0
6:30
-6:4
5
7:15
-7:3
0
8:00
-8:1
5
Time Intervals
Wai
t Tim
e (s
)
Wait Time (Pedestrians)Wait Time (Bicyclists)
Figure 34. Wait Times- Pedestrians and Bicyclists (All Movements)
Wisconsin Bicycle and Pedestrian Trail Use Study Page 35
Traffic Operations and Safety Laboratory 8/29/2012
0
2
4
6
8
10
12
14
5:45
-6:0
0
6:30
-6:4
5
7:15
-7:3
0
8:00
-8:1
5
8:45
:9:0
0
9:30
-9:4
5
10:1
5-10
:30
11:0
0-11
:15
11:4
5-12
:00
12:3
0-12
:45
1:15
-1:3
0
2:00
-2:1
5
2:45
-3:0
0
3:30
-3:4
5
4:15
-4:3
0
5:00
-5:1
5
5:45
-6:0
0
6:30
-6:4
5
7:15
-7:3
0
8:00
-8:1
5
Time Intervals
Tota
l Cou
ntTotal Pedestrians (Movements1+2+3+1'+7'+8'+9+10)Total Bicyclists (Movements1+2+3+1'+7'+8'+9+10)
Figure 35. Total Pedestrians and Bicyclists (Movements 1+2+3+1’+7’+8’+9+10)
0102030405060708090
100110120130140150160170180
5:45
-6:0
0
6:30
-6:4
5
7:15
-7:3
0
8:00
-8:1
5
8:45
:9:0
0
9:30
-9:4
5
10:1
5-10
:30
11:0
0-11
:15
11:4
5-12
:00
12:3
0-12
:45
1:15
-1:3
0
2:00
-2:1
5
2:45
-3:0
0
3:30
-3:4
5
4:15
-4:3
0
5:00
-5:1
5
5:45
-6:0
0
6:30
-6:4
5
7:15
-7:3
0
8:00
-8:1
5
Time Intervals
Wai
t Tim
e (s
)
Wait TimePedestrians(Movements1+2+3+1'+7'+8'+9+10)Wait Time (Bicyclists)(Movements
Figure 36. Wait Times-Pedestrians and Bicyclists (Movements 1+2+3+1’+7’+8’+9+10)
Wisconsin Bicycle and Pedestrian Trail Use Study Page 36
Traffic Operations and Safety Laboratory 8/29/2012
0
2
4
6
8
10
12
5:45
-6:0
0
6:30
-6:4
5
7:15
-7:3
0
8:00
-8:1
5
8:45
:9:0
0
9:30
-9:4
5
10:1
5-10
:30
11:0
0-11
:15
11:4
5-12
:00
12:3
0-12
:45
1:15
-1:3
0
2:00
-2:1
5
2:45
-3:0
0
3:30
-3:4
5
4:15
-4:3
0
5:00
-5:1
5
5:45
-6:0
0
6:30
-6:4
5
7:15
-7:3
0
8:00
-8:1
5
Time Intervals
Tota
l Cou
ntTotal Pedestrians (Movements4+4'+5+6+7+8+9'+10')Total Bicyclists (Movements4+4'+5+6+7+8+9'+10')
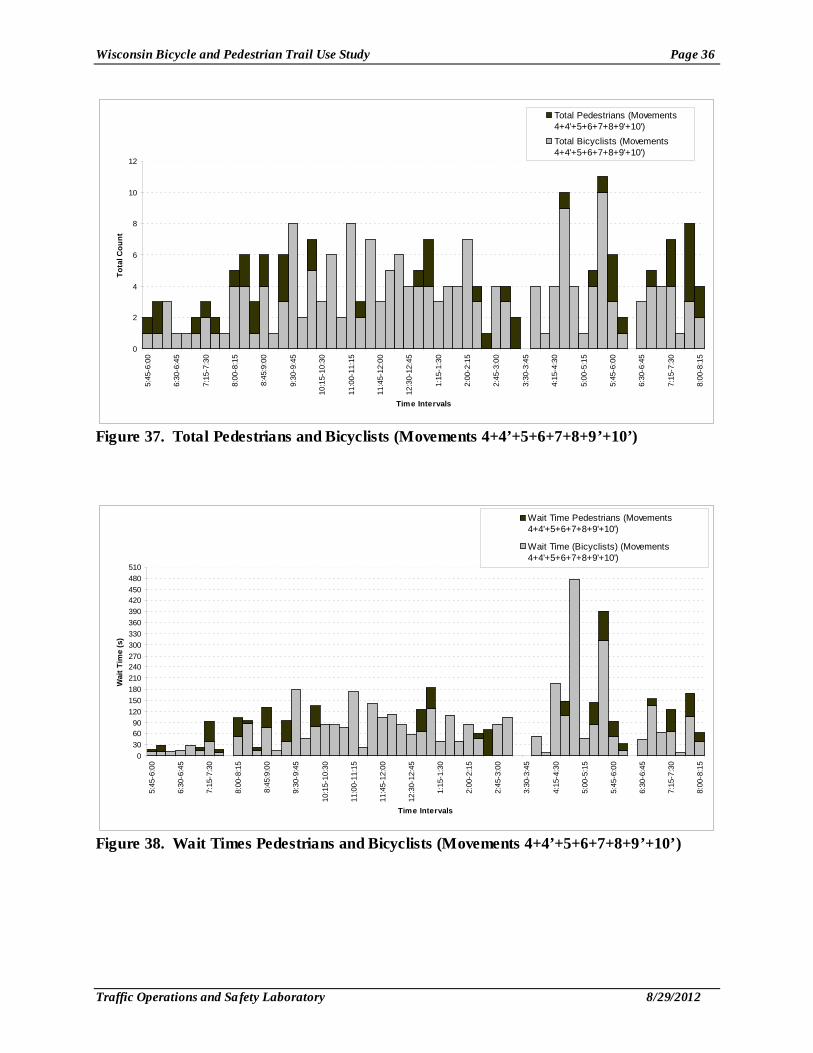
Figure 37. Total Pedestrians and Bicyclists (Movements 4+4’+5+6+7+8+9’+10’)
0306090
120150180210240270300330360390420450480510
5:45
-6:0
0
6:30
-6:4
5
7:15
-7:3
0
8:00
-8:1
5
8:45
:9:0
0
9:30
-9:4
5
10:1
5-10
:30
11:0
0-11
:15
11:4
5-12
:00
12:3
0-12
:45
1:15
-1:3
0
2:00
-2:1
5
2:45
-3:0
0
3:30
-3:4
5
4:15
-4:3
0
5:00
-5:1
5
5:45
-6:0
0
6:30
-6:4
5
7:15
-7:3
0
8:00
-8:1
5
Time Intervals
Wai
t Tim
e (s
)
Wait Time Pedestrians (Movements4+4'+5+6+7+8+9'+10')
Wait Time (Bicyclists) (Movements4+4'+5+6+7+8+9'+10')
Figure 38. Wait Times Pedestrians and Bicyclists (Movements 4+4’+5+6+7+8+9’+10’)
Wisconsin Bicycle and Pedestrian Trail Use Study Page 37
Traffic Operations and Safety Laboratory 8/29/2012
Table 20. Demographic and User Type Abbreviations Bicyclists:
Generic Bicyclist
Commuting/utilitarian cyclist
Racing Cyclist
With trailer bike
With kid trailer
Recumbent Bicycle
Ge Co Ra Tr Kd Re
Pedestrians:
Generic pedestrian Dogwalker
Speed or
fitness walker Skater Jogger
Gep Dop Spp Skp Jop
Demographics Child Teenager 20-50 >50
0 1 2 3
Table 21. Demographic and User Type Information
Bicyclist categories Pedestrian Categories Demographics
Ge Co Ra Tr Kd Re Gep Dop Spp Skp Jop 0 1 2 3
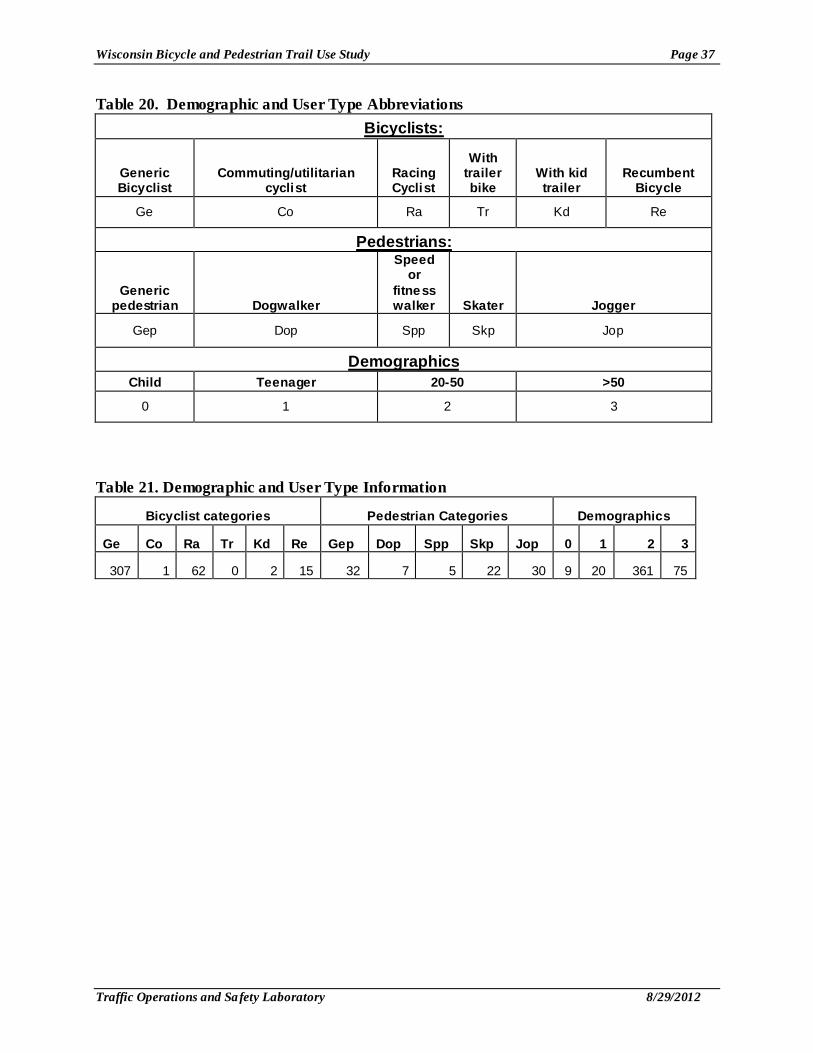
307 1 62 0 2 15 32 7 5 22 30 9 20 361 75
Wisconsin Bicycle and Pedestrian Trail Use Study Page 38
Traffic Operations and Safety Laboratory 8/29/2012
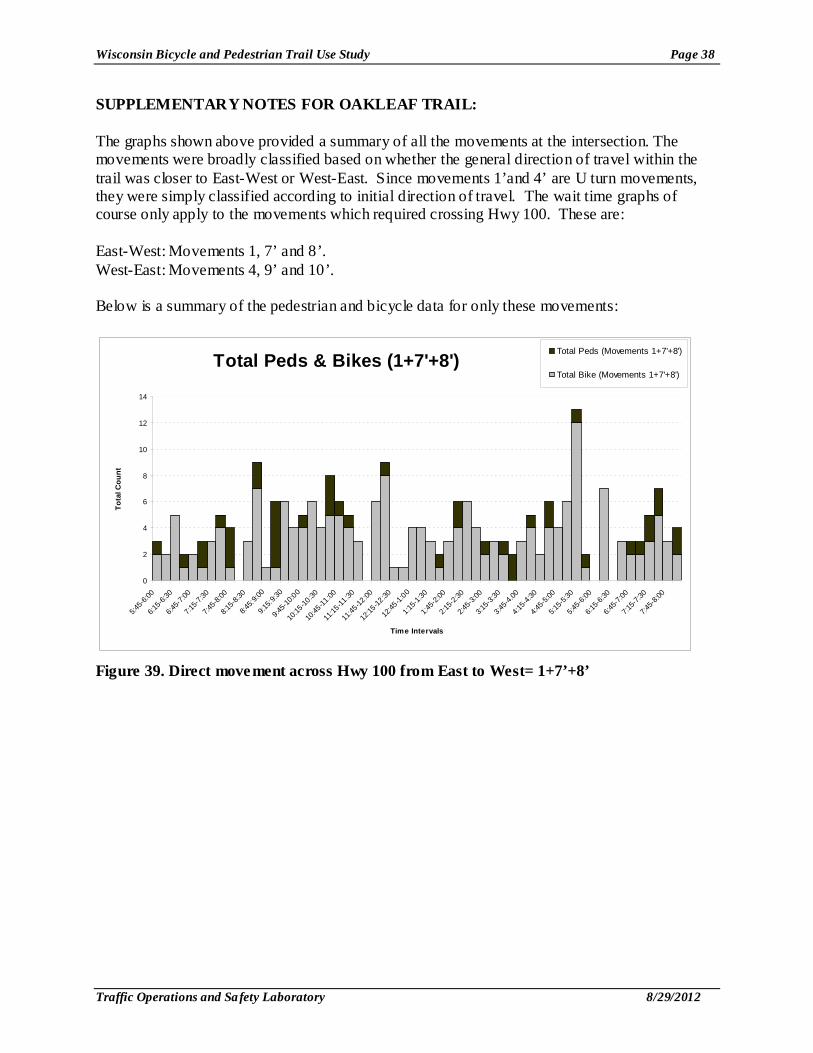
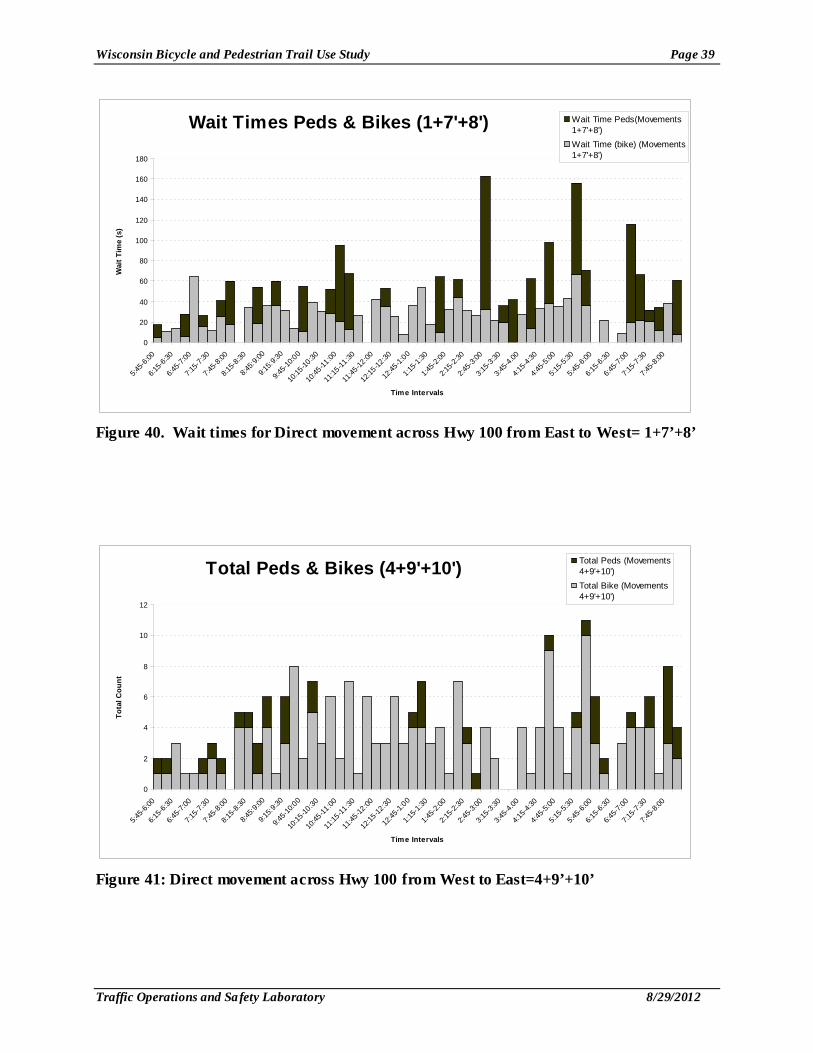
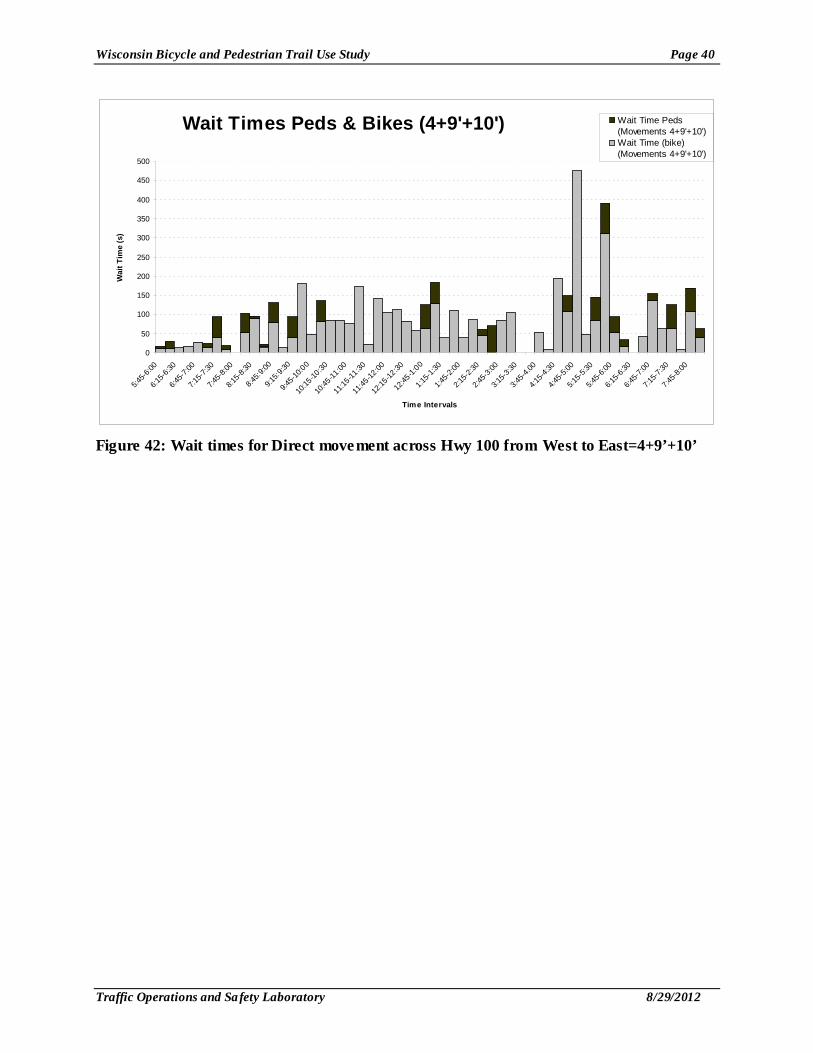
SUPPLEMENTARY NOTES FOR OAKLEAF TRAIL: The graphs shown above provided a summary of all the movements at the intersection. The movements were broadly classified based on whether the general direction of travel within the trail was closer to East-West or West-East. Since movements 1’and 4’ are U turn movements, they were simply classified according to initial direction of travel. The wait time graphs of course only apply to the movements which required crossing Hwy 100. These are: East-West: Movements 1, 7’ and 8’. West-East: Movements 4, 9’ and 10’. Below is a summary of the pedestrian and bicycle data for only these movements:
Total Peds & Bikes (1+7'+8')
0
2
4
6
8
10
12
14
5:45-6
:00
6:15-6
:30
6:45-7
:00
7:15-7
:30
7:45-8
:00
8:15-8
:30
8:45:9
:00
9:15:9
:30
9:45-1
0:00
10:15
-10:30
10:45
-11:00
11:15
-11:30
11:45
-12:00
12:15
-12:30
12:45
-1:00
1:15-1
:30
1:45-2
:00
2:15-2
:30
2:45-3
:00
3:15-3
:30
3:45-4
.00
4:15-4
:30
4:45-5
:00
5:15-5
:30
5:45-6
:00
6:15-6
:30
6:45-7
:00
7:15-7
:30
7:45-8
:00
Time Intervals
Tota
l Cou
nt
Total Peds (Movements 1+7'+8')
Total Bike (Movements 1+7'+8')
Figure 39. Direct movement across Hwy 100 from East to West= 1+7’+8’
Wisconsin Bicycle and Pedestrian Trail Use Study Page 39
Traffic Operations and Safety Laboratory 8/29/2012
Wait Times Peds & Bikes (1+7'+8')
0
20
40
60
80
100
120
140
160
180
5:45-6
:00
6:15-6
:30
6:45-7
:00
7:15-7
:30
7:45-8
:00
8:15-8
:30
8:45:9
:00
9:15:9
:30
9:45-1
0:00
10:15
-10:30
10:45
-11:00
11:15
-11:30
11:45
-12:00
12:15
-12:30
12:45
-1:00
1:15-1
:30
1:45-2
:00
2:15-2
:30
2:45-3
:00
3:15-3
:30
3:45-4
.00
4:15-4
:30
4:45-5
:00
5:15-5
:30
5:45-6
:00
6:15-6
:30
6:45-7
:00
7:15-7
:30
7:45-8
:00
Time Intervals
Wai
t Tim
e (s
)Wait Time Peds(Movements1+7'+8')Wait Time (bike) (Movements1+7'+8')
Figure 40. Wait times for Direct movement across Hwy 100 from East to West= 1+7’+8’
Total Peds & Bikes (4+9'+10')
0
2
4
6
8
10
12
5:45-6
:00
6:15-6
:30
6:45-7
:00
7:15-7
:30
7:45-8
:00
8:15-8
:30
8:45:9
:00
9:15:9
:30
9:45-1
0:00
10:15
-10:30
10:45
-11:00
11:15
-11:30
11:45
-12:00
12:15
-12:30
12:45
-1:00
1:15-1
:30
1:45-2
:00
2:15-2
:30
2:45-3
:00
3:15-3
:30
3:45-4
.00
4:15-4
:30
4:45-5
:00
5:15-5
:30
5:45-6
:00
6:15-6
:30
6:45-7
:00
7:15-7
:30
7:45-8
:00
Time Intervals
Tota
l Cou
nt
Total Peds (Movements4+9'+10')Total Bike (Movements4+9'+10')
Figure 41: Direct movement across Hwy 100 from West to East=4+9’+10’
Wisconsin Bicycle and Pedestrian Trail Use Study Page 40
Traffic Operations and Safety Laboratory 8/29/2012
Wait Times Peds & Bikes (4+9'+10')
0
50
100
150
200
250
300
350
400
450
500
5:45-6
:00
6:15-6
:30
6:45-7
:00
7:15-7
:30
7:45-8
:00
8:15-8
:30
8:45:9
:00
9:15:9
:30
9:45-1
0:00
10:15
-10:30
10:45
-11:00
11:15
-11:30
11:45
-12:00
12:15
-12:30
12:45
-1:00
1:15-1
:30
1:45-2
:00
2:15-2
:30
2:45-3
:00
3:15-3
:30
3:45-4
.00
4:15-4
:30
4:45-5
:00
5:15-5
:30
5:45-6
:00
6:15-6
:30
6:45-7
:00
7:15-7
:30
7:45-8
:00
Time Intervals
Wai
t Tim
e (s
)Wait Time Peds(Movements 4+9'+10')Wait Time (bike)(Movements 4+9'+10')
Figure 42: Wait times for Direct movement across Hwy 100 from West to East=4+9’+10’
Wisconsin Bicycle and Pedestrian Trail Use Study Page 41
Traffic Operations and Safety Laboratory 8/29/2012
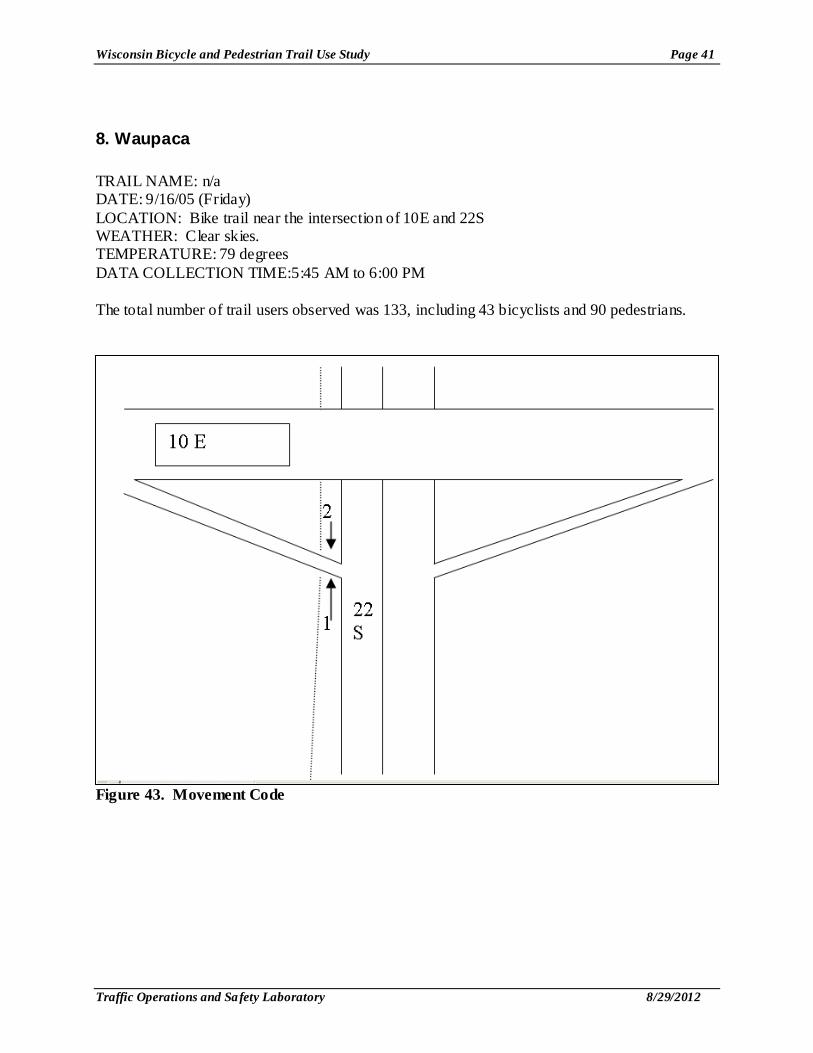
8. Waupaca TRAIL NAME: n/a DATE: 9/16/05 (Friday) LOCATION: Bike trail near the intersection of 10E and 22S WEATHER: Clear skies. TEMPERATURE: 79 degrees DATA COLLECTION TIME:5:45 AM to 6:00 PM The total number of trail users observed was 133, including 43 bicyclists and 90 pedestrians.
Figure 43. Movement Code
Wisconsin Bicycle and Pedestrian Trail Use Study Page 42
Traffic Operations and Safety Laboratory 8/29/2012
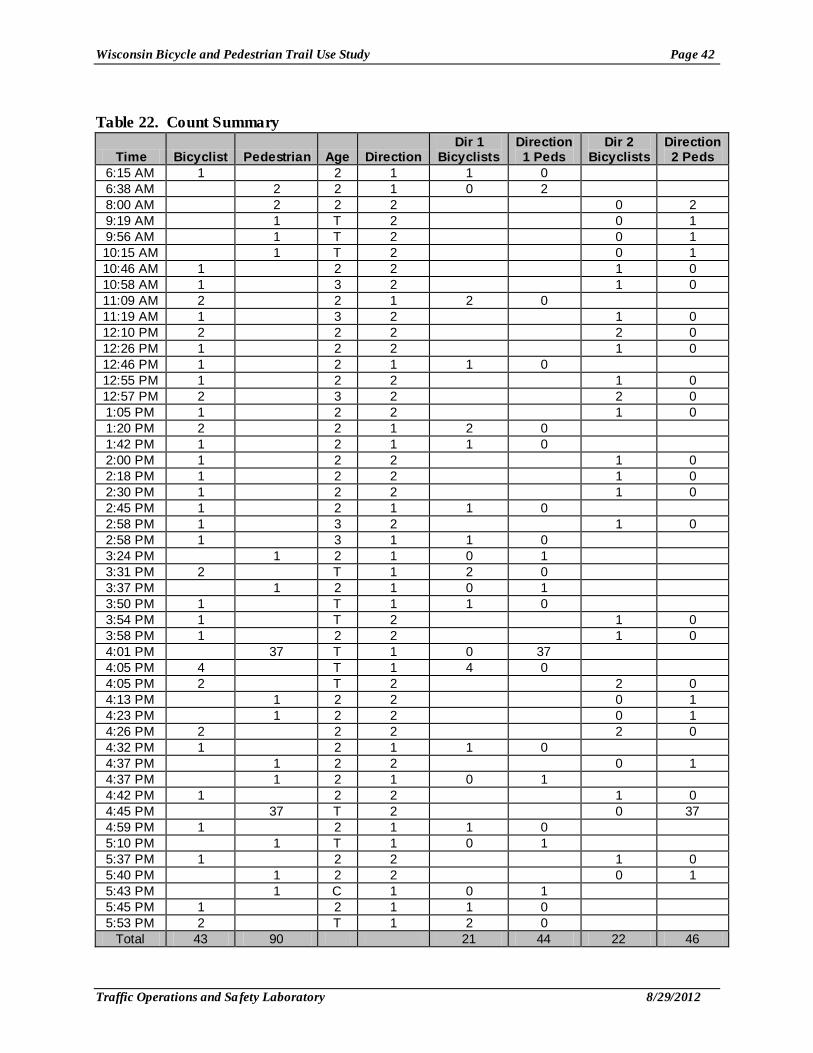
Table 22. Count Summary
Time Bicyclist Pedestrian Age Direction Dir 1
Bicyclists Direction 1 Peds
Dir 2 Bicyclists
Direction 2 Peds
6:15 AM 1 2 1 1 0 6:38 AM 2 2 1 0 2 8:00 AM 2 2 2 0 2 9:19 AM 1 T 2 0 1 9:56 AM 1 T 2 0 1 10:15 AM 1 T 2 0 1 10:46 AM 1 2 2 1 0 10:58 AM 1 3 2 1 0 11:09 AM 2 2 1 2 0 11:19 AM 1 3 2 1 0 12:10 PM 2 2 2 2 0 12:26 PM 1 2 2 1 0 12:46 PM 1 2 1 1 0 12:55 PM 1 2 2 1 0 12:57 PM 2 3 2 2 0 1:05 PM 1 2 2 1 0 1:20 PM 2 2 1 2 0 1:42 PM 1 2 1 1 0 2:00 PM 1 2 2 1 0 2:18 PM 1 2 2 1 0 2:30 PM 1 2 2 1 0 2:45 PM 1 2 1 1 0 2:58 PM 1 3 2 1 0 2:58 PM 1 3 1 1 0 3:24 PM 1 2 1 0 1 3:31 PM 2 T 1 2 0 3:37 PM 1 2 1 0 1 3:50 PM 1 T 1 1 0 3:54 PM 1 T 2 1 0 3:58 PM 1 2 2 1 0 4:01 PM 37 T 1 0 37 4:05 PM 4 T 1 4 0 4:05 PM 2 T 2 2 0 4:13 PM 1 2 2 0 1 4:23 PM 1 2 2 0 1 4:26 PM 2 2 2 2 0 4:32 PM 1 2 1 1 0 4:37 PM 1 2 2 0 1 4:37 PM 1 2 1 0 1 4:42 PM 1 2 2 1 0 4:45 PM 37 T 2 0 37 4:59 PM 1 2 1 1 0 5:10 PM 1 T 1 0 1 5:37 PM 1 2 2 1 0 5:40 PM 1 2 2 0 1 5:43 PM 1 C 1 0 1 5:45 PM 1 2 1 1 0 5:53 PM 2 T 1 2 0
Total 43 90 21 44 22 46
Wisconsin Bicycle and Pedestrian Trail Use Study Page 43
Traffic Operations and Safety Laboratory 8/29/2012
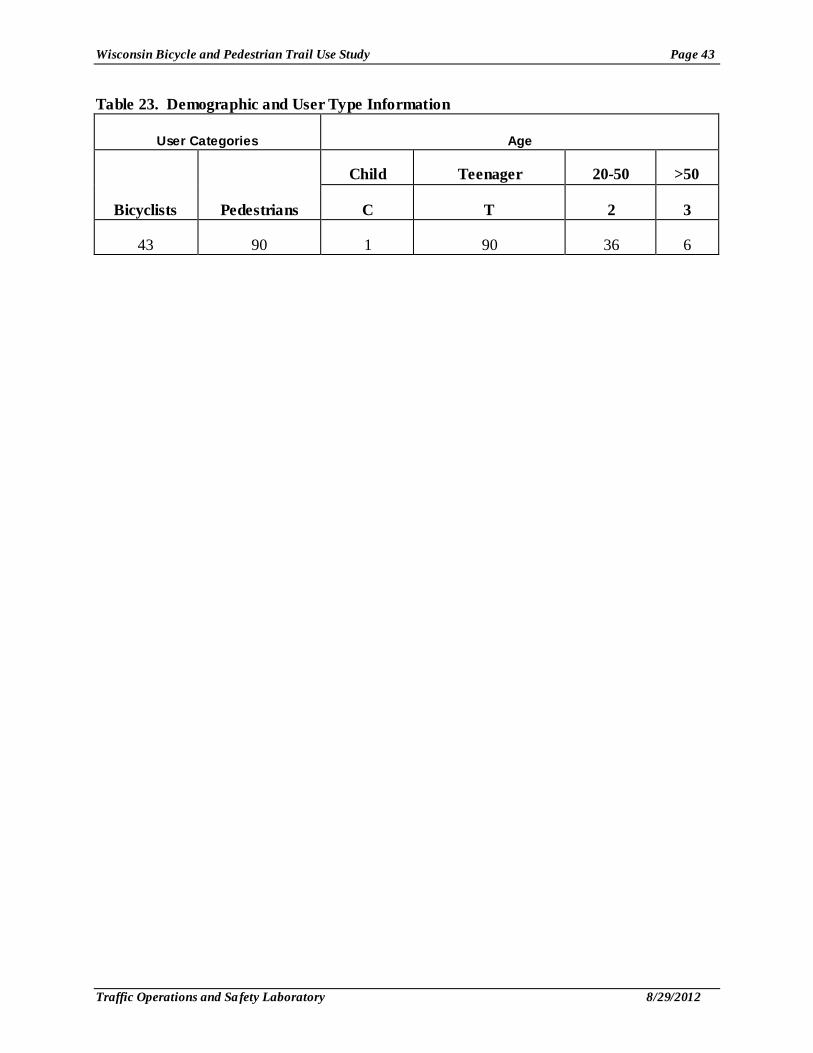
Table 23. Demographic and User Type Information
User Categories Age
Bicyclists Pedestrians
Child Teenager 20-50 >50
C T 2 3
43 90 1 90 36 6
Wisconsin Bicycle and Pedestrian Trail Use Study Page 44
Traffic Operations and Safety Laboratory 8/29/2012
CHAPTER 3
OBSERVATIONS AND CONCLUSIONS The following trends were observed:
• The Southwest Trail (1) exhibited distinct AM and PM peaks with the AM peak occurring primarily in the west to east direction and the PM peak occurring in the east to west direction.
• Highway 19 paved shoulders (2) and the Highway 151 trail (3) were low usage compared to the other selected trails (Less than 50 trail users throughout the day).
• Tuesday study for the Capital City Trail (4) exhibited a distinct PM peak and a marginal AM peak. Saturday usage was high (over 10 users every 15 minutes) from noon through early evening.
• Springbrook Trail (5) exhibited relatively high usage from morning to evening. This was a Saturday study.
• Plank Trail (6) study, which was distributed between a Friday (1:15 PM to 8:15 PM) and a Saturday (5:30 AM to 1:15 PM) exhibited different degrees of usage at different study locations (counting was done at 3 sites in this trail). Overall, the maximum usage occurred at the intersection with Highway Y near Kohler with a higher usage (over 10 users every 15 minutes) occurring in the evening.
• Oakleaf Trail (7) study was performed on a Friday. This trail exhibited a high usage (over 10 users every 15 minutes) almost throughout the day, with the periods of maximum usage occurring in the evening.
• Usage in the Waupaca Trail (8) was generally low with 49 bicyclists and 90 pedestrians throughout the day. The pedestrian volume was a little higher than expected due to a group of 37 joggers (presumably from the adjacent high school) who were counted twice (first going northbound and later southbound). The site and date for the study were purposely selected to see if this relatively new trail connection to the high school had an impact on trail usage. Summer usage would likely be higher.
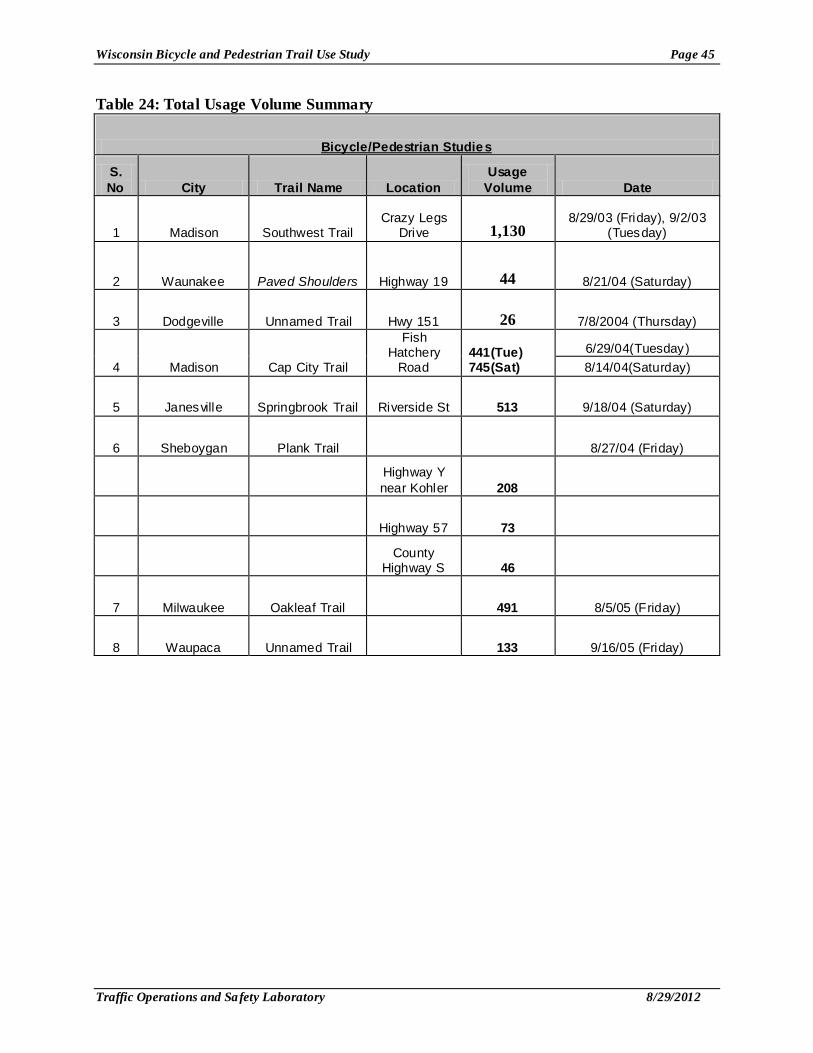
The total number of users (usage volumes) for each of the trails and paved shoulders is summarized in Table 24.
Wisconsin Bicycle and Pedestrian Trail Use Study Page 45
Traffic Operations and Safety Laboratory 8/29/2012
Table 24: Total Usage Volume Summary
Bicycle/Pedestrian Studies
S. No City Trail Name Location
Usage Volume Date
1 Madison Southwest Trail Crazy Legs
Drive 1,130 8/29/03 (Friday), 9/2/03
(Tuesday)
2 Waunakee Paved Shoulders Highway 19 44 8/21/04 (Saturday)
3 Dodgeville Unnamed Trail Hwy 151 26 7/8/2004 (Thursday)
4 Madison Cap City Trail
Fish Hatchery
Road 441(Tue) 745(Sat)
6/29/04(Tuesday) 8/14/04(Saturday)
5 Janesville Springbrook Trail Riverside St 513 9/18/04 (Saturday)
6 Sheboygan Plank Trail 8/27/04 (Friday)
Highway Y near Kohler 208
Highway 57 73
County
Highway S 46
7 Milwaukee Oakleaf Trail 491 8/5/05 (Friday)
8 Waupaca Unnamed Trail 133 9/16/05 (Friday)