Embed Size (px)
Citation preview
Wisconsin Education Challenges
2015 Federal Funding Conference
Jeff Pertl, Senior Policy Advisor
Changing Faces of Wisconsin
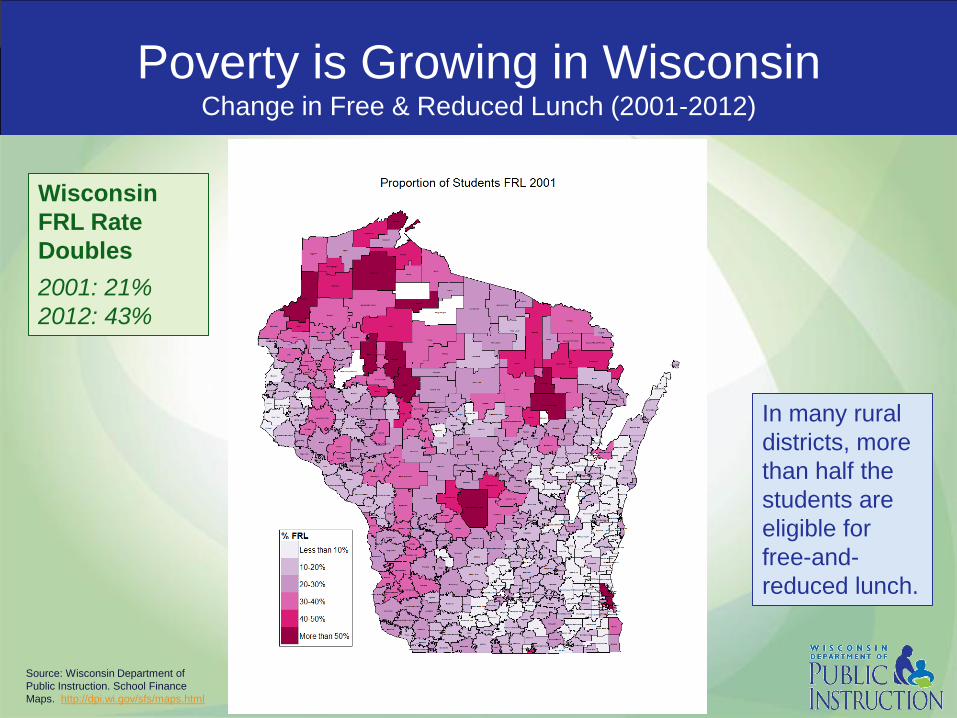
Poverty is Growing in Wisconsin Change in Free & Reduced Lunch (2001-2012)
Source: Wisconsin Department of
Public Instruction. School Finance
Maps. http://dpi.wi.gov/sfs/maps.html
In many rural
districts, more
than half the
students are
eligible for
free-and-
reduced lunch.
Wisconsin
FRL Rate
Doubles
2001: 21%
2012: 43%
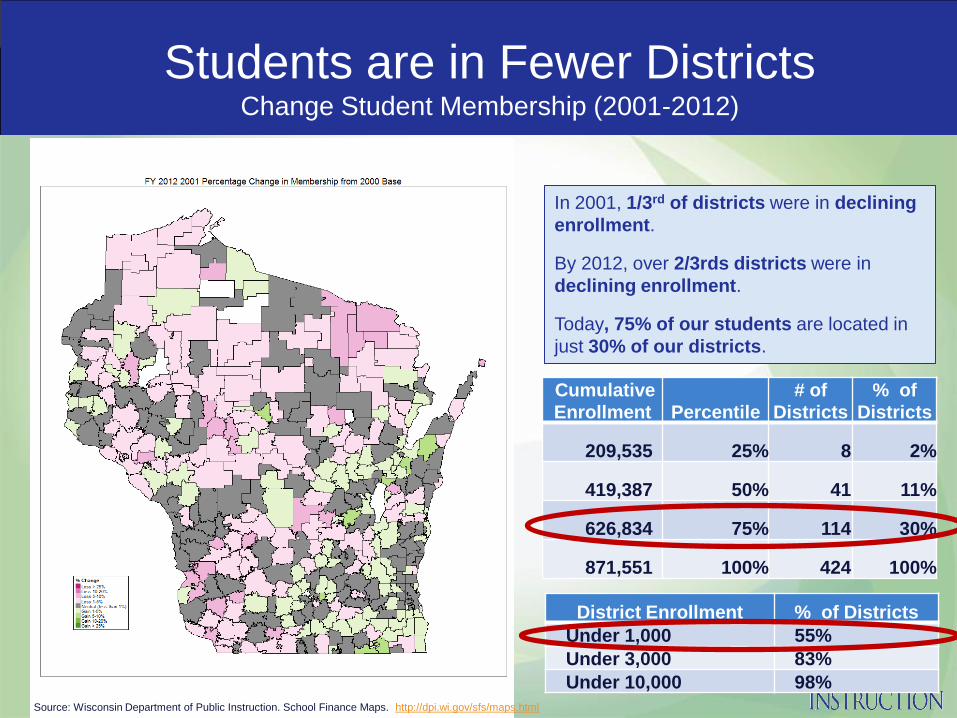
Students are in Fewer Districts Change Student Membership (2001-2012)
In 2001, 1/3rd of districts were in declining
enrollment.
By 2012, over 2/3rds districts were in
declining enrollment.
Today, 75% of our students are located in
just 30% of our districts.
Wisconsin
FRL Rate
Doubles
2001: 21%
2012: 43% Cumulative
Enrollment Percentile # of
Districts % of
Districts
209,535 25% 8 2%
419,387 50% 41 11%
626,834 75% 114 30%
871,551 100% 424 100%
Source: Wisconsin Department of Public Instruction. School Finance Maps. http://dpi.wi.gov/sfs/maps.html
District Enrollment % of Districts
Under 1,000 55%
Under 3,000 83%
Under 10,000 98%
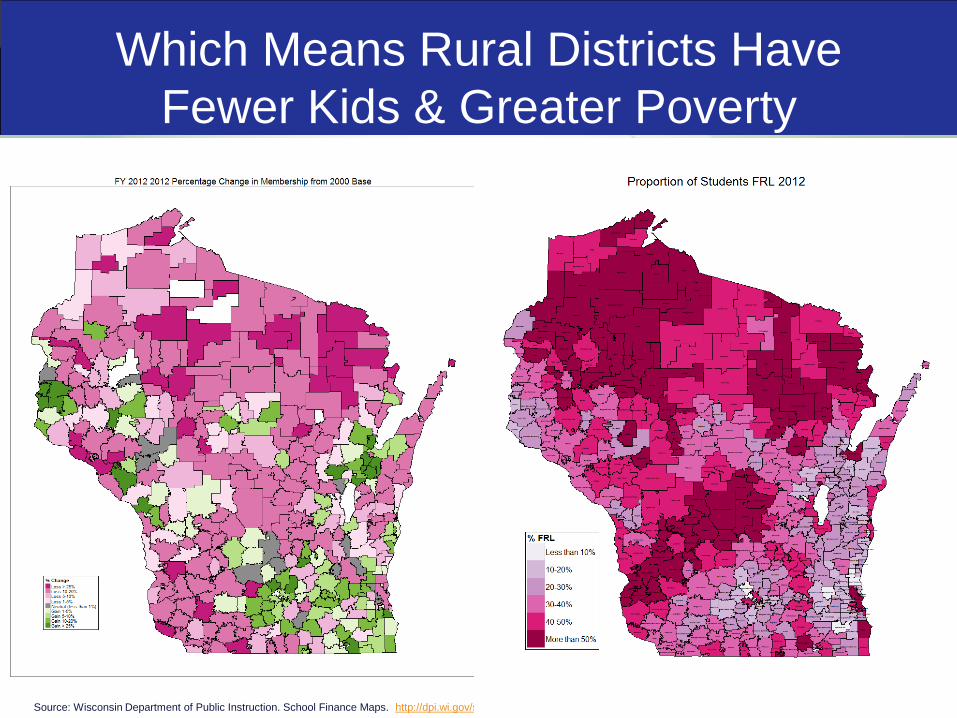
Which Means Rural Districts Have
Fewer Kids & Greater Poverty
Wisconsin
FRL Rate
Doubles
2001: 21%
2012: 43%
Source: Wisconsin Department of Public Instruction. School Finance Maps. http://dpi.wi.gov/sfs/maps.html
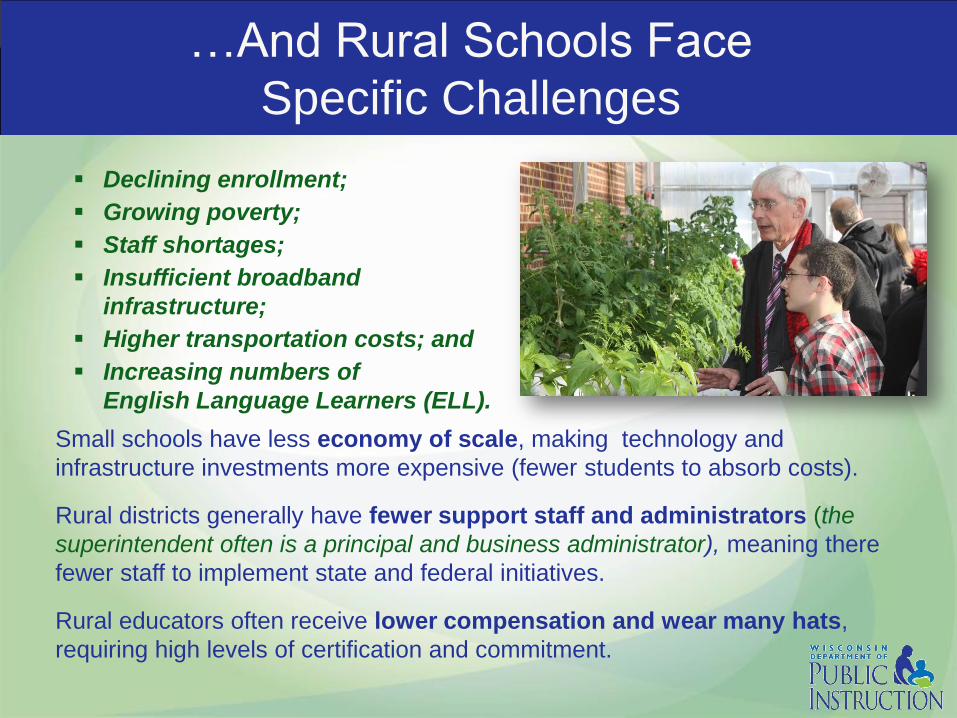
…And Rural Schools Face
Specific Challenges
Declining enrollment;
Growing poverty;
Staff shortages;
Insufficient broadband
infrastructure;
Higher transportation costs; and
Increasing numbers of
English Language Learners (ELL).
Small schools have less economy of scale, making technology and
infrastructure investments more expensive (fewer students to absorb costs).
Rural districts generally have fewer support staff and administrators (the
superintendent often is a principal and business administrator), meaning there
fewer staff to implement state and federal initiatives.
Rural educators often receive lower compensation and wear many hats,
requiring high levels of certification and commitment.
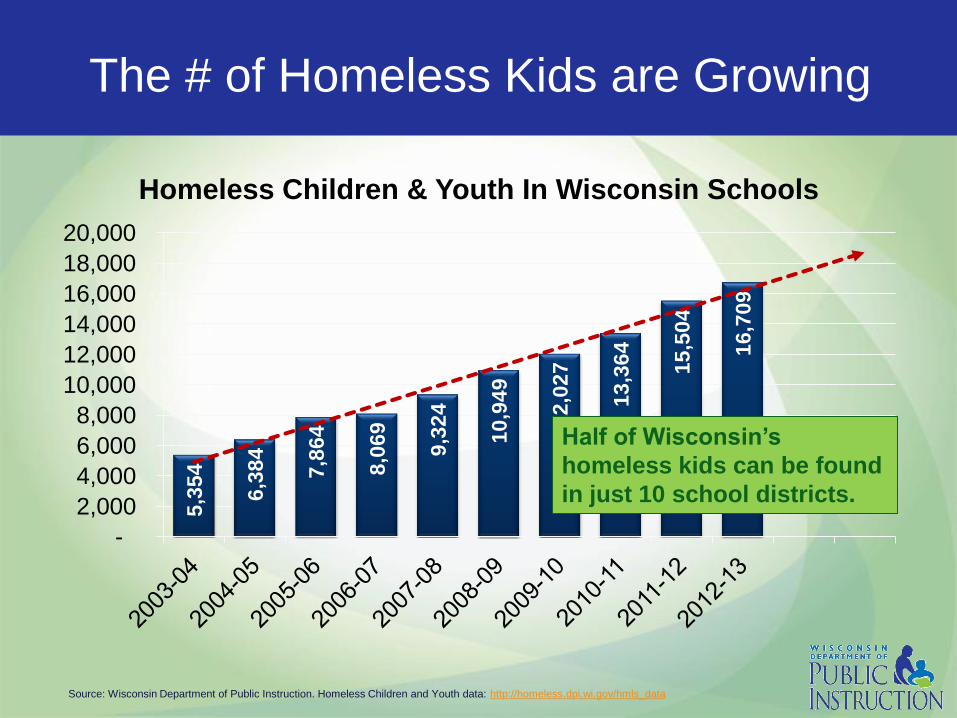
The # of Homeless Kids are Growing
Source: Wisconsin Department of Public Instruction. Homeless Children and Youth data: http://homeless.dpi.wi.gov/hmls_data
5,3
54
6,3
84
7,8
64
8,0
69
9,3
24
10
,94
9
12
,02
7
13
,36
4
15
,50
4
16
,70
9
-
2,000
4,000
6,000
8,000
10,000
12,000
14,000
16,000
18,000
20,000
Homeless Children & Youth In Wisconsin Schools
Half of Wisconsin’s
homeless kids can be found
in just 10 school districts.
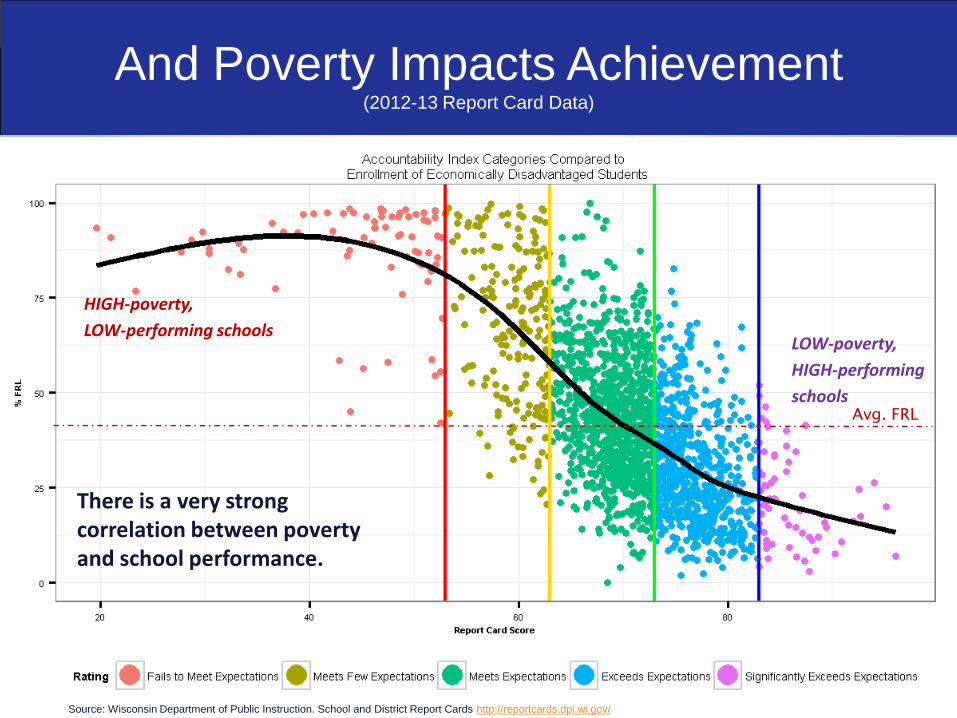
And Poverty Impacts Achievement (2012-13 Report Card Data)
There is a very strong correlation between poverty and school performance.
Avg. FRL
HIGH-poverty,
LOW-performing schools LOW-poverty,
HIGH-performing
schools
Source: Wisconsin Department of Public Instruction. School and District Report Cards http://reportcards.dpi.wi.gov/
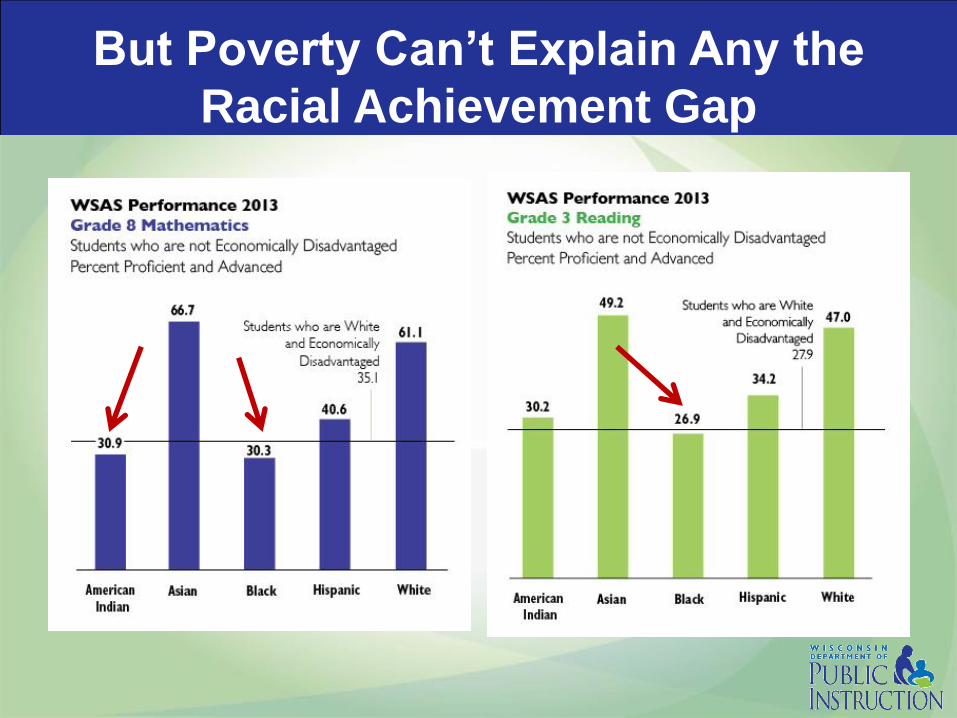
But Poverty Can’t Explain Any the
Racial Achievement Gap
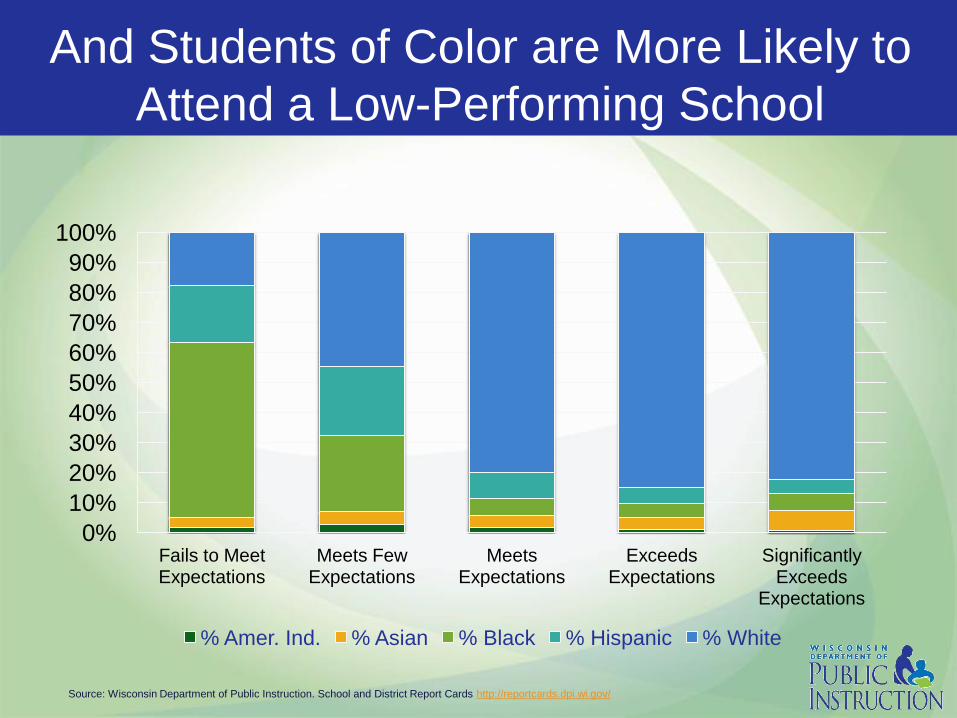
And Students of Color are More Likely to
Attend a Low-Performing School
0%
10%
20%
30%
40%
50%
60%
70%
80%
90%
100%
Fails to Meet Expectations
Meets Few Expectations
Meets Expectations
Exceeds Expectations
Significantly Exceeds
Expectations
% Amer. Ind. % Asian % Black % Hispanic % White
Source: Wisconsin Department of Public Instruction. School and District Report Cards http://reportcards.dpi.wi.gov/
Vouchers & Charters Expansion
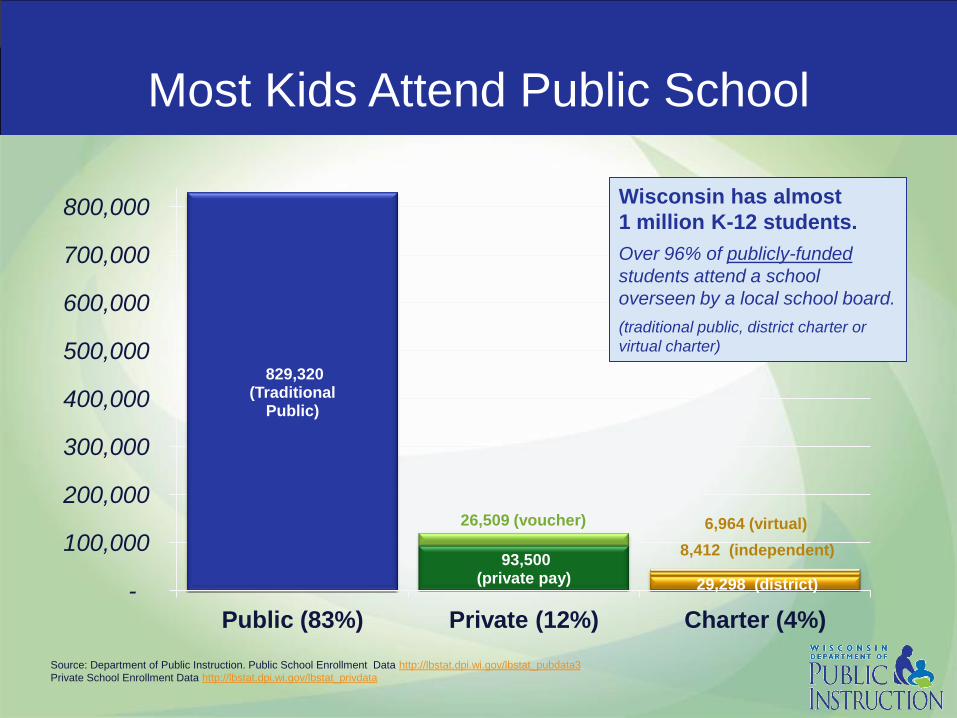
Most Kids Attend Public School
829,320 (Traditional
Public)
93,500 (private pay) 29,298 (district)
26,509 (voucher)
8,412 (independent)
6,964 (virtual)
-
100,000
200,000
300,000
400,000
500,000
600,000
700,000
800,000
Public (83%) Private (12%) Charter (4%)
Source: Department of Public Instruction. Public School Enrollment Data http://lbstat.dpi.wi.gov/lbstat_pubdata3
Private School Enrollment Data http://lbstat.dpi.wi.gov/lbstat_privdata
Wisconsin has almost
1 million K-12 students.
Over 96% of publicly-funded
students attend a school
overseen by a local school board.
(traditional public, district charter or
virtual charter)
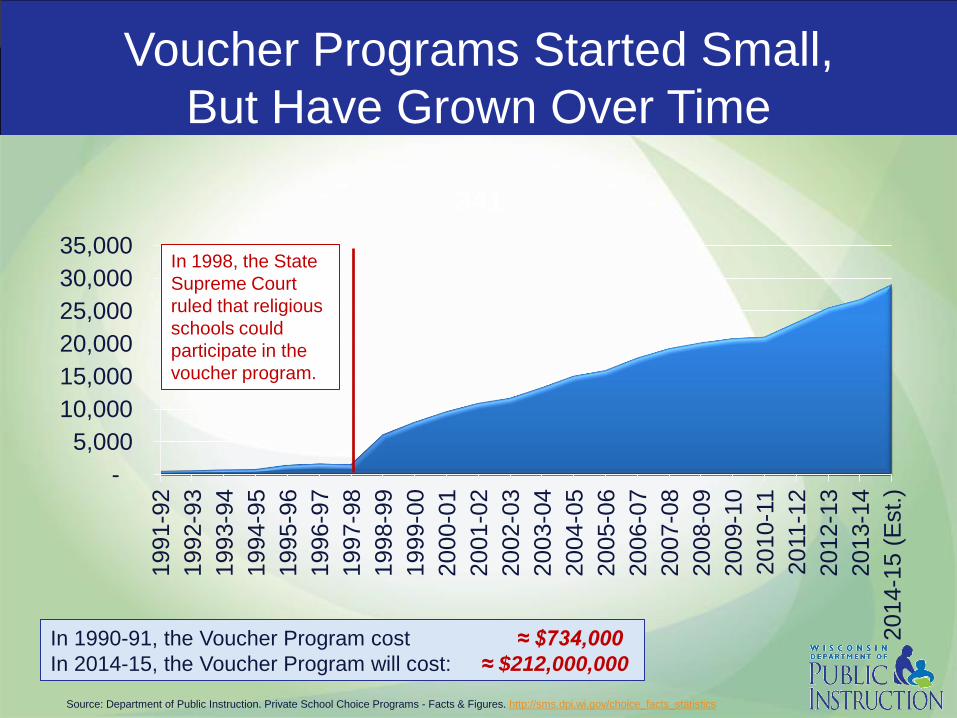
Voucher Programs Started Small,
But Have Grown Over Time
-
5,000
10,000
15,000
20,000
25,000
30,000
35,000
1991-9
2
1992-9
3
1993-9
4
1994-9
5
1995-9
6
1996-9
7
1997-9
8
1998-9
9
1999-0
0
2000-0
1
2001-0
2
2002-0
3
2003-0
4
2004-0
5
2005-0
6
2006-0
7
2007-0
8
2008-0
9
2009-1
0
2010-1
1
2011-1
2
2012-1
3
2013-1
4
2014-1
5 (
Est.
)
341
In 1998, the State
Supreme Court
ruled that religious
schools could
participate in the
voucher program.
In 1990-91, the Voucher Program cost ≈ $734,000
In 2014-15, the Voucher Program will cost: ≈ $212,000,000
Source: Department of Public Instruction. Private School Choice Programs - Facts & Figures. http://sms.dpi.wi.gov/choice_facts_statistics
0%
10%
20%
30%
40%
50%
60%
70%
80%
90%
100%
1
3
5
7
9
11
13
15
17
19
21
23
25
27
29
31
33
35
37
39
41
43
45
47
49
51
53
55
57
59
61
63
65
67
69
71
73
75
77
79
81
83
85
87
89
91
93
95
97
99
10
1
10
3
10
5
10
7
10
9
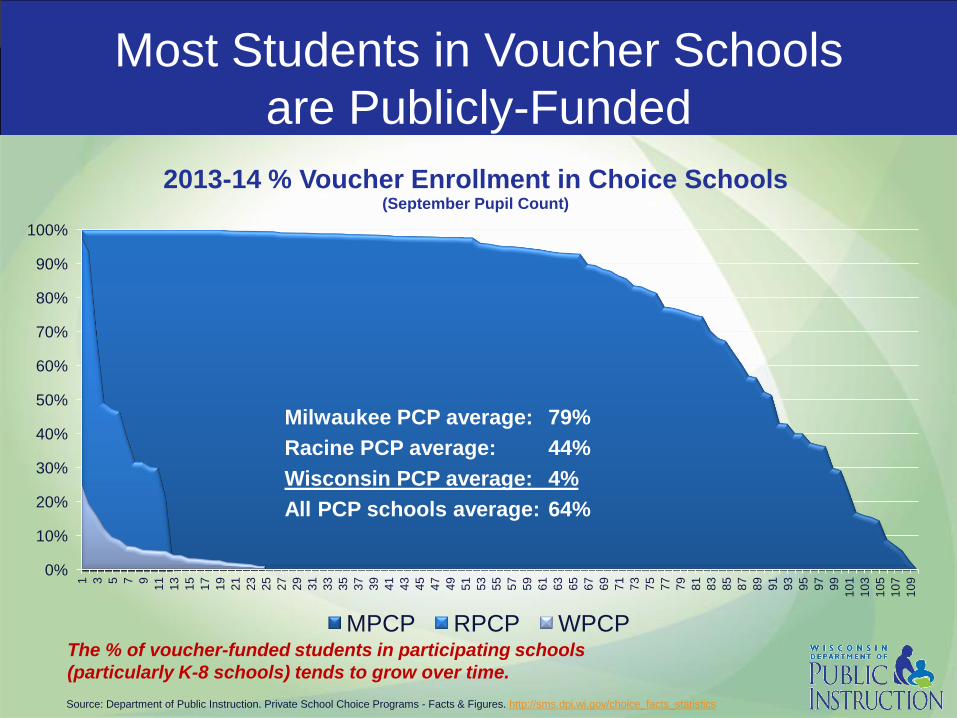
2013-14 % Voucher Enrollment in Choice Schools (September Pupil Count)
MPCP RPCP WPCP
Most Students in Voucher Schools
are Publicly-Funded
Milwaukee PCP average: 79%
Racine PCP average: 44%
Wisconsin PCP average: 4%
All PCP schools average: 64%
The % of voucher-funded students in participating schools
(particularly K-8 schools) tends to grow over time.
Source: Department of Public Instruction. Private School Choice Programs - Facts & Figures. http://sms.dpi.wi.gov/choice_facts_statistics
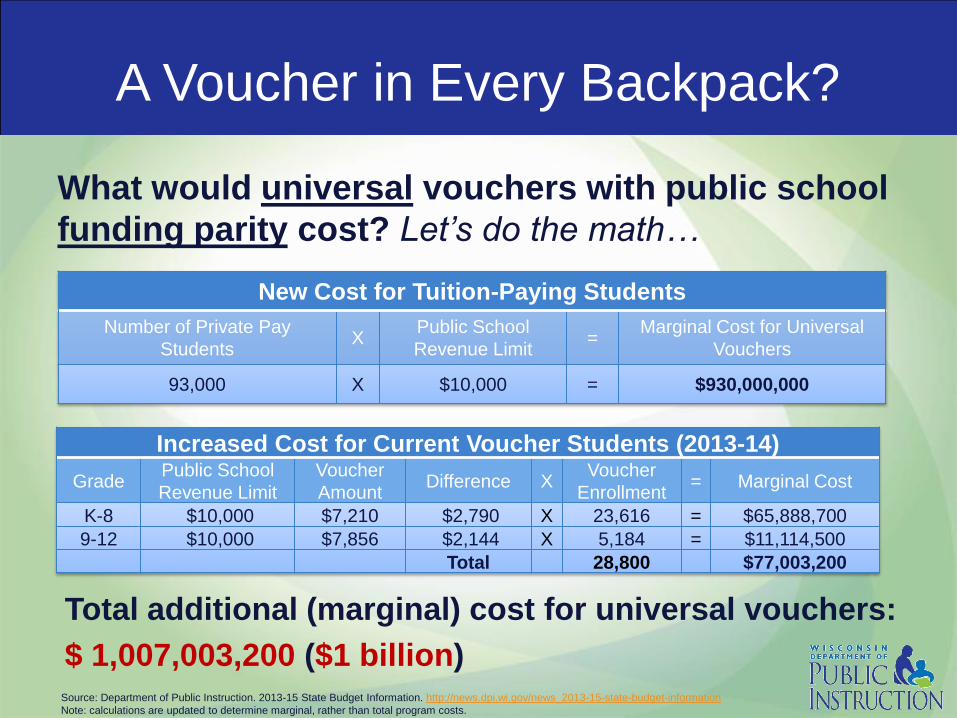
A Voucher in Every Backpack?
What would universal vouchers with public school
funding parity cost? Let’s do the math…
New Cost for Tuition-Paying Students
Number of Private Pay
Students X
Public School
Revenue Limit =
Marginal Cost for Universal
Vouchers
93,000 X $10,000 = $930,000,000
Increased Cost for Current Voucher Students (2013-14)
Grade Public School
Revenue Limit
Voucher
Amount Difference X
Voucher
Enrollment = Marginal Cost
K-8 $10,000 $7,210 $2,790 X 23,616 = $65,888,700
9-12 $10,000 $7,856 $2,144 X 5,184 = $11,114,500
Total 28,800 $77,003,200
Total additional (marginal) cost for universal vouchers:
$ 1,007,003,200 ($1 billion)
Source: Department of Public Instruction. 2013-15 State Budget Information. http://news.dpi.wi.gov/news_2013-15-state-budget-information
Note: calculations are updated to determine marginal, rather than total program costs.
School Finance Challenges
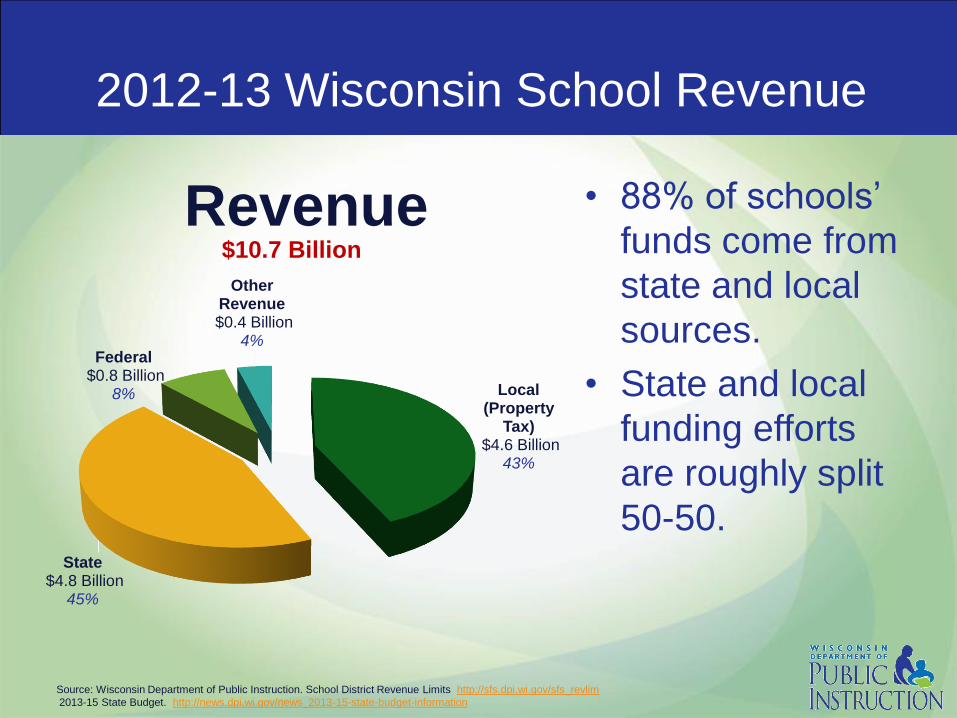
2012-13 Wisconsin School Revenue
Local (Property
Tax) $4.6 Billion
43%
State $4.8 Billion
45%
Federal $0.8 Billion
8%
Other Revenue
$0.4 Billion 4%
Revenue $10.7 Billion
• 88% of schools’
funds come from
state and local
sources.
• State and local
funding efforts
are roughly split
50-50.
Source: Wisconsin Department of Public Instruction. School District Revenue Limits http://sfs.dpi.wi.gov/sfs_revlim
2013-15 State Budget. http://news.dpi.wi.gov/news_2013-15-state-budget-information
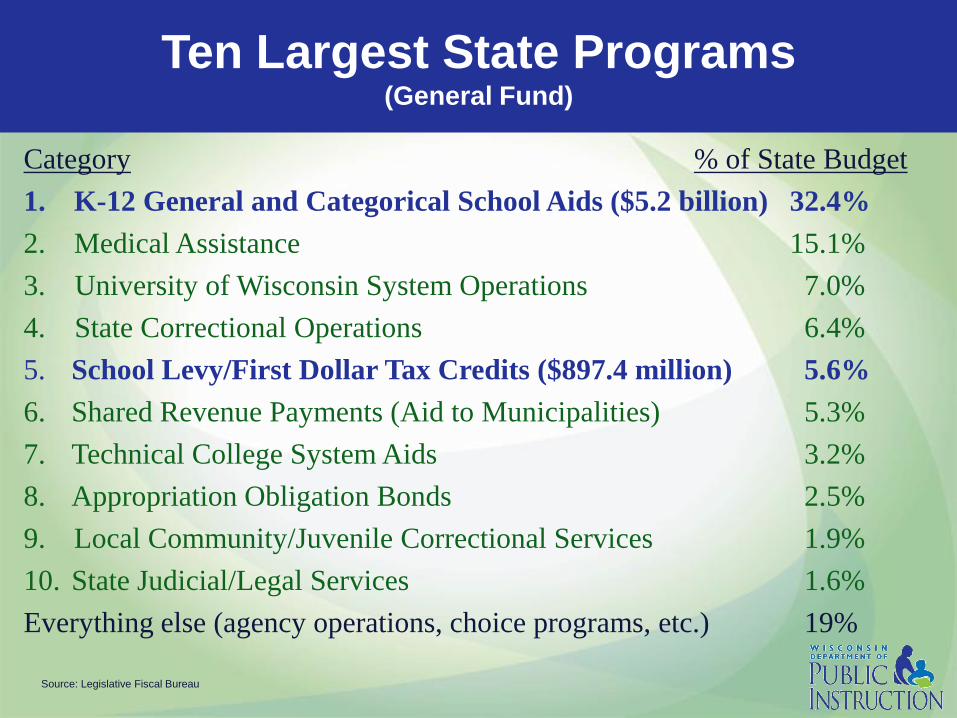
Category % of State Budget
1. K-12 General and Categorical School Aids ($5.2 billion) 32.4%
2. Medical Assistance 15.1%
3. University of Wisconsin System Operations 7.0%
4. State Correctional Operations 6.4%
5. School Levy/First Dollar Tax Credits ($897.4 million) 5.6%
6. Shared Revenue Payments (Aid to Municipalities) 5.3%
7. Technical College System Aids 3.2%
8. Appropriation Obligation Bonds 2.5%
9. Local Community/Juvenile Correctional Services 1.9%
10. State Judicial/Legal Services 1.6%
Everything else (agency operations, choice programs, etc.) 19%
Ten Largest State Programs (General Fund)
Source: Legislative Fiscal Bureau
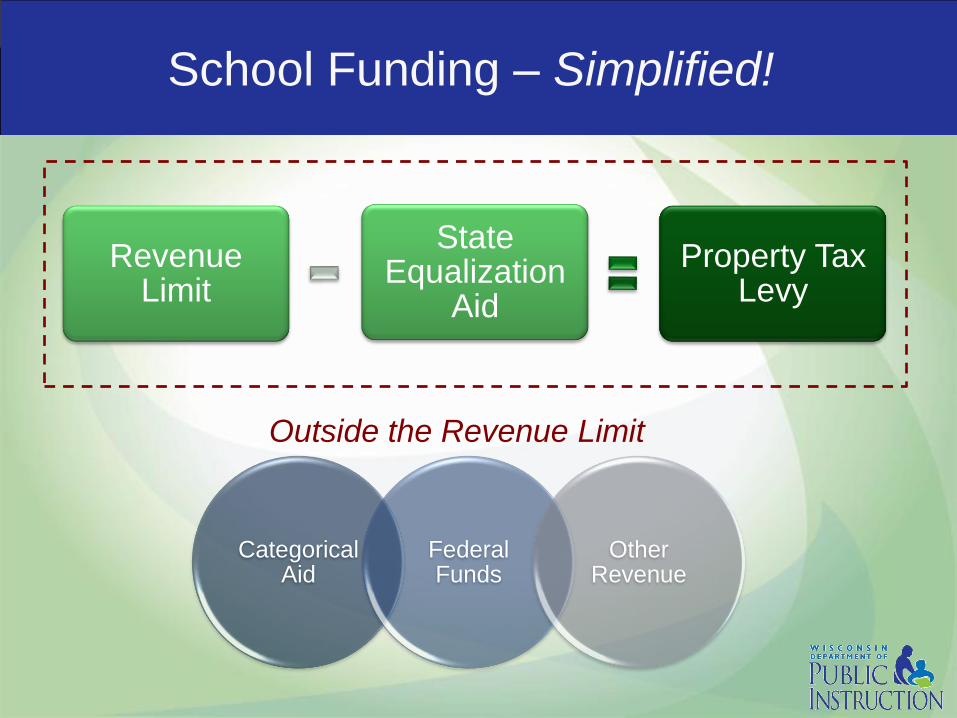
School Funding – Simplified!
Property Tax Levy
State Equalization
Aid
Revenue Limit
Categorical Aid
Federal Funds
Other Revenue
Outside the Revenue Limit
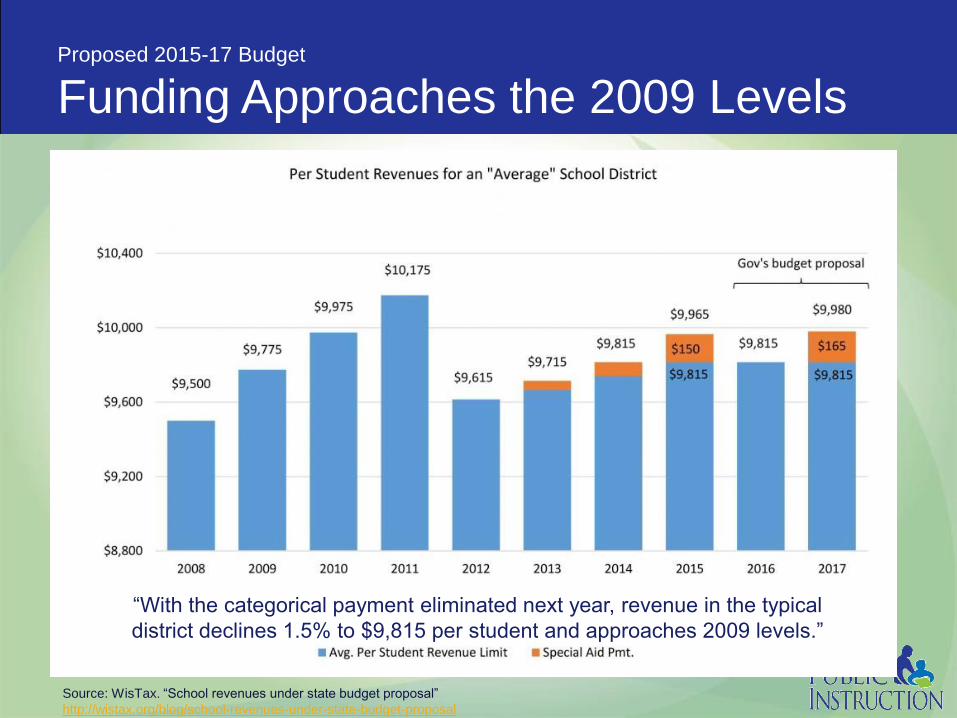
Proposed 2015-17 Budget
Funding Approaches the 2009 Levels
“With the categorical payment eliminated next year, revenue in the typical
district declines 1.5% to $9,815 per student and approaches 2009 levels.”
Source: WisTax. “School revenues under state budget proposal”
http://wistax.org/blog/school-revenues-under-state-budget-proposal
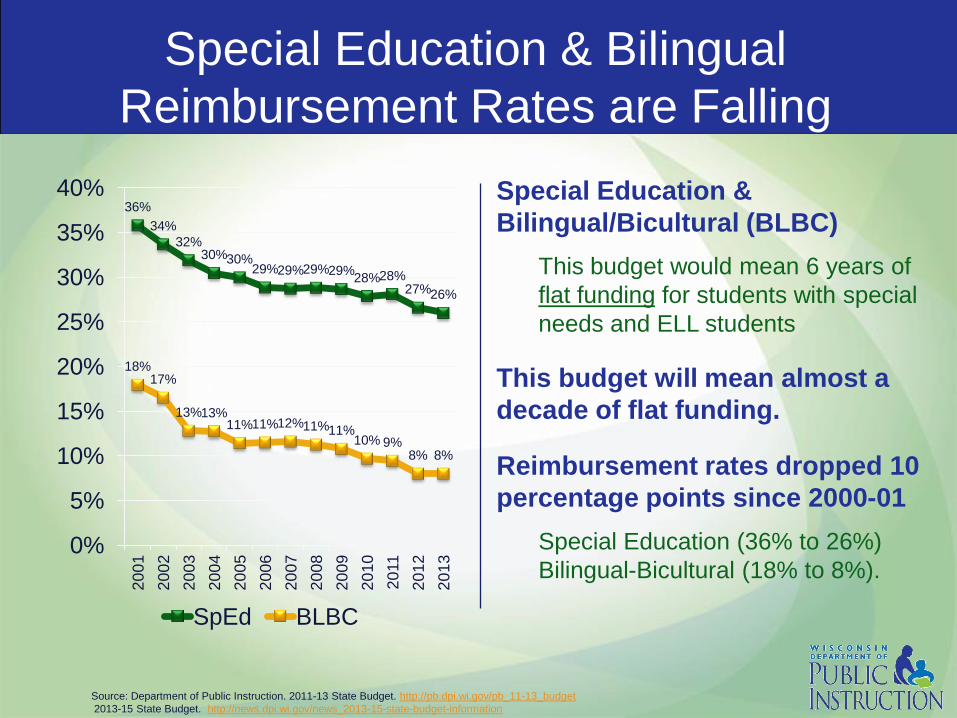
Special Education & Bilingual
Reimbursement Rates are Falling
36%
34%
32% 30% 30%
29% 29% 29% 29% 28% 28%
27% 26%
18% 17%
13% 13% 11% 11% 12% 11% 11%
10% 9% 8% 8%
0%
5%
10%
15%
20%
25%
30%
35%
40%
20
01
20
02
20
03
20
04
20
05
20
06
20
07
20
08
20
09
20
10
20
11
20
12
20
13
SpEd BLBC
Special Education &
Bilingual/Bicultural (BLBC)
This budget would mean 6 years of
flat funding for students with special
needs and ELL students
This budget will mean almost a
decade of flat funding.
Reimbursement rates dropped 10
percentage points since 2000-01
Special Education (36% to 26%)
Bilingual-Bicultural (18% to 8%).
Source: Department of Public Instruction. 2011-13 State Budget. http://pb.dpi.wi.gov/pb_11-13_budget
2013-15 State Budget. http://news.dpi.wi.gov/news_2013-15-state-budget-information
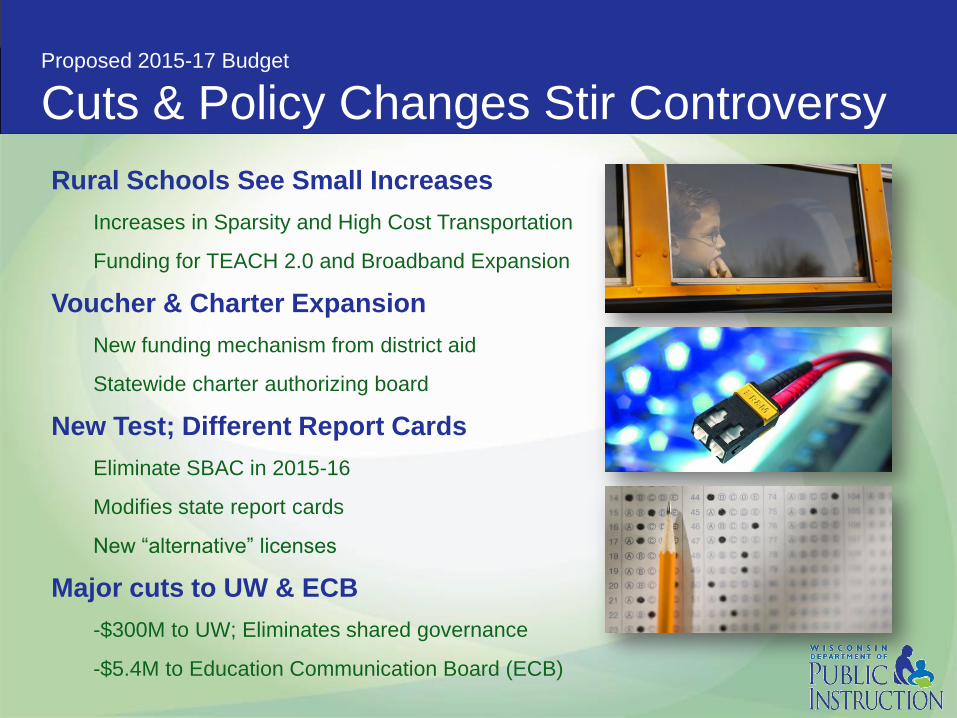
Proposed 2015-17 Budget
Cuts & Policy Changes Stir Controversy
Rural Schools See Small Increases
Increases in Sparsity and High Cost Transportation
Funding for TEACH 2.0 and Broadband Expansion
Voucher & Charter Expansion
New funding mechanism from district aid
Statewide charter authorizing board
New Test; Different Report Cards
Eliminate SBAC in 2015-16
Modifies state report cards
New “alternative” licenses
Major cuts to UW & ECB
-$300M to UW; Eliminates shared governance
-$5.4M to Education Communication Board (ECB)
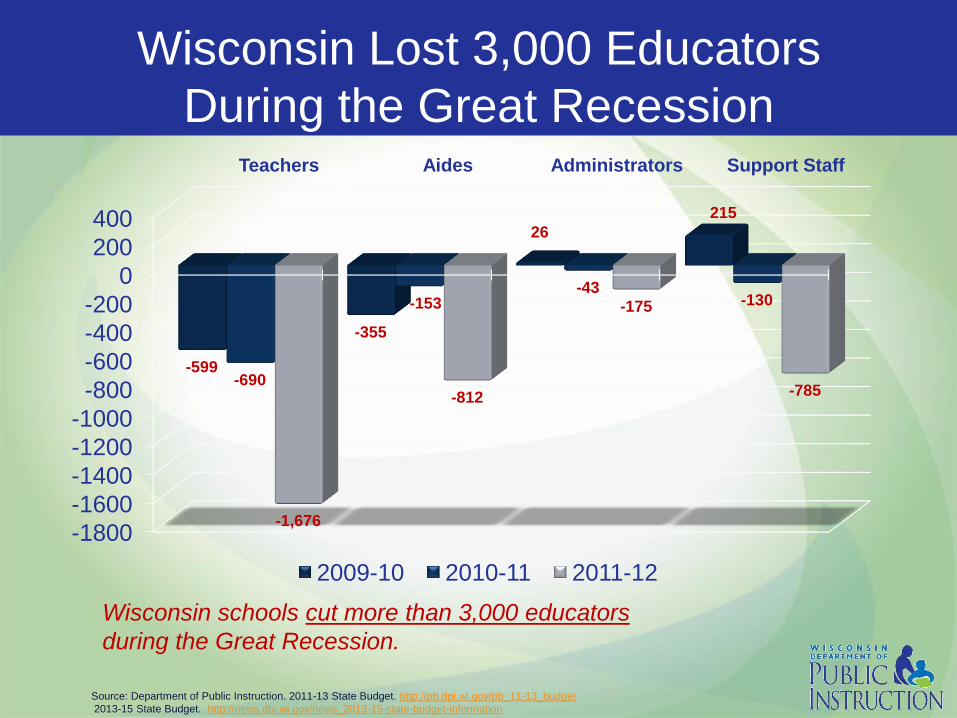
Wisconsin Lost 3,000 Educators
During the Great Recession
-1800
-1600
-1400
-1200
-1000
-800
-600
-400
-200
0
200
400
Teachers Aides Administrators Support Staff
-599
-355
26
215
-690
-153 -43
-130
-1,676
-812
-175
-785
2009-10 2010-11 2011-12
Wisconsin schools cut more than 3,000 educators
during the Great Recession.
Source: Department of Public Instruction. 2011-13 State Budget. http://pb.dpi.wi.gov/pb_11-13_budget
2013-15 State Budget. http://news.dpi.wi.gov/news_2013-15-state-budget-information
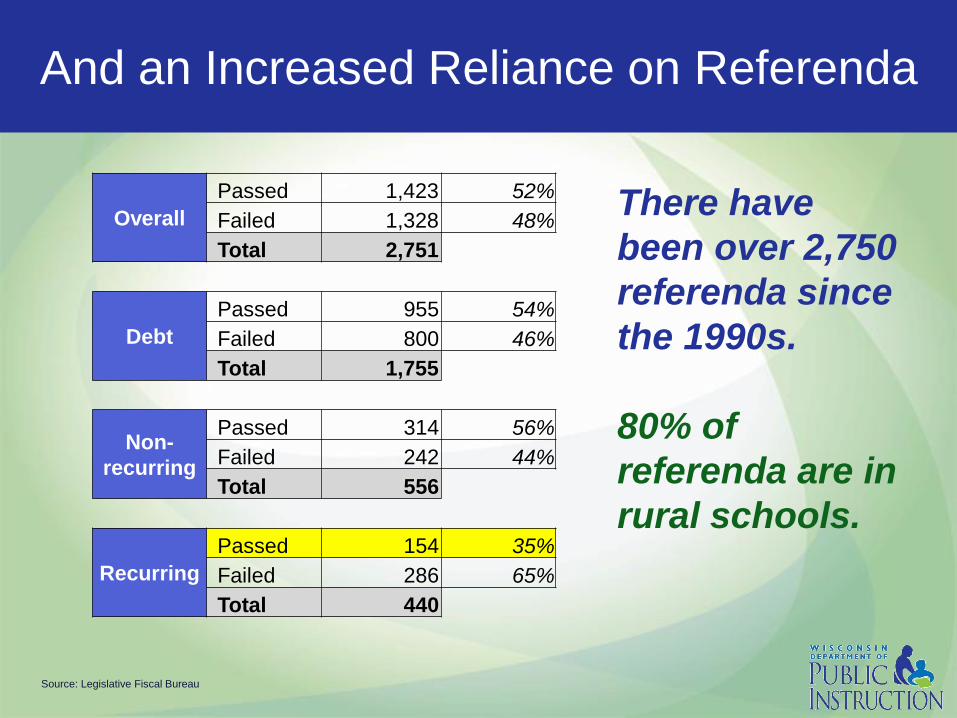
And an Increased Reliance on Referenda
Source: Legislative Fiscal Bureau
Overall
Passed 1,423 52%
Failed 1,328 48%
Total 2,751
Debt
Passed 955 54%
Failed 800 46%
Total 1,755
Non-
recurring
Passed 314 56%
Failed 242 44%
Total 556
Recurring
Passed 154 35%
Failed 286 65%
Total 440
There have
been over 2,750
referenda since
the 1990s.
80% of
referenda are in
rural schools.

Is There a Better Way Forward?
“The world ain’t all sunshine and rainbows. It’s a very mean and nasty
place and I don’t care how tough you are it will beat you to your knees and
keep you there permanently if you let it. You, me, or nobody is gonna hit as
hard as life. But it ain’t about how hard ya hit. It’s about how hard you can
get hit and keep moving forward.”
– Rocky Balboa
Finish What We Started: Every Child a
Graduate College & Career Ready
Standards & Instruction
– What and how should kids learn?
• Common Core State Standards
Assessments and Data Systems
– How do we know if they learned it?
• Next Generation Assessments
Accountability
– How do we support improvement?
• Personalized learning, RtI & PBIS
• New educator effectiveness system
• Accountability system reform
School Finance
– How should we pay for schools?
• Fair Funding for our Future
“I thought
that words
and books
and pens
were more
powerful than
guns.”
-Malala YouSafzai
The strategies and best practices
advanced in the “Promoting
Excellence for All” report and website
are from educators, for educators.
The strategies span four categories:
• Effective instruction;
• Student-teacher relationships;
• Family and community
engagement; and
• School and instructional
leadership.
From the Angel List and Focused
Events to Cultural Competency and
Relationship Building, they are tried
and tested by Wisconsin educators.
They work. They can make a
difference for your students tomorrow.
Shift Focus to Classrooms & Kids:
Achievement Gap Task Force
http://statesupt.dpi.wi.gov/excforall
Bottom Line
Wisconsin must meet the challenge of growing poverty
and increasingly diverse classrooms.
• Students and families have more options and choices than
ever before (neighborhood schools, charters, vouchers, open
enrollment, or virtual charters).
• But we have to close our achievement gaps and expand
personalized learning for all students.
• And rural schools deserve the resources to meet the needs
of their students without continuous referenda.
Together, we can do better….