Embed Size (px)
Citation preview
Wisconsin
Mental Health and Substance Abuse
Needs Assessment Update
STATE OF WISCONSIN DEPARTMENT OF HEALTH SERVICES Division of Mental Health and Substance Abuse Services P-00613 (02/2016)
2
Table of Contents Executive Summary ....................................................................................................................................... 3
Mental Health Summary ........................................................................................................................... 3
Substance Abuse Summary ....................................................................................................................... 4
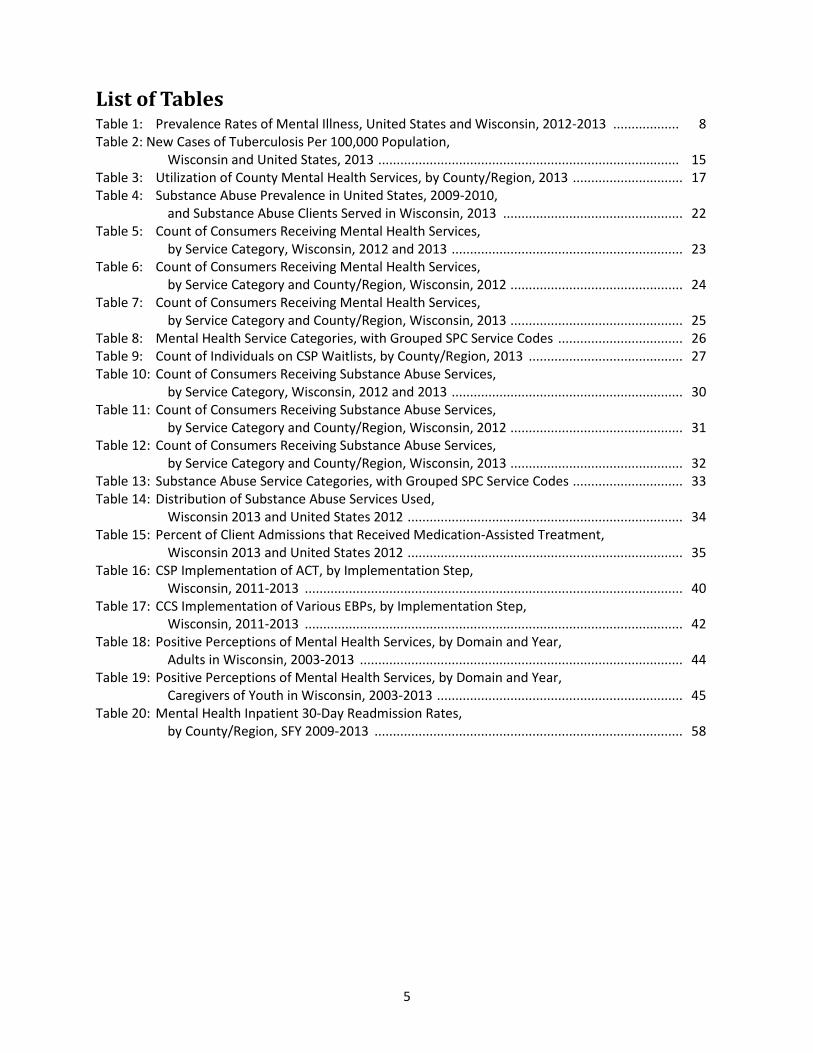
List of Tables ................................................................................................................................................. 5
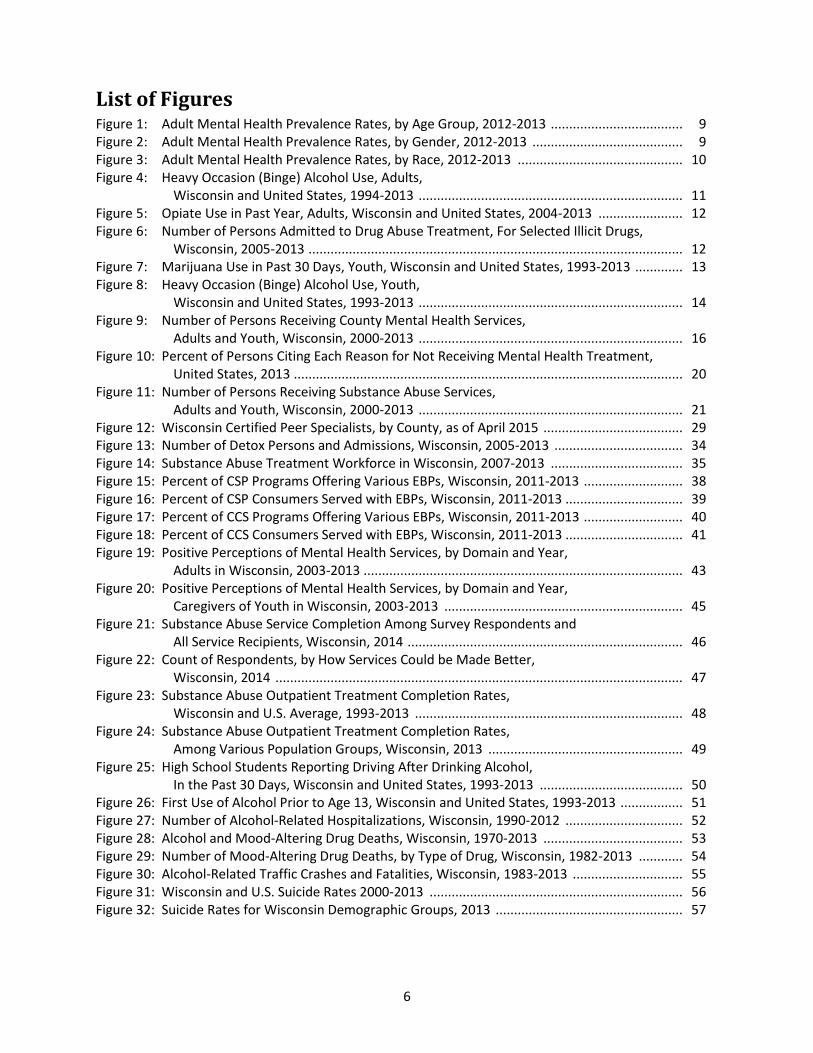
List of Figures ................................................................................................................................................ 6
Introduction .................................................................................................................................................. 7
Needs Assessment Update ........................................................................................................................... 7
I. Prevalence ............................................................................................................................................ 8
Mental Health Prevalence ........................................................................................................................ 8
Substance Abuse Prevalence .................................................................................................................. 10
II. Access to Services ............................................................................................................................... 16
Number of Mental Health Consumers Served ........................................................................................ 16
Geographic Disparities in Access to Mental Health Treatment .............................................................. 17
Access to Crisis Services through the County System ............................................................................. 19
Barriers to Mental Health Treatment, the Individual Perspective ......................................................... 19
Substance Abuse Services and Gaps ....................................................................................................... 20
Disparities in Substance Abuse Treatment ............................................................................................. 21
Barriers to Substance Abuse Treatment, the Individual Perspective ..................................................... 22
III. Service and Workforce Capacity ......................................................................................................... 23
County Mental Health Services ............................................................................................................... 23
Status of Efforts to Increase Capacity ..................................................................................................... 27
Certified Peer Specialists ......................................................................................................................... 27
County Substance Abuse Services .......................................................................................................... 30
Wisconsin and National Service Distribution .......................................................................................... 34
Detoxification Services ............................................................................................................................ 34
Medication-Assisted Treatment ............................................................................................................. 35
Substance Abuse Treatment Workforce ................................................................................................. 35
Substance Abuse Services Availability and Waiting List Issues ............................................................... 36
IV. Quality and Outcomes ........................................................................................................................ 37
Quality and Appropriateness of Services ................................................................................................ 37
Consumer Outcome Indicators ............................................................................................................... 47
3
Executive Summary The purpose of this 2015 update to the Wisconsin Mental Health and Substance Abuse Needs Assessment report published in 2014 is to present and analyze more recent data to determine if any significant changes occurred in key data that could affect the selection of priorities identified in the federal fiscal year (FFY) 2016 mental health and substance abuse block grant application. The priorities in the previous mental health and substance abuse block grant applications included:
• Tuberculosis • Intravenous drug use • Culturally appropriate and comprehensive services for special populations • Youth access to tobacco products • Pregnant women and mothers with dependent children • Substance abuse services in the criminal and juvenile justice systems • Adult binge drinking • Prescription drug abuse • Children's mental health • Improve mental health and substance abuse service outcomes and quality of care • Mental health services in the criminal justice system • Suicide prevention
Mental Health Summary The prevalence of mental health conditions in specific demographic groups in Wisconsin, estimated with national rates, indicates patterns in 2013 similar to those in the previous report when females and middle-aged individuals were most likely to have mental health needs. This update focuses on the county mental health service system only in regards to consumers’ ability to access services. The original report documented access across both the private and public sectors. The number of youth accessing the county mental health system has been steadily declining; only 4.7 percent of youth with any type of mental illness access county services, compared to 8.9 percent of adults. However, the last report also documented that many youth access Medicaid services through non-county Medicaid providers to meet their needs. The county system also plays a major role in crisis care as 43 percent of all episodes of care included only a single crisis intervention, an emergency room visit, or an admission to an inpatient hospital. County mental health services are also used as a proxy for the system’s workforce capacity. While the array of community mental health services is still expanding, the relative amount of community, crisis, and inpatient services varies widely across counties indicating where gaps in service array and workforce capacity may exist. Efforts to broaden the use of certified peer specialists to expand the county’s capacity for services have resulted in an increase from 193 to 333 peer specialists between 2012 and April 2015, as well as an expansion to several new counties who did not use peer specialists in 2012. An area of concern is the increase in Wisconsin’s suicide rate in 2013 from 12.6 to 14.4 per 100,000 people. Middle-aged (45-64 years old) males continue to have the highest suicide rates.
4
The 30-day inpatient hospital readmission rates for consumers in the county mental health system have been added to this update and indicate a decline in Wisconsin over the last five years from 9.7 percent to 7.7 percent, although county rates vary indicating some areas of the state may still have a need to prevent recurring expensive acute care. Mental health consumer satisfaction levels are updated through 2013 indicating results similar to the last report—Wisconsin’s consumers are generally satisfied with their access and quality of care, but their satisfaction with the outcomes of their care remains below the national average.
Substance Abuse Summary Adult misuse of alcoholic beverages across Wisconsin has not changed and remained above the national average. However, in 2013, Wisconsin youth who reported consuming five or more drinks during an occasion of drinking in the past 30 days dropped below the national average for the first time in 10 years. The rate of youth who reported having their first full drink of alcohol before age 13 was down and remained below the national average. Alcohol-related traffic crashes and fatalities continued to decline. Unhealthy and life-threatening use of alcohol and other drugs among adults resulting in death continued to rise in Wisconsin. Largely preventable, there were 1,202 alcohol and 1,054 illicit or habit-forming drug deaths in 2013. The average age for these substance-related deaths was mid-50s. Opiate (heroin and narcotic pain medications) treatment admissions and deaths continued to rise and are second only to alcohol. Opiate-related deaths have risen nearly 40 percent in the past five years to 667 statewide. At the same time, Wisconsin lagged behind the national average in the use of medication adjuncts in the treatment of heroin and narcotic addiction. Illicit drug use among youth remained below the national average. Safety-net, county-authorized or subsidized, publicly supported substance use services continued to decline at a rate of about 3 percent each year. In 2013, 30 county agencies identified services that were not available due to lack of sufficient funds such as residential or housing services, narcotic treatment, intensive outpatient counseling, case management, wrap-around services, and transportation. Counties with the highest rate of uninsured persons and having a slightly higher need for publicly supported safety-net services included Clark, Jefferson, Milwaukee, Vilas, and Waupaca. Wisconsin continued to provide less residential and intensive outpatient treatment services than the national average. Successful treatment completion rates for African Americans, American Indians, females, adolescents, and heroin/opiate-abusing clients were below the state average of 52 percent. A first-ever Wisconsin statewide client satisfaction with publicly supported substance abuse services survey was completed in the fall of 2014. Seventy-four percent (74 percent) of former clients responding to the survey reported service satisfaction. This compares favorably with national benchmark surveys. While the federal Bureau of Labor Statistics projects a 33 percent increased need for substance abuse professionals by the year 2016, Wisconsin recently gained only 1 percent in its substance abuse professional workforce.
5
List of Tables Table 1: Prevalence Rates of Mental Illness, United States and Wisconsin, 2012-2013 .................. 8 Table 2: New Cases of Tuberculosis Per 100,000 Population,
Wisconsin and United States, 2013 .................................................................................. 15 Table 3: Utilization of County Mental Health Services, by County/Region, 2013 .............................. 17 Table 4: Substance Abuse Prevalence in United States, 2009-2010,
and Substance Abuse Clients Served in Wisconsin, 2013 ................................................. 22 Table 5: Count of Consumers Receiving Mental Health Services,
by Service Category, Wisconsin, 2012 and 2013 ............................................................... 23 Table 6: Count of Consumers Receiving Mental Health Services,
by Service Category and County/Region, Wisconsin, 2012 ............................................... 24 Table 7: Count of Consumers Receiving Mental Health Services,
by Service Category and County/Region, Wisconsin, 2013 ............................................... 25 Table 8: Mental Health Service Categories, with Grouped SPC Service Codes .................................. 26 Table 9: Count of Individuals on CSP Waitlists, by County/Region, 2013 .......................................... 27 Table 10: Count of Consumers Receiving Substance Abuse Services,
by Service Category, Wisconsin, 2012 and 2013 ............................................................... 30 Table 11: Count of Consumers Receiving Substance Abuse Services,
by Service Category and County/Region, Wisconsin, 2012 ............................................... 31 Table 12: Count of Consumers Receiving Substance Abuse Services,
by Service Category and County/Region, Wisconsin, 2013 ............................................... 32 Table 13: Substance Abuse Service Categories, with Grouped SPC Service Codes .............................. 33 Table 14: Distribution of Substance Abuse Services Used,
Wisconsin 2013 and United States 2012 ........................................................................... 34 Table 15: Percent of Client Admissions that Received Medication-Assisted Treatment,
Wisconsin 2013 and United States 2012 ........................................................................... 35 Table 16: CSP Implementation of ACT, by Implementation Step,
Wisconsin, 2011-2013 ....................................................................................................... 40 Table 17: CCS Implementation of Various EBPs, by Implementation Step,
Wisconsin, 2011-2013 ....................................................................................................... 42 Table 18: Positive Perceptions of Mental Health Services, by Domain and Year,
Adults in Wisconsin, 2003-2013 ........................................................................................ 44 Table 19: Positive Perceptions of Mental Health Services, by Domain and Year,
Caregivers of Youth in Wisconsin, 2003-2013 ................................................................... 45 Table 20: Mental Health Inpatient 30-Day Readmission Rates,
by County/Region, SFY 2009-2013 .................................................................................... 58
6
List of Figures Figure 1: Adult Mental Health Prevalence Rates, by Age Group, 2012-2013 .................................... 9 Figure 2: Adult Mental Health Prevalence Rates, by Gender, 2012-2013 ......................................... 9 Figure 3: Adult Mental Health Prevalence Rates, by Race, 2012-2013 ............................................. 10 Figure 4: Heavy Occasion (Binge) Alcohol Use, Adults,
Wisconsin and United States, 1994-2013 ........................................................................ 11 Figure 5: Opiate Use in Past Year, Adults, Wisconsin and United States, 2004-2013 ....................... 12 Figure 6: Number of Persons Admitted to Drug Abuse Treatment, For Selected Illicit Drugs,
Wisconsin, 2005-2013 ...................................................................................................... 12 Figure 7: Marijuana Use in Past 30 Days, Youth, Wisconsin and United States, 1993-2013 ............. 13 Figure 8: Heavy Occasion (Binge) Alcohol Use, Youth,
Wisconsin and United States, 1993-2013 ........................................................................ 14 Figure 9: Number of Persons Receiving County Mental Health Services,
Adults and Youth, Wisconsin, 2000-2013 ........................................................................ 16 Figure 10: Percent of Persons Citing Each Reason for Not Receiving Mental Health Treatment,
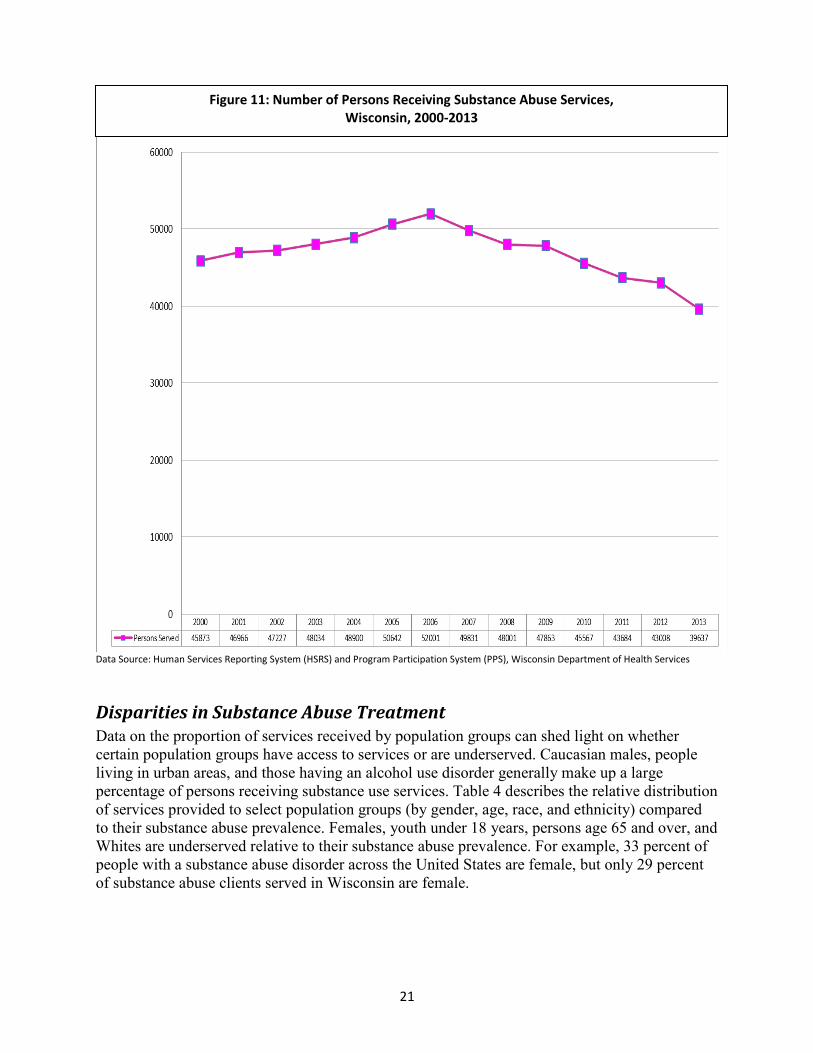
United States, 2013 .......................................................................................................... 20 Figure 11: Number of Persons Receiving Substance Abuse Services,
Adults and Youth, Wisconsin, 2000-2013 ........................................................................ 21 Figure 12: Wisconsin Certified Peer Specialists, by County, as of April 2015 ...................................... 29 Figure 13: Number of Detox Persons and Admissions, Wisconsin, 2005-2013 ................................... 34 Figure 14: Substance Abuse Treatment Workforce in Wisconsin, 2007-2013 .................................... 35 Figure 15: Percent of CSP Programs Offering Various EBPs, Wisconsin, 2011-2013 ........................... 38 Figure 16: Percent of CSP Consumers Served with EBPs, Wisconsin, 2011-2013 ................................ 39 Figure 17: Percent of CCS Programs Offering Various EBPs, Wisconsin, 2011-2013 ........................... 40 Figure 18: Percent of CCS Consumers Served with EBPs, Wisconsin, 2011-2013 ................................ 41 Figure 19: Positive Perceptions of Mental Health Services, by Domain and Year,
Adults in Wisconsin, 2003-2013 ....................................................................................... 43 Figure 20: Positive Perceptions of Mental Health Services, by Domain and Year,
Caregivers of Youth in Wisconsin, 2003-2013 ................................................................. 45 Figure 21: Substance Abuse Service Completion Among Survey Respondents and
All Service Recipients, Wisconsin, 2014 ........................................................................... 46 Figure 22: Count of Respondents, by How Services Could be Made Better,
Wisconsin, 2014 ............................................................................................................... 47 Figure 23: Substance Abuse Outpatient Treatment Completion Rates,
Wisconsin and U.S. Average, 1993-2013 ......................................................................... 48 Figure 24: Substance Abuse Outpatient Treatment Completion Rates,
Among Various Population Groups, Wisconsin, 2013 ..................................................... 49 Figure 25: High School Students Reporting Driving After Drinking Alcohol,
In the Past 30 Days, Wisconsin and United States, 1993-2013 ....................................... 50 Figure 26: First Use of Alcohol Prior to Age 13, Wisconsin and United States, 1993-2013 ................. 51 Figure 27: Number of Alcohol-Related Hospitalizations, Wisconsin, 1990-2012 ................................ 52 Figure 28: Alcohol and Mood-Altering Drug Deaths, Wisconsin, 1970-2013 ...................................... 53 Figure 29: Number of Mood-Altering Drug Deaths, by Type of Drug, Wisconsin, 1982-2013 ............ 54 Figure 30: Alcohol-Related Traffic Crashes and Fatalities, Wisconsin, 1983-2013 .............................. 55 Figure 31: Wisconsin and U.S. Suicide Rates 2000-2013 ..................................................................... 56 Figure 32: Suicide Rates for Wisconsin Demographic Groups, 2013 ................................................... 57
7
Introduction Two federal block grants bring $7.5 million in mental health and $28 million in substance abuse services funds to Wisconsin each year. Federal guidance for the FFY 2016 mental health and substance abuse block grant application(s) required states to complete a data-driven behavioral health assessment and plan, hereafter referred to as the needs assessment. The intent of the needs assessment was:
• To assess the strengths and needs of the service system’s response to specific populations.
• To identify the unmet service needs and gaps within the service system. • To develop priorities, objectives, and strategies to address the identified needs and gaps.
Through the block grants, the federal government desires to achieve “good and modern” state mental health and substance abuse service systems. A good and modern system is accessible, accountable, organized, controls costs, improves quality, equitable, effective, prevents conditions, reduces cultural disparities, promotes individualized service plans, empowers and involves consumers, uses available technology, encourages natural support systems, and establishes links with health care. Many of these attributes can be analyzed by this needs assessment. With the many healthcare reforms in the Federal Patient Protection and Affordable Care Act, federal guidance requests that the needs assessment address issues related to the changing healthcare environment and the impact on uninsured persons.
Needs Assessment Update This report is an update of the Wisconsin Mental Health and Substance Abuse Needs Assessment completed and published in February 2014. The 2014 report contained data through 2010 on most indicators presented. For this 2015 update, selected needs assessment data and analyses are refreshed through calendar year 2013 (most recent year available) to inform planners and policy makers in their determination of mental health and substance abuse priorities and programs. Data updates are organized in the following sections:
I. Prevalence II. Access to Services
III. Service and Workforce Capacity IV. Quality and Outcomes The updated data and information come from a variety of secondary sources including the U.S. Census Bureau, National Survey on Drug Use and Health, Centers for Disease Control and Prevention, Wisconsin Program Participation System, Wisconsin Crime Information Bureau, Wisconsin Department of Transportation, and many others. The specific sources are noted with each figure, chart, or table presented.
8
I. Prevalence
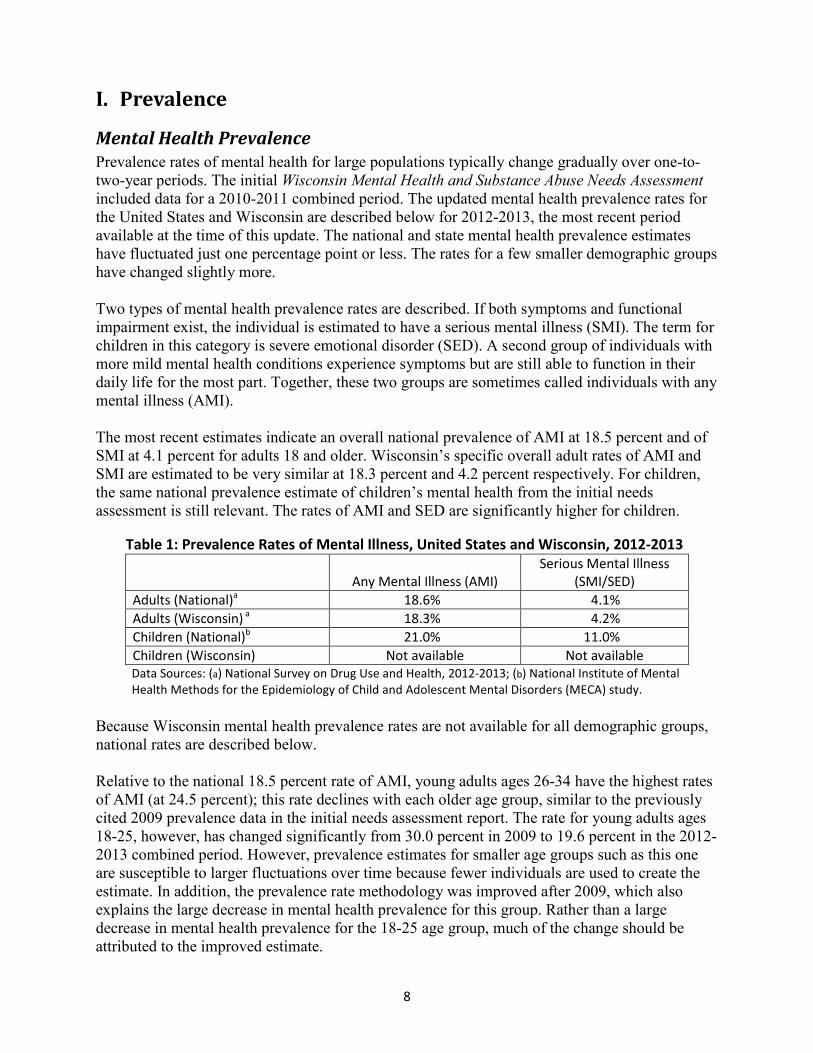
Mental Health Prevalence Prevalence rates of mental health for large populations typically change gradually over one-to-two-year periods. The initial Wisconsin Mental Health and Substance Abuse Needs Assessment included data for a 2010-2011 combined period. The updated mental health prevalence rates for the United States and Wisconsin are described below for 2012-2013, the most recent period available at the time of this update. The national and state mental health prevalence estimates have fluctuated just one percentage point or less. The rates for a few smaller demographic groups have changed slightly more. Two types of mental health prevalence rates are described. If both symptoms and functional impairment exist, the individual is estimated to have a serious mental illness (SMI). The term for children in this category is severe emotional disorder (SED). A second group of individuals with more mild mental health conditions experience symptoms but are still able to function in their daily life for the most part. Together, these two groups are sometimes called individuals with any mental illness (AMI). The most recent estimates indicate an overall national prevalence of AMI at 18.5 percent and of SMI at 4.1 percent for adults 18 and older. Wisconsin’s specific overall adult rates of AMI and SMI are estimated to be very similar at 18.3 percent and 4.2 percent respectively. For children, the same national prevalence estimate of children’s mental health from the initial needs assessment is still relevant. The rates of AMI and SED are significantly higher for children.
Table 1: Prevalence Rates of Mental Illness, United States and Wisconsin, 2012-2013
Any Mental Illness (AMI) Serious Mental Illness
(SMI/SED) Adults (National)a 18.6% 4.1% Adults (Wisconsin) a 18.3% 4.2% Children (National)b 21.0% 11.0% Children (Wisconsin) Not available Not available Data Sources: (a) National Survey on Drug Use and Health, 2012-2013; (b) National Institute of Mental Health Methods for the Epidemiology of Child and Adolescent Mental Disorders (MECA) study.
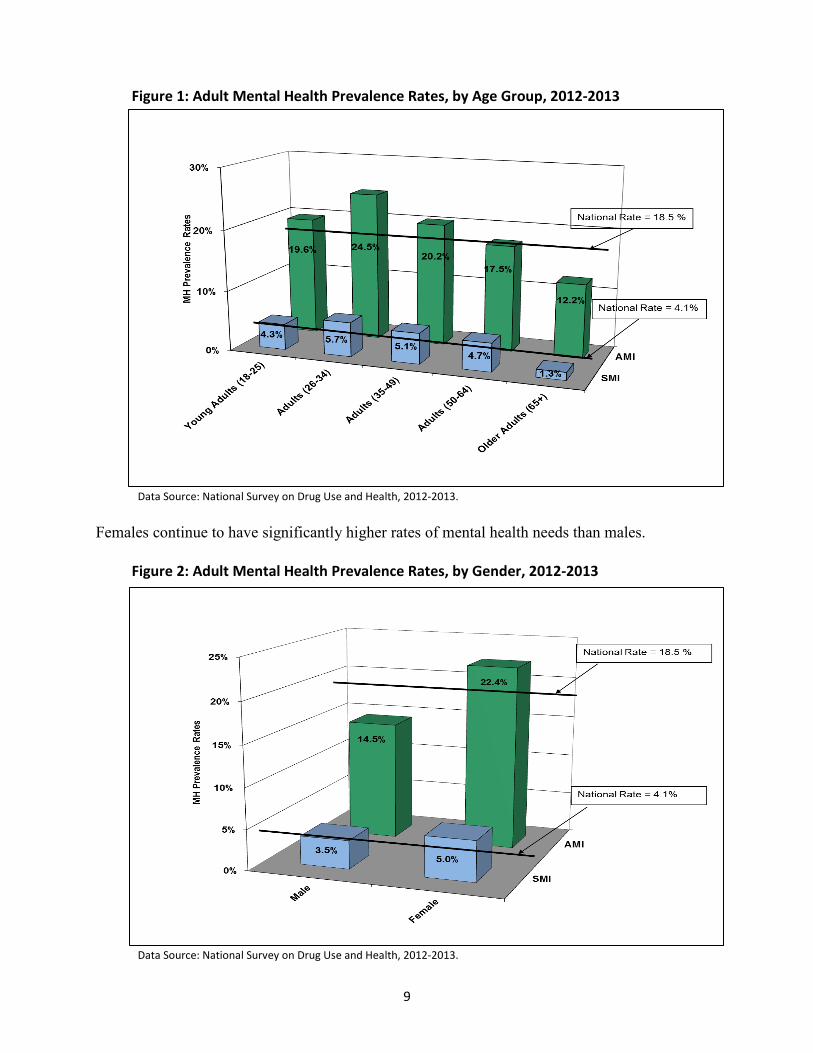
Because Wisconsin mental health prevalence rates are not available for all demographic groups, national rates are described below. Relative to the national 18.5 percent rate of AMI, young adults ages 26-34 have the highest rates of AMI (at 24.5 percent); this rate declines with each older age group, similar to the previously cited 2009 prevalence data in the initial needs assessment report. The rate for young adults ages 18-25, however, has changed significantly from 30.0 percent in 2009 to 19.6 percent in the 2012-2013 combined period. However, prevalence estimates for smaller age groups such as this one are susceptible to larger fluctuations over time because fewer individuals are used to create the estimate. In addition, the prevalence rate methodology was improved after 2009, which also explains the large decrease in mental health prevalence for this group. Rather than a large decrease in mental health prevalence for the 18-25 age group, much of the change should be attributed to the improved estimate.
9
Figure 1: Adult Mental Health Prevalence Rates, by Age Group, 2012-2013
Data Source: National Survey on Drug Use and Health, 2012-2013. Females continue to have significantly higher rates of mental health needs than males.
Figure 2: Adult Mental Health Prevalence Rates, by Gender, 2012-2013
Data Source: National Survey on Drug Use and Health, 2012-2013.
10
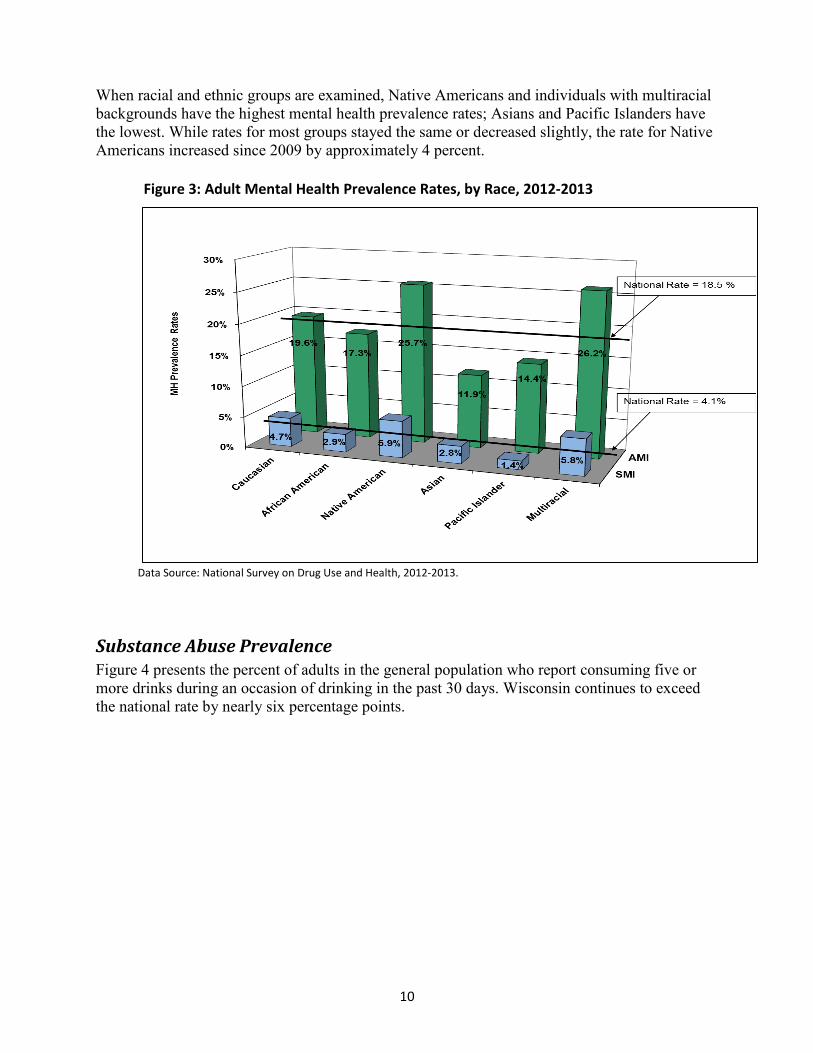
When racial and ethnic groups are examined, Native Americans and individuals with multiracial backgrounds have the highest mental health prevalence rates; Asians and Pacific Islanders have the lowest. While rates for most groups stayed the same or decreased slightly, the rate for Native Americans increased since 2009 by approximately 4 percent.
Figure 3: Adult Mental Health Prevalence Rates, by Race, 2012-2013
Data Source: National Survey on Drug Use and Health, 2012-2013.
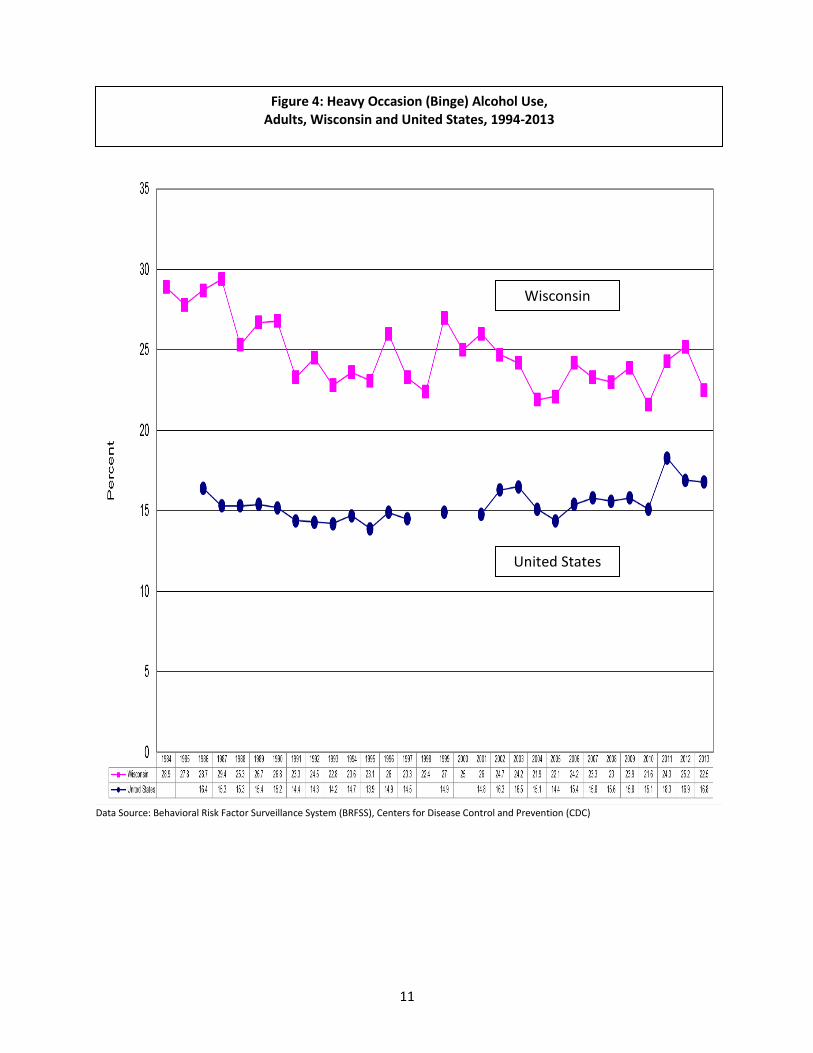
Substance Abuse Prevalence Figure 4 presents the percent of adults in the general population who report consuming five or more drinks during an occasion of drinking in the past 30 days. Wisconsin continues to exceed the national rate by nearly six percentage points.
11
Data Source: Behavioral Risk Factor Surveillance System (BRFSS), Centers for Disease Control and Prevention (CDC)
United States
Wisconsin
Figure 4: Heavy Occasion (Binge) Alcohol Use, Adults, Wisconsin and United States, 1994-2013
12
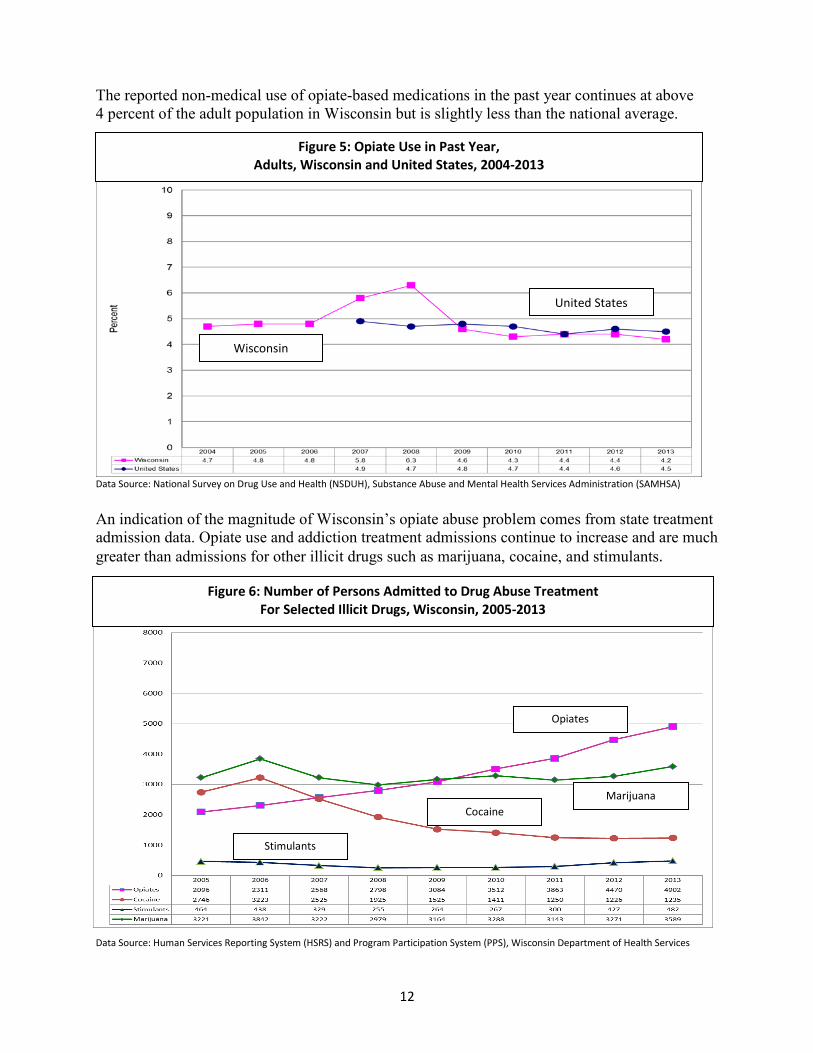
The reported non-medical use of opiate-based medications in the past year continues at above 4 percent of the adult population in Wisconsin but is slightly less than the national average.
Data Source: National Survey on Drug Use and Health (NSDUH), Substance Abuse and Mental Health Services Administration (SAMHSA)
An indication of the magnitude of Wisconsin’s opiate abuse problem comes from state treatment admission data. Opiate use and addiction treatment admissions continue to increase and are much greater than admissions for other illicit drugs such as marijuana, cocaine, and stimulants.
Data Source: Human Services Reporting System (HSRS) and Program Participation System (PPS), Wisconsin Department of Health Services
Figure 5: Opiate Use in Past Year, Adults, Wisconsin and United States, 2004-2013
United States
Wisconsin
Figure 6: Number of Persons Admitted to Drug Abuse Treatment For Selected Illicit Drugs, Wisconsin, 2005-2013
Marijuana
Opiates
Cocaine
Stimulants
13
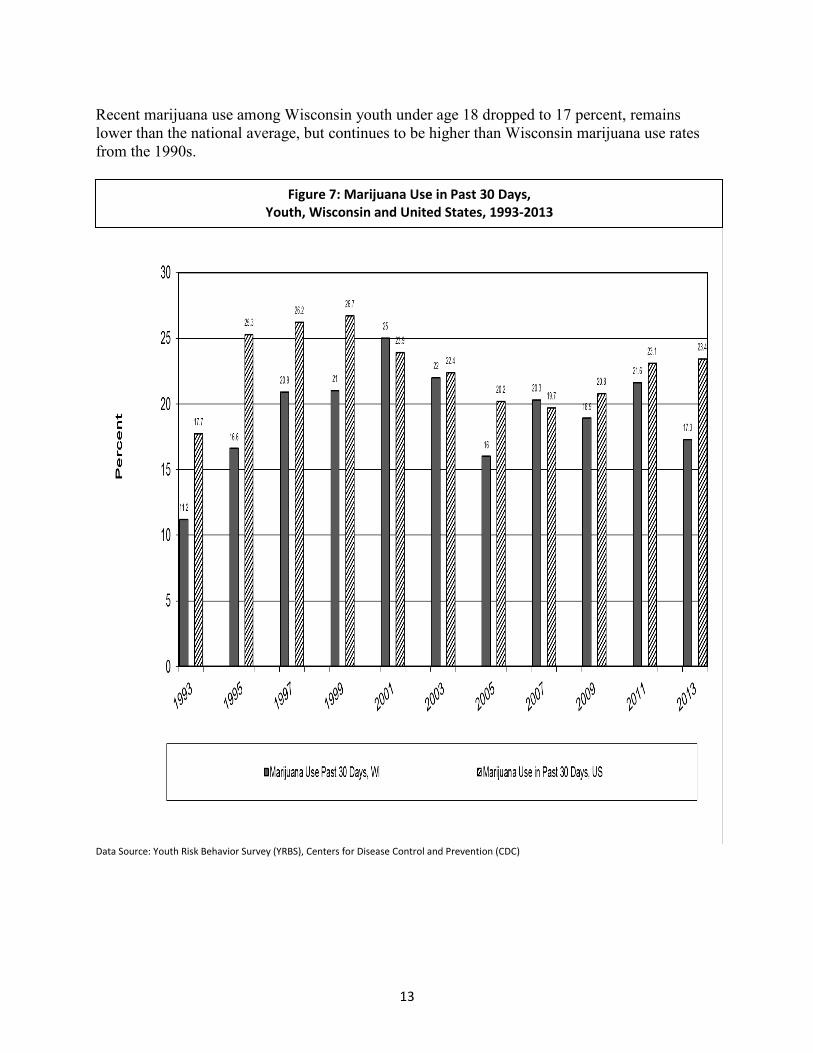
Recent marijuana use among Wisconsin youth under age 18 dropped to 17 percent, remains lower than the national average, but continues to be higher than Wisconsin marijuana use rates from the 1990s.
Data Source: Youth Risk Behavior Survey (YRBS), Centers for Disease Control and Prevention (CDC)
Figure 7: Marijuana Use in Past 30 Days, Youth, Wisconsin and United States, 1993-2013
14
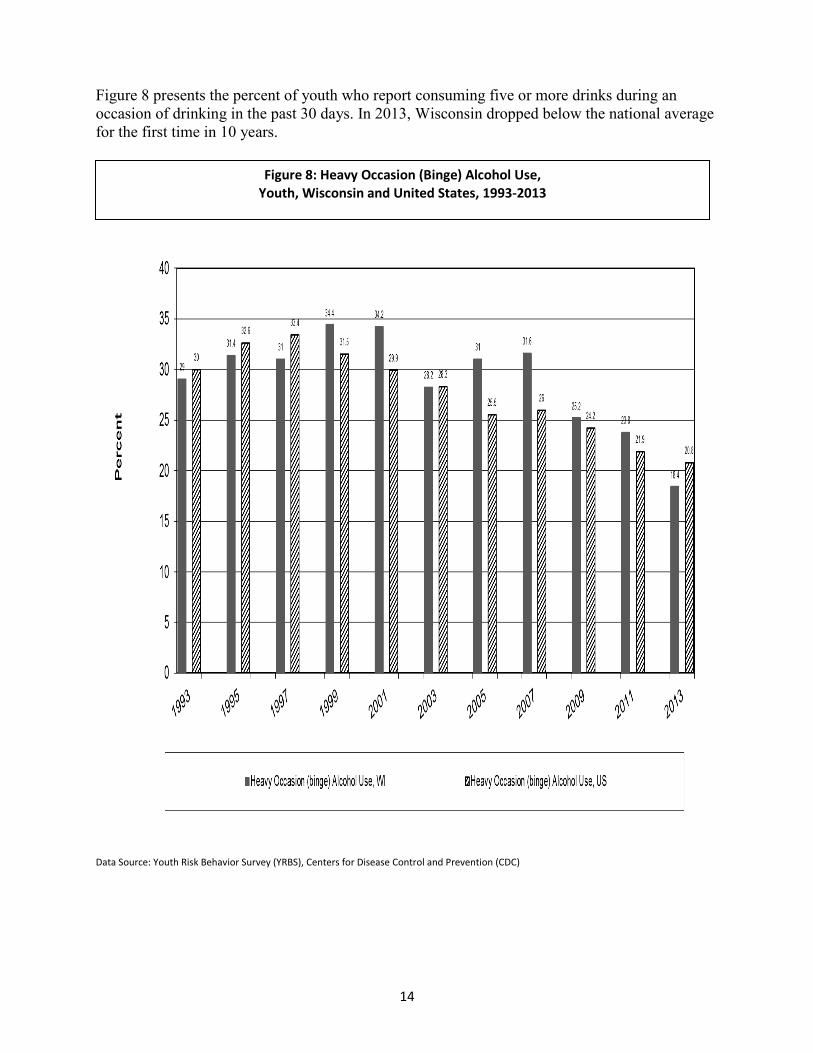
Figure 8 presents the percent of youth who report consuming five or more drinks during an occasion of drinking in the past 30 days. In 2013, Wisconsin dropped below the national average for the first time in 10 years.
Data Source: Youth Risk Behavior Survey (YRBS), Centers for Disease Control and Prevention (CDC)
Figure 8: Heavy Occasion (Binge) Alcohol Use, Youth, Wisconsin and United States, 1993-2013
15
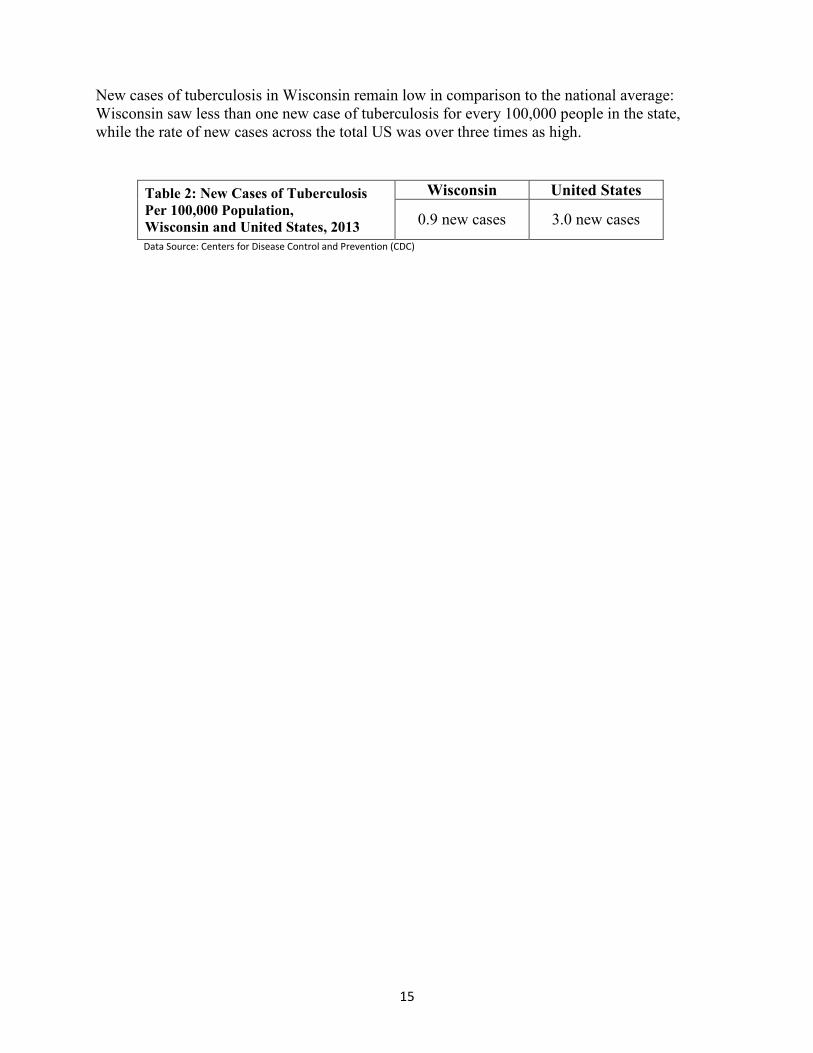
New cases of tuberculosis in Wisconsin remain low in comparison to the national average: Wisconsin saw less than one new case of tuberculosis for every 100,000 people in the state, while the rate of new cases across the total US was over three times as high.
Table 2: New Cases of Tuberculosis Per 100,000 Population, Wisconsin and United States, 2013
Wisconsin United States
0.9 new cases 3.0 new cases Data Source: Centers for Disease Control and Prevention (CDC)
16
II. Access to Services
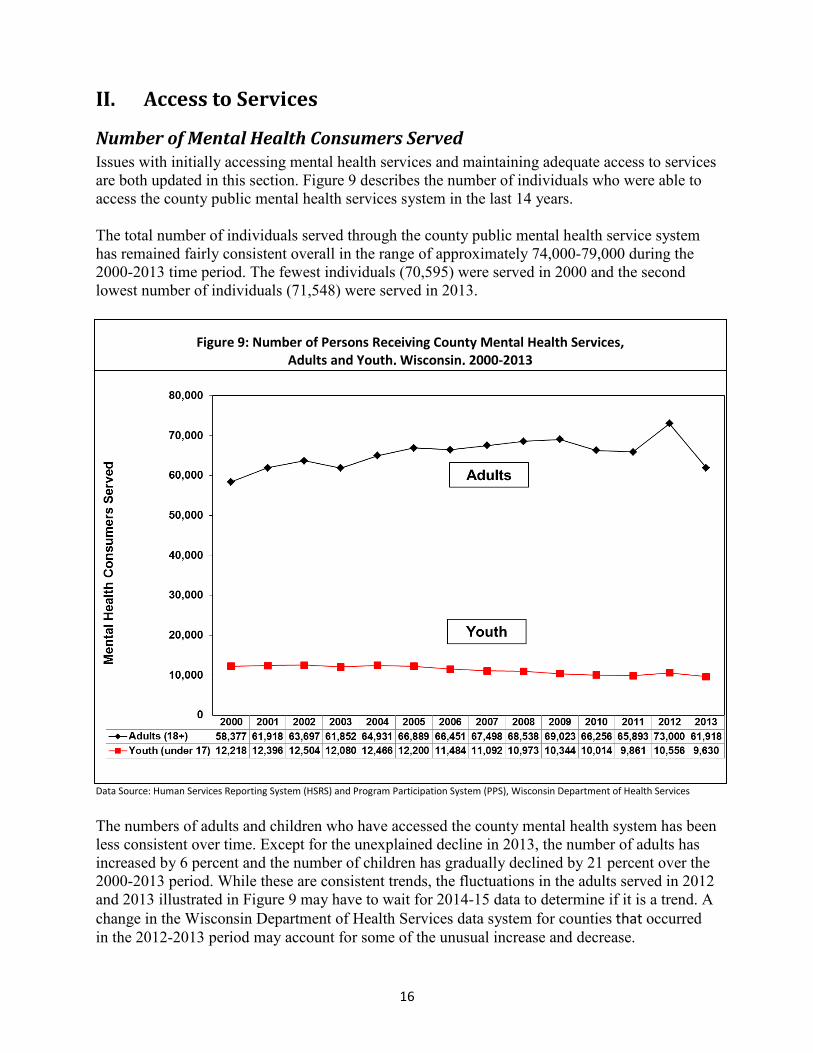
Number of Mental Health Consumers Served Issues with initially accessing mental health services and maintaining adequate access to services are both updated in this section. Figure 9 describes the number of individuals who were able to access the county public mental health services system in the last 14 years. The total number of individuals served through the county public mental health service system has remained fairly consistent overall in the range of approximately 74,000-79,000 during the 2000-2013 time period. The fewest individuals (70,595) were served in 2000 and the second lowest number of individuals (71,548) were served in 2013.
Data Source: Human Services Reporting System (HSRS) and Program Participation System (PPS), Wisconsin Department of Health Services The numbers of adults and children who have accessed the county mental health system has been less consistent over time. Except for the unexplained decline in 2013, the number of adults has increased by 6 percent and the number of children has gradually declined by 21 percent over the 2000-2013 period. While these are consistent trends, the fluctuations in the adults served in 2012 and 2013 illustrated in Figure 9 may have to wait for 2014-15 data to determine if it is a trend. A change in the Wisconsin Department of Health Services data system for counties that occurred in the 2012-2013 period may account for some of the unusual increase and decrease.
Figure 9: Number of Persons Receiving County Mental Health Services, Adults and Youth, Wisconsin, 2000-2013
17
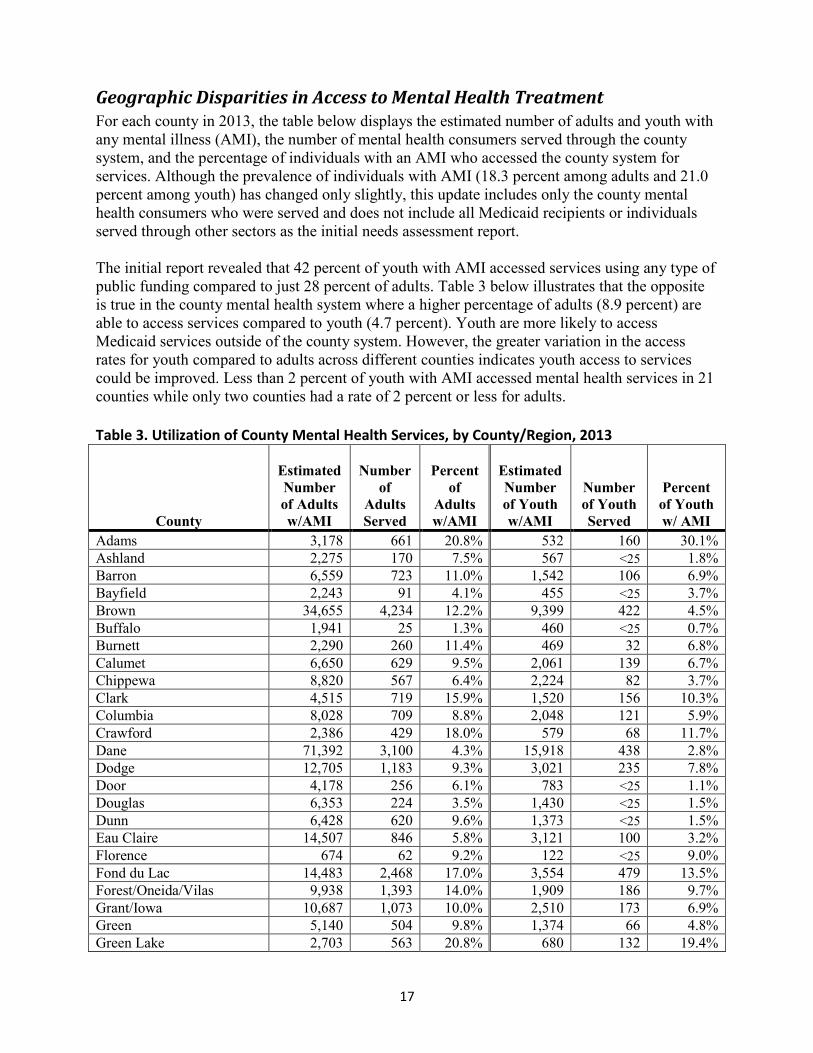
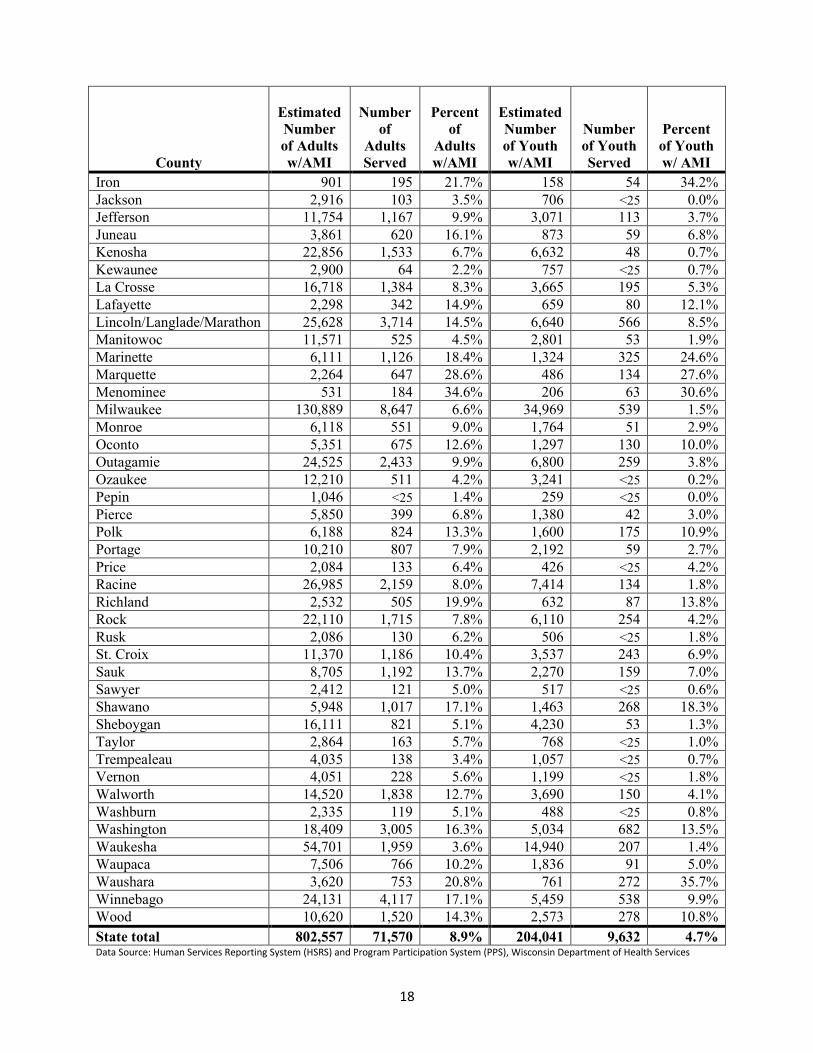
Geographic Disparities in Access to Mental Health Treatment For each county in 2013, the table below displays the estimated number of adults and youth with any mental illness (AMI), the number of mental health consumers served through the county system, and the percentage of individuals with an AMI who accessed the county system for services. Although the prevalence of individuals with AMI (18.3 percent among adults and 21.0 percent among youth) has changed only slightly, this update includes only the county mental health consumers who were served and does not include all Medicaid recipients or individuals served through other sectors as the initial needs assessment report. The initial report revealed that 42 percent of youth with AMI accessed services using any type of public funding compared to just 28 percent of adults. Table 3 below illustrates that the opposite is true in the county mental health system where a higher percentage of adults (8.9 percent) are able to access services compared to youth (4.7 percent). Youth are more likely to access Medicaid services outside of the county system. However, the greater variation in the access rates for youth compared to adults across different counties indicates youth access to services could be improved. Less than 2 percent of youth with AMI accessed mental health services in 21 counties while only two counties had a rate of 2 percent or less for adults. Table 3. Utilization of County Mental Health Services, by County/Region, 2013
County
Estimated Number of Adults w/AMI
Number of
Adults Served
Percent of
Adults w/AMI
Estimated Number of Youth w/AMI
Number of Youth Served
Percent of Youth w/ AMI
Adams 3,178 661 20.8% 532 160 30.1% Ashland 2,275 170 7.5% 567 <25 1.8% Barron 6,559 723 11.0% 1,542 106 6.9% Bayfield 2,243 91 4.1% 455 <25 3.7% Brown 34,655 4,234 12.2% 9,399 422 4.5% Buffalo 1,941 25 1.3% 460 <25 0.7% Burnett 2,290 260 11.4% 469 32 6.8% Calumet 6,650 629 9.5% 2,061 139 6.7% Chippewa 8,820 567 6.4% 2,224 82 3.7% Clark 4,515 719 15.9% 1,520 156 10.3% Columbia 8,028 709 8.8% 2,048 121 5.9% Crawford 2,386 429 18.0% 579 68 11.7% Dane 71,392 3,100 4.3% 15,918 438 2.8% Dodge 12,705 1,183 9.3% 3,021 235 7.8% Door 4,178 256 6.1% 783 <25 1.1% Douglas 6,353 224 3.5% 1,430 <25 1.5% Dunn 6,428 620 9.6% 1,373 <25 1.5% Eau Claire 14,507 846 5.8% 3,121 100 3.2% Florence 674 62 9.2% 122 <25 9.0% Fond du Lac 14,483 2,468 17.0% 3,554 479 13.5% Forest/Oneida/Vilas 9,938 1,393 14.0% 1,909 186 9.7% Grant/Iowa 10,687 1,073 10.0% 2,510 173 6.9% Green 5,140 504 9.8% 1,374 66 4.8% Green Lake 2,703 563 20.8% 680 132 19.4%
18
County
Estimated Number of Adults w/AMI
Number of
Adults Served
Percent of
Adults w/AMI
Estimated Number of Youth w/AMI
Number of Youth Served
Percent of Youth w/ AMI
Iron 901 195 21.7% 158 54 34.2% Jackson 2,916 103 3.5% 706 <25 0.0% Jefferson 11,754 1,167 9.9% 3,071 113 3.7% Juneau 3,861 620 16.1% 873 59 6.8% Kenosha 22,856 1,533 6.7% 6,632 48 0.7% Kewaunee 2,900 64 2.2% 757 <25 0.7% La Crosse 16,718 1,384 8.3% 3,665 195 5.3% Lafayette 2,298 342 14.9% 659 80 12.1% Lincoln/Langlade/Marathon 25,628 3,714 14.5% 6,640 566 8.5% Manitowoc 11,571 525 4.5% 2,801 53 1.9% Marinette 6,111 1,126 18.4% 1,324 325 24.6% Marquette 2,264 647 28.6% 486 134 27.6% Menominee 531 184 34.6% 206 63 30.6% Milwaukee 130,889 8,647 6.6% 34,969 539 1.5% Monroe 6,118 551 9.0% 1,764 51 2.9% Oconto 5,351 675 12.6% 1,297 130 10.0% Outagamie 24,525 2,433 9.9% 6,800 259 3.8% Ozaukee 12,210 511 4.2% 3,241 <25 0.2% Pepin 1,046 <25 1.4% 259 <25 0.0% Pierce 5,850 399 6.8% 1,380 42 3.0% Polk 6,188 824 13.3% 1,600 175 10.9% Portage 10,210 807 7.9% 2,192 59 2.7% Price 2,084 133 6.4% 426 <25 4.2% Racine 26,985 2,159 8.0% 7,414 134 1.8% Richland 2,532 505 19.9% 632 87 13.8% Rock 22,110 1,715 7.8% 6,110 254 4.2% Rusk 2,086 130 6.2% 506 <25 1.8% St. Croix 11,370 1,186 10.4% 3,537 243 6.9% Sauk 8,705 1,192 13.7% 2,270 159 7.0% Sawyer 2,412 121 5.0% 517 <25 0.6% Shawano 5,948 1,017 17.1% 1,463 268 18.3% Sheboygan 16,111 821 5.1% 4,230 53 1.3% Taylor 2,864 163 5.7% 768 <25 1.0% Trempealeau 4,035 138 3.4% 1,057 <25 0.7% Vernon 4,051 228 5.6% 1,199 <25 1.8% Walworth 14,520 1,838 12.7% 3,690 150 4.1% Washburn 2,335 119 5.1% 488 <25 0.8% Washington 18,409 3,005 16.3% 5,034 682 13.5% Waukesha 54,701 1,959 3.6% 14,940 207 1.4% Waupaca 7,506 766 10.2% 1,836 91 5.0% Waushara 3,620 753 20.8% 761 272 35.7% Winnebago 24,131 4,117 17.1% 5,459 538 9.9% Wood 10,620 1,520 14.3% 2,573 278 10.8% State total 802,557 71,570 8.9% 204,041 9,632 4.7% Data Source: Human Services Reporting System (HSRS) and Program Participation System (PPS), Wisconsin Department of Health Services
19
Access to Crisis Services through the County System While Wisconsin’s county mental health system serves as an access point for many outpatient and psychosocial rehabilitation services, individuals primarily access the system in a crisis. Human Services Reporting System 2012 data reported by counties to the Wisconsin Department of Health Services revealed that 50 percent of all episodes of care began with a crisis intervention, an emergency room visit, or admission to an inpatient hospital. In addition:
• 43 percent of all episodes of care included only a single crisis intervention, an emergency room visit, or an admission to an inpatient hospital;
• 75 percent of consumers who began their county episode of care with a crisis intervention service received three or fewer total services.
While a large percentage of individuals are accessing the county system for crisis services, many of them are not immediately accessing other community-based services after discharge from crisis services.
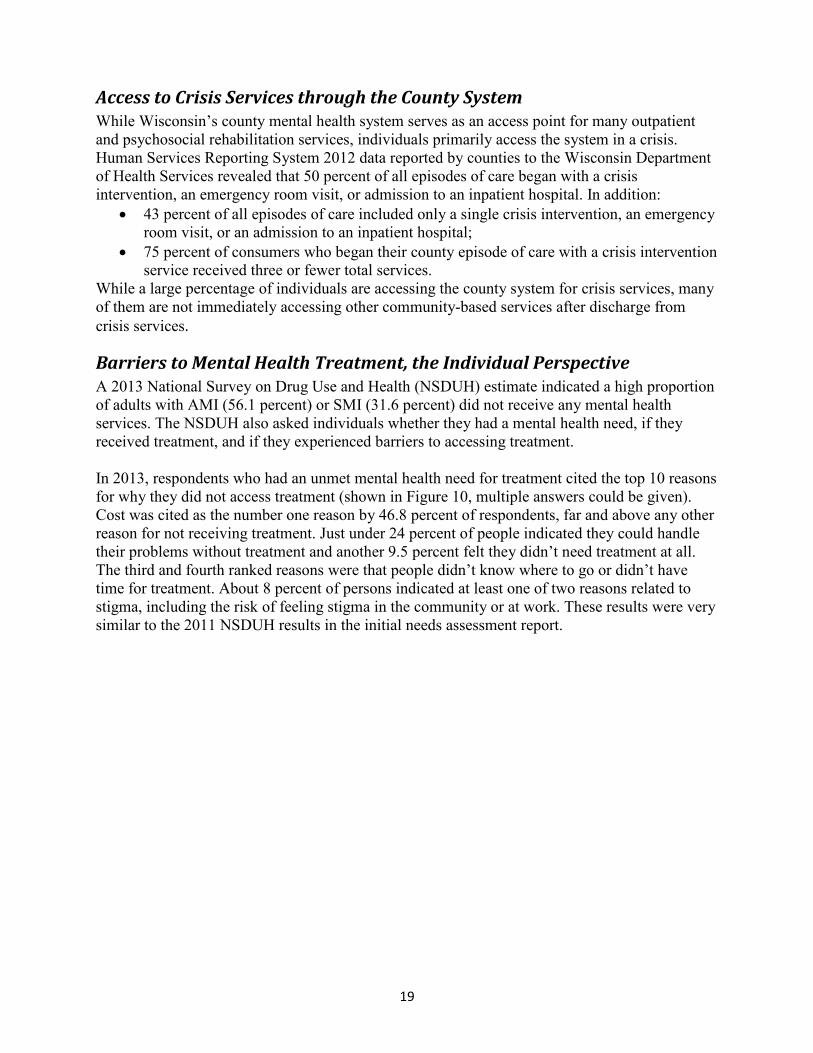
Barriers to Mental Health Treatment, the Individual Perspective A 2013 National Survey on Drug Use and Health (NSDUH) estimate indicated a high proportion of adults with AMI (56.1 percent) or SMI (31.6 percent) did not receive any mental health services. The NSDUH also asked individuals whether they had a mental health need, if they received treatment, and if they experienced barriers to accessing treatment. In 2013, respondents who had an unmet mental health need for treatment cited the top 10 reasons for why they did not access treatment (shown in Figure 10, multiple answers could be given). Cost was cited as the number one reason by 46.8 percent of respondents, far and above any other reason for not receiving treatment. Just under 24 percent of people indicated they could handle their problems without treatment and another 9.5 percent felt they didn’t need treatment at all. The third and fourth ranked reasons were that people didn’t know where to go or didn’t have time for treatment. About 8 percent of persons indicated at least one of two reasons related to stigma, including the risk of feeling stigma in the community or at work. These results were very similar to the 2011 NSDUH results in the initial needs assessment report.
20
Data Source: National Survey on Drug Use and Health, 2012-2013.
Substance Abuse Services and Gaps Persons receiving county authorized or subsidized substance use services continue to decline at a rate of about 3 percent each year. National survey data, Wisconsin sample, show that the prevalence of substance abuse is declining at a rate of about one-half of a percentage point each year. This coupled with rising health insurance coverage, tighter local government budgets, and general service access issues are contributing to the decline in persons receiving publically supported substance use services. However, as was presented in the 2014 needs assessment report referenced previously, just 23 percent of persons needing substance use services received services.
Figure 10: Percent of Persons Citing Each Reason for Not Receiving Mental Health Treatment, United States, 2013
21
Data Source: Human Services Reporting System (HSRS) and Program Participation System (PPS), Wisconsin Department of Health Services
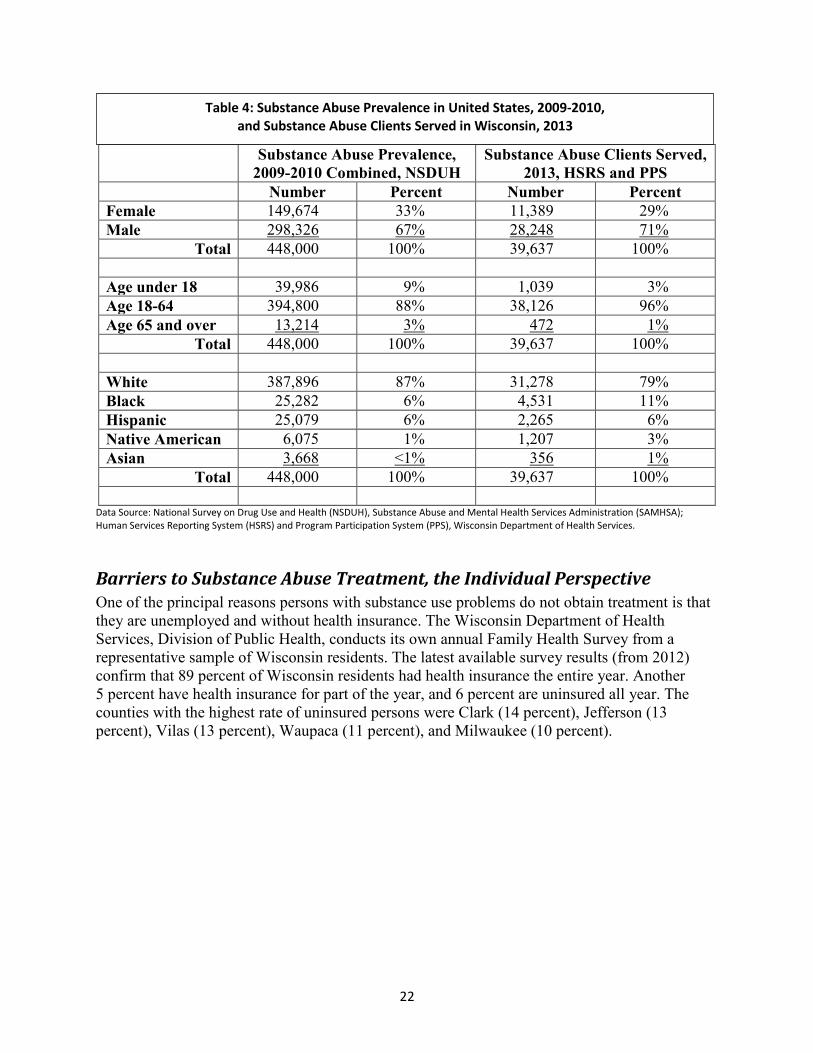
Disparities in Substance Abuse Treatment Data on the proportion of services received by population groups can shed light on whether certain population groups have access to services or are underserved. Caucasian males, people living in urban areas, and those having an alcohol use disorder generally make up a large percentage of persons receiving substance use services. Table 4 describes the relative distribution of services provided to select population groups (by gender, age, race, and ethnicity) compared to their substance abuse prevalence. Females, youth under 18 years, persons age 65 and over, and Whites are underserved relative to their substance abuse prevalence. For example, 33 percent of people with a substance abuse disorder across the United States are female, but only 29 percent of substance abuse clients served in Wisconsin are female.
Figure 11: Number of Persons Receiving Substance Abuse Services, Wisconsin, 2000-2013
22
Substance Abuse Prevalence, 2009-2010 Combined, NSDUH
Substance Abuse Clients Served, 2013, HSRS and PPS
Number Percent Number Percent Female 149,674 33% 11,389 29% Male 298,326 67% 28,248 71%
Total 448,000 100% 39,637 100% Age under 18 39,986 9% 1,039 3% Age 18-64 394,800 88% 38,126 96% Age 65 and over 13,214 3% 472 1%
Total 448,000 100% 39,637 100% White 387,896 87% 31,278 79% Black 25,282 6% 4,531 11% Hispanic 25,079 6% 2,265 6% Native American 6,075 1% 1,207 3% Asian 3,668 <1% 356 1%
Total 448,000 100% 39,637 100%
Data Source: National Survey on Drug Use and Health (NSDUH), Substance Abuse and Mental Health Services Administration (SAMHSA); Human Services Reporting System (HSRS) and Program Participation System (PPS), Wisconsin Department of Health Services.
Barriers to Substance Abuse Treatment, the Individual Perspective One of the principal reasons persons with substance use problems do not obtain treatment is that they are unemployed and without health insurance. The Wisconsin Department of Health Services, Division of Public Health, conducts its own annual Family Health Survey from a representative sample of Wisconsin residents. The latest available survey results (from 2012) confirm that 89 percent of Wisconsin residents had health insurance the entire year. Another 5 percent have health insurance for part of the year, and 6 percent are uninsured all year. The counties with the highest rate of uninsured persons were Clark (14 percent), Jefferson (13 percent), Vilas (13 percent), Waupaca (11 percent), and Milwaukee (10 percent).
Table 4: Substance Abuse Prevalence in United States, 2009-2010, and Substance Abuse Clients Served in Wisconsin, 2013
23
III. Service and Workforce Capacity
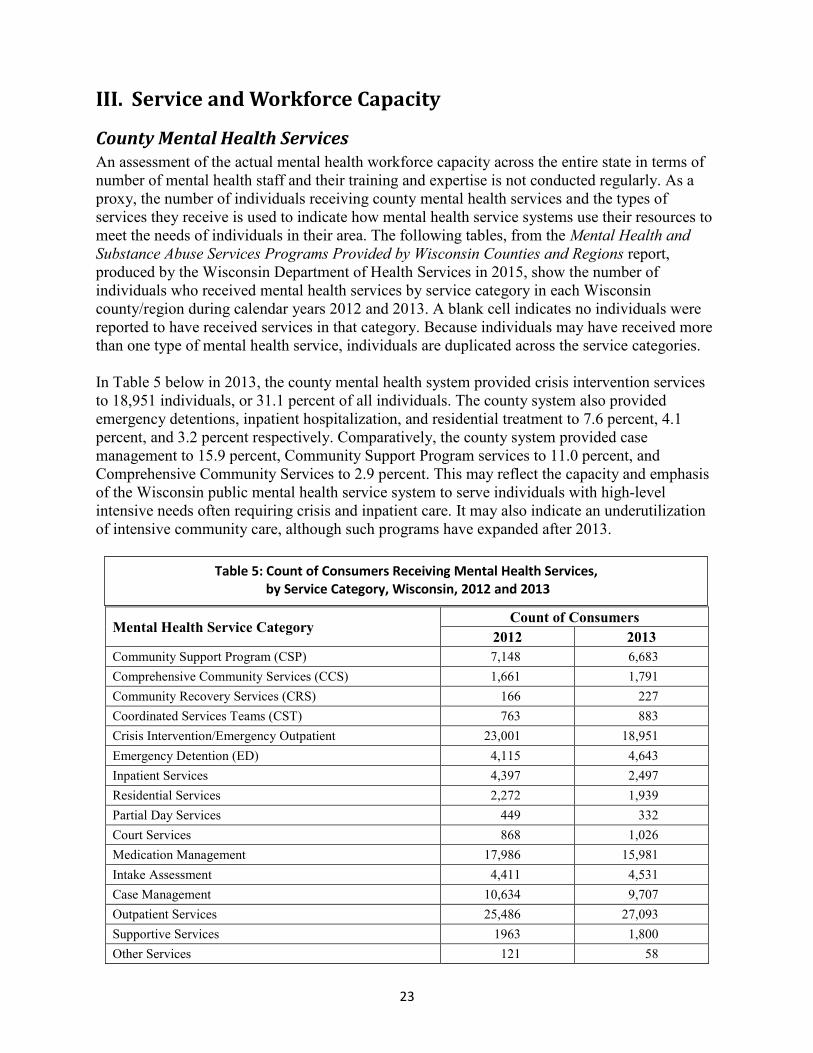
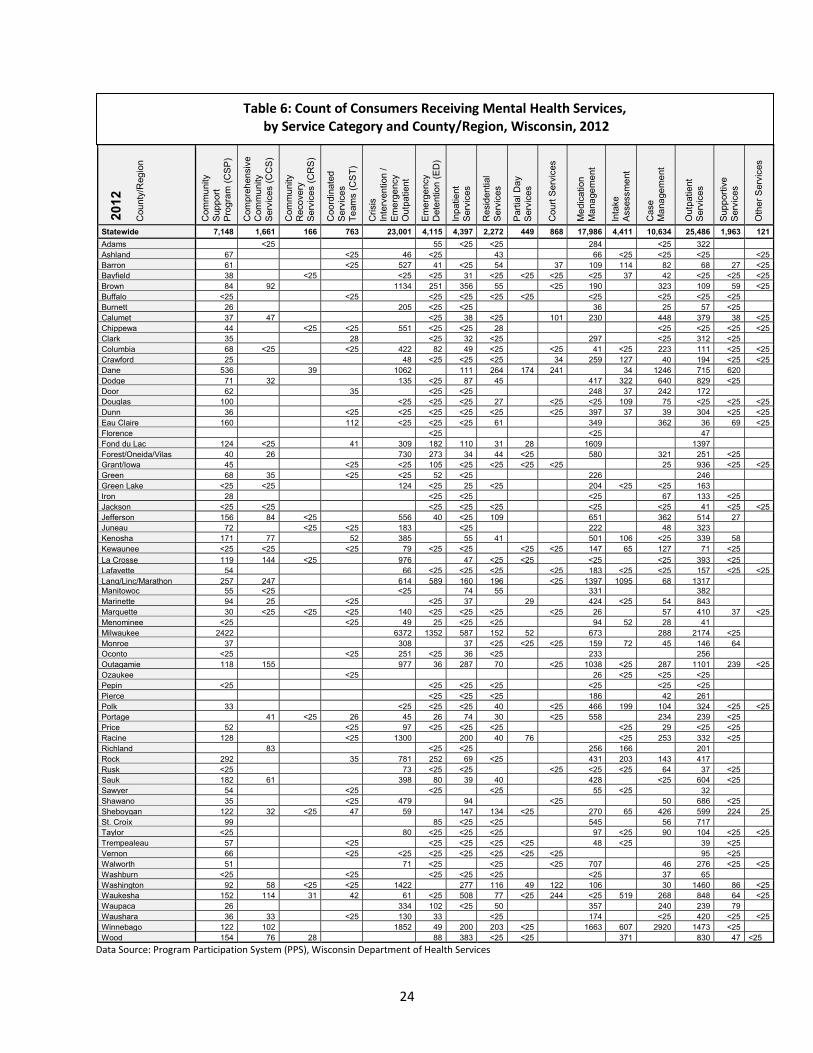
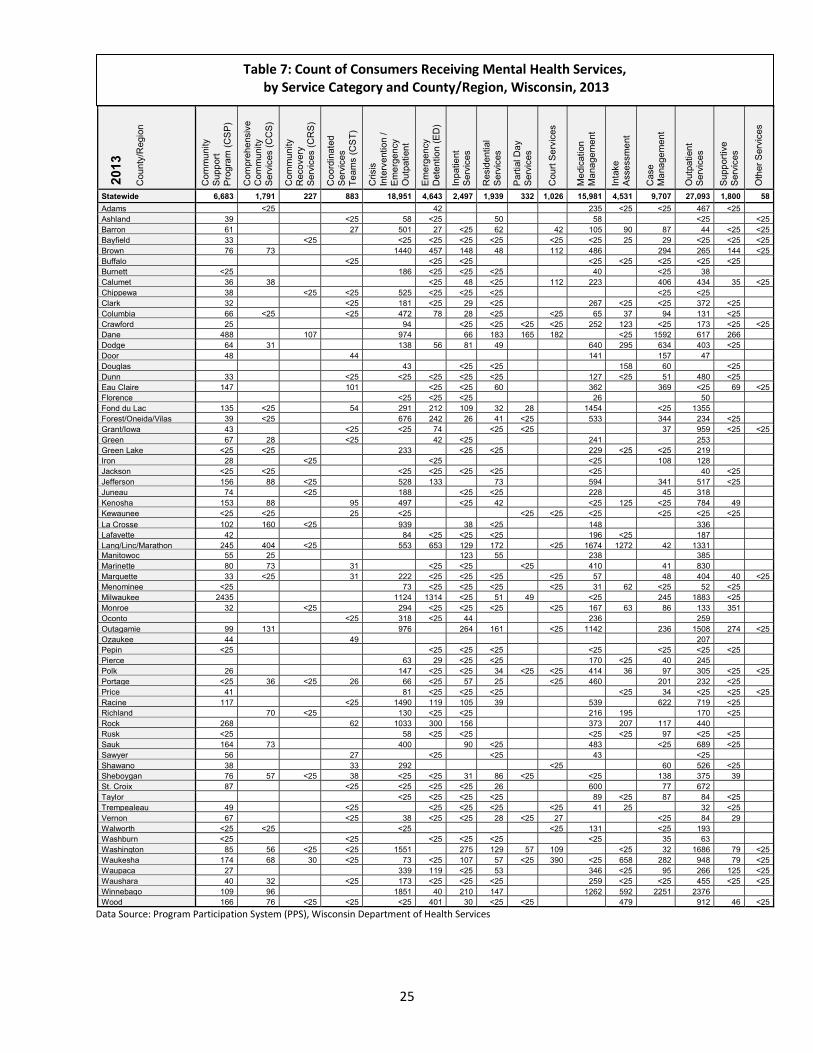
County Mental Health Services An assessment of the actual mental health workforce capacity across the entire state in terms of number of mental health staff and their training and expertise is not conducted regularly. As a proxy, the number of individuals receiving county mental health services and the types of services they receive is used to indicate how mental health service systems use their resources to meet the needs of individuals in their area. The following tables, from the Mental Health and Substance Abuse Services Programs Provided by Wisconsin Counties and Regions report, produced by the Wisconsin Department of Health Services in 2015, show the number of individuals who received mental health services by service category in each Wisconsin county/region during calendar years 2012 and 2013. A blank cell indicates no individuals were reported to have received services in that category. Because individuals may have received more than one type of mental health service, individuals are duplicated across the service categories. In Table 5 below in 2013, the county mental health system provided crisis intervention services to 18,951 individuals, or 31.1 percent of all individuals. The county system also provided emergency detentions, inpatient hospitalization, and residential treatment to 7.6 percent, 4.1 percent, and 3.2 percent respectively. Comparatively, the county system provided case management to 15.9 percent, Community Support Program services to 11.0 percent, and Comprehensive Community Services to 2.9 percent. This may reflect the capacity and emphasis of the Wisconsin public mental health service system to serve individuals with high-level intensive needs often requiring crisis and inpatient care. It may also indicate an underutilization of intensive community care, although such programs have expanded after 2013.
Mental Health Service Category Count of Consumers
2012 2013 Community Support Program (CSP) 7,148 6,683 Comprehensive Community Services (CCS) 1,661 1,791 Community Recovery Services (CRS) 166 227 Coordinated Services Teams (CST) 763 883 Crisis Intervention/Emergency Outpatient 23,001 18,951 Emergency Detention (ED) 4,115 4,643 Inpatient Services 4,397 2,497 Residential Services 2,272 1,939 Partial Day Services 449 332 Court Services 868 1,026 Medication Management 17,986 15,981 Intake Assessment 4,411 4,531 Case Management 10,634 9,707 Outpatient Services 25,486 27,093 Supportive Services 1963 1,800 Other Services 121 58
Table 5: Count of Consumers Receiving Mental Health Services, by Service Category, Wisconsin, 2012 and 2013
24
201
2
Cou
nty/
Reg
ion
Com
mun
ity
Sup
port
Pro
gram
(CS
P)
Com
preh
ensi
ve
Com
mun
ity
Ser
vice
s (C
CS
)
Com
mun
ity
Rec
over
y S
ervi
ces
(CR
S)
Coo
rdin
ated
S
ervi
ces
Tea
ms
(CS
T)
Cris
is
Inte
rven
tion
/ E
mer
genc
y O
utpa
tient
Em
erge
ncy
Det
entio
n (E
D)
Inpa
tient
S
ervi
ces
Res
iden
tial
Ser
vice
s
Par
tial D
ay
Ser
vice
s
Cou
rt S
ervi
ces
Med
icat
ion
Man
agem
ent
Inta
ke
Ass
essm
ent
Cas
e M
anag
emen
t
Out
patie
nt
Ser
vice
s
Sup
porti
ve
Ser
vice
s
Oth
er S
ervi
ces
Statewide 7,148 1,661 166 763 23,001 4,115 4,397 2,272 449 868 17,986 4,411 10,634 25,486 1,963 121 Adams
<25
55 <25 <25
284
<25 322
Ashland 67
<25 46 <25
43
66 <25 <25 <25
<25 Barron 61
<25 527 41 <25 54
37 109 114 82 68 27 <25
Bayfield 38
<25
<25 <25 31 <25 <25 <25 <25 37 42 <25 <25 <25 Brown 84 92
1134 251 356 55
<25 190
323 109 59 <25
Buffalo <25
<25
<25 <25 <25 <25
<25
<25 <25 <25 Burnett 26
205 <25 <25
36
25 57 <25
Calumet 37 47
<25 38 <25
101 230
448 379 38 <25 Chippewa 44
<25 <25 551 <25 <25 28
<25 <25 <25 <25
Clark 35
28
<25 32 <25
297
<25 312 <25 Columbia 68 <25
<25 422 82 49 <25
<25 41 <25 223 111 <25 <25
Crawford 25
48 <25 <25 <25
34 259 127 40 194 <25 <25 Dane 536
39
1062
111 264 174 241
34 1246 715 620
Dodge 71 32
135 <25 87 45
417 322 640 829 <25 Door 62
35
<25 <25
248 37 242 172
Douglas 100
<25 <25 <25 27
<25 <25 109 75 <25 <25 <25 Dunn 36
<25 <25 <25 <25 <25
<25 397 37 39 304 <25 <25
Eau Claire 160
112 <25 <25 <25 61
349
362 36 69 <25 Florence
<25
<25
47
Fond du Lac 124 <25
41 309 182 110 31 28
1609
1397 Forest/Oneida/Vilas 40 26
730 273 34 44 <25
580
321 251 <25
Grant/Iowa 45
<25 <25 105 <25 <25 <25 <25
25 936 <25 <25 Green 68 35
<25 <25 52 <25
226
246
Green Lake <25 <25
124 <25 25 <25
204 <25 <25 163 Iron 28
<25 <25
<25
67 133 <25
Jackson <25 <25
<25 <25 <25
<25
<25 41 <25 <25 Jefferson 156 84 <25
556 40 <25 109
651
362 514 27
Juneau 72
<25 <25 183
<25
222
48 323 Kenosha 171 77
52 385
55 41
501 106 <25 339 58
Kewaunee <25 <25
<25 79 <25 <25
<25 <25 147 65 127 71 <25 La Crosse 119 144 <25
976
47 <25 <25
<25
<25 393 <25
Lafayette 54
66 <25 <25 <25
<25 183 <25 <25 157 <25 <25 Lang/Linc/Marathon 257 247
614 589 160 196
<25 1397 1095 68 1317
Manitowoc 55 <25
<25
74 55
331
382 Marinette 94 25
<25
<25 37
29
424 <25 54 843
Marquette 30 <25 <25 <25 140 <25 <25 <25
<25 26
57 410 37 <25 Menominee <25
<25 49 25 <25 <25
94 52 28 41
Milwaukee 2422
6372 1352 587 152 52
673
288 2174 <25 Monroe 37
308
37 <25 <25 <25 159 72 45 146 64
Oconto <25
<25 251 <25 36 <25
233
256 Outagamie 118 155
977 36 287 70
<25 1038 <25 287 1101 239 <25
Ozaukee
<25
26 <25 <25 <25 Pepin <25
<25 <25 <25
<25
<25 <25
Pierce
<25 <25 <25
186
42 261 Polk 33
<25 <25 <25 40
<25 466 199 104 324 <25 <25
Portage
41 <25 26 45 26 74 30
<25 558
234 239 <25 Price 52
<25 97 <25 <25 <25
<25 29 <25 <25
Racine 128
<25 1300
200 40 76
<25 253 332 <25 Richland
83
<25 <25
256 166
201
Rock 292
35 781 252 69 <25
431 203 143 417 Rusk <25
73 <25 <25
<25 <25 <25 64 37 <25
Sauk 182 61
398 80 39 40
428
<25 604 <25 Sawyer 54
<25
<25
<25
55 <25
32
Shawano 35
<25 479
94
<25
50 686 <25 Sheboygan 122 32 <25 47 59
147 134 <25
270 65 426 599 224 25
St. Croix 99
85 <25 <25
545
56 717 Taylor <25
80 <25 <25 <25
97 <25 90 104 <25 <25
Trempealeau 57
<25
<25 <25 <25 <25
48 <25
39 <25 Vernon 66
<25 <25 <25 <25 <25 <25 <25
95 <25
Walworth 51
71 <25
<25
<25 707
46 276 <25 <25 Washburn <25
<25
<25 <25 <25
<25
37 65
Washington 92 58 <25 <25 1422
277 116 49 122 106
30 1460 86 <25 Waukesha 152 114 31 42 61 <25 508 77 <25 244 <25 519 268 848 64 <25 Waupaca 26
334 102 <25 50
357
240 239 79
Waushara 36 33
<25 130 33
<25
174
<25 420 <25 <25 Winnebago 122 102
1852 49 200 203 <25
1663 607 2920 1473 <25
Wood 154 76 28
88 383 <25 <25
371
830 47 <25 Data Source: Program Participation System (PPS), Wisconsin Department of Health Services
Table 6: Count of Consumers Receiving Mental Health Services, by Service Category and County/Region, Wisconsin, 2012
25
2
013
C
ount
y/R
egio
n
Com
mun
ity
Sup
port
Pro
gram
(CS
P)
Com
preh
ensi
ve
Com
mun
ity
Ser
vice
s (C
CS
)
Com
mun
ity
Rec
over
y S
ervi
ces
(CR
S)
Coo
rdin
ated
S
ervi
ces
Tea
ms
(CS
T)
Cris
is
Inte
rven
tion
/ E
mer
genc
y O
utpa
tient
Em
erge
ncy
Det
entio
n (E
D)
Inpa
tient
S
ervi
ces
Res
iden
tial
Ser
vice
s
Par
tial D
ay
Ser
vice
s
Cou
rt S
ervi
ces
Med
icat
ion
Man
agem
ent
Inta
ke
Ass
essm
ent
Cas
e M
anag
emen
t
Out
patie
nt
Ser
vice
s
Sup
porti
ve
Ser
vice
s
Oth
er S
ervi
ces
Statewide 6,683 1,791 227 883 18,951 4,643 2,497 1,939 332 1,026 15,981 4,531 9,707 27,093 1,800 58 Adams
<25
42
235 <25 <25 467 <25
Ashland 39
<25 58 <25
50
58
<25
<25 Barron 61
27 501 27 <25 62
42 105 90 87 44 <25 <25
Bayfield 33
<25
<25 <25 <25 <25
<25 <25 25 29 <25 <25 <25 Brown 76 73
1440 457 148 48
112 486
294 265 144 <25
Buffalo
<25
<25 <25
<25 <25 <25 <25 <25 Burnett <25
186 <25 <25 <25
40
<25 38
Calumet 36 38
<25 48 <25
112 223
406 434 35 <25 Chippewa 38
<25 <25 525 <25 <25 <25
<25 <25
Clark 32
<25 181 <25 29 <25
267 <25 <25 372 <25 Columbia 66 <25
<25 472 78 28 <25
<25 65 37 94 131 <25
Crawford 25
94
<25 <25 <25 <25 252 123 <25 173 <25 <25 Dane 488
107
974
66 183 165 182
<25 1592 617 266
Dodge 64 31
138 56 81 49
640 295 634 403 <25 Door 48
44
141
157 47
Douglas
43
<25 <25
158 60
<25 Dunn 33
<25 <25 <25 <25 <25
127 <25 51 480 <25
Eau Claire 147
101
<25 <25 60
362
369 <25 69 <25 Florence
<25 <25 <25
26
50
Fond du Lac 135 <25
54 291 212 109 32 28
1454
<25 1355 Forest/Oneida/Vilas 39 <25
676 242 26 41 <25
533
344 234 <25
Grant/Iowa 43
<25 <25 74
<25 <25
37 959 <25 <25 Green 67 28
<25
42 <25
241
253
Green Lake <25 <25
233
<25 <25
229 <25 <25 219 Iron 28
<25
<25
<25
108 128
Jackson <25 <25
<25 <25 <25 <25
<25
40 <25 Jefferson 156 88 <25
528 133
73
594
341 517 <25
Juneau 74
<25
188
<25 <25
228
45 318 Kenosha 153 88
95 497
<25 42
<25 125 <25 784 49
Kewaunee <25 <25
25 <25
<25 <25 <25
<25 <25 <25 La Crosse 102 160 <25
939
38 <25
148
336
Lafayette 42
84 <25 <25 <25
196 <25
187 Lang/Linc/Marathon 245 404 <25
553 653 129 172
<25 1674 1272 42 1331
Manitowoc 55 25
123 55
238
385 Marinette 80 73
31
<25 <25
<25
410
41 830
Marquette 33 <25
31 222 <25 <25 <25
<25 57
48 404 40 <25 Menominee <25
73 <25 <25 <25
<25 31 62 <25 52 <25
Milwaukee 2435
1124 1314 <25 51 49
<25
245 1883 <25 Monroe 32
<25
294 <25 <25 <25
<25 167 63 86 133 351
Oconto
<25 318 <25 44
236
259 Outagamie 99 131
976
264 161
<25 1142
236 1508 274 <25
Ozaukee 44
49
207 Pepin <25
<25 <25 <25
<25
<25 <25 <25
Pierce
63 29 <25 <25
170 <25 40 245 Polk 26
147 <25 <25 34 <25 <25 414 36 97 305 <25 <25
Portage <25 36 <25 26 66 <25 57 25
<25 460
201 232 <25 Price 41
81 <25 <25 <25
<25 34 <25 <25 <25
Racine 117
<25 1490 119 105 39
539
622 719 <25 Richland
70 <25
130 <25 <25
216 195
170 <25
Rock 268
62 1033 300 156
373 207 117 440 Rusk <25
58 <25 <25
<25 <25 97 <25 <25
Sauk 164 73
400
90 <25
483
<25 689 <25 Sawyer 56
27
<25
<25
43
<25
Shawano 38
33 292
<25
60 526 <25 Sheboygan 76 57 <25 38 <25 <25 31 86 <25
<25
138 375 39
St. Croix 87
<25 <25 <25 <25 26
600
77 672 Taylor
<25 <25 <25 <25
89 <25 87 84 <25
Trempealeau 49
<25
<25 <25 <25
<25 41 25
32 <25 Vernon 67
<25 38 <25 <25 28 <25 27
<25 84 29
Walworth <25 <25
<25
<25 131
<25 193 Washburn <25
<25
<25 <25 <25
<25
35 63
Washington 85 56 <25 <25 1551
275 129 57 109
<25 32 1686 79 <25 Waukesha 174 68 30 <25 73 <25 107 57 <25 390 <25 658 282 948 79 <25 Waupaca 27
339 119 <25 53
346 <25 95 266 125 <25
Waushara 40 32
<25 173 <25 <25 <25
259 <25 <25 455 <25 <25 Winnebago 109 96
1851 40 210 147
1262 592 2251 2376
Wood 166 76 <25 <25 <25 401 30 <25 <25
479
912 46 <25 Data Source: Program Participation System (PPS), Wisconsin Department of Health Services
Table 7: Count of Consumers Receiving Mental Health Services, by Service Category and County/Region, Wisconsin, 2013
26
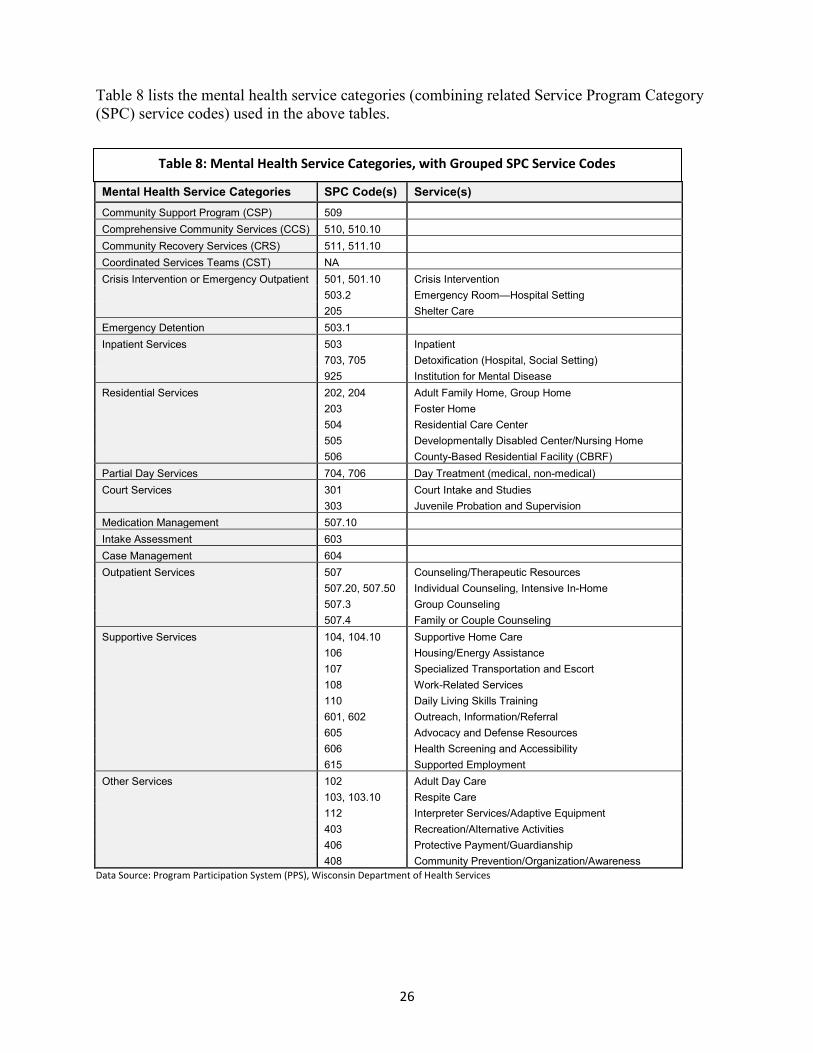
Table 8 lists the mental health service categories (combining related Service Program Category (SPC) service codes) used in the above tables. Mental Health Service Categories SPC Code(s) Service(s) Community Support Program (CSP) 509 Comprehensive Community Services (CCS) 510, 510.10 Community Recovery Services (CRS) 511, 511.10 Coordinated Services Teams (CST) NA
Crisis Intervention or Emergency Outpatient 501, 501.10 Crisis Intervention 503.2 Emergency Room—Hospital Setting 205 Shelter Care Emergency Detention 503.1 Inpatient Services 503 Inpatient 703, 705 Detoxification (Hospital, Social Setting) 925 Institution for Mental Disease Residential Services 202, 204 Adult Family Home, Group Home 203 Foster Home 504 Residential Care Center 505 Developmentally Disabled Center/Nursing Home 506 County-Based Residential Facility (CBRF) Partial Day Services 704, 706 Day Treatment (medical, non-medical) Court Services 301 Court Intake and Studies 303 Juvenile Probation and Supervision Medication Management 507.10 Intake Assessment 603 Case Management 604 Outpatient Services 507 Counseling/Therapeutic Resources 507.20, 507.50 Individual Counseling, Intensive In-Home 507.3 Group Counseling 507.4 Family or Couple Counseling Supportive Services 104, 104.10 Supportive Home Care 106 Housing/Energy Assistance 107 Specialized Transportation and Escort 108 Work-Related Services 110 Daily Living Skills Training 601, 602 Outreach, Information/Referral 605 Advocacy and Defense Resources 606 Health Screening and Accessibility 615 Supported Employment Other Services 102 Adult Day Care 103, 103.10 Respite Care 112 Interpreter Services/Adaptive Equipment 403 Recreation/Alternative Activities 406 Protective Payment/Guardianship 408 Community Prevention/Organization/Awareness
Data Source: Program Participation System (PPS), Wisconsin Department of Health Services
Table 8: Mental Health Service Categories, with Grouped SPC Service Codes
27
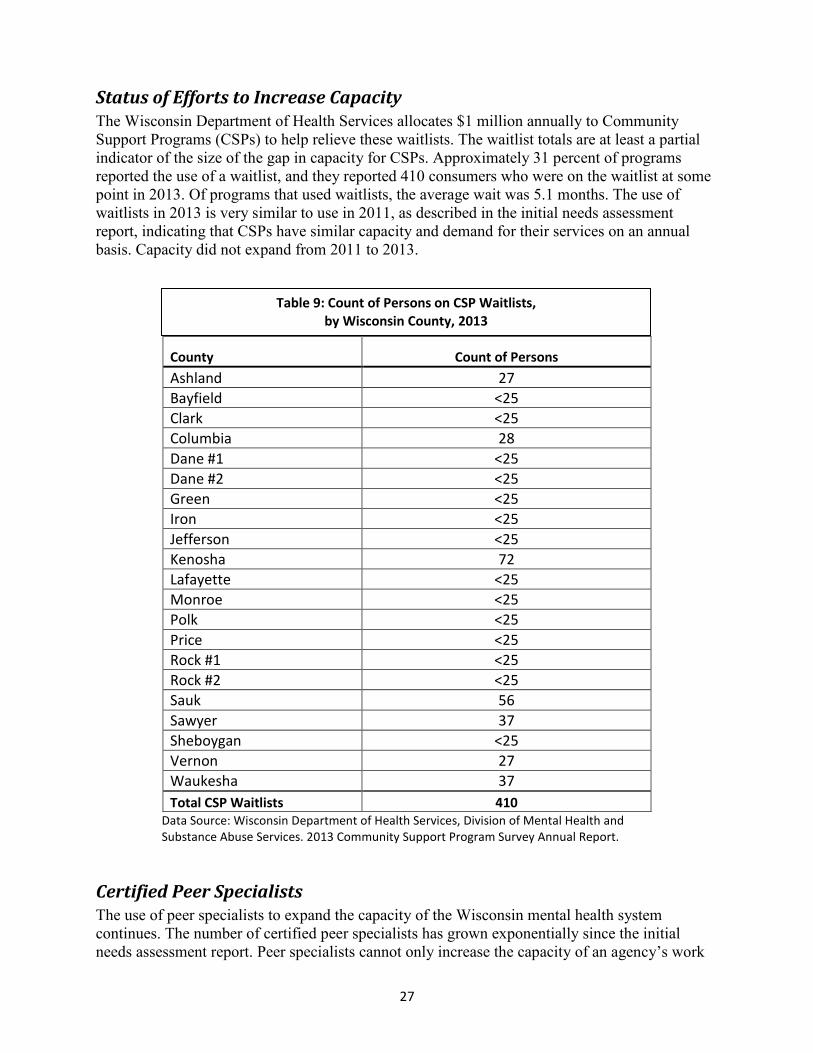
Status of Efforts to Increase Capacity The Wisconsin Department of Health Services allocates $1 million annually to Community Support Programs (CSPs) to help relieve these waitlists. The waitlist totals are at least a partial indicator of the size of the gap in capacity for CSPs. Approximately 31 percent of programs reported the use of a waitlist, and they reported 410 consumers who were on the waitlist at some point in 2013. Of programs that used waitlists, the average wait was 5.1 months. The use of waitlists in 2013 is very similar to use in 2011, as described in the initial needs assessment report, indicating that CSPs have similar capacity and demand for their services on an annual basis. Capacity did not expand from 2011 to 2013.
County Count of Persons Ashland 27 Bayfield <25 Clark <25 Columbia 28 Dane #1 <25 Dane #2 <25 Green <25 Iron <25 Jefferson <25 Kenosha 72 Lafayette <25 Monroe <25 Polk <25 Price <25 Rock #1 <25 Rock #2 <25 Sauk 56 Sawyer 37 Sheboygan <25 Vernon 27 Waukesha 37 Total CSP Waitlists 410
Data Source: Wisconsin Department of Health Services, Division of Mental Health and Substance Abuse Services. 2013 Community Support Program Survey Annual Report.
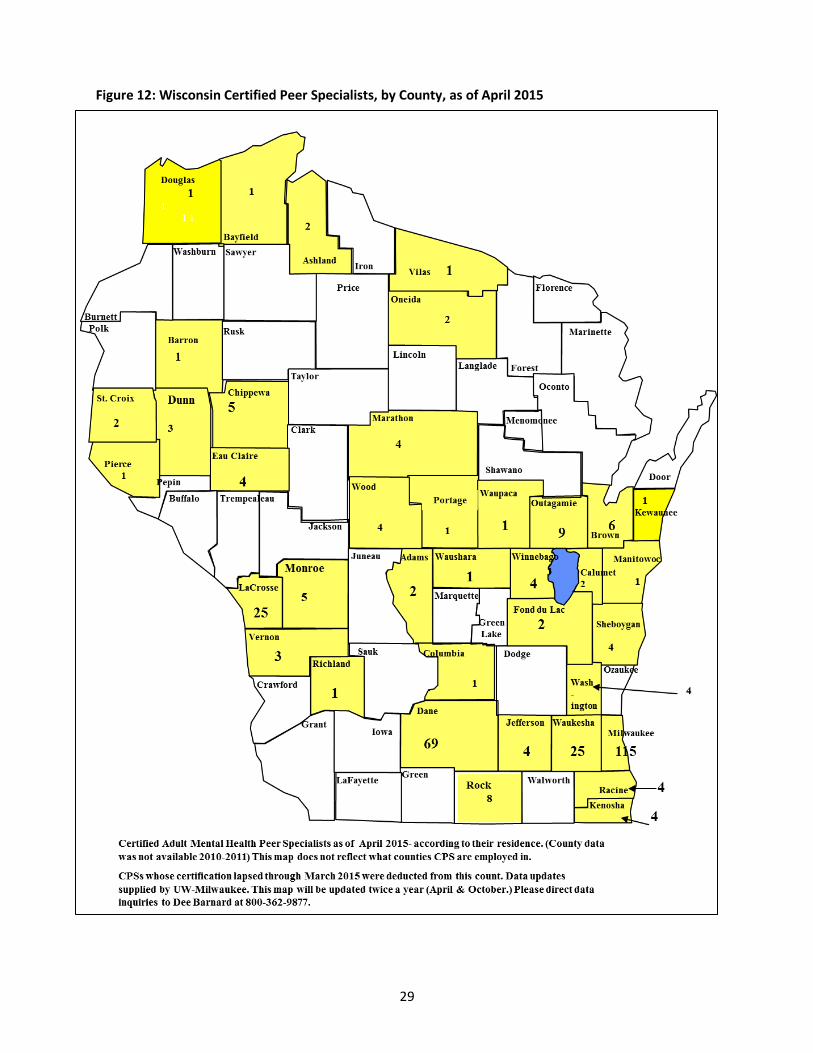
Certified Peer Specialists The use of peer specialists to expand the capacity of the Wisconsin mental health system continues. The number of certified peer specialists has grown exponentially since the initial needs assessment report. Peer specialists cannot only increase the capacity of an agency’s work
Table 9: Count of Persons on CSP Waitlists, by Wisconsin County, 2013

28
force, they can also improve the quality and effectiveness of treatment by establishing a collaborative, trusting relationship between the provider agency and the individuals receiving services. As of April 2015, there were 333 Certified Peer Specialists in Wisconsin, compared to 193 in 2012. A March 2015 survey of certified peer specialists found that 66.9 percent of respondents were currently employed and 62.5 percent of the employed peer specialists had been employed for more than one year.
29
Figure 12: Wisconsin Certified Peer Specialists, by County, as of April 2015
30
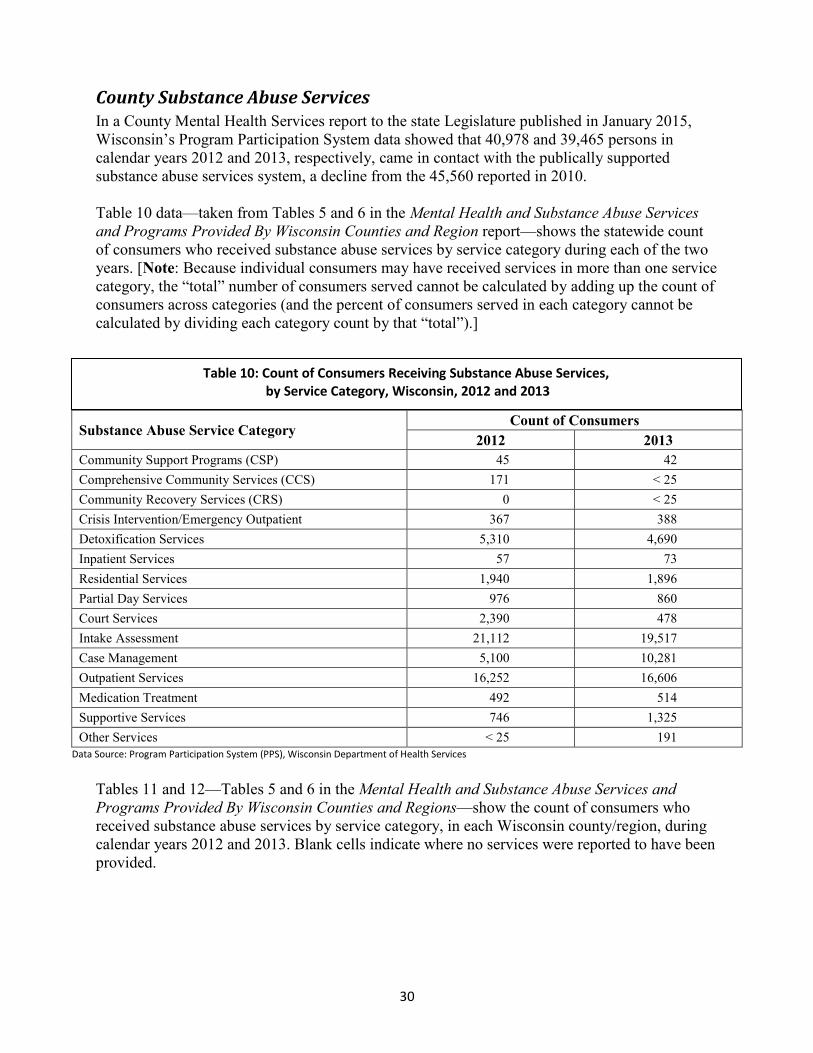
County Substance Abuse Services In a County Mental Health Services report to the state Legislature published in January 2015, Wisconsin’s Program Participation System data showed that 40,978 and 39,465 persons in calendar years 2012 and 2013, respectively, came in contact with the publically supported substance abuse services system, a decline from the 45,560 reported in 2010. Table 10 data—taken from Tables 5 and 6 in the Mental Health and Substance Abuse Services and Programs Provided By Wisconsin Counties and Region report—shows the statewide count of consumers who received substance abuse services by service category during each of the two years. [Note: Because individual consumers may have received services in more than one service category, the “total” number of consumers served cannot be calculated by adding up the count of consumers across categories (and the percent of consumers served in each category cannot be calculated by dividing each category count by that “total”).]
Substance Abuse Service Category Count of Consumers
2012 2013 Community Support Programs (CSP) 45 42 Comprehensive Community Services (CCS) 171 < 25 Community Recovery Services (CRS) 0 < 25 Crisis Intervention/Emergency Outpatient 367 388 Detoxification Services 5,310 4,690 Inpatient Services 57 73 Residential Services 1,940 1,896 Partial Day Services 976 860 Court Services 2,390 478 Intake Assessment 21,112 19,517 Case Management 5,100 10,281 Outpatient Services 16,252 16,606 Medication Treatment 492 514 Supportive Services 746 1,325 Other Services < 25 191
Data Source: Program Participation System (PPS), Wisconsin Department of Health Services
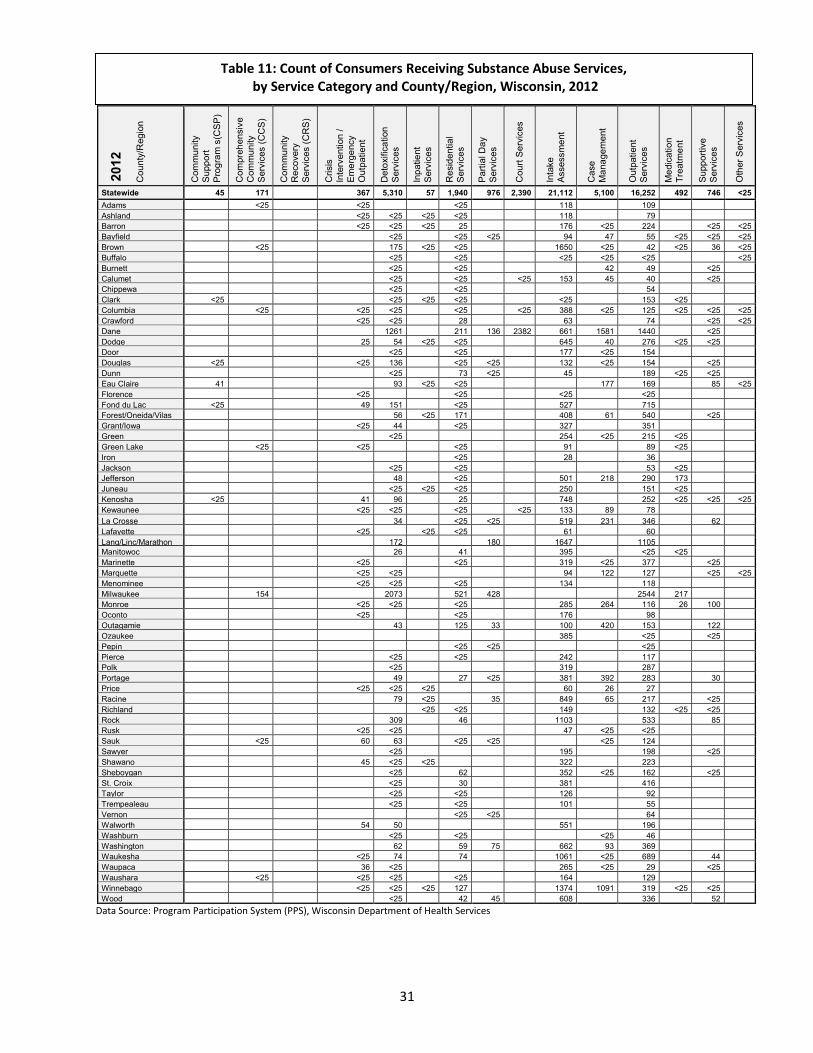
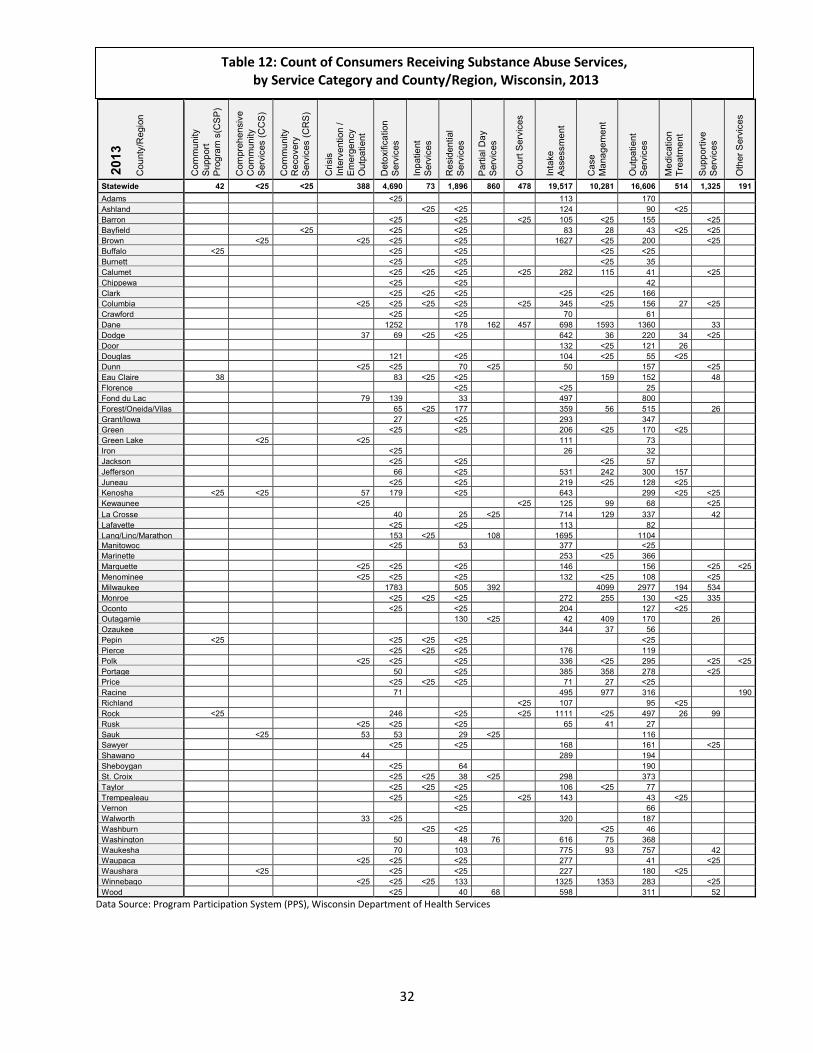
Tables 11 and 12—Tables 5 and 6 in the Mental Health and Substance Abuse Services and Programs Provided By Wisconsin Counties and Regions—show the count of consumers who received substance abuse services by service category, in each Wisconsin county/region, during calendar years 2012 and 2013. Blank cells indicate where no services were reported to have been provided.
Table 10: Count of Consumers Receiving Substance Abuse Services, by Service Category, Wisconsin, 2012 and 2013
31
2
012
C
ount
y/R
egio
n
Com
mun
ity
Sup
port
Pro
gram
s(C
SP
)
Com
preh
ensi
ve
Com
mun
ity
Ser
vice
s (C
CS
)
Com
mun
ity
Rec
over
y S
ervi
ces
(CR
S)
Cris
is
Inte
rven
tion
/ E
mer
genc
y O
utpa
tient
Det
oxifi
catio
n S
ervi
ces
Inpa
tient
S
ervi
ces
Res
iden
tial
Ser
vice
s
Par
tial D
ay
Ser
vice
s
Cou
rt S
ervi
ces
Inta
ke
Ass
essm
ent
Cas
e M
anag
emen
t
Out
patie
nt
Ser
vice
s
Med
icat
ion
Tre
atm
ent
Sup
porti
ve
Ser
vice
s
Oth
er S
ervi
ces
Statewide 45 171 367 5,310 57 1,940 976 2,390 21,112 5,100 16,252 492 746 <25 Adams
<25
<25
<25
118
109
Ashland
<25 <25 <25 <25
118
79 Barron
<25 <25 <25 25
176 <25 224 <25 <25
Bayfield
<25
<25 <25
94 47 55 <25 <25 <25 Brown
<25
175 <25 <25
1650 <25 42 <25 36 <25
Buffalo
<25
<25
<25 <25 <25
<25 Burnett
<25
<25
42 49 <25
Calumet
<25
<25
<25 153 45 40 <25 Chippewa
<25
<25
54
Clark <25
<25 <25 <25
<25
153 <25 Columbia
<25
<25 <25
<25
<25 388 <25 125 <25 <25 <25
Crawford
<25 <25
28
63
74 <25 <25 Dane
1261
211 136 2382 661 1581 1440 <25
Dodge
25 54 <25 <25
645 40 276 <25 <25 Door
<25
<25
177 <25 154
Douglas <25
<25 136
<25 <25
132 <25 154 <25 Dunn
<25
73 <25
45
189 <25 <25
Eau Claire 41
93 <25 <25
177 169 85 <25 Florence
<25
<25
<25
<25
Fond du Lac <25
49 151
<25
527
715 Forest/Oneida/Vilas
56 <25 171
408 61 540 <25
Grant/Iowa
<25 44
<25
327
351 Green
<25
254 <25 215 <25
Green Lake
<25
<25
<25
91
89 <25 Iron
<25
28
36
Jackson
<25
<25
53 <25 Jefferson
48
<25
501 218 290 173
Juneau
<25 <25 <25
250
151 <25 Kenosha <25
41 96
25
748
252 <25 <25 <25
Kewaunee
<25 <25
<25
<25 133 89 78 La Crosse
34
<25 <25
519 231 346 62
Lafayette
<25
<25 <25
61
60 Lang/Linc/Marathon
172
180
1647
1105
Manitowoc
26
41
395
<25 <25 Marinette
<25
<25
319 <25 377 <25
Marquette
<25 <25
94 122 127 <25 <25 Menominee
<25 <25
<25
134
118
Milwaukee
154
2073
521 428
2544 217 Monroe
<25 <25
<25
285 264 116 26 100
Oconto
<25
<25
176
98 Outagamie
43
125 33
100 420 153 122
Ozaukee
385
<25 <25 Pepin
<25 <25
<25
Pierce
<25
<25
242
117 Polk
<25
319
287
Portage
49
27 <25
381 392 283 30 Price
<25 <25 <25
60 26 27
Racine
79 <25
35
849 65 217 <25 Richland
<25 <25
149
132 <25 <25
Rock
309
46
1103
533 85 Rusk
<25 <25
47 <25 <25
Sauk
<25
60 63
<25 <25
<25 124 Sawyer
<25
195
198 <25
Shawano
45 <25 <25
322
223 Sheboygan
<25
62
352 <25 162 <25
St. Croix
<25
30
381
416 Taylor
<25
<25
126
92
Trempealeau
<25
<25
101
55 Vernon
<25 <25
64
Walworth
54 50
551
196 Washburn
<25
<25
<25 46
Washington
62
59 75
662 93 369 Waukesha
<25 74
74
1061 <25 689 44
Waupaca
36 <25
265 <25 29 <25 Waushara
<25
<25 <25
<25
164
129
Winnebago
<25 <25 <25 127
1374 1091 319 <25 <25 Wood
<25
42 45
608
336 52
Data Source: Program Participation System (PPS), Wisconsin Department of Health Services
Table 11: Count of Consumers Receiving Substance Abuse Services, by Service Category and County/Region, Wisconsin, 2012
32
2
013
C
ount
y/R
egio
n
Com
mun
ity
Sup
port
Pro
gram
s(C
SP
)
Com
preh
ensi
ve
Com
mun
ity
Ser
vice
s (C
CS
)
Com
mun
ity
Rec
over
y S
ervi
ces
(CR
S)
Cris
is
Inte
rven
tion
/ E
mer
genc
y O
utpa
tient
Det
oxifi
catio
n S
ervi
ces
Inpa
tient
S
ervi
ces
Res
iden
tial
Ser
vice
s
Par
tial D
ay
Ser
vice
s
Cou
rt S
ervi
ces
Inta
ke
Ass
essm
ent
Cas
e M
anag
emen
t
Out
patie
nt
Ser
vice
s
Med
icat
ion
Tre
atm
ent
Sup
porti
ve
Ser
vice
s
Oth
er S
ervi
ces
Statewide 42 <25 <25 388 4,690 73 1,896 860 478 19,517 10,281 16,606 514 1,325 191 Adams
<25
113
170
Ashland
<25 <25
124
90 <25 Barron
<25
<25
<25 105 <25 155 <25
Bayfield
<25
<25
<25
83 28 43 <25 <25 Brown
<25
<25 <25
<25
1627 <25 200 <25
Buffalo <25
<25
<25
<25 <25 Burnett
<25
<25
<25 35
Calumet
<25 <25 <25
<25 282 115 41 <25 Chippewa
<25
<25
42
Clark
<25 <25 <25
<25 <25 166 Columbia
<25 <25 <25 <25
<25 345 <25 156 27 <25
Crawford
<25
<25
70
61 Dane
1252
178 162 457 698 1593 1360 33
Dodge
37 69 <25 <25
642 36 220 34 <25 Door
132 <25 121 26
Douglas
121
<25
104 <25 55 <25 Dunn
<25 <25
70 <25
50
157 <25
Eau Claire 38
83 <25 <25
159 152 48 Florence
<25
<25
25
Fond du Lac
79 139
33
497
800 Forest/Oneida/Vilas
65 <25 177
359 56 515 26
Grant/Iowa
27
<25
293
347 Green
<25
<25
206 <25 170 <25
Green Lake
<25
<25
111
73 Iron
<25
26
32
Jackson
<25
<25
<25 57 Jefferson
66
<25
531 242 300 157
Juneau
<25
<25
219 <25 128 <25 Kenosha <25 <25
57 179
<25
643
299 <25 <25
Kewaunee
<25
<25 125 99 68 <25 La Crosse
40
25 <25
714 129 337 42
Lafayette
<25
<25
113
82 Lang/Linc/Marathon
153 <25
108
1695
1104
Manitowoc
<25
53
377
<25 Marinette
253 <25 366
Marquette
<25 <25
<25
146
156 <25 <25 Menominee
<25 <25
<25
132 <25 108 <25
Milwaukee
1783
505 392
4099 2977 194 534 Monroe
<25 <25 <25
272 255 130 <25 335
Oconto
<25
<25
204
127 <25 Outagamie
130 <25
42 409 170 26
Ozaukee
344 37 56 Pepin <25
<25 <25 <25
<25
Pierce
<25 <25 <25
176
119 Polk
<25 <25
<25
336 <25 295 <25 <25
Portage
50
<25
385 358 278 <25 Price
<25 <25 <25
71 27 <25
Racine
71
495 977 316
190 Richland
<25 107
95 <25
Rock <25
246
<25
<25 1111 <25 497 26 99 Rusk
<25 <25
<25
65 41 27
Sauk
<25
53 53
29 <25
116 Sawyer
<25
<25
168
161 <25
Shawano
44
289
194 Sheboygan
<25
64
190
St. Croix
<25 <25 38 <25
298
373 Taylor
<25 <25 <25
106 <25 77
Trempealeau
<25
<25
<25 143
43 <25 Vernon
<25
66
Walworth
33 <25
320
187 Washburn
<25 <25
<25 46
Washington
50
48 76
616 75 368 Waukesha
70
103
775 93 757 42
Waupaca
<25 <25
<25
277
41 <25 Waushara
<25
<25
<25
227
180 <25
Winnebago
<25 <25 <25 133
1325 1353 283 <25 Wood
<25
40 68
598
311 52
Data Source: Program Participation System (PPS), Wisconsin Department of Health Services
Table 12: Count of Consumers Receiving Substance Abuse Services, by Service Category and County/Region, Wisconsin, 2013
33
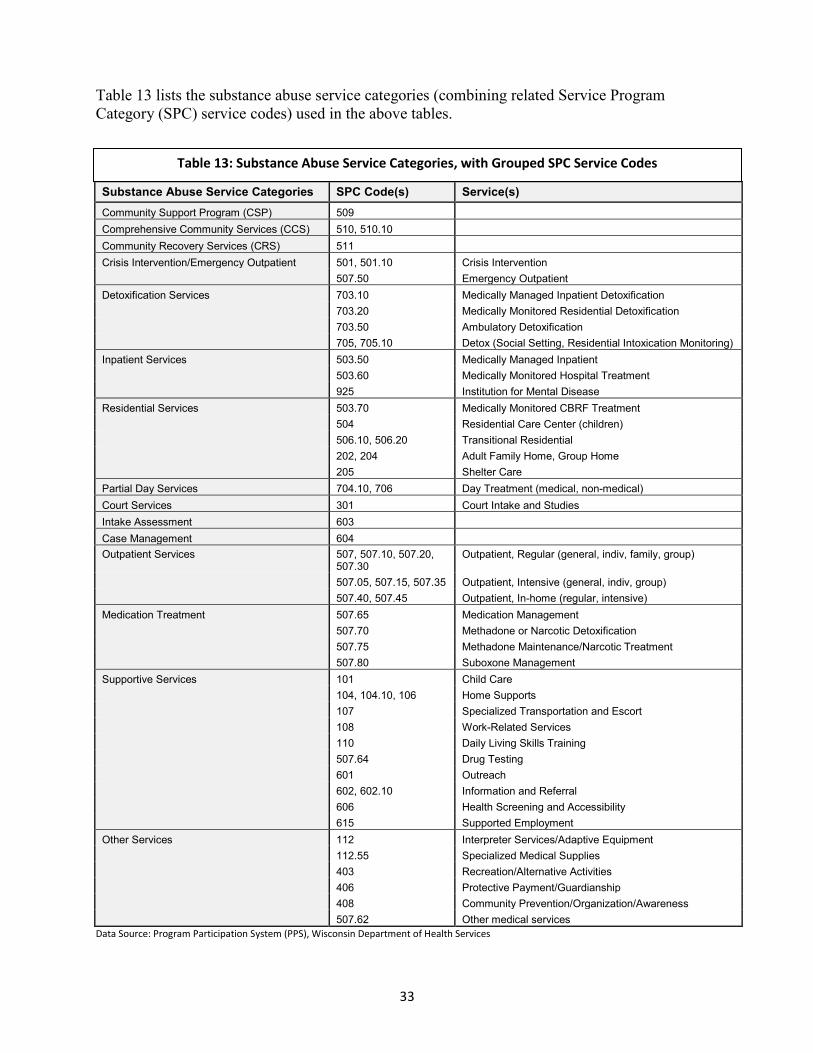
Table 13 lists the substance abuse service categories (combining related Service Program Category (SPC) service codes) used in the above tables. Substance Abuse Service Categories SPC Code(s) Service(s) Community Support Program (CSP) 509 Comprehensive Community Services (CCS) 510, 510.10 Community Recovery Services (CRS) 511 Crisis Intervention/Emergency Outpatient 501, 501.10 Crisis Intervention 507.50 Emergency Outpatient Detoxification Services 703.10 Medically Managed Inpatient Detoxification 703.20 Medically Monitored Residential Detoxification 703.50 Ambulatory Detoxification 705, 705.10 Detox (Social Setting, Residential Intoxication Monitoring) Inpatient Services 503.50 Medically Managed Inpatient 503.60 Medically Monitored Hospital Treatment 925 Institution for Mental Disease Residential Services 503.70 Medically Monitored CBRF Treatment 504 Residential Care Center (children) 506.10, 506.20 Transitional Residential 202, 204 Adult Family Home, Group Home 205 Shelter Care Partial Day Services 704.10, 706 Day Treatment (medical, non-medical) Court Services 301 Court Intake and Studies Intake Assessment 603 Case Management 604 Outpatient Services 507, 507.10, 507.20,
507.30 Outpatient, Regular (general, indiv, family, group)
507.05, 507.15, 507.35 Outpatient, Intensive (general, indiv, group) 507.40, 507.45 Outpatient, In-home (regular, intensive) Medication Treatment 507.65 Medication Management 507.70 Methadone or Narcotic Detoxification 507.75 Methadone Maintenance/Narcotic Treatment 507.80 Suboxone Management Supportive Services 101 Child Care 104, 104.10, 106 Home Supports 107 Specialized Transportation and Escort 108 Work-Related Services 110 Daily Living Skills Training 507.64 Drug Testing 601 Outreach 602, 602.10 Information and Referral 606 Health Screening and Accessibility 615 Supported Employment Other Services 112 Interpreter Services/Adaptive Equipment 112.55 Specialized Medical Supplies 403 Recreation/Alternative Activities 406 Protective Payment/Guardianship 408 Community Prevention/Organization/Awareness 507.62 Other medical services
Data Source: Program Participation System (PPS), Wisconsin Department of Health Services
Table 13: Substance Abuse Service Categories, with Grouped SPC Service Codes
34
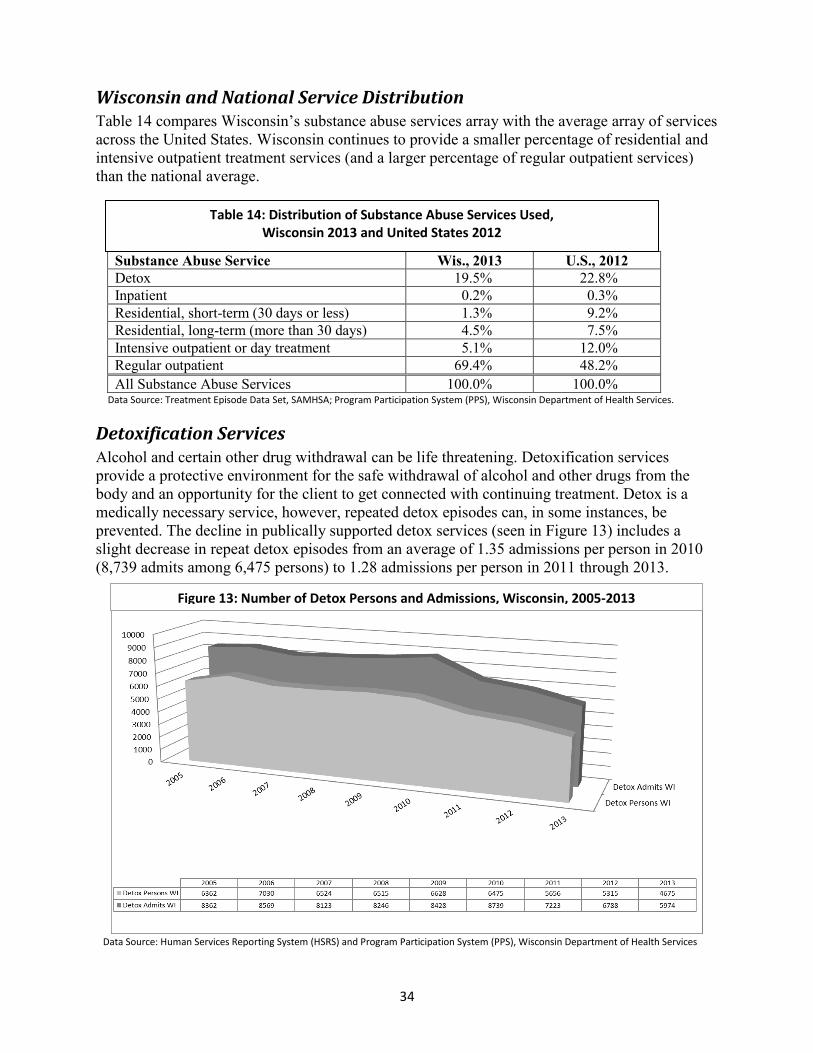
Wisconsin and National Service Distribution Table 14 compares Wisconsin’s substance abuse services array with the average array of services across the United States. Wisconsin continues to provide a smaller percentage of residential and intensive outpatient treatment services (and a larger percentage of regular outpatient services) than the national average.
Substance Abuse Service Wis., 2013 U.S., 2012 Detox 19.5% 22.8% Inpatient 0.2% 0.3% Residential, short-term (30 days or less) 1.3% 9.2% Residential, long-term (more than 30 days) 4.5% 7.5% Intensive outpatient or day treatment 5.1% 12.0% Regular outpatient 69.4% 48.2% All Substance Abuse Services 100.0% 100.0%
Data Source: Treatment Episode Data Set, SAMHSA; Program Participation System (PPS), Wisconsin Department of Health Services.
Detoxification Services Alcohol and certain other drug withdrawal can be life threatening. Detoxification services provide a protective environment for the safe withdrawal of alcohol and other drugs from the body and an opportunity for the client to get connected with continuing treatment. Detox is a medically necessary service, however, repeated detox episodes can, in some instances, be prevented. The decline in publically supported detox services (seen in Figure 13) includes a slight decrease in repeat detox episodes from an average of 1.35 admissions per person in 2010 (8,739 admits among 6,475 persons) to 1.28 admissions per person in 2011 through 2013.
Data Source: Human Services Reporting System (HSRS) and Program Participation System (PPS), Wisconsin Department of Health Services
Figure 13: Number of Detox Persons and Admissions, Wisconsin, 2005-2013
Table 14: Distribution of Substance Abuse Services Used, Wisconsin 2013 and United States 2012
35
Medication-Assisted Treatment The use of medications such as naltrexone, buprenorphine, and methadone to supplement psychosocial addiction treatment is an evidence-based approach to care. According to data on the percent of client admissions that include medication services (in Table 15), Wisconsin lags behind the national average in the use of medication adjuncts.
Table 15: Percent of Client Admissions that Received Medication-Assisted Treatment, Wisconsin 2013 and United States 2012
Wis., 2013 U.S., 2012 0.3% 6.8%
Data Source: Treatment Episode Data Set, SAMHSA
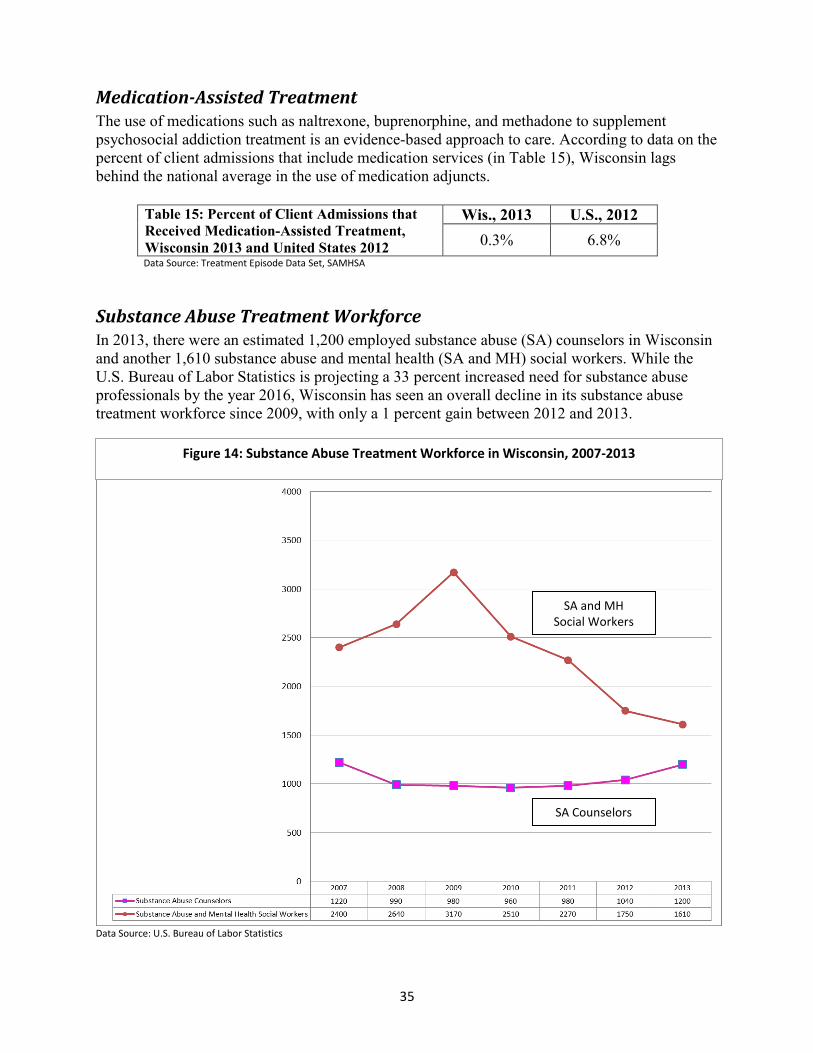
Substance Abuse Treatment Workforce In 2013, there were an estimated 1,200 employed substance abuse (SA) counselors in Wisconsin and another 1,610 substance abuse and mental health (SA and MH) social workers. While the U.S. Bureau of Labor Statistics is projecting a 33 percent increased need for substance abuse professionals by the year 2016, Wisconsin has seen an overall decline in its substance abuse treatment workforce since 2009, with only a 1 percent gain between 2012 and 2013.
Data Source: U.S. Bureau of Labor Statistics
SA and MH Social Workers
SA Counselors
Figure 14: Substance Abuse Treatment Workforce in Wisconsin, 2007-2013
36
Substance Abuse Services Availability and Waiting List Issues Each year the Wisconsin Department of Health Services, Division of Mental Health and Substance Abuse Services, gathers data from county agencies administering or providing substance abuse services. Data on waiting lists and unavailable services are collected. In 2013, 530 persons statewide were denied a needed service such as residential, intensive outpatient counseling, or narcotic treatment due to lack of availability or lack of public funding. An additional 1,660 persons statewide were placed on a waiting list for services such as residential, intensive outpatient counseling, regular outpatient counseling, or narcotic treatment where they were required to wait two to three weeks before receiving services. Studies show that clients from waiting lists are at higher risk of not starting treatment or withdrawing from treatment. Thirty county agencies identified services that were not available due to lack of sufficient revenue such as residential or housing services, narcotic treatment, intensive outpatient counseling, case management, wraparound services, and transportation.
37
IV. Quality and Outcomes The purpose of this section is to examine to what degree consumers are treated effectively in Wisconsin’s mental health and substance abuse services system. Two broad areas will be examined:
• Quality and Appropriateness of Services • Consumer Outcome Indicators
Once consumers access services, many factors can influence whether consumers’ needs have been met before being discharged from treatment. Services provided to consumers must be appropriately matched to their specific needs and services must be delivered in a quality manner according to treatment standards and using best practices when possible. Needs and gaps in the areas of quality and appropriateness are important to examine because they sometimes can be more readily addressed through the addition of training components for staff. Ultimately, the effectiveness of services must be assessed based on the outcomes of the service experience for the individual consumer. Consumer outcomes, such as reduction in alcohol use and employment status, are examined. An epidemiological approach is used to examine broad system and societal impacts such as hospitalization rates and alcohol-related traffic deaths.
Quality and Appropriateness of Services Two important issues related to the quality and appropriateness of services received by consumers are examined in this section:
• Using evidence-based practices to deliver quality services with proven effectiveness • Delivering services in a recovery-based manner
Use of Evidence-Based Practices to Provide Quality Mental Health Services The Division of Mental Health and Substance Abuse Services (DMHSAS) conducts an annual program survey of all CSPs and CCS programs across the state. These surveys have asked program staff for information on their use of evidence-based practices (EBPs) among CSPs since 2007 and CCS programs since 2011. DMHSAS provided grant funding to select counties from 2006-2008 to implement EBPs for adults in CSPs and has more recently funded training for Supported Employment, but counties and CSPs have been on their own otherwise to select and implement EBPs. Community Support Programs (CSPs)
About 80 percent of CSPs offered at least one EBP to their consumers and many (almost one in every five CSPs) offered five or more EBPs. The types of EBPs offered by CSPs over the past three years (2011-2013) are displayed in Figure 15. Since the CSP model was originally based on a variation of ACT, it is not surprising that of the CSPs responding to the program surveys each year, Assertive Community Treatment (ACT) was the most common EBP, offered by about 60 percent of the programs. Integrated Dual Disorder Treatment (IDDT), Illness Management and Recovery (IMR), Supported Employment, and Permanent Supportive Housing were offered by about one third of the programs, while MedTEAM and Family Psychoeducation were even less common, offered by less than a quarter of CSPs. Very few programs (about 10 percent) offered any EBPs beyond the list provided in the survey. However, several programs mentioned that they
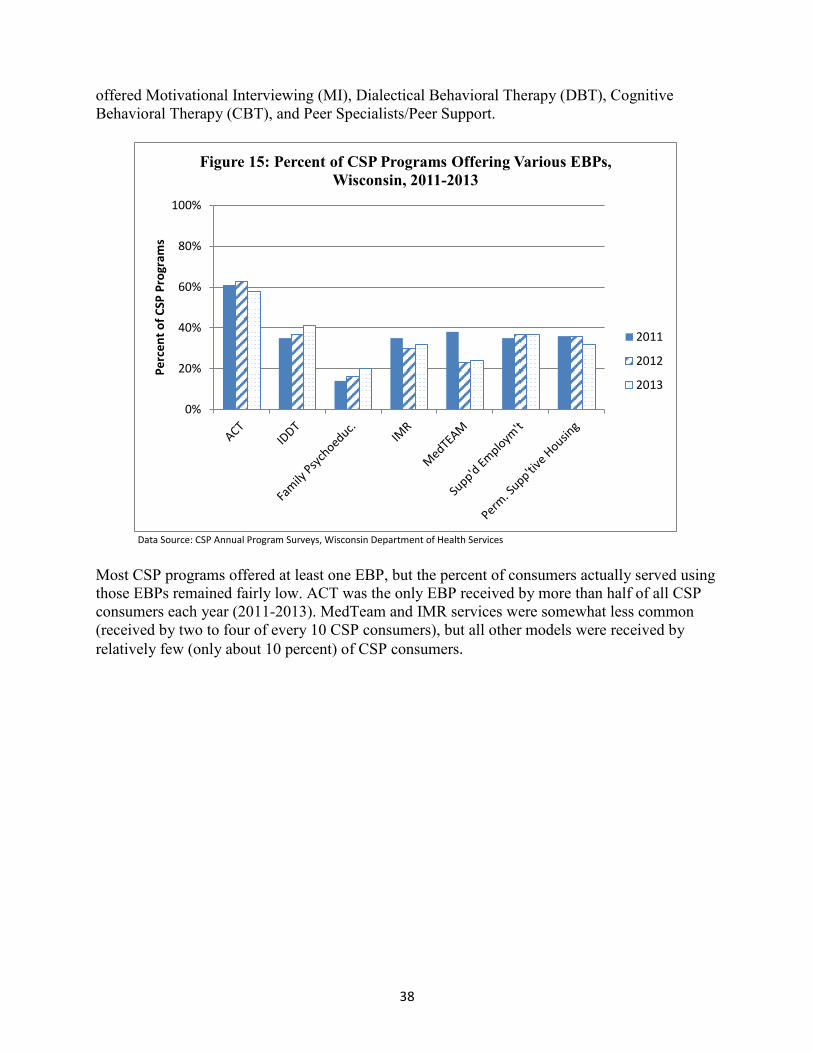
38
offered Motivational Interviewing (MI), Dialectical Behavioral Therapy (DBT), Cognitive Behavioral Therapy (CBT), and Peer Specialists/Peer Support.
Data Source: CSP Annual Program Surveys, Wisconsin Department of Health Services
Most CSP programs offered at least one EBP, but the percent of consumers actually served using those EBPs remained fairly low. ACT was the only EBP received by more than half of all CSP consumers each year (2011-2013). MedTeam and IMR services were somewhat less common (received by two to four of every 10 CSP consumers), but all other models were received by relatively few (only about 10 percent) of CSP consumers.
0%
20%
40%
60%
80%
100%
Perc
ent o
f CSP
Pro
gram
s Figure 15: Percent of CSP Programs Offering Various EBPs,
Wisconsin, 2011-2013
2011
2012
2013
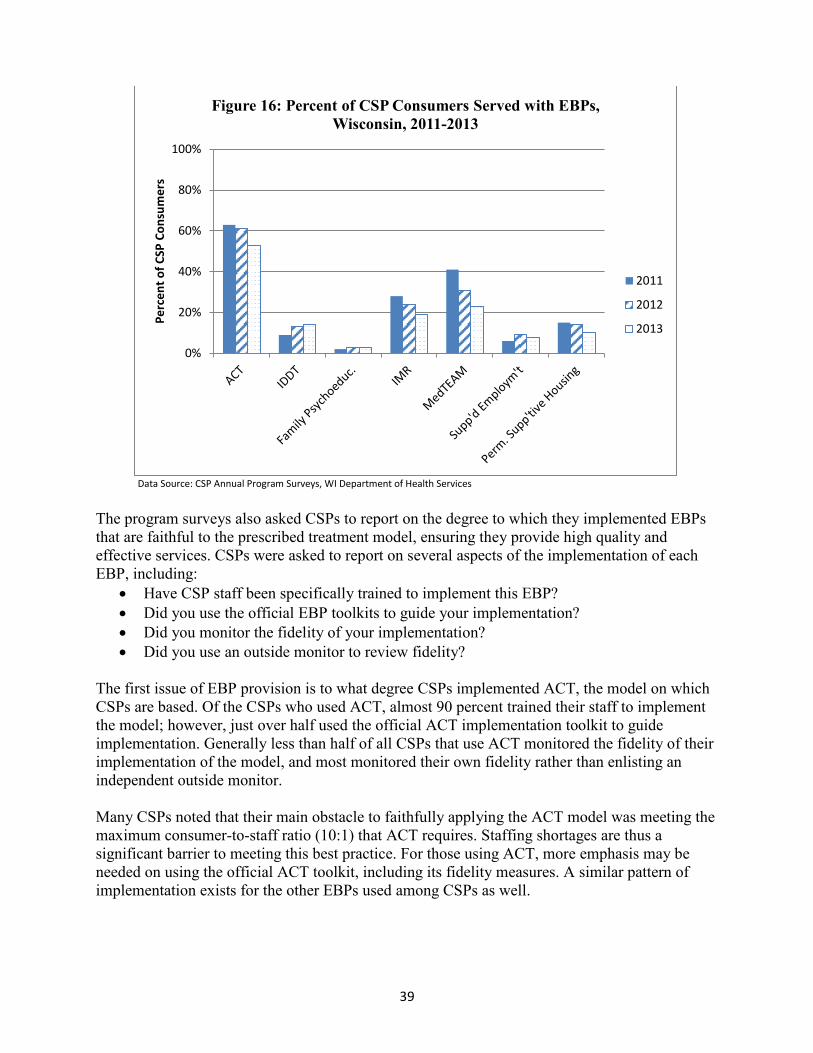
39
Data Source: CSP Annual Program Surveys, WI Department of Health Services
The program surveys also asked CSPs to report on the degree to which they implemented EBPs that are faithful to the prescribed treatment model, ensuring they provide high quality and effective services. CSPs were asked to report on several aspects of the implementation of each EBP, including:
• Have CSP staff been specifically trained to implement this EBP? • Did you use the official EBP toolkits to guide your implementation? • Did you monitor the fidelity of your implementation? • Did you use an outside monitor to review fidelity?
The first issue of EBP provision is to what degree CSPs implemented ACT, the model on which CSPs are based. Of the CSPs who used ACT, almost 90 percent trained their staff to implement the model; however, just over half used the official ACT implementation toolkit to guide implementation. Generally less than half of all CSPs that use ACT monitored the fidelity of their implementation of the model, and most monitored their own fidelity rather than enlisting an independent outside monitor. Many CSPs noted that their main obstacle to faithfully applying the ACT model was meeting the maximum consumer-to-staff ratio (10:1) that ACT requires. Staffing shortages are thus a significant barrier to meeting this best practice. For those using ACT, more emphasis may be needed on using the official ACT toolkit, including its fidelity measures. A similar pattern of implementation exists for the other EBPs used among CSPs as well.
0%
20%
40%
60%
80%
100%Pe
rcen
t of C
SP C
onsu
mer
s
Figure 16: Percent of CSP Consumers Served with EBPs, Wisconsin, 2011-2013
2011
2012
2013
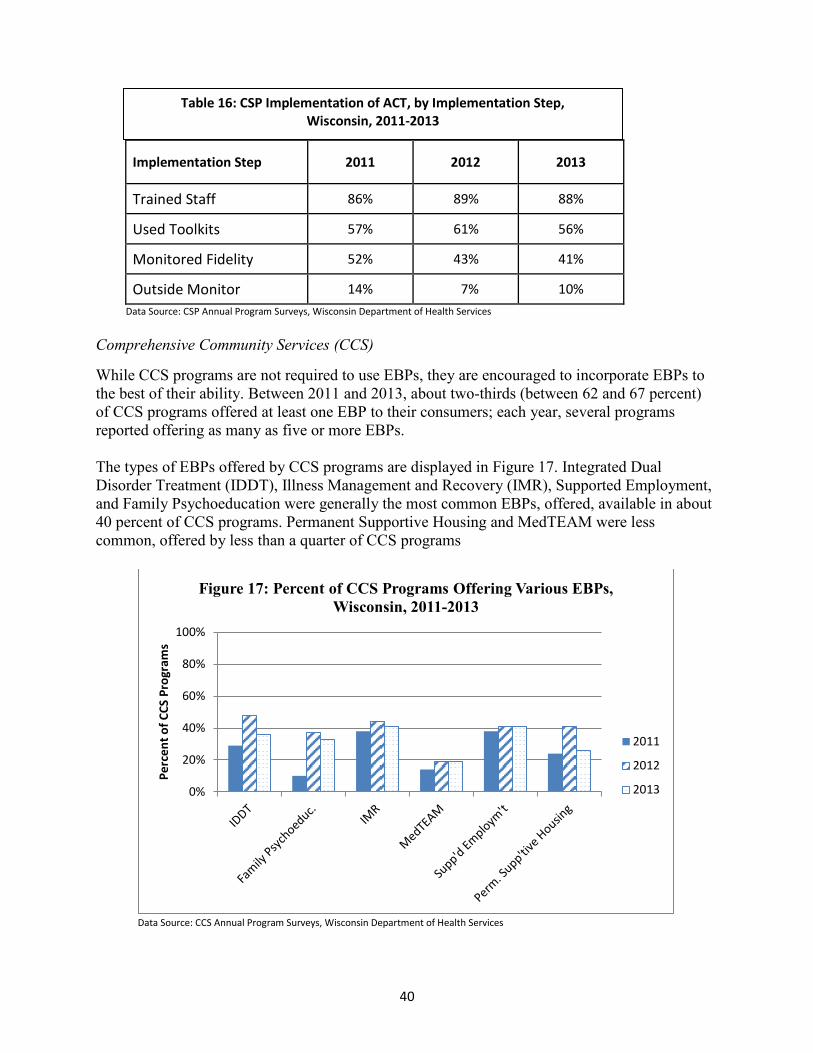
40
Implementation Step 2011 2012 2013
Trained Staff 86% 89% 88%
Used Toolkits 57% 61% 56%
Monitored Fidelity 52% 43% 41%
Outside Monitor 14% 7% 10% Data Source: CSP Annual Program Surveys, Wisconsin Department of Health Services Comprehensive Community Services (CCS)
While CCS programs are not required to use EBPs, they are encouraged to incorporate EBPs to the best of their ability. Between 2011 and 2013, about two-thirds (between 62 and 67 percent) of CCS programs offered at least one EBP to their consumers; each year, several programs reported offering as many as five or more EBPs. The types of EBPs offered by CCS programs are displayed in Figure 17. Integrated Dual Disorder Treatment (IDDT), Illness Management and Recovery (IMR), Supported Employment, and Family Psychoeducation were generally the most common EBPs, offered, available in about 40 percent of CCS programs. Permanent Supportive Housing and MedTEAM were less common, offered by less than a quarter of CCS programs
Data Source: CCS Annual Program Surveys, Wisconsin Department of Health Services
0%
20%
40%
60%
80%
100%
Perc
ent o
f CCS
Pro
gram
s
Figure 17: Percent of CCS Programs Offering Various EBPs, Wisconsin, 2011-2013
2011
2012
2013
Table 16: CSP Implementation of ACT, by Implementation Step, Wisconsin, 2011-2013
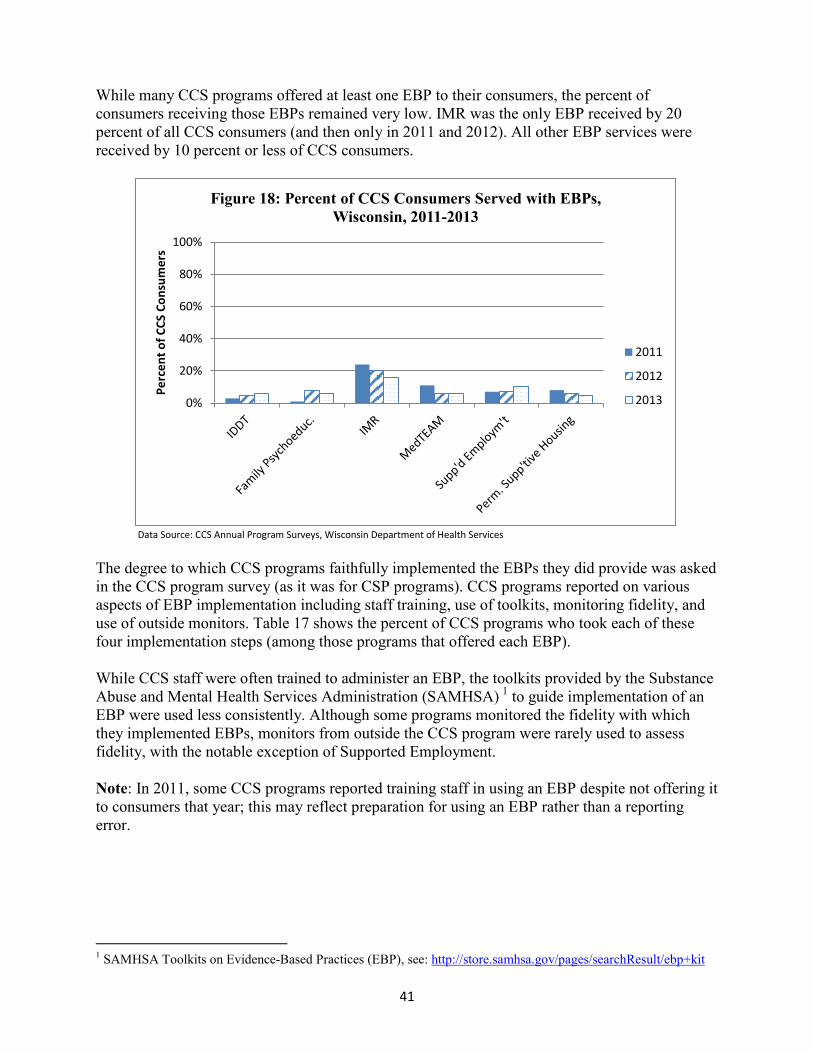
41
While many CCS programs offered at least one EBP to their consumers, the percent of consumers receiving those EBPs remained very low. IMR was the only EBP received by 20 percent of all CCS consumers (and then only in 2011 and 2012). All other EBP services were received by 10 percent or less of CCS consumers.
Data Source: CCS Annual Program Surveys, Wisconsin Department of Health Services
The degree to which CCS programs faithfully implemented the EBPs they did provide was asked in the CCS program survey (as it was for CSP programs). CCS programs reported on various aspects of EBP implementation including staff training, use of toolkits, monitoring fidelity, and use of outside monitors. Table 17 shows the percent of CCS programs who took each of these four implementation steps (among those programs that offered each EBP). While CCS staff were often trained to administer an EBP, the toolkits provided by the Substance Abuse and Mental Health Services Administration (SAMHSA) 1 to guide implementation of an EBP were used less consistently. Although some programs monitored the fidelity with which they implemented EBPs, monitors from outside the CCS program were rarely used to assess fidelity, with the notable exception of Supported Employment. Note: In 2011, some CCS programs reported training staff in using an EBP despite not offering it to consumers that year; this may reflect preparation for using an EBP rather than a reporting error.
1 SAMHSA Toolkits on Evidence-Based Practices (EBP), see: http://store.samhsa.gov/pages/searchResult/ebp+kit
0%
20%
40%
60%
80%
100%
Perc
ent o
f CCS
Con
sum
ers
Figure 18: Percent of CCS Consumers Served with EBPs, Wisconsin, 2011-2013
2011
2012
2013
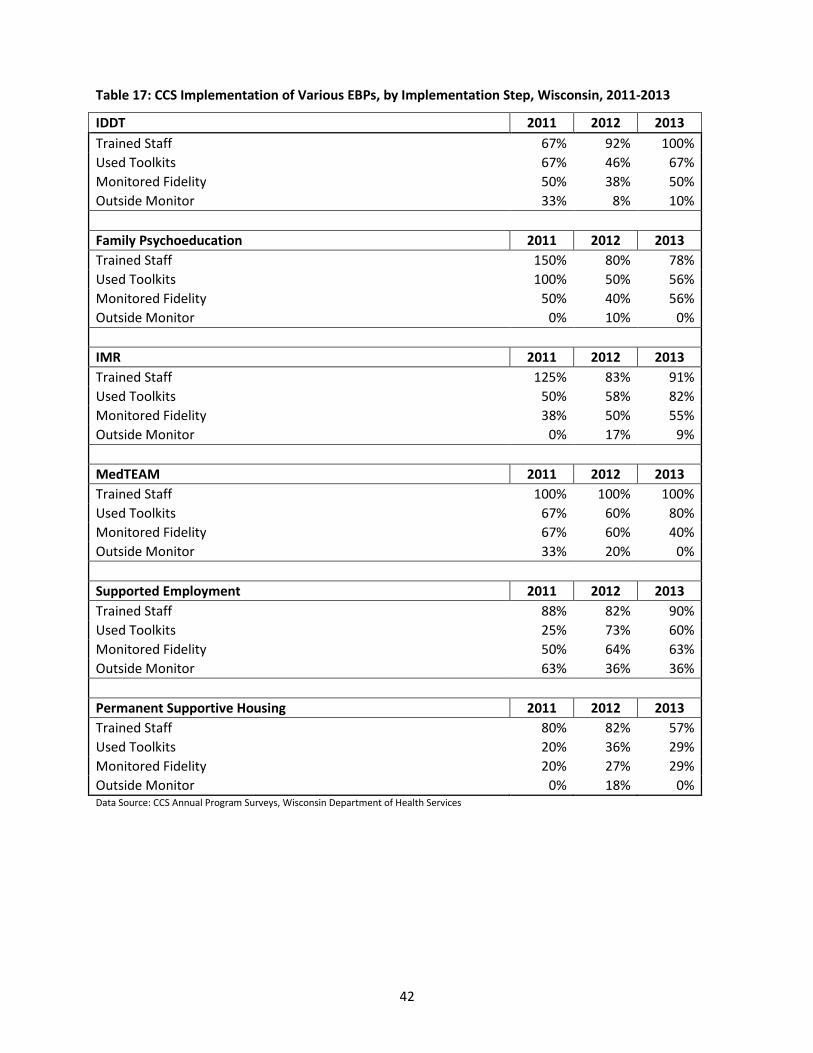
42
Table 17: CCS Implementation of Various EBPs, by Implementation Step, Wisconsin, 2011-2013
Data Source: CCS Annual Program Surveys, Wisconsin Department of Health Services
IDDT 2011 2012 2013 Trained Staff 67% 92% 100% Used Toolkits 67% 46% 67% Monitored Fidelity 50% 38% 50% Outside Monitor 33% 8% 10%
Family Psychoeducation 2011 2012 2013 Trained Staff 150% 80% 78% Used Toolkits 100% 50% 56% Monitored Fidelity 50% 40% 56% Outside Monitor 0% 10% 0%
IMR 2011 2012 2013 Trained Staff 125% 83% 91% Used Toolkits 50% 58% 82% Monitored Fidelity 38% 50% 55% Outside Monitor 0% 17% 9%
MedTEAM 2011 2012 2013 Trained Staff 100% 100% 100% Used Toolkits 67% 60% 80% Monitored Fidelity 67% 60% 40% Outside Monitor 33% 20% 0%
Supported Employment 2011 2012 2013 Trained Staff 88% 82% 90% Used Toolkits 25% 73% 60% Monitored Fidelity 50% 64% 63% Outside Monitor 63% 36% 36%
Permanent Supportive Housing 2011 2012 2013 Trained Staff 80% 82% 57% Used Toolkits 20% 36% 29% Monitored Fidelity 20% 27% 29% Outside Monitor 0% 18% 0%
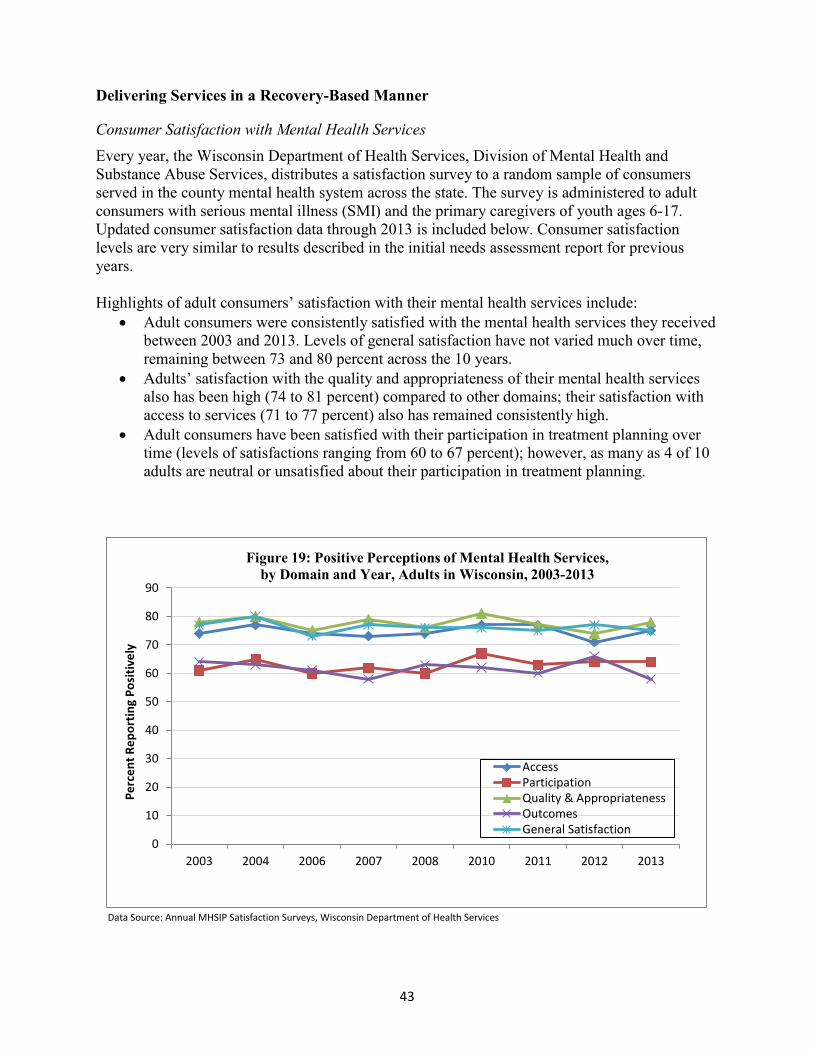
43
Delivering Services in a Recovery-Based Manner
Consumer Satisfaction with Mental Health Services Every year, the Wisconsin Department of Health Services, Division of Mental Health and Substance Abuse Services, distributes a satisfaction survey to a random sample of consumers served in the county mental health system across the state. The survey is administered to adult consumers with serious mental illness (SMI) and the primary caregivers of youth ages 6-17. Updated consumer satisfaction data through 2013 is included below. Consumer satisfaction levels are very similar to results described in the initial needs assessment report for previous years. Highlights of adult consumers’ satisfaction with their mental health services include:
• Adult consumers were consistently satisfied with the mental health services they received between 2003 and 2013. Levels of general satisfaction have not varied much over time, remaining between 73 and 80 percent across the 10 years.
• Adults’ satisfaction with the quality and appropriateness of their mental health services also has been high (74 to 81 percent) compared to other domains; their satisfaction with access to services (71 to 77 percent) also has remained consistently high.
• Adult consumers have been satisfied with their participation in treatment planning over time (levels of satisfactions ranging from 60 to 67 percent); however, as many as 4 of 10 adults are neutral or unsatisfied about their participation in treatment planning.
Data Source: Annual MHSIP Satisfaction Surveys, Wisconsin Department of Health Services
0
10
20
30
40
50
60
70
80
90
2003 2004 2006 2007 2008 2010 2011 2012 2013
Perc
ent R
epor
ting
Posi
tivel
y
Figure 19: Positive Perceptions of Mental Health Services, by Domain and Year, Adults in Wisconsin, 2003-2013
AccessParticipationQuality & AppropriatenessOutcomesGeneral Satisfaction
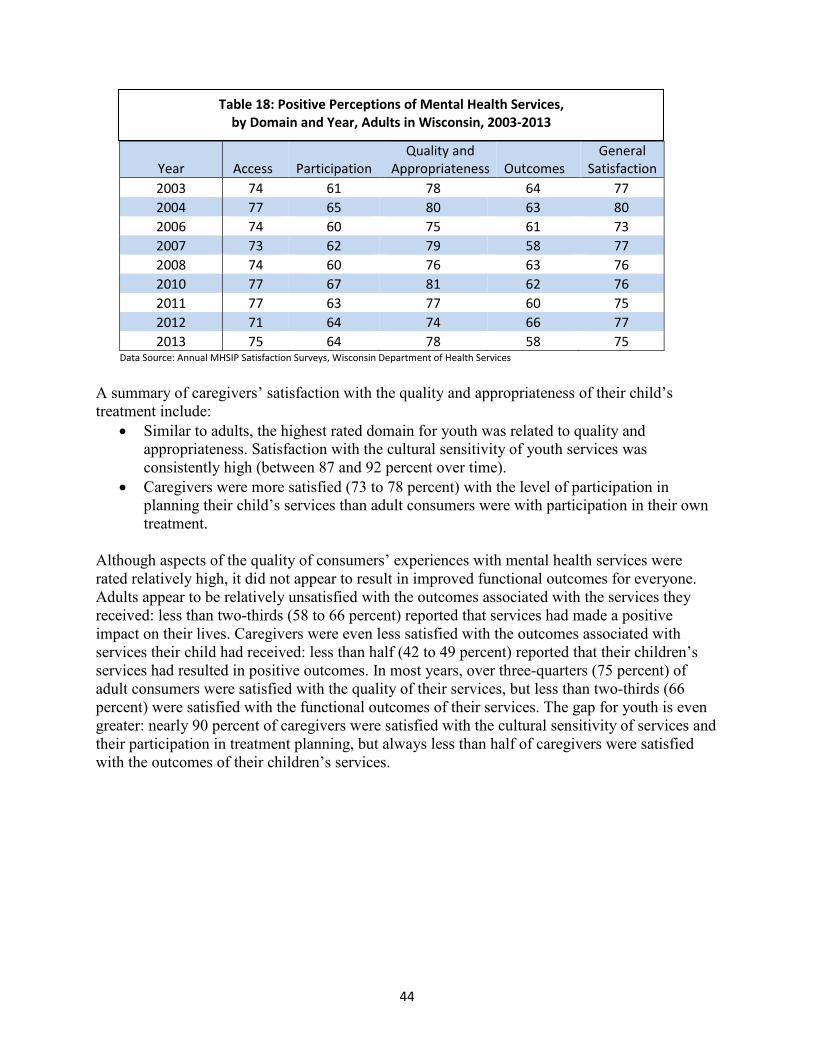
44
Year Access Participation Quality and
Appropriateness Outcomes General
Satisfaction 2003 74 61 78 64 77 2004 77 65 80 63 80 2006 74 60 75 61 73 2007 73 62 79 58 77 2008 74 60 76 63 76 2010 77 67 81 62 76 2011 77 63 77 60 75 2012 71 64 74 66 77 2013 75 64 78 58 75
Data Source: Annual MHSIP Satisfaction Surveys, Wisconsin Department of Health Services A summary of caregivers’ satisfaction with the quality and appropriateness of their child’s treatment include:
• Similar to adults, the highest rated domain for youth was related to quality and appropriateness. Satisfaction with the cultural sensitivity of youth services was consistently high (between 87 and 92 percent over time).
• Caregivers were more satisfied (73 to 78 percent) with the level of participation in planning their child’s services than adult consumers were with participation in their own treatment.
Although aspects of the quality of consumers’ experiences with mental health services were rated relatively high, it did not appear to result in improved functional outcomes for everyone. Adults appear to be relatively unsatisfied with the outcomes associated with the services they received: less than two-thirds (58 to 66 percent) reported that services had made a positive impact on their lives. Caregivers were even less satisfied with the outcomes associated with services their child had received: less than half (42 to 49 percent) reported that their children’s services had resulted in positive outcomes. In most years, over three-quarters (75 percent) of adult consumers were satisfied with the quality of their services, but less than two-thirds (66 percent) were satisfied with the functional outcomes of their services. The gap for youth is even greater: nearly 90 percent of caregivers were satisfied with the cultural sensitivity of services and their participation in treatment planning, but always less than half of caregivers were satisfied with the outcomes of their children’s services.
Table 18: Positive Perceptions of Mental Health Services, by Domain and Year, Adults in Wisconsin, 2003-2013
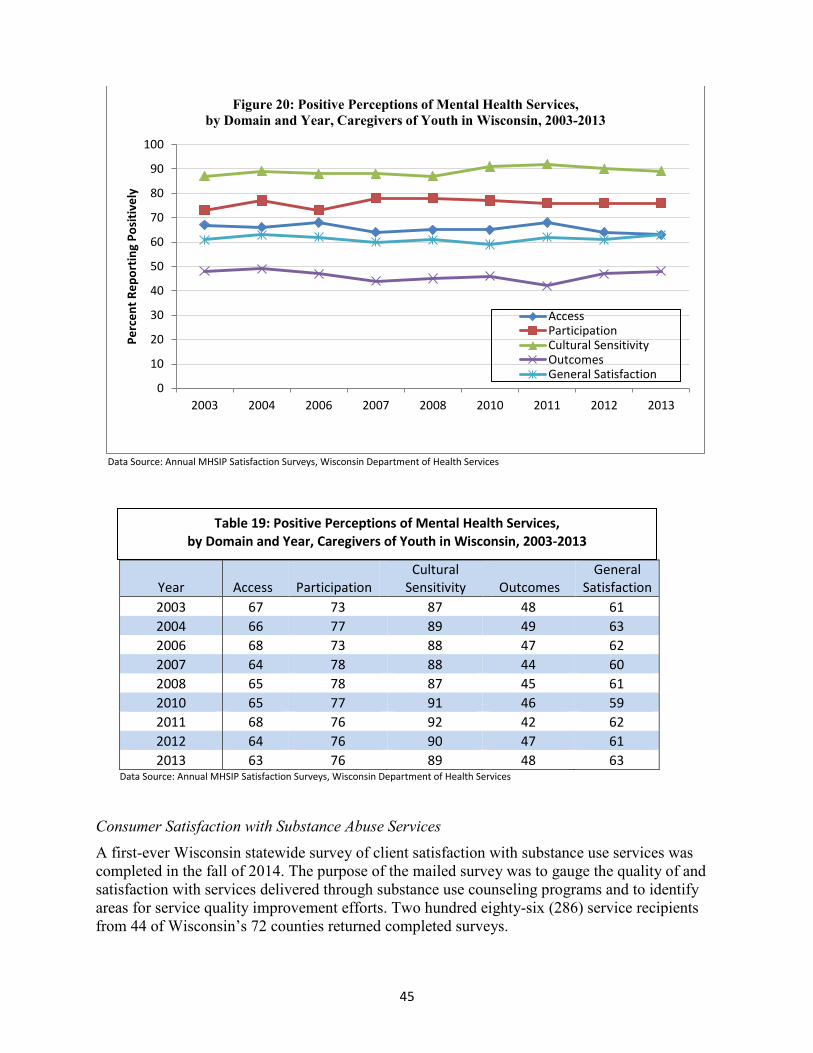
45
Data Source: Annual MHSIP Satisfaction Surveys, Wisconsin Department of Health Services
Year Access Participation Cultural
Sensitivity Outcomes General
Satisfaction 2003 67 73 87 48 61 2004 66 77 89 49 63 2006 68 73 88 47 62 2007 64 78 88 44 60 2008 65 78 87 45 61 2010 65 77 91 46 59 2011 68 76 92 42 62 2012 64 76 90 47 61 2013 63 76 89 48 63
Data Source: Annual MHSIP Satisfaction Surveys, Wisconsin Department of Health Services
Consumer Satisfaction with Substance Abuse Services A first-ever Wisconsin statewide survey of client satisfaction with substance use services was completed in the fall of 2014. The purpose of the mailed survey was to gauge the quality of and satisfaction with services delivered through substance use counseling programs and to identify areas for service quality improvement efforts. Two hundred eighty-six (286) service recipients from 44 of Wisconsin’s 72 counties returned completed surveys.
0
10
20
30
40
50
60
70
80
90
100
2003 2004 2006 2007 2008 2010 2011 2012 2013
Perc
ent R
epor
ting
Posi
tivel
y
Figure 20: Positive Perceptions of Mental Health Services, by Domain and Year, Caregivers of Youth in Wisconsin, 2003-2013
AccessParticipationCultural SensitivityOutcomesGeneral Satisfaction
Table 19: Positive Perceptions of Mental Health Services, by Domain and Year, Caregivers of Youth in Wisconsin, 2003-2013
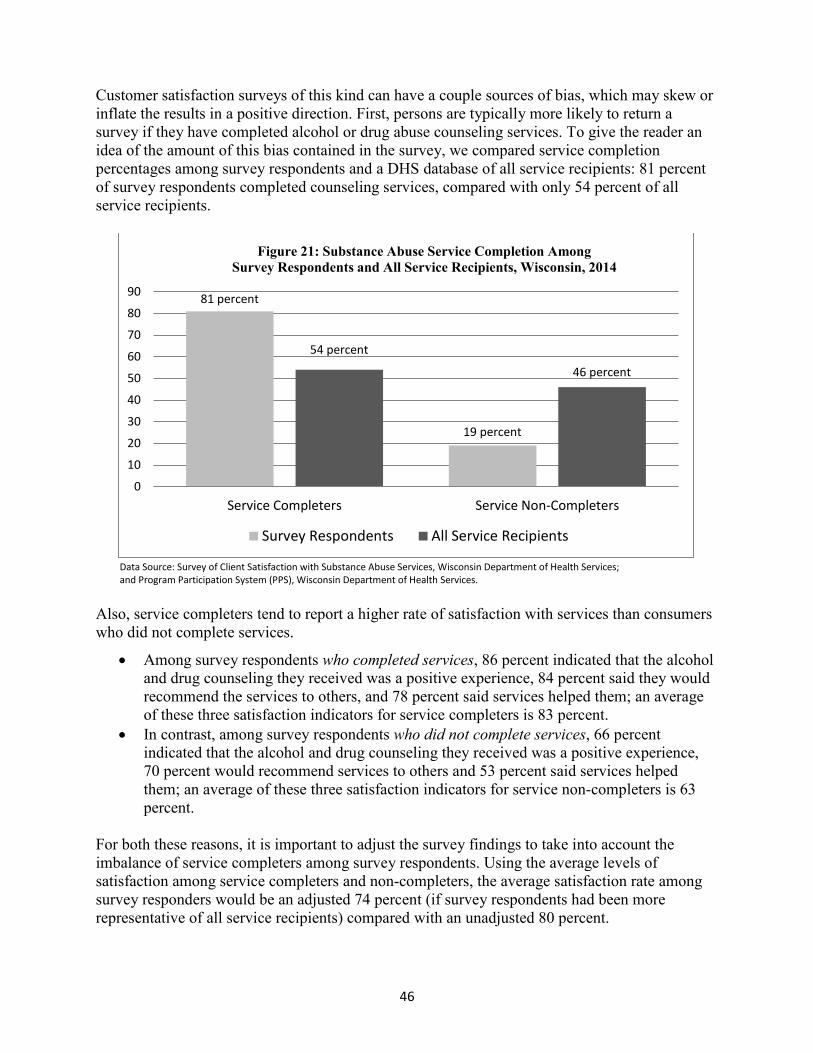
46
Customer satisfaction surveys of this kind can have a couple sources of bias, which may skew or inflate the results in a positive direction. First, persons are typically more likely to return a survey if they have completed alcohol or drug abuse counseling services. To give the reader an idea of the amount of this bias contained in the survey, we compared service completion percentages among survey respondents and a DHS database of all service recipients: 81 percent of survey respondents completed counseling services, compared with only 54 percent of all service recipients.
Data Source: Survey of Client Satisfaction with Substance Abuse Services, Wisconsin Department of Health Services; and Program Participation System (PPS), Wisconsin Department of Health Services.
Also, service completers tend to report a higher rate of satisfaction with services than consumers who did not complete services.
• Among survey respondents who completed services, 86 percent indicated that the alcohol and drug counseling they received was a positive experience, 84 percent said they would recommend the services to others, and 78 percent said services helped them; an average of these three satisfaction indicators for service completers is 83 percent.
• In contrast, among survey respondents who did not complete services, 66 percent indicated that the alcohol and drug counseling they received was a positive experience, 70 percent would recommend services to others and 53 percent said services helped them; an average of these three satisfaction indicators for service non-completers is 63 percent.
For both these reasons, it is important to adjust the survey findings to take into account the imbalance of service completers among survey respondents. Using the average levels of satisfaction among service completers and non-completers, the average satisfaction rate among survey responders would be an adjusted 74 percent (if survey respondents had been more representative of all service recipients) compared with an unadjusted 80 percent.
81 percent
19 percent
54 percent
46 percent
0
10
20
30
40
50
60
70
80
90
Service Completers Service Non-Completers
Figure 21: Substance Abuse Service Completion Among Survey Respondents and All Service Recipients, Wisconsin, 2014
Survey Respondents All Service Recipients
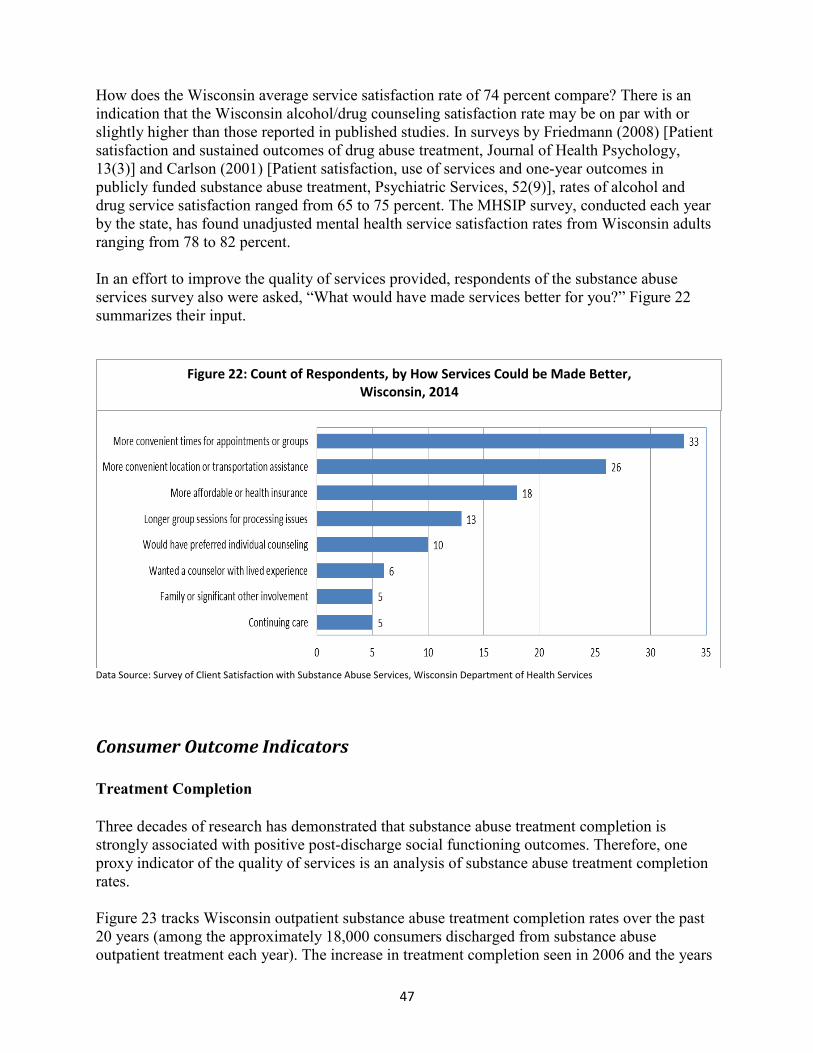
47
How does the Wisconsin average service satisfaction rate of 74 percent compare? There is an indication that the Wisconsin alcohol/drug counseling satisfaction rate may be on par with or slightly higher than those reported in published studies. In surveys by Friedmann (2008) [Patient satisfaction and sustained outcomes of drug abuse treatment, Journal of Health Psychology, 13(3)] and Carlson (2001) [Patient satisfaction, use of services and one-year outcomes in publicly funded substance abuse treatment, Psychiatric Services, 52(9)], rates of alcohol and drug service satisfaction ranged from 65 to 75 percent. The MHSIP survey, conducted each year by the state, has found unadjusted mental health service satisfaction rates from Wisconsin adults ranging from 78 to 82 percent. In an effort to improve the quality of services provided, respondents of the substance abuse services survey also were asked, “What would have made services better for you?” Figure 22 summarizes their input.
Data Source: Survey of Client Satisfaction with Substance Abuse Services, Wisconsin Department of Health Services
Consumer Outcome Indicators Treatment Completion Three decades of research has demonstrated that substance abuse treatment completion is strongly associated with positive post-discharge social functioning outcomes. Therefore, one proxy indicator of the quality of services is an analysis of substance abuse treatment completion rates. Figure 23 tracks Wisconsin outpatient substance abuse treatment completion rates over the past 20 years (among the approximately 18,000 consumers discharged from substance abuse outpatient treatment each year). The increase in treatment completion seen in 2006 and the years
Figure 22: Count of Respondents, by How Services Could be Made Better, Wisconsin, 2014
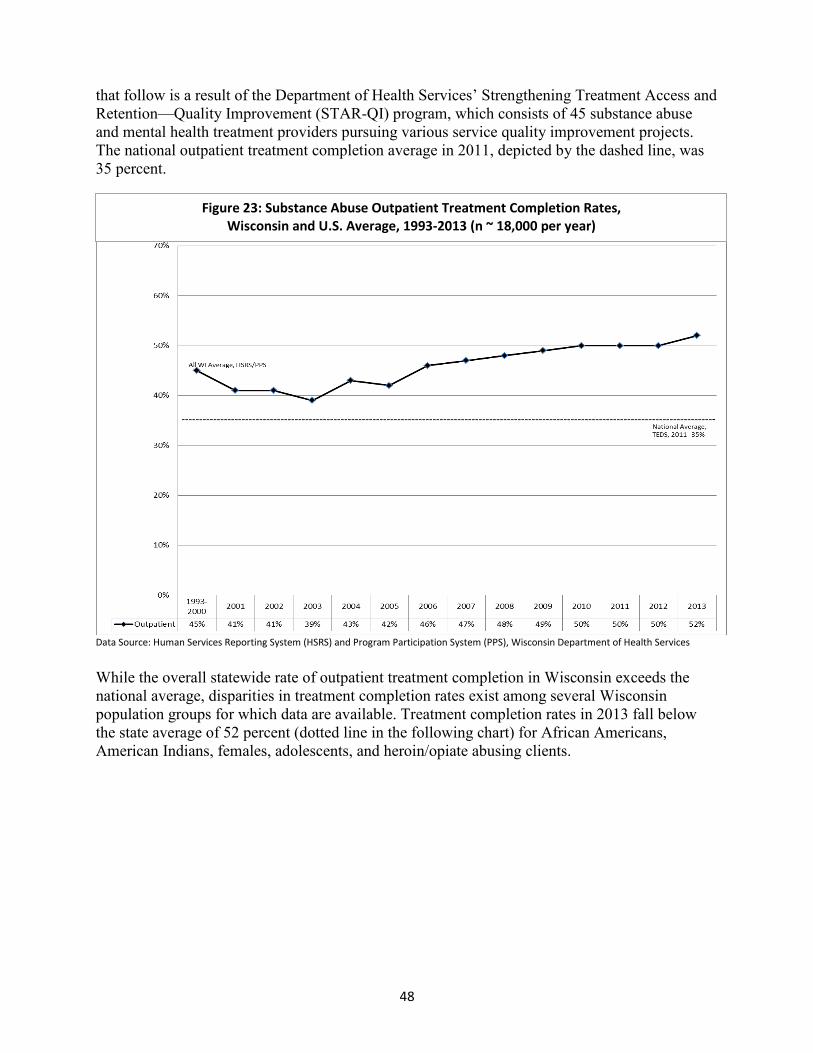
48
that follow is a result of the Department of Health Services’ Strengthening Treatment Access and Retention—Quality Improvement (STAR-QI) program, which consists of 45 substance abuse and mental health treatment providers pursuing various service quality improvement projects. The national outpatient treatment completion average in 2011, depicted by the dashed line, was 35 percent.
Data Source: Human Services Reporting System (HSRS) and Program Participation System (PPS), Wisconsin Department of Health Services
While the overall statewide rate of outpatient treatment completion in Wisconsin exceeds the national average, disparities in treatment completion rates exist among several Wisconsin population groups for which data are available. Treatment completion rates in 2013 fall below the state average of 52 percent (dotted line in the following chart) for African Americans, American Indians, females, adolescents, and heroin/opiate abusing clients.
Figure 23: Substance Abuse Outpatient Treatment Completion Rates, Wisconsin and U.S. Average, 1993-2013 (n ~ 18,000 per year)
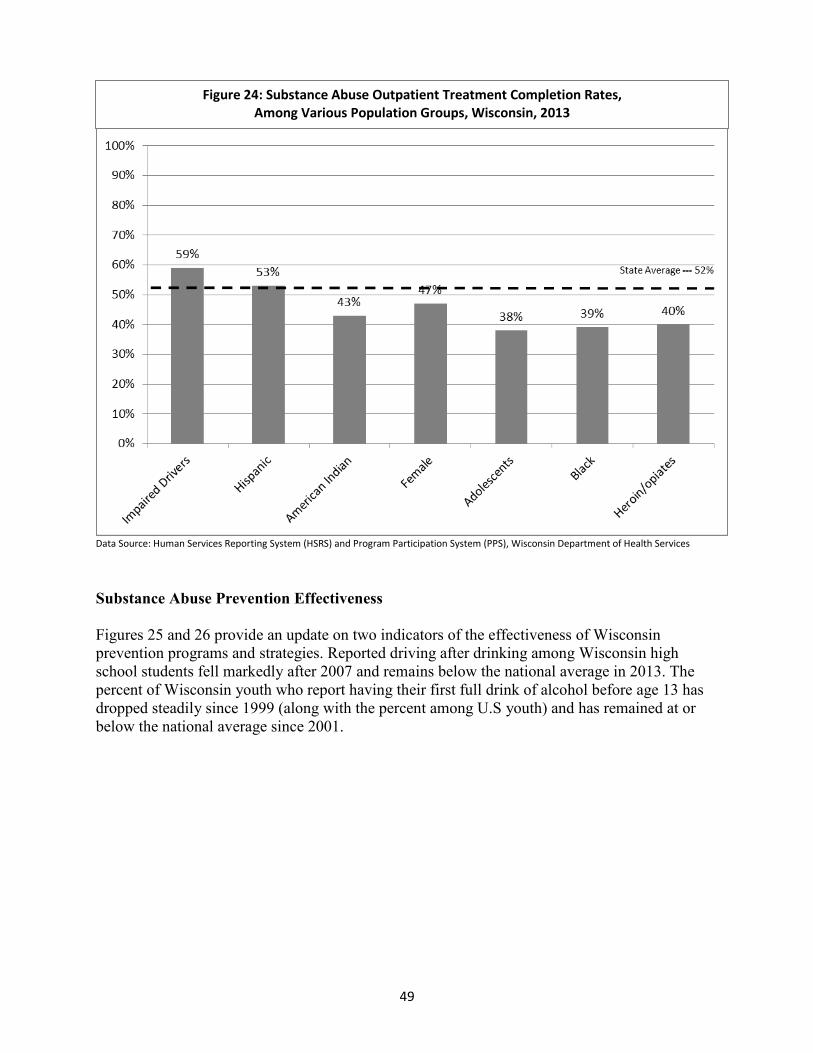
49
Data Source: Human Services Reporting System (HSRS) and Program Participation System (PPS), Wisconsin Department of Health Services
Substance Abuse Prevention Effectiveness Figures 25 and 26 provide an update on two indicators of the effectiveness of Wisconsin prevention programs and strategies. Reported driving after drinking among Wisconsin high school students fell markedly after 2007 and remains below the national average in 2013. The percent of Wisconsin youth who report having their first full drink of alcohol before age 13 has dropped steadily since 1999 (along with the percent among U.S youth) and has remained at or below the national average since 2001.
Figure 24: Substance Abuse Outpatient Treatment Completion Rates, Among Various Population Groups, Wisconsin, 2013
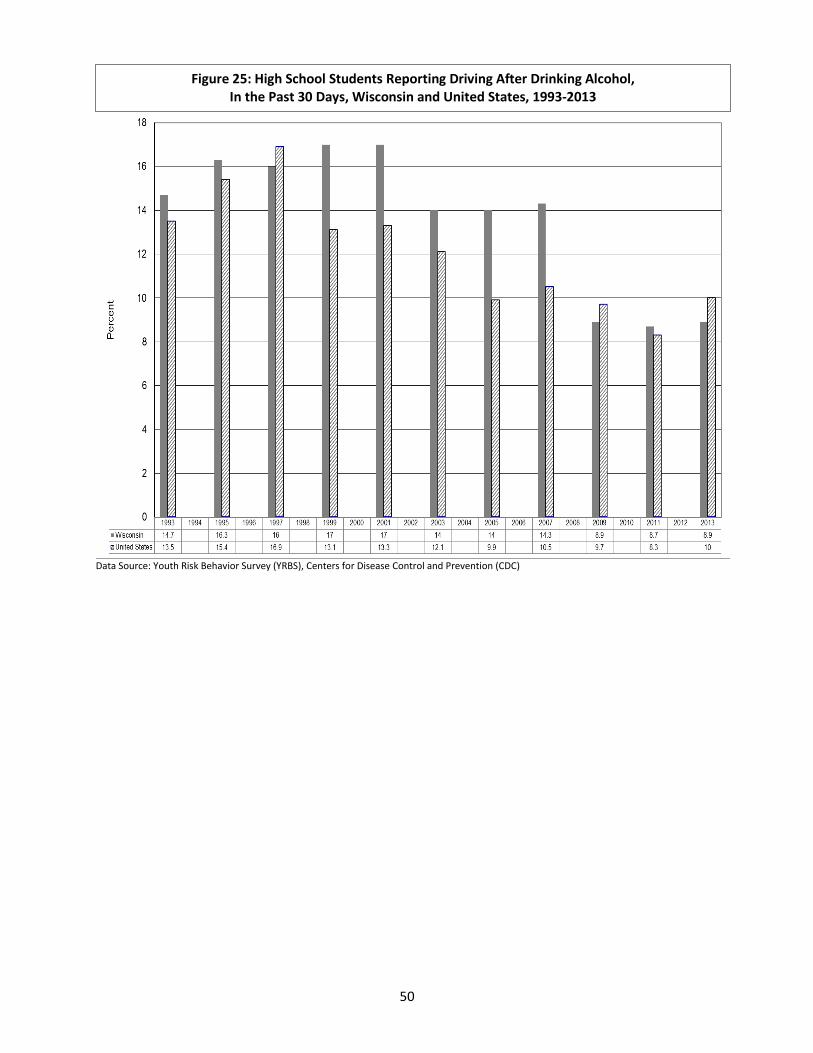
50
Data Source: Youth Risk Behavior Survey (YRBS), Centers for Disease Control and Prevention (CDC)
Figure 25: High School Students Reporting Driving After Drinking Alcohol, In the Past 30 Days, Wisconsin and United States, 1993-2013
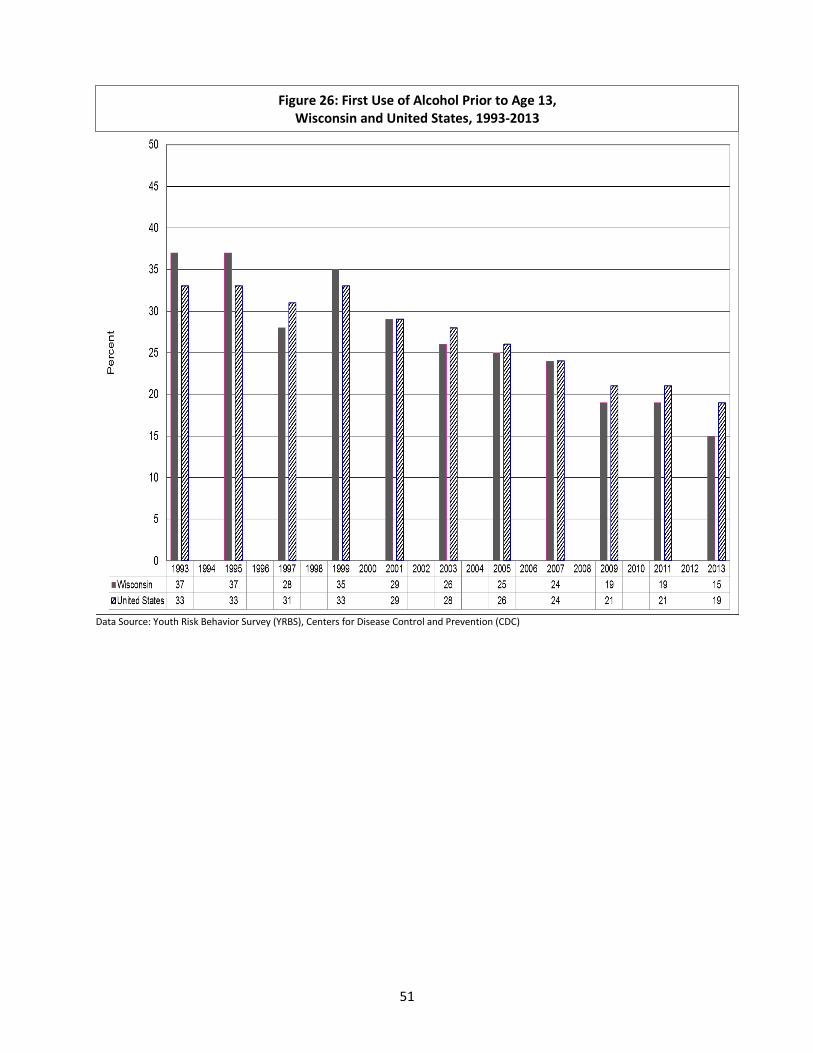
51
Data Source: Youth Risk Behavior Survey (YRBS), Centers for Disease Control and Prevention (CDC)
Figure 26: First Use of Alcohol Prior to Age 13, Wisconsin and United States, 1993-2013
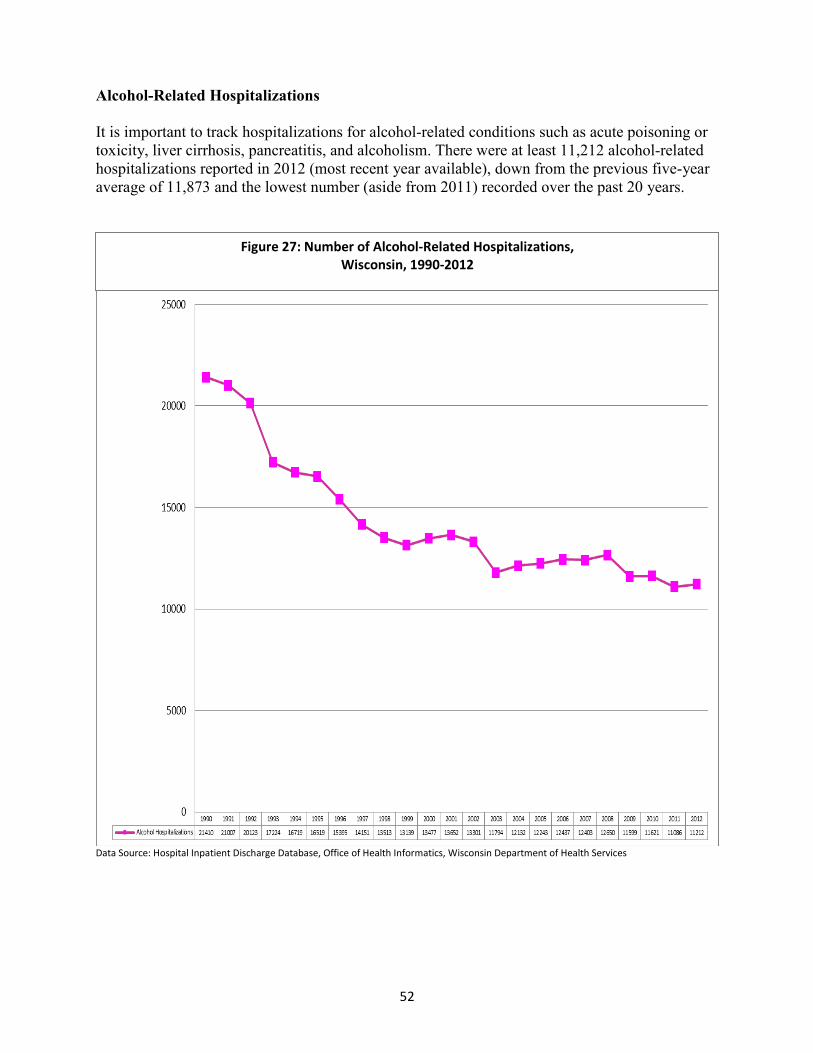
52
Alcohol-Related Hospitalizations It is important to track hospitalizations for alcohol-related conditions such as acute poisoning or toxicity, liver cirrhosis, pancreatitis, and alcoholism. There were at least 11,212 alcohol-related hospitalizations reported in 2012 (most recent year available), down from the previous five-year average of 11,873 and the lowest number (aside from 2011) recorded over the past 20 years.
Data Source: Hospital Inpatient Discharge Database, Office of Health Informatics, Wisconsin Department of Health Services
Figure 27: Number of Alcohol-Related Hospitalizations, Wisconsin, 1990-2012
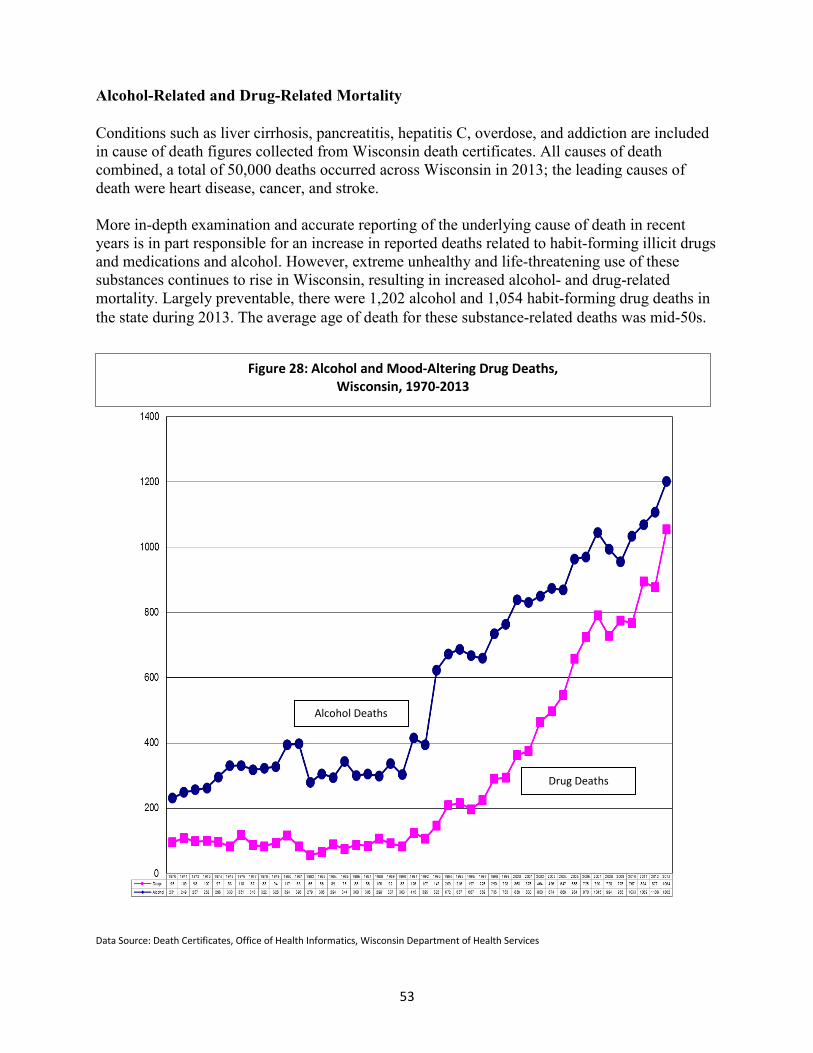
53
Alcohol-Related and Drug-Related Mortality Conditions such as liver cirrhosis, pancreatitis, hepatitis C, overdose, and addiction are included in cause of death figures collected from Wisconsin death certificates. All causes of death combined, a total of 50,000 deaths occurred across Wisconsin in 2013; the leading causes of death were heart disease, cancer, and stroke. More in-depth examination and accurate reporting of the underlying cause of death in recent years is in part responsible for an increase in reported deaths related to habit-forming illicit drugs and medications and alcohol. However, extreme unhealthy and life-threatening use of these substances continues to rise in Wisconsin, resulting in increased alcohol- and drug-related mortality. Largely preventable, there were 1,202 alcohol and 1,054 habit-forming drug deaths in the state during 2013. The average age of death for these substance-related deaths was mid-50s.
Data Source: Death Certificates, Office of Health Informatics, Wisconsin Department of Health Services
Figure 28: Alcohol and Mood-Altering Drug Deaths, Wisconsin, 1970-2013
Drug Deaths
Alcohol Deaths
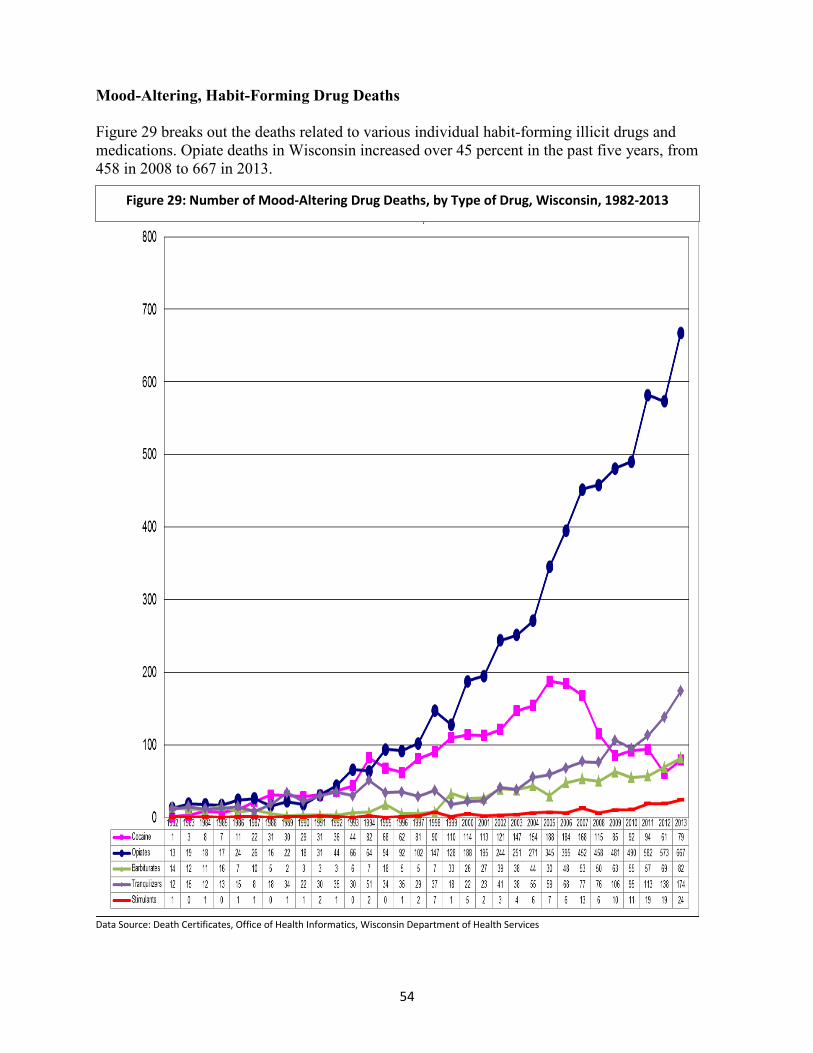
54
Mood-Altering, Habit-Forming Drug Deaths Figure 29 breaks out the deaths related to various individual habit-forming illicit drugs and medications. Opiate deaths in Wisconsin increased over 45 percent in the past five years, from 458 in 2008 to 667 in 2013.
Data Source: Death Certificates, Office of Health Informatics, Wisconsin Department of Health Services
Figure 29: Number of Mood-Altering Drug Deaths, by Type of Drug, Wisconsin, 1982-2013
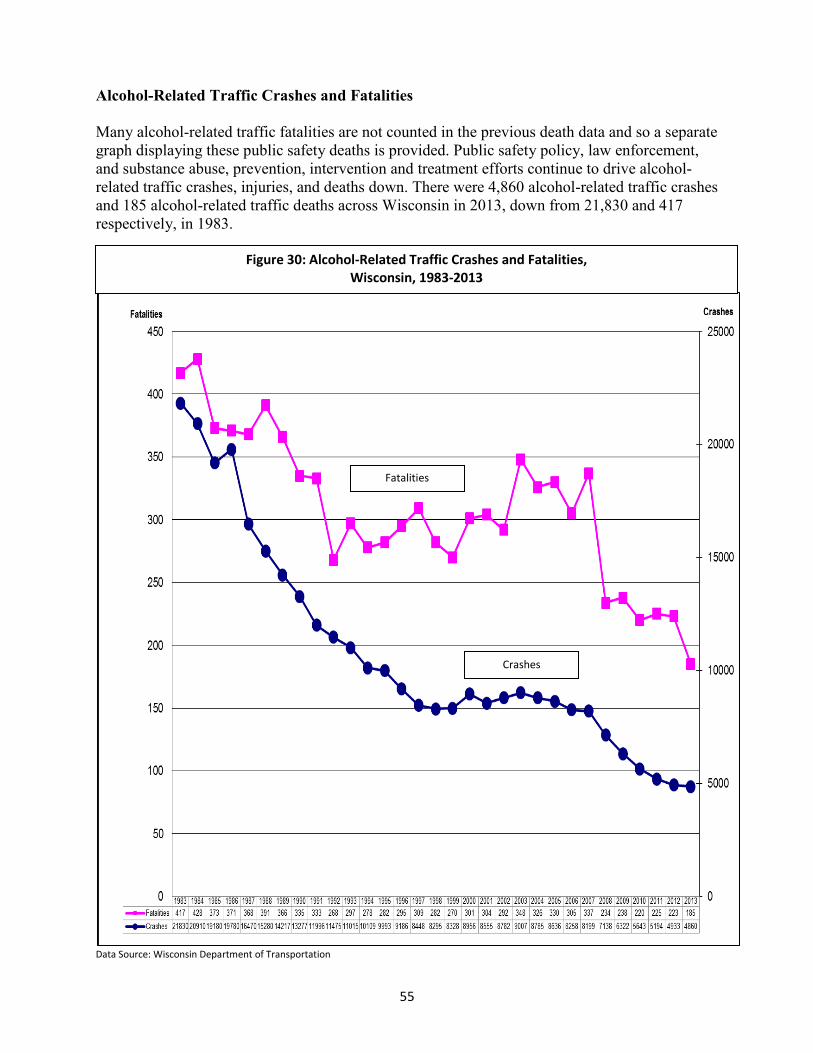
55
Alcohol-Related Traffic Crashes and Fatalities Many alcohol-related traffic fatalities are not counted in the previous death data and so a separate graph displaying these public safety deaths is provided. Public safety policy, law enforcement, and substance abuse, prevention, intervention and treatment efforts continue to drive alcohol-related traffic crashes, injuries, and deaths down. There were 4,860 alcohol-related traffic crashes and 185 alcohol-related traffic deaths across Wisconsin in 2013, down from 21,830 and 417 respectively, in 1983.
Data Source: Wisconsin Department of Transportation
Crashes
Fatalities
Figure 30: Alcohol-Related Traffic Crashes and Fatalities, Wisconsin, 1983-2013
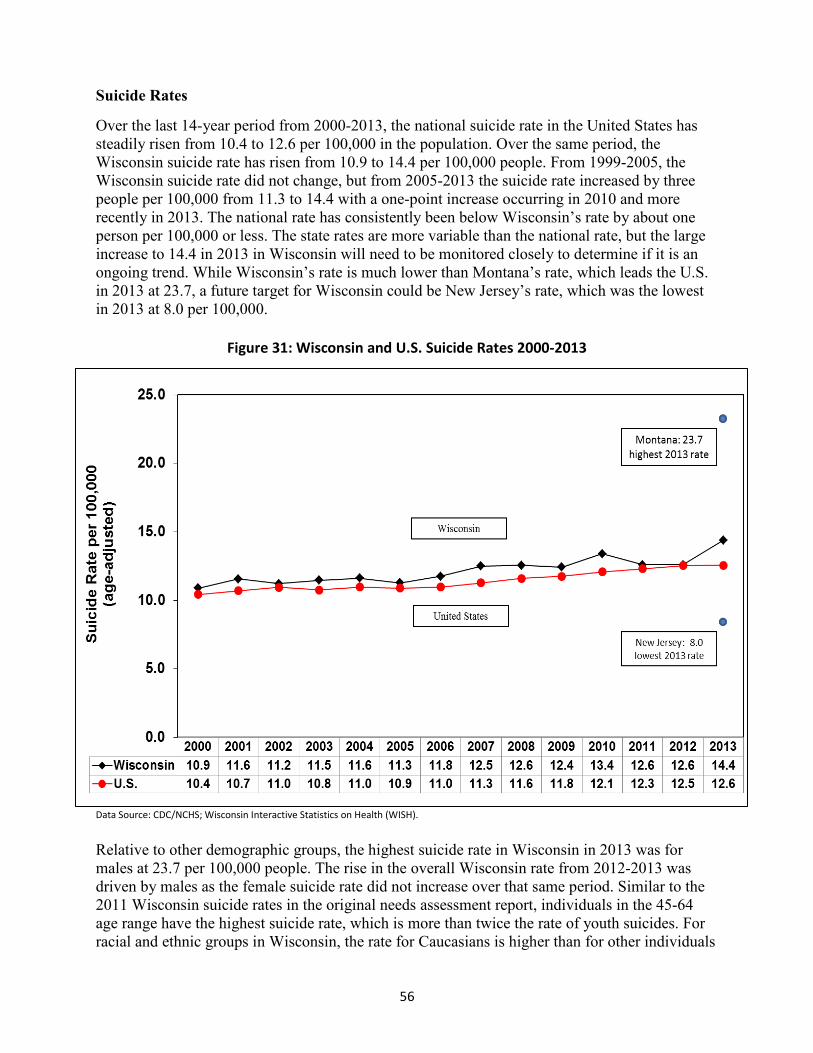
56
Suicide Rates
Over the last 14-year period from 2000-2013, the national suicide rate in the United States has steadily risen from 10.4 to 12.6 per 100,000 in the population. Over the same period, the Wisconsin suicide rate has risen from 10.9 to 14.4 per 100,000 people. From 1999-2005, the Wisconsin suicide rate did not change, but from 2005-2013 the suicide rate increased by three people per 100,000 from 11.3 to 14.4 with a one-point increase occurring in 2010 and more recently in 2013. The national rate has consistently been below Wisconsin’s rate by about one person per 100,000 or less. The state rates are more variable than the national rate, but the large increase to 14.4 in 2013 in Wisconsin will need to be monitored closely to determine if it is an ongoing trend. While Wisconsin’s rate is much lower than Montana’s rate, which leads the U.S. in 2013 at 23.7, a future target for Wisconsin could be New Jersey’s rate, which was the lowest in 2013 at 8.0 per 100,000.
Figure 31: Wisconsin and U.S. Suicide Rates 2000-2013
Data Source: CDC/NCHS; Wisconsin Interactive Statistics on Health (WISH).
Relative to other demographic groups, the highest suicide rate in Wisconsin in 2013 was for males at 23.7 per 100,000 people. The rise in the overall Wisconsin rate from 2012-2013 was driven by males as the female suicide rate did not increase over that same period. Similar to the 2011 Wisconsin suicide rates in the original needs assessment report, individuals in the 45-64 age range have the highest suicide rate, which is more than twice the rate of youth suicides. For racial and ethnic groups in Wisconsin, the rate for Caucasians is higher than for other individuals
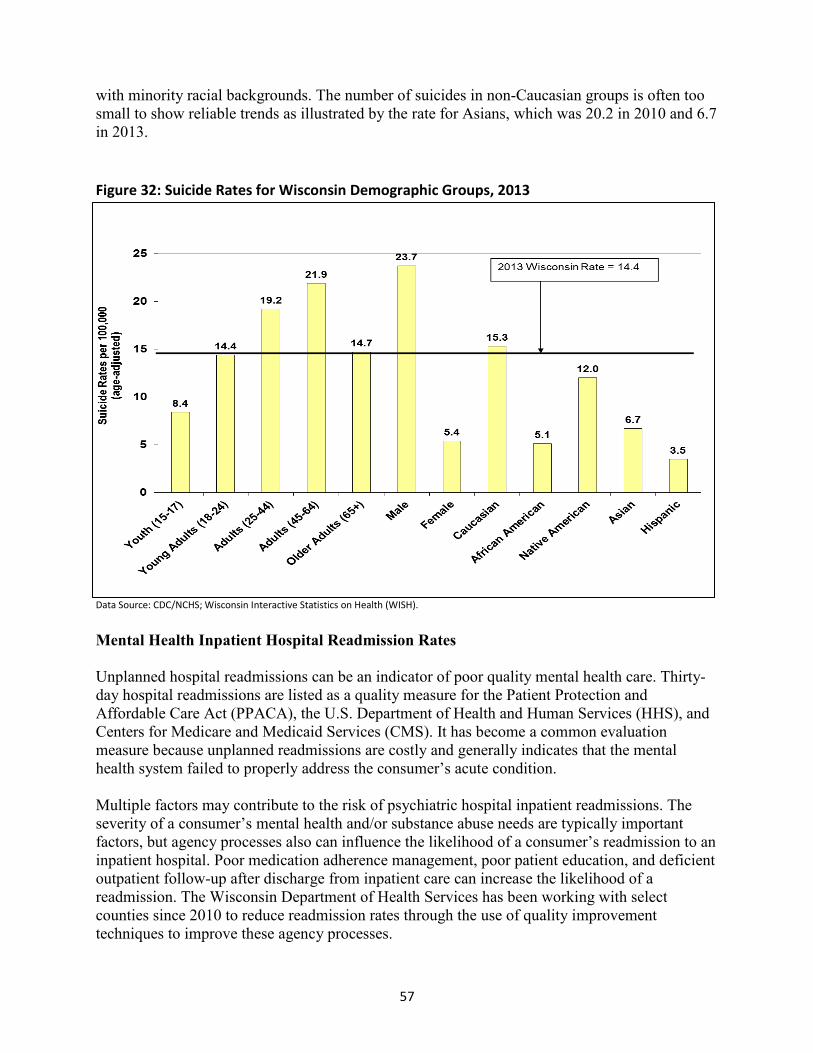
57
with minority racial backgrounds. The number of suicides in non-Caucasian groups is often too small to show reliable trends as illustrated by the rate for Asians, which was 20.2 in 2010 and 6.7 in 2013.
Figure 32: Suicide Rates for Wisconsin Demographic Groups, 2013
Data Source: CDC/NCHS; Wisconsin Interactive Statistics on Health (WISH).
Mental Health Inpatient Hospital Readmission Rates Unplanned hospital readmissions can be an indicator of poor quality mental health care. Thirty-day hospital readmissions are listed as a quality measure for the Patient Protection and Affordable Care Act (PPACA), the U.S. Department of Health and Human Services (HHS), and Centers for Medicare and Medicaid Services (CMS). It has become a common evaluation measure because unplanned readmissions are costly and generally indicates that the mental health system failed to properly address the consumer’s acute condition. Multiple factors may contribute to the risk of psychiatric hospital inpatient readmissions. The severity of a consumer’s mental health and/or substance abuse needs are typically important factors, but agency processes also can influence the likelihood of a consumer’s readmission to an inpatient hospital. Poor medication adherence management, poor patient education, and deficient outpatient follow-up after discharge from inpatient care can increase the likelihood of a readmission. The Wisconsin Department of Health Services has been working with select counties since 2010 to reduce readmission rates through the use of quality improvement techniques to improve these agency processes.
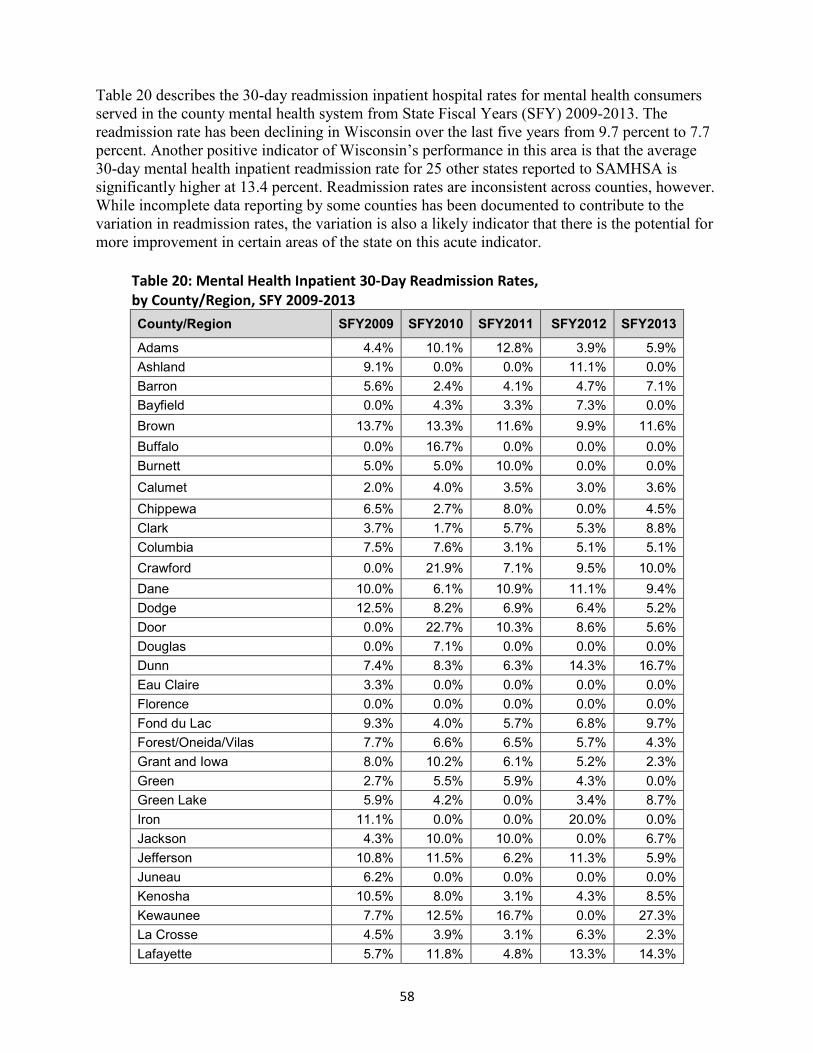
58
Table 20 describes the 30-day readmission inpatient hospital rates for mental health consumers served in the county mental health system from State Fiscal Years (SFY) 2009-2013. The readmission rate has been declining in Wisconsin over the last five years from 9.7 percent to 7.7 percent. Another positive indicator of Wisconsin’s performance in this area is that the average 30-day mental health inpatient readmission rate for 25 other states reported to SAMHSA is significantly higher at 13.4 percent. Readmission rates are inconsistent across counties, however. While incomplete data reporting by some counties has been documented to contribute to the variation in readmission rates, the variation is also a likely indicator that there is the potential for more improvement in certain areas of the state on this acute indicator.
Table 20: Mental Health Inpatient 30-Day Readmission Rates, by County/Region, SFY 2009-2013 County/Region SFY2009 SFY2010 SFY2011 SFY2012 SFY2013
Adams 4.4% 10.1% 12.8% 3.9% 5.9% Ashland 9.1% 0.0% 0.0% 11.1% 0.0% Barron 5.6% 2.4% 4.1% 4.7% 7.1% Bayfield 0.0% 4.3% 3.3% 7.3% 0.0% Brown 13.7% 13.3% 11.6% 9.9% 11.6% Buffalo 0.0% 16.7% 0.0% 0.0% 0.0% Burnett 5.0% 5.0% 10.0% 0.0% 0.0% Calumet 2.0% 4.0% 3.5% 3.0% 3.6% Chippewa 6.5% 2.7% 8.0% 0.0% 4.5% Clark 3.7% 1.7% 5.7% 5.3% 8.8% Columbia 7.5% 7.6% 3.1% 5.1% 5.1% Crawford 0.0% 21.9% 7.1% 9.5% 10.0% Dane 10.0% 6.1% 10.9% 11.1% 9.4% Dodge 12.5% 8.2% 6.9% 6.4% 5.2% Door 0.0% 22.7% 10.3% 8.6% 5.6% Douglas 0.0% 7.1% 0.0% 0.0% 0.0% Dunn 7.4% 8.3% 6.3% 14.3% 16.7% Eau Claire 3.3% 0.0% 0.0% 0.0% 0.0% Florence 0.0% 0.0% 0.0% 0.0% 0.0% Fond du Lac 9.3% 4.0% 5.7% 6.8% 9.7% Forest/Oneida/Vilas 7.7% 6.6% 6.5% 5.7% 4.3% Grant and Iowa 8.0% 10.2% 6.1% 5.2% 2.3% Green 2.7% 5.5% 5.9% 4.3% 0.0% Green Lake 5.9% 4.2% 0.0% 3.4% 8.7% Iron 11.1% 0.0% 0.0% 20.0% 0.0% Jackson 4.3% 10.0% 10.0% 0.0% 6.7% Jefferson 10.8% 11.5% 6.2% 11.3% 5.9% Juneau 6.2% 0.0% 0.0% 0.0% 0.0% Kenosha 10.5% 8.0% 3.1% 4.3% 8.5% Kewaunee 7.7% 12.5% 16.7% 0.0% 27.3% La Crosse 4.5% 3.9% 3.1% 6.3% 2.3% Lafayette 5.7% 11.8% 4.8% 13.3% 14.3%
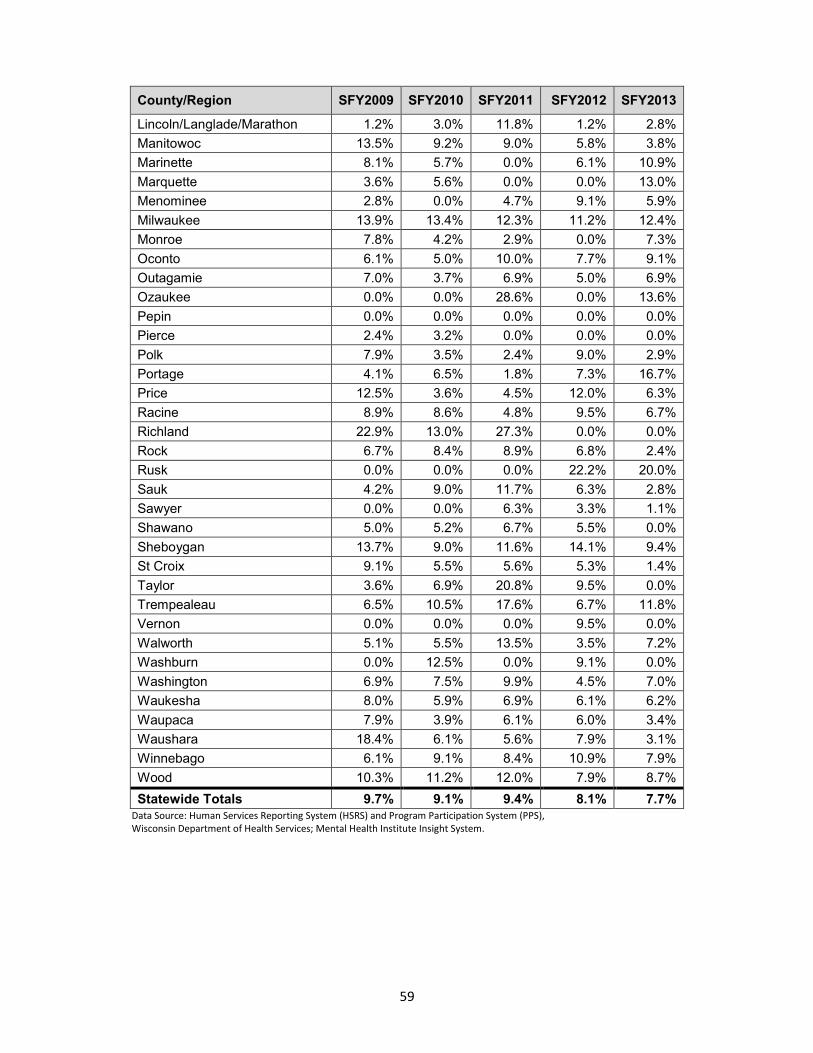
59
County/Region SFY2009 SFY2010 SFY2011 SFY2012 SFY2013
Lincoln/Langlade/Marathon 1.2% 3.0% 11.8% 1.2% 2.8% Manitowoc 13.5% 9.2% 9.0% 5.8% 3.8% Marinette 8.1% 5.7% 0.0% 6.1% 10.9% Marquette 3.6% 5.6% 0.0% 0.0% 13.0% Menominee 2.8% 0.0% 4.7% 9.1% 5.9% Milwaukee 13.9% 13.4% 12.3% 11.2% 12.4% Monroe 7.8% 4.2% 2.9% 0.0% 7.3% Oconto 6.1% 5.0% 10.0% 7.7% 9.1% Outagamie 7.0% 3.7% 6.9% 5.0% 6.9% Ozaukee 0.0% 0.0% 28.6% 0.0% 13.6% Pepin 0.0% 0.0% 0.0% 0.0% 0.0% Pierce 2.4% 3.2% 0.0% 0.0% 0.0% Polk 7.9% 3.5% 2.4% 9.0% 2.9% Portage 4.1% 6.5% 1.8% 7.3% 16.7% Price 12.5% 3.6% 4.5% 12.0% 6.3% Racine 8.9% 8.6% 4.8% 9.5% 6.7% Richland 22.9% 13.0% 27.3% 0.0% 0.0% Rock 6.7% 8.4% 8.9% 6.8% 2.4% Rusk 0.0% 0.0% 0.0% 22.2% 20.0% Sauk 4.2% 9.0% 11.7% 6.3% 2.8% Sawyer 0.0% 0.0% 6.3% 3.3% 1.1% Shawano 5.0% 5.2% 6.7% 5.5% 0.0% Sheboygan 13.7% 9.0% 11.6% 14.1% 9.4% St Croix 9.1% 5.5% 5.6% 5.3% 1.4% Taylor 3.6% 6.9% 20.8% 9.5% 0.0% Trempealeau 6.5% 10.5% 17.6% 6.7% 11.8% Vernon 0.0% 0.0% 0.0% 9.5% 0.0% Walworth 5.1% 5.5% 13.5% 3.5% 7.2% Washburn 0.0% 12.5% 0.0% 9.1% 0.0% Washington 6.9% 7.5% 9.9% 4.5% 7.0% Waukesha 8.0% 5.9% 6.9% 6.1% 6.2% Waupaca 7.9% 3.9% 6.1% 6.0% 3.4% Waushara 18.4% 6.1% 5.6% 7.9% 3.1% Winnebago 6.1% 9.1% 8.4% 10.9% 7.9% Wood 10.3% 11.2% 12.0% 7.9% 8.7% Statewide Totals 9.7% 9.1% 9.4% 8.1% 7.7%
Data Source: Human Services Reporting System (HSRS) and Program Participation System (PPS), Wisconsin Department of Health Services; Mental Health Institute Insight System.