Embed Size (px)
Citation preview
W I S C ON S I N R E T I RE ME NT S Y ST E M G A S B S T A T E M E N T N O . 6 7 P L A N R E P O R T I N G A N D A C C O U N T I N G S C H E D U L E S D E C E M B E R 3 1 , 2 0 1 5
Wisconsin Retirement System
TABLE OF CONTENTS
Page Section A Executive Summary
Executive Summary ...................................................................................................... 1 Discussion ..................................................................................................................... 2
Section B Financial Statements
Statement of Fiduciary Net Position ............................................................................. 6 Statement of Changes in Fiduciary Net Position .......................................................... 7
Section C Required Supplementary Information
Multiyear Schedule of Changes in Net Pension Liability and Related Ratios ............. 8 Multiyear Schedule of Net Pension Liability ................................................................ 9 Multiyear Schedule of Contributions .......................................................................... 10 Notes to Schedule of Contributions ............................................................................ 11 Multiyear Schedule of Investment Returns ................................................................. 12
Section D Notes to Financial Statements
Asset Allocation .......................................................................................................... 13 Sensitivity of Net Pension Liability to the Single Discount Rate Assumption ........... 14 Summary of Population Statistics ............................................................................... 15
Section E Calculation of the Single Discount Rate
Calculation of the Single Discount Rate ..................................................................... 16 Projection of Contributions ......................................................................................... 17 Projection of Plan Fiduciary Net Position................................................................... 19 Present Values of Projected Benefits .......................................................................... 21 Projection of Plan Net Position and Benefit Payments ............................................... 23 Section F Summary of Assumptions ........................................................................................... 24 Section G Plan Provisions ............................................................................................................ 29 Section H Glossary of Terms ....................................................................................................... 33
0
October 27, 2016 Employee Trust Funds Board Wisconsin Department of Employee
Trust Funds 801 West Badger Road Madison, Wisconsin 53713 This report provides certain information requested by the Wisconsin Retirement System (“WRS”) in connection with the Governmental Accounting Standards Board (GASB) Statement No. 67 “Accounting and Financial Reporting for Pension Plans.” The actuarial calculations in connection with this report were prepared for the purpose of complying with the requirements of GASB Statement No. 67. These calculations have been made on a basis that is consistent with our understanding of this Statement. The calculation of the plan’s liability for this report is not applicable for funding purposes of the plan. A calculation of the plan’s liability for purposes other than satisfying the requirements of GASB Statement No. 67 may produce significantly different results. This report may be provided to parties other than the WRS only in its entirety and only with the permission of the WRS. GRS is not responsible for unauthorized use of this report. The report was based upon information, furnished by the Department of Employee Trust Funds (DETF), concerning Retirement System benefits, financial transactions, and active members, terminated members, retirees and beneficiaries. We checked for internal and year-to-year consistency, but did not audit the data. We are not responsible for the accuracy or completeness of any data provided by DETF. This report complements the actuarial valuation report that we provided to the Board and should be considered in conjunction with that report. Please see the actuarial valuation report as of December 31, 2014 for additional discussion of the nature of actuarial calculations and more information related to participant data, economic and demographic assumptions, and benefit provisions. This report is intended to assist in preparation of the financial statements of WRS and its participating employers. Financial statements are the responsibility of the reporting entity and not the actuary. The statements are subject to an auditor’s review. Please let us know if the plan’s auditor recommends any changes
Employee Trust Funds Board Wisconsin Department of Employee
Trust Funds October 27, 2016 Page 2 To the best of our knowledge, the information contained in this report is accurate, and fairly represents the actuarial position of WRS. All calculations have been made in conformity with generally accepted actuarial principles and practices as well as with the Actuarial Standards of Practice issued by the Actuarial Standards Board. Brian B. Murphy, Mark Buis and James D. Anderson are Members of the American Academy of Actuaries (MAAA) and meet the Qualification Standards of the Academy of Actuaries to render the actuarial opinions herein. The signing actuaries are independent of the plan sponsor. Respectfully submitted,
Brian B. Murphy, FSA, EA, MAAA
Mark Buis, FSA, EA, MAAA James D. Anderson, FSA, EA, MAAA BBM/MB/JDA:ah

0
SECTION A EXECUTIVE SUMMARY Executive Summary
Section A
1
Wisconsin Retirement System
EXECUTIVE SUMMARY
AS OF DECEMBER 31, 2015
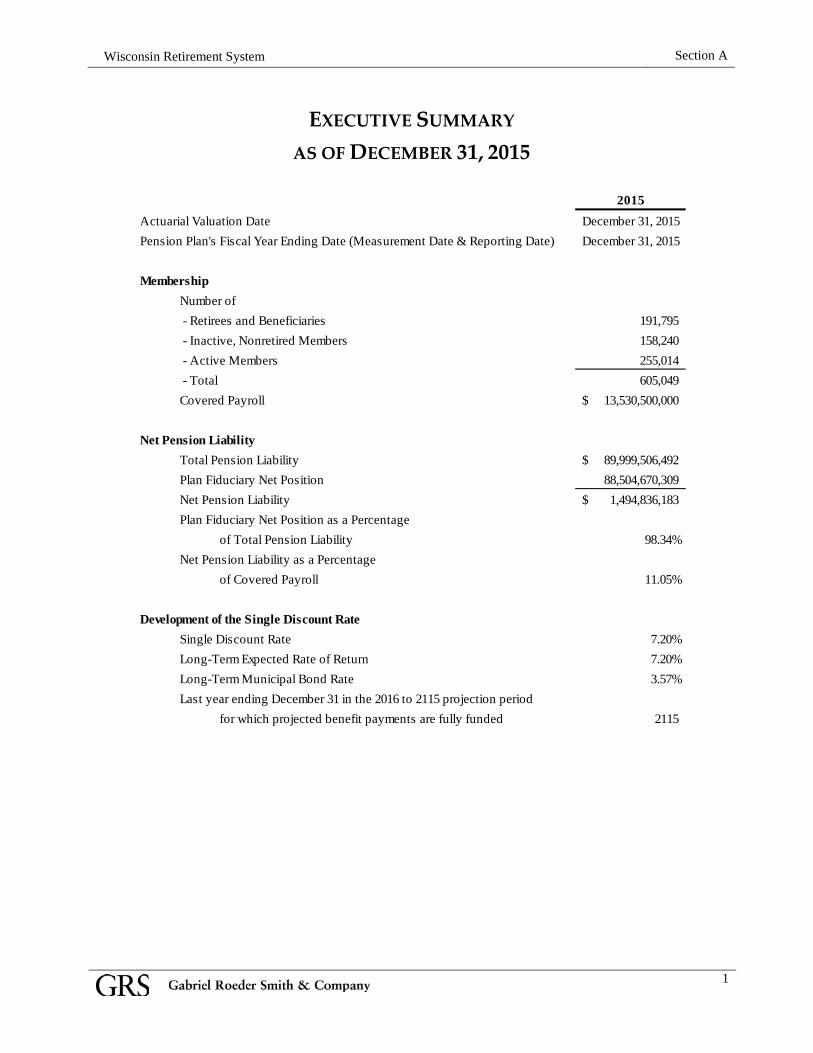
2015Actuarial Valuation Date December 31, 2015Pension Plan's Fiscal Year Ending Date (Measurement Date & Reporting Date) December 31, 2015
MembershipNumber of - Retirees and Beneficiaries 191,795 - Inactive, Nonretired Members 158,240 - Active Members 255,014 - Total 605,049 Covered Payroll 13,530,500,000$
Net Pension LiabilityTotal Pension Liability 89,999,506,492$ Plan Fiduciary Net Position 88,504,670,309 Net Pension Liability 1,494,836,183$ Plan Fiduciary Net Position as a Percentage
of Total Pension Liability 98.34%Net Pension Liability as a Percentage
of Covered Payroll 11.05%
Development of the Single Discount RateSingle Discount Rate 7.20%Long-Term Expected Rate of Return 7.20%Long-Term Municipal Bond Rate 3.57%Last year ending December 31 in the 2016 to 2115 projection period
for which projected benefit payments are fully funded 2115
Section A
2
2
Wisconsin Retirement System
DISCUSSION Accounting Standard For pension plans that are administered through trusts or equivalent arrangements, Governmental Accounting Standards Board (GASB) Statement No. 67, “Financial Reporting for Pension Plans,” replaces the requirements of GASB Statement No. 25, “Financial Reporting for Defined Benefit Pension Plans and Note Disclosures for Defined Contribution Plans,” and GASB Statement No. 50, “Pension Disclosures.” GASB Statement No. 67 establishes standards of financial reporting for separately issued financial reports and specifies the required approach for measuring the pension liability of employers and non-employer contributing entities for benefits provided through the pension plan. The following discussion provides a summary of the information that is required to be disclosed under this accounting standard. A number of these disclosure items are provided in this report. However, certain information, such as notes regarding accounting policies and investments, is not included in this report, and your internal staff will be responsible for preparing that information to comply with this accounting standard. Financial Statements GASB Statement No. 67 requires defined benefit pension plans to present two financial statements – a statement of fiduciary net position and a statement of changes in fiduciary net position.
The statement of fiduciary net position presents the following items as of the end of the pension plan’s reporting period, such as:
• assets; • deferred inflows and outflows of resources; • liabilities; and • fiduciary net position (assets, plus deferred outflows, minus liabilities, minus deferred
inflows).
The statement of changes in fiduciary net position presents the following for the plan’s reporting period:
• additions, such as contributions and investment income; • deductions, such as benefit payments and expenses; and • net increase or decrease in the fiduciary net position (the difference between additions and
deductions).
Section A
3
3
Wisconsin Retirement System
Notes to Financial Statements GASB Statement No. 67 also requires the notes of the plan’s financial statements to include additional disclosure information. This disclosure information should include:
• a description of the types of benefits provided by the plan, as well as automatic or ad hoc COLAs;
• the number and classes of employees covered by the benefit terms; • the composition of the pension plan’s Board and the authority under which benefit terms
may be amended; • a description of the plan’s funding policy, which includes member and employer
contribution requirements; • the pension plan’s investment policies; • a description of how fair value is determined; • concentrations of investments greater than or equal to 5%; • annual money-weighted rate of return on pension plan investments; • the portion of the present value of benefits to be provided through the pension plan to
current active and inactive plan members; • the pension plan’s fiduciary net position; • the net pension liability; • the pension plan’s fiduciary net position as a percentage of the total pension liability; • significant assumptions and methods used to calculate the total pension liability; • inputs to the discount rates; and • certain information about mortality assumptions and the dates of experience studies.
Required Supplementary Information GASB Statement No. 67 requires a 10-year fiscal history of:
• sources of changes in the net pension liability; • information about the components of the net pension liability and related ratios, including
the pension plan’s fiduciary net position as a percentage of the total pension liability, and the net pension liability as a percent of covered-employee payroll;
• comparison of the actual employer contributions to the actuarially determined contributions based on the plan’s funding policy; and
• the annual money-weighted rate of return on pension plan investments for each year.
While the first two tables may be built prospectively as the information becomes available, sufficient information is currently available for the third and fourth tables.
Section A
4
4
Wisconsin Retirement System
Measurement of the Net Pension Liability The net pension liability is to be measured as the total pension liability, less the amount of the pension plan’s fiduciary net position. In actuarial terms, this will be the accrued liability less the market value of assets (not the smoothed actuarial value of assets that is often encountered in actuarial valuations performed to determine the employer’s contribution requirement). General Implications of Contribution Allocation Procedure or Funding Policy on Future Expected Plan Contributions and Funded Status Given the plan’s contribution allocation procedure, if all actuarial assumptions are met (including the assumption of the plan earning 7.2% on the actuarial value of assets), it is expected that:
1. The employer normal cost as a percentage of pay will decrease to the level of the future service normal cost as time passes.
2. The unfunded liability is expected to decrease in dollar amount until it is fully funded. 3. The funded status of the plan will remain very close to a 100% funded ratio.
This funding policy results in the expectation that the plan’s assets will be able to fully pay for promised benefits through at least 2016. The projections in this report are strictly for the purpose of determining the GASB single discount rate and are different from a funding projection for the ongoing plan. Timing of the Valuation An actuarial valuation to determine the total pension liability is required to be performed at least every two years. If the actuarial valuation is not calculated as of the plan’s fiscal year end, the total pension liability is required to be rolled forward from the actuarial valuation date to the pension plan’s fiscal year end. The total pension liability shown in this report is based on an actuarial valuation performed as of December 31, 2015 and a measurement date of December 31, 2015. Single Discount Rate Projected benefit payments are required to be discounted to their actuarial present values using a single discount rate that reflects (1) a long-term expected rate of return on pension plan investments (to the extent that the plan’s fiduciary net position is projected to be sufficient to pay benefits) and (2) tax-exempt municipal bond rate based on an index of 20-year general obligation bonds with an average AA credit rating (which is published by the Bond Buyer Index) as of the measurement date (to the extent that the contributions for use with the long-term expected rate of return are not met). For the purpose of this valuation, the expected rate of return on pension plan investments is 7.20%; the municipal bond rate is 3.57% (based on the weekly rate closest to but not later than the measurement date of the “20-Bond GO Index” rate published from the Bond Buyer Index); and the resulting single discount rate is 7.20%.
Section A
5
Wisconsin Retirement System
Effective Date and Transition GASB Statement No. 67 is effective for a pension plan’s fiscal years beginning after June 15, 2013. Actuarial Assumptions and Methods and Member Census Data The liability and asset values used in this study are taken from the December 31, 2014 and 2015 Actuarial Valuation Reports of the Wisconsin Retirement System. Therefore, the actuarial assumptions and methods employed for purposes of our Actuarial Study are the same actuarial assumptions and methods shown in the Actuarial Valuation Reports. The member census data employed for purposes of our Actuarial Study was provided by DETF and is the same member census data used for the December 31, 2014 and December 31, 2015 Actuarial Valuation Reports of the Retirement System. The Wisconsin Retirement System uses the Frozen Initial Liability cost method for determining funding requirements. GASB Statement No. 67 requires the use of the Entry Age Normal method for accounting purposes. Therefore, we developed the Entry Age Normal Accrued Liability to reflect the Total Pension Liability for GASB purposes.

SECTION B FINANCIAL STATEMENTS Financial Statements
Section B
6
Wisconsin Retirement System
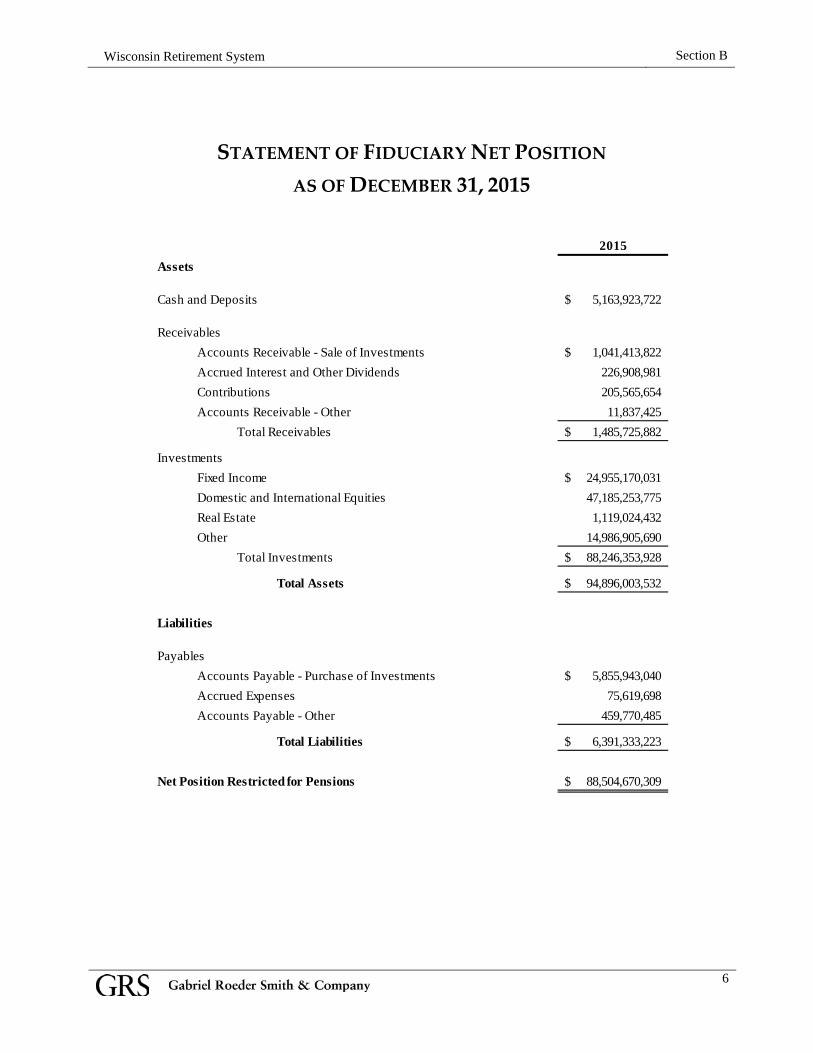
STATEMENT OF FIDUCIARY NET POSITION AS OF DECEMBER 31, 2015
2015
Assets
Cash and Deposits 5,163,923,722$
ReceivablesAccounts Receivable - Sale of Investments 1,041,413,822$ Accrued Interest and Other Dividends 226,908,981 Contributions 205,565,654 Accounts Receivable - Other 11,837,425
Total Receivables 1,485,725,882$
InvestmentsFixed Income 24,955,170,031$ Domestic and International Equities 47,185,253,775 Real Estate 1,119,024,432 Other 14,986,905,690
Total Investments 88,246,353,928$
Total Assets 94,896,003,532$
Liabilities
PayablesAccounts Payable - Purchase of Investments 5,855,943,040$ Accrued Expenses 75,619,698 Accounts Payable - Other 459,770,485
Total Liabilities 6,391,333,223$
Net Position Restricted for Pensions 88,504,670,309$
Section B
7
Wisconsin Retirement System
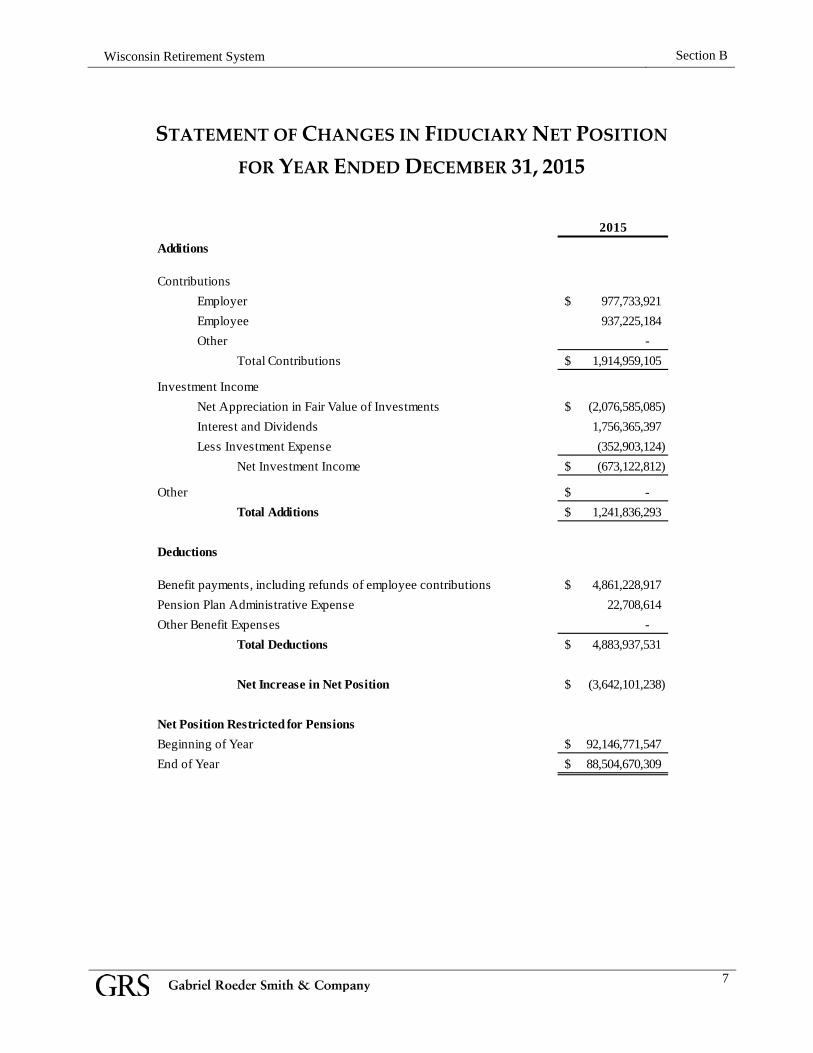
STATEMENT OF CHANGES IN FIDUCIARY NET POSITION
FOR YEAR ENDED DECEMBER 31, 2015
2015Additions
ContributionsEmployer 977,733,921$ Employee 937,225,184 Other -
Total Contributions 1,914,959,105$
Investment IncomeNet Appreciation in Fair Value of Investments (2,076,585,085)$ Interest and Dividends 1,756,365,397 Less Investment Expense (352,903,124)
Net Investment Income (673,122,812)$
Other -$ Total Additions 1,241,836,293$
Deductions
Benefit payments, including refunds of employee contributions 4,861,228,917$ Pension Plan Administrative Expense 22,708,614 Other Benefit Expenses -
Total Deductions 4,883,937,531$
Net Increase in Net Position (3,642,101,238)$
Net Position Restricted for PensionsBeginning of Year 92,146,771,547$ End of Year 88,504,670,309$
8
SECTION C REQUIRED SUPPLEMENTARY INFORMATION Required Supplementary Information
Section C
8
Wisconsin Retirement System
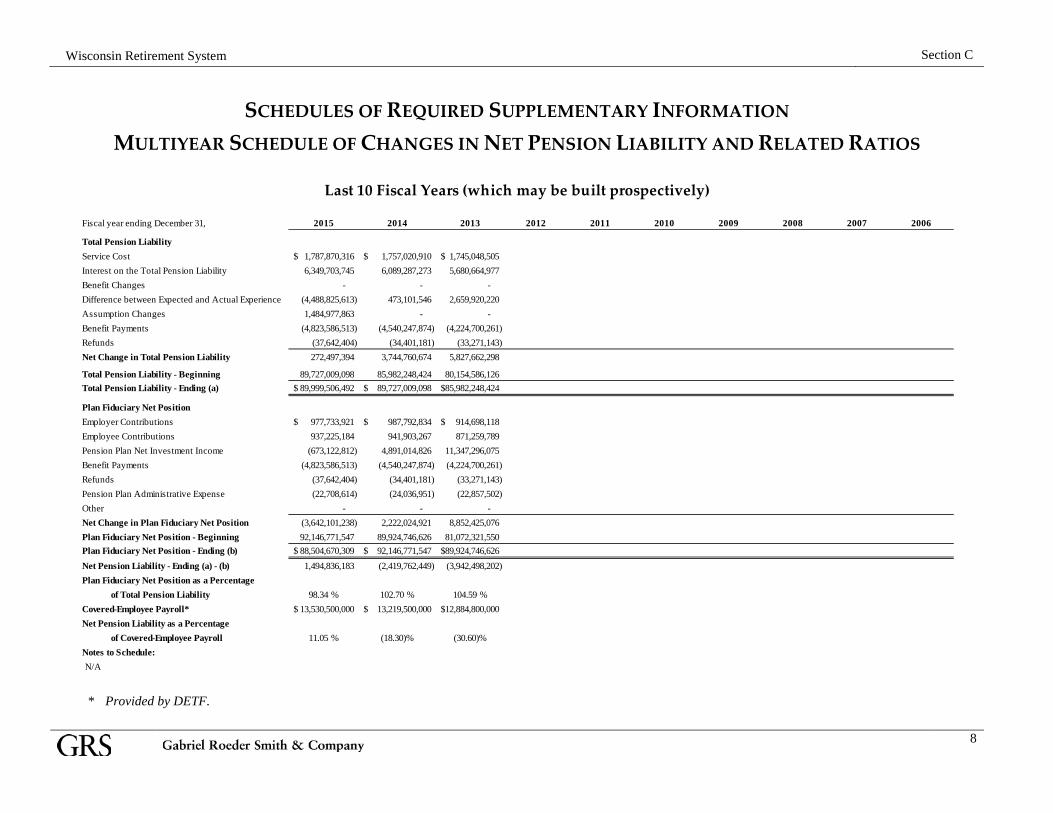
SCHEDULES OF REQUIRED SUPPLEMENTARY INFORMATION MULTIYEAR SCHEDULE OF CHANGES IN NET PENSION LIABILITY AND RELATED RATIOS
Fiscal year ending December 31, 2015 2014 2013 2012 2011 2010 2009 2008 2007 2006
Total Pension LiabilityService Cost 1,787,870,316$ 1,757,020,910$ 1,745,048,505$ Interest on the Total Pension Liability 6,349,703,745 6,089,287,273 5,680,664,977 Benefit Changes - - -
(4,488,825,613) 473,101,546 2,659,920,220 Assumption Changes 1,484,977,863 - - Benefit Payments (4,823,586,513) (4,540,247,874) (4,224,700,261) Refunds (37,642,404) (34,401,181) (33,271,143) Net Change in Total Pension Liability 272,497,394 3,744,760,674 5,827,662,298
Total Pension Liability - Beginning 89,727,009,098 85,982,248,424 80,154,586,126 Total Pension Liability - Ending (a) 89,999,506,492$ 89,727,009,098$ 85,982,248,424$
Plan Fiduciary Net PositionEmployer Contributions 977,733,921$ 987,792,834$ 914,698,118$ Employee Contributions 937,225,184 941,903,267 871,259,789 Pension Plan Net Investment Income (673,122,812) 4,891,014,826 11,347,296,075 Benefit Payments (4,823,586,513) (4,540,247,874) (4,224,700,261) Refunds (37,642,404) (34,401,181) (33,271,143) Pension Plan Administrative Expense (22,708,614) (24,036,951) (22,857,502) Other - - - Net Change in Plan Fiduciary Net Position (3,642,101,238) 2,222,024,921 8,852,425,076 Plan Fiduciary Net Position - Beginning 92,146,771,547 89,924,746,626 81,072,321,550 Plan Fiduciary Net Position - Ending (b) 88,504,670,309$ 92,146,771,547$ 89,924,746,626$ Net Pension Liability - Ending (a) - (b) 1,494,836,183 (2,419,762,449) (3,942,498,202) Plan Fiduciary Net Position as a Percentage
of Total Pension Liability 98.34 % 102.70 % 104.59 %Covered-Employee Payroll* 13,530,500,000$ 13,219,500,000$ 12,884,800,000$ Net Pension Liability as a Percentage
of Covered-Employee Payroll 11.05 % (18.30)% (30.60)%Notes to Schedule:N/A
Last 10 Fiscal Years (which may be built prospectively)
Difference between Expected and Actual Experience
* Provided by DETF.
Section C
9
Wisconsin Retirement System
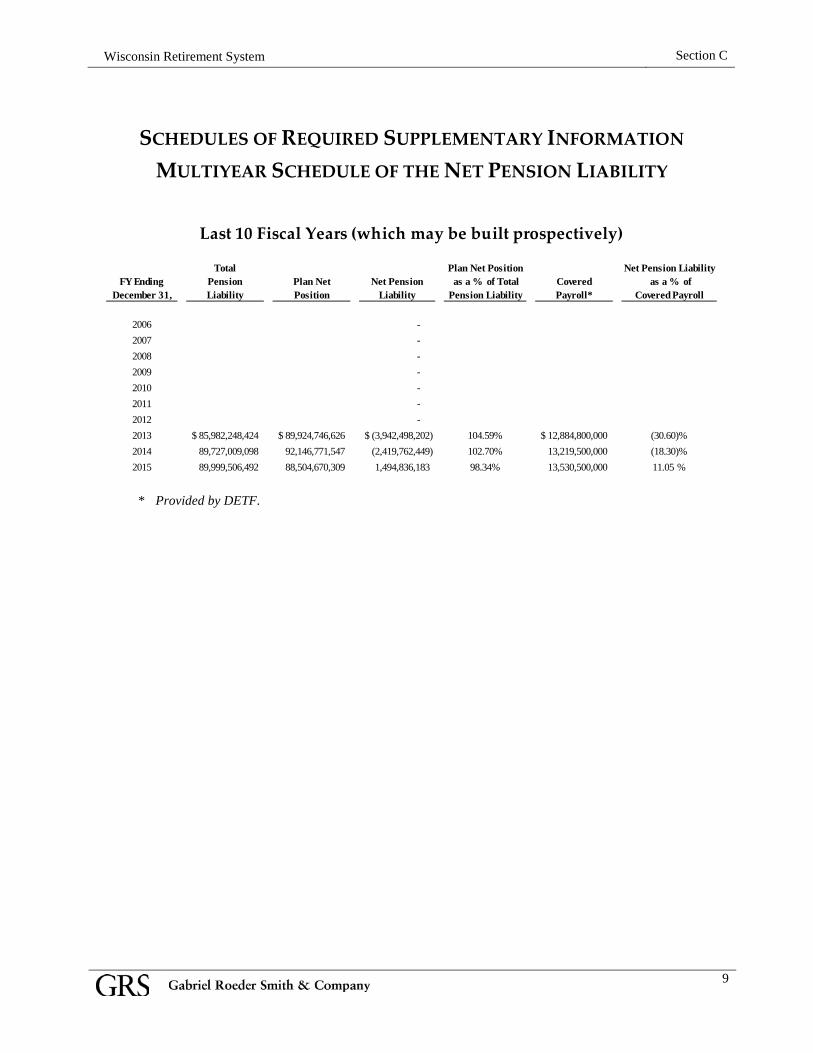
SCHEDULES OF REQUIRED SUPPLEMENTARY INFORMATION MULTIYEAR SCHEDULE OF THE NET PENSION LIABILITY
Total Plan Net Position Net Pension LiabilityFY Ending Pension Plan Net Net Pension as a % of Total Covered as a % of
December 31, Liability Position Liability Pension Liability Payroll* Covered Payroll
2006 - 2007 - 2008 - 2009 - 2010 - 2011 - 2012 - 2013 85,982,248,424$ 89,924,746,626$ (3,942,498,202)$ 104.59% 12,884,800,000$ (30.60)%2014 89,727,009,098 92,146,771,547 (2,419,762,449) 102.70% 13,219,500,000 (18.30)%2015 89,999,506,492 88,504,670,309 1,494,836,183 98.34% 13,530,500,000 11.05 %
Last 10 Fiscal Years (which may be built prospectively)
* Provided by DETF.
Section C
10
Wisconsin Retirement System
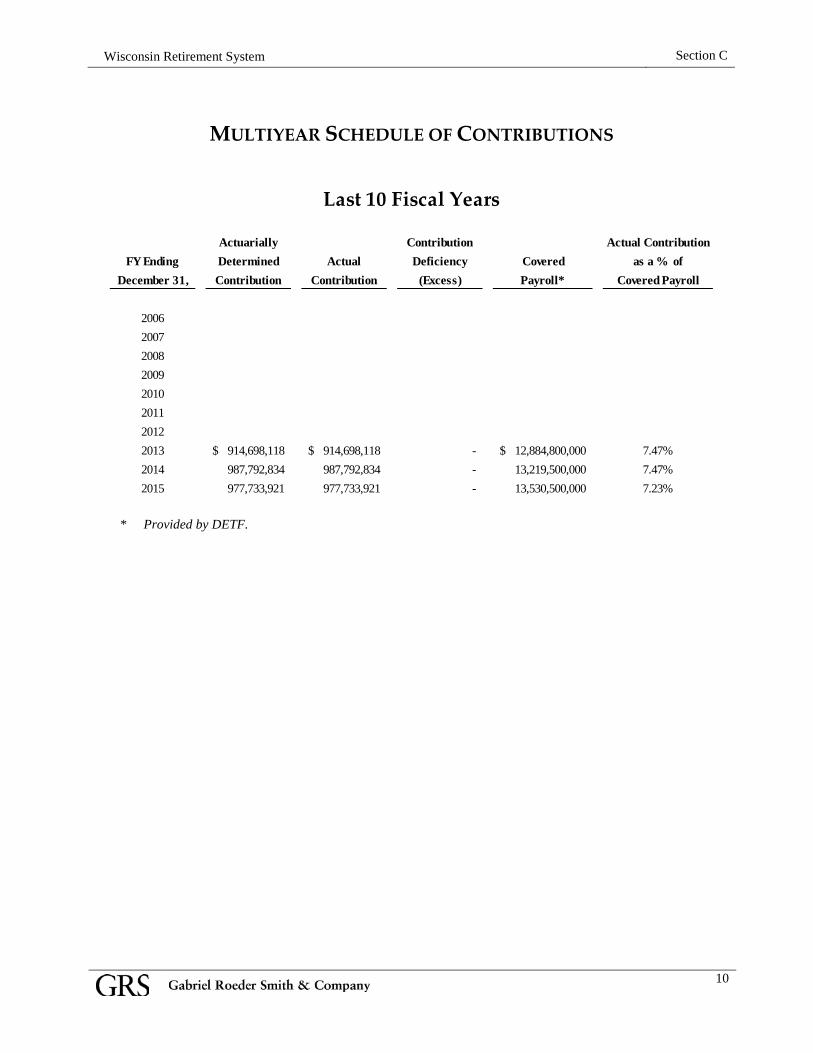
MULTIYEAR SCHEDULE OF CONTRIBUTIONS
Actuarially Contribution Actual ContributionFY Ending Determined Actual Deficiency Covered as a % of
December 31, Contribution Contribution (Excess) Payroll* Covered Payroll
2006 - 0.00%2007 - 0.00%2008 - 0.00%2009 - 0.00%2010 - 0.00%2011 - 0.00%2012 - 0.00%2013 914,698,118$ 914,698,118$ - 12,884,800,000$ 7.47%2014 987,792,834 987,792,834 - 13,219,500,000 7.47%2015 977,733,921 977,733,921 - 13,530,500,000 7.23%
Last 10 Fiscal Years
* Provided by DETF.
Section C
11
Wisconsin Retirement System
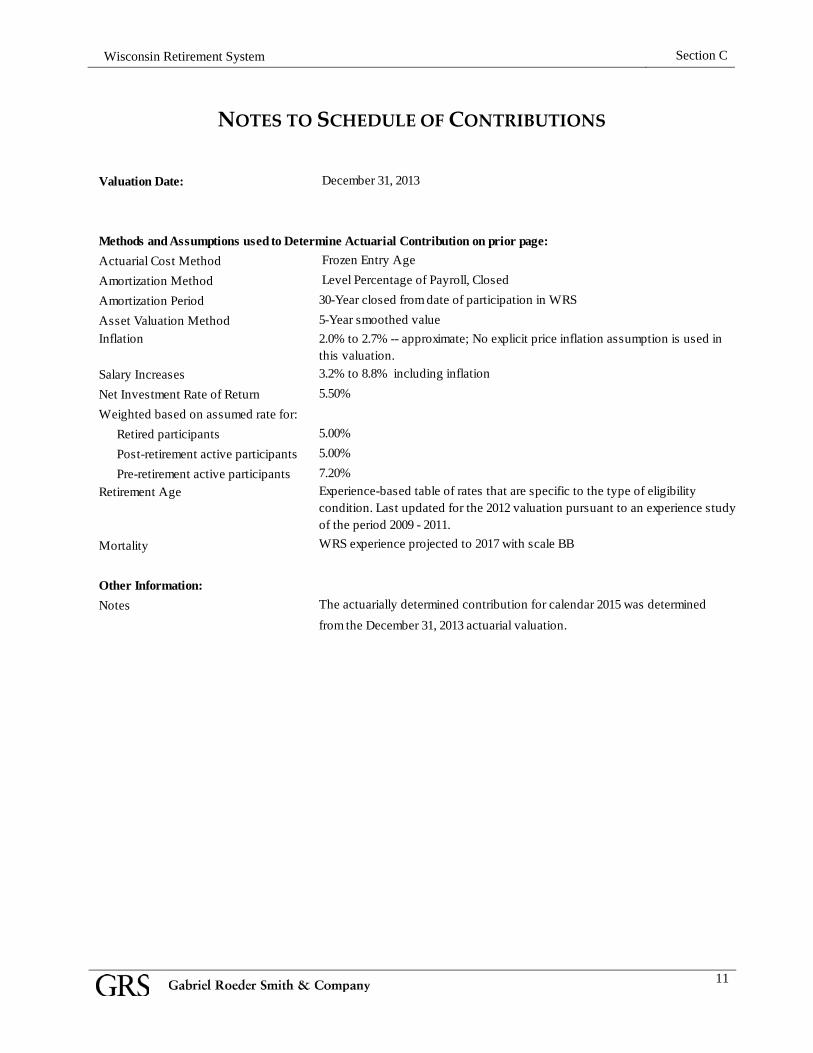
NOTES TO SCHEDULE OF CONTRIBUTIONS
Valuation Date: December 31, 2013
Methods and Assumptions used to Determine Actuarial Contribution on prior page:Actuarial Cost Method Frozen Entry Age Amortization Method Level Percentage of Payroll, Closed Amortization Period 30-Year closed from date of participation in WRSAsset Valuation Method 5-Year smoothed valueInflation 2.0% to 2.7% -- approximate; No explicit price inflation assumption is used in
this valuation.Salary Increases 3.2% to 8.8% including inflationNet Investment Rate of Return 5.50%Weighted based on assumed rate for: Retired participants 5.00% Post-retirement active participants 5.00% Pre-retirement active participants 7.20%Retirement Age Experience-based table of rates that are specific to the type of eligibility
condition. Last updated for the 2012 valuation pursuant to an experience study of the period 2009 - 2011.
Mortality WRS experience projected to 2017 with scale BB
Other Information:Notes The actuarially determined contribution for calendar 2015 was determined
from the December 31, 2013 actuarial valuation.
Section C
12
Wisconsin Retirement System
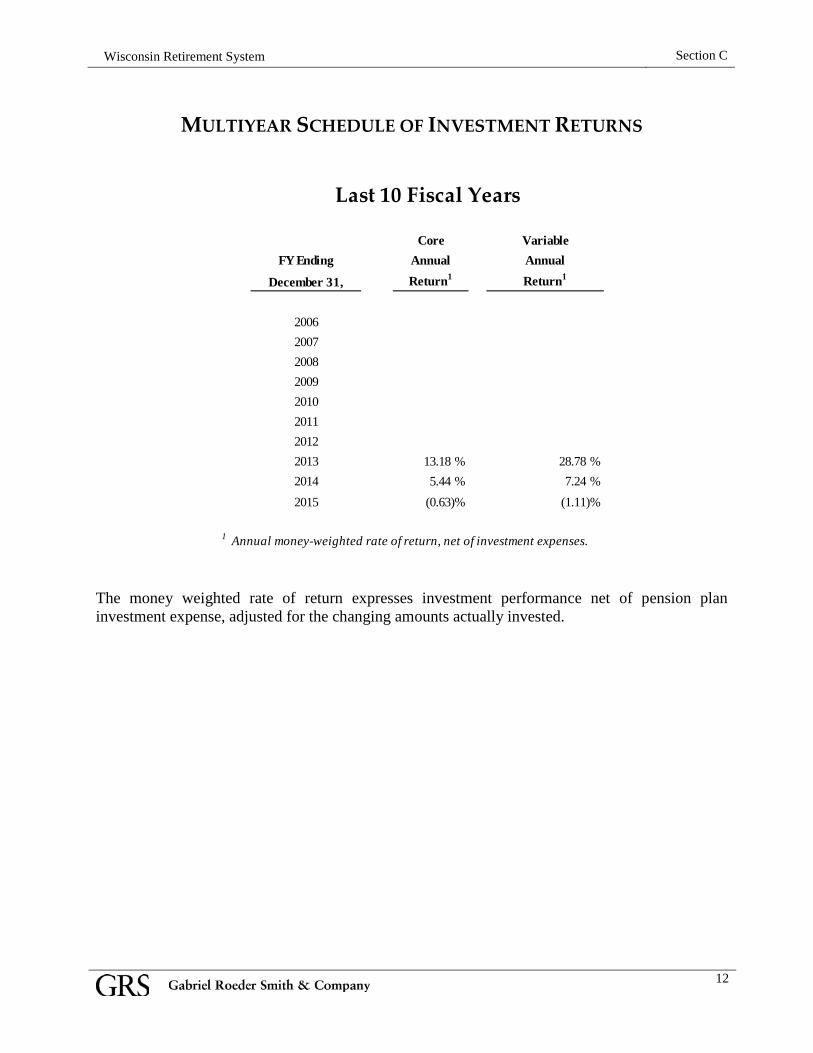
MULTIYEAR SCHEDULE OF INVESTMENT RETURNS
Core VariableFY Ending Annual Annual
December 31, Return1 Return1
20062007200820092010201120122013 13.18 % 28.78 %2014 5.44 % 7.24 %2015 (0.63)% (1.11)%
1 Annual money-weighted rate of return, net of investment expenses.
Last 10 Fiscal Years
The money weighted rate of return expresses investment performance net of pension plan investment expense, adjusted for the changing amounts actually invested.

13
SECTION D NOTES TO FINANCIAL STATEMENTS Notes to Financial Statements
Section D
13
Wisconsin Retirement System
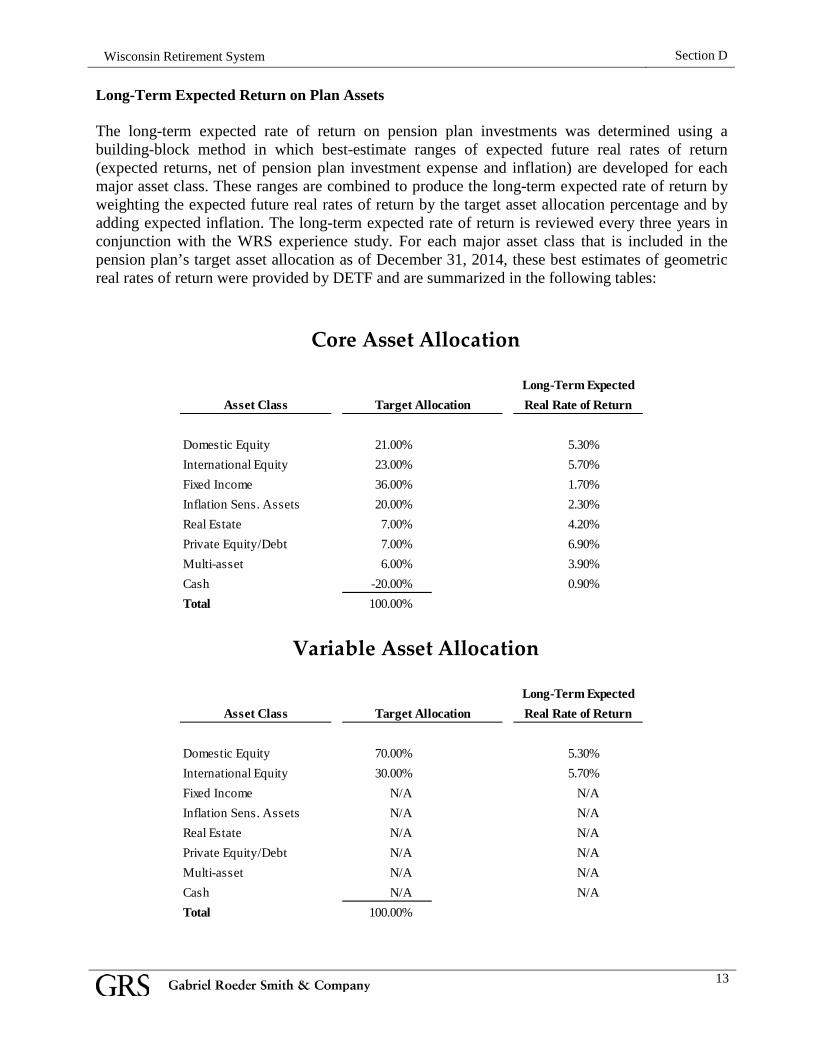
Long-Term Expected Return on Plan Assets The long-term expected rate of return on pension plan investments was determined using a building-block method in which best-estimate ranges of expected future real rates of return (expected returns, net of pension plan investment expense and inflation) are developed for each major asset class. These ranges are combined to produce the long-term expected rate of return by weighting the expected future real rates of return by the target asset allocation percentage and by adding expected inflation. The long-term expected rate of return is reviewed every three years in conjunction with the WRS experience study. For each major asset class that is included in the pension plan’s target asset allocation as of December 31, 2014, these best estimates of geometric real rates of return were provided by DETF and are summarized in the following tables:
Asset Class
Domestic Equity 21.00% 5.30%International Equity 23.00% 5.70%Fixed Income 36.00% 1.70%Inflation Sens. Assets 20.00% 2.30%Real Estate 7.00% 4.20%Private Equity/Debt 7.00% 6.90%Multi-asset 6.00% 3.90%Cash -20.00% 0.90%Total 100.00%
Core Asset Allocation
Target AllocationLong-Term ExpectedReal Rate of Return
Asset Class
Domestic Equity 70.00% 5.30%International Equity 30.00% 5.70%Fixed Income N/A N/AInflation Sens. Assets N/A N/AReal Estate N/A N/APrivate Equity/Debt N/A N/AMulti-asset N/A N/ACash N/A N/ATotal 100.00%
Long-Term ExpectedTarget Allocation Real Rate of Return
Variable Asset Allocation
Section D
14
Wisconsin Retirement System
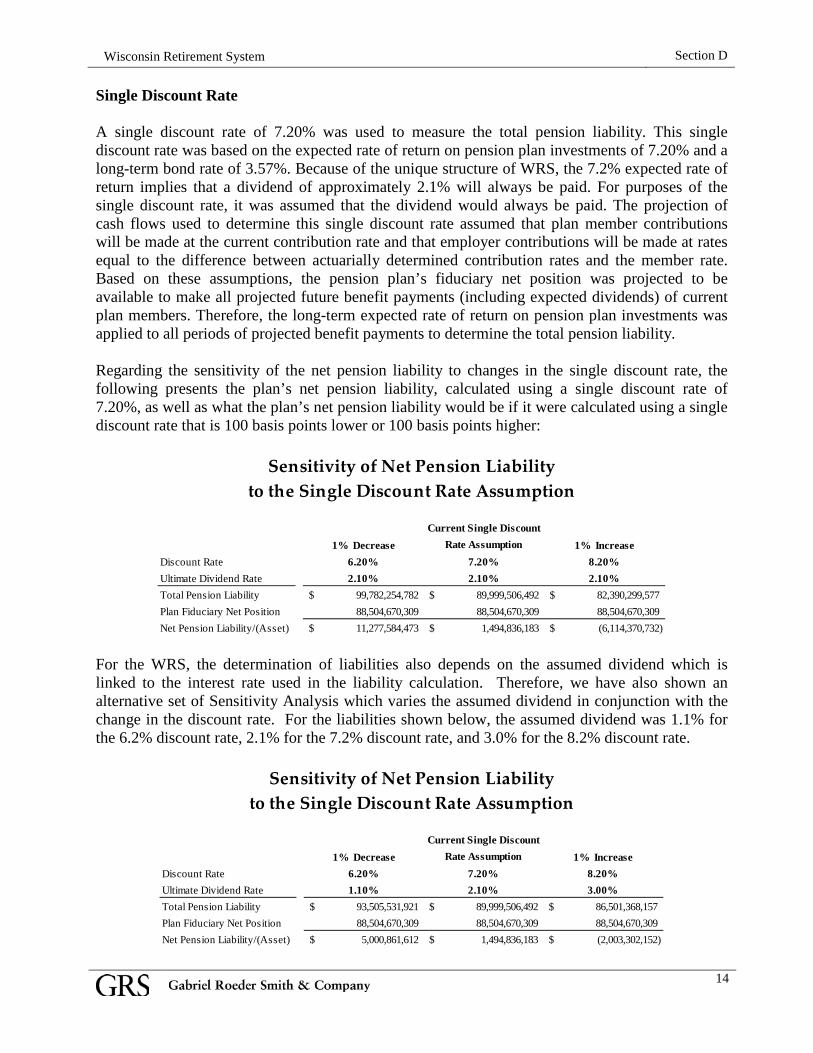
Single Discount Rate A single discount rate of 7.20% was used to measure the total pension liability. This single discount rate was based on the expected rate of return on pension plan investments of 7.20% and a long-term bond rate of 3.57%. Because of the unique structure of WRS, the 7.2% expected rate of return implies that a dividend of approximately 2.1% will always be paid. For purposes of the single discount rate, it was assumed that the dividend would always be paid. The projection of cash flows used to determine this single discount rate assumed that plan member contributions will be made at the current contribution rate and that employer contributions will be made at rates equal to the difference between actuarially determined contribution rates and the member rate. Based on these assumptions, the pension plan’s fiduciary net position was projected to be available to make all projected future benefit payments (including expected dividends) of current plan members. Therefore, the long-term expected rate of return on pension plan investments was applied to all periods of projected benefit payments to determine the total pension liability. Regarding the sensitivity of the net pension liability to changes in the single discount rate, the following presents the plan’s net pension liability, calculated using a single discount rate of 7.20%, as well as what the plan’s net pension liability would be if it were calculated using a single discount rate that is 100 basis points lower or 100 basis points higher:
Current Single Discount 1% Decrease Rate Assumption 1% Increase
Discount Rate 6.20% 7.20% 8.20%Ultimate Dividend Rate 2.10% 2.10% 2.10%Total Pension Liability 99,782,254,782$ 89,999,506,492$ 82,390,299,577$ Plan Fiduciary Net Position 88,504,670,309 88,504,670,309 88,504,670,309Net Pension Liability/(Asset) 11,277,584,473$ 1,494,836,183$ (6,114,370,732)$
Sensitivity of Net Pension Liabilityto the Single Discount Rate Assumption
For the WRS, the determination of liabilities also depends on the assumed dividend which is linked to the interest rate used in the liability calculation. Therefore, we have also shown an alternative set of Sensitivity Analysis which varies the assumed dividend in conjunction with the change in the discount rate. For the liabilities shown below, the assumed dividend was 1.1% for the 6.2% discount rate, 2.1% for the 7.2% discount rate, and 3.0% for the 8.2% discount rate.
Current Single Discount 1% Decrease Rate Assumption 1% Increase
Discount Rate 6.20% 7.20% 8.20%Ultimate Dividend Rate 1.10% 2.10% 3.00%Total Pension Liability 93,505,531,921$ 89,999,506,492$ 86,501,368,157$ Plan Fiduciary Net Position 88,504,670,309 88,504,670,309 88,504,670,309Net Pension Liability/(Asset) 5,000,861,612$ 1,494,836,183$ (2,003,302,152)$
Sensitivity of Net Pension Liabilityto the Single Discount Rate Assumption
Section D
15
Wisconsin Retirement System
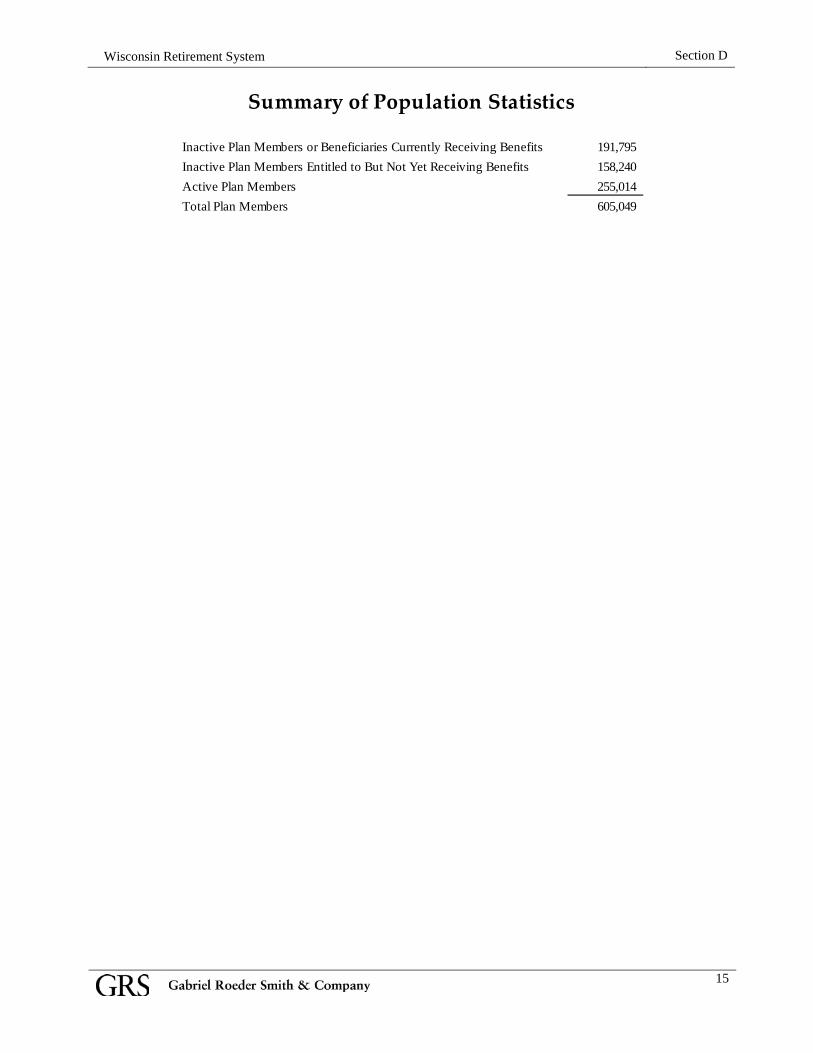
Inactive Plan Members or Beneficiaries Currently Receiving Benefits 191,795 Inactive Plan Members Entitled to But Not Yet Receiving Benefits 158,240 Active Plan Members 255,014 Total Plan Members 605,049
Summary of Population Statistics
16
SECTION E CALCULATION OF THE SINGLE DISCOUNT RATE Calculation of the Single Discount Rate
Section E
16
Wisconsin Retirement System
CALCULATION OF THE SINGLE DISCOUNT RATE
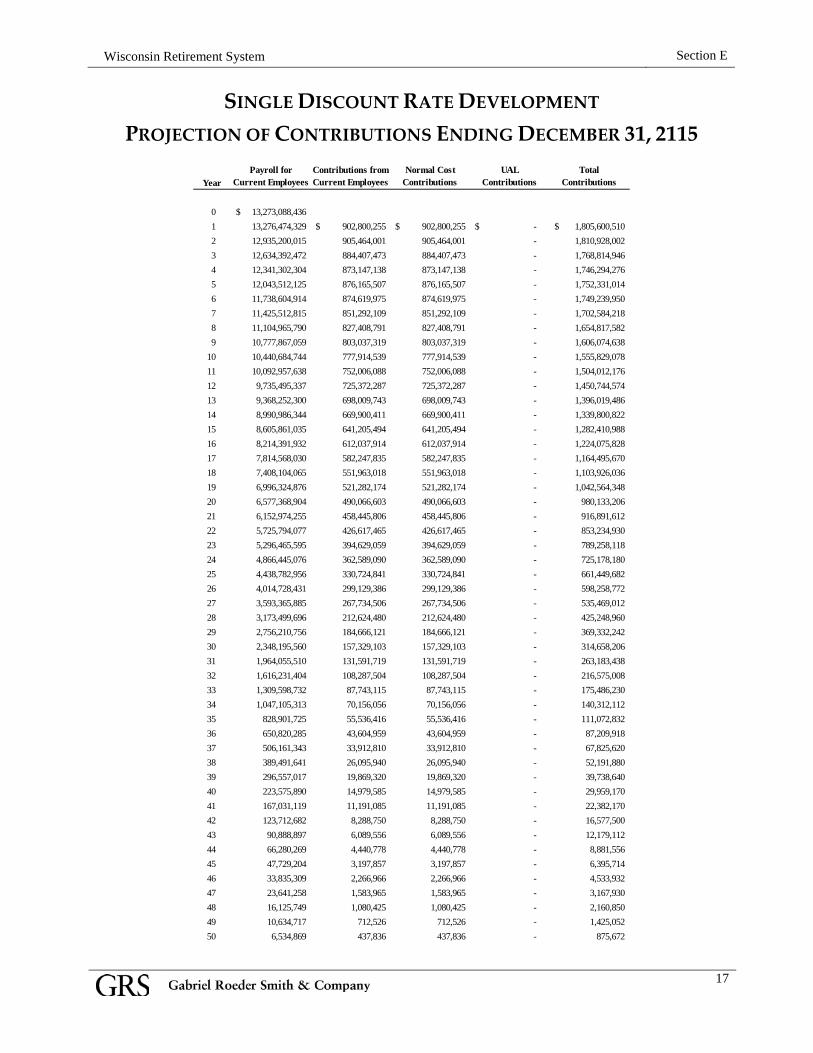
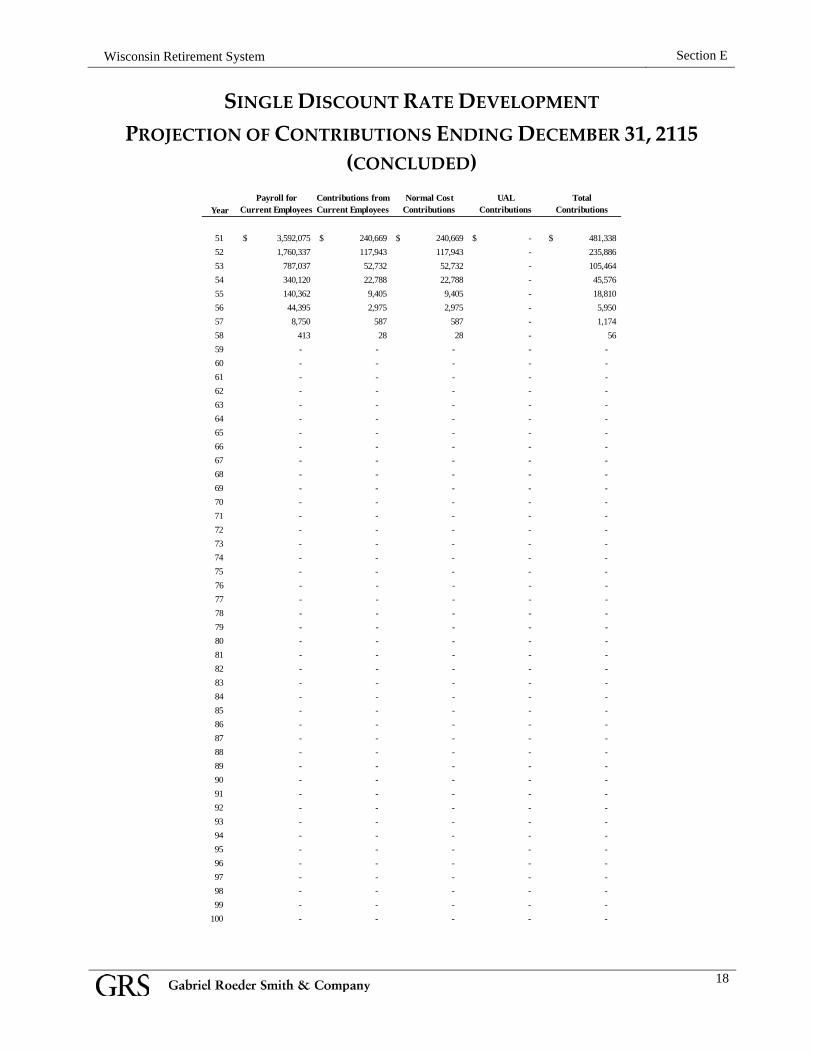
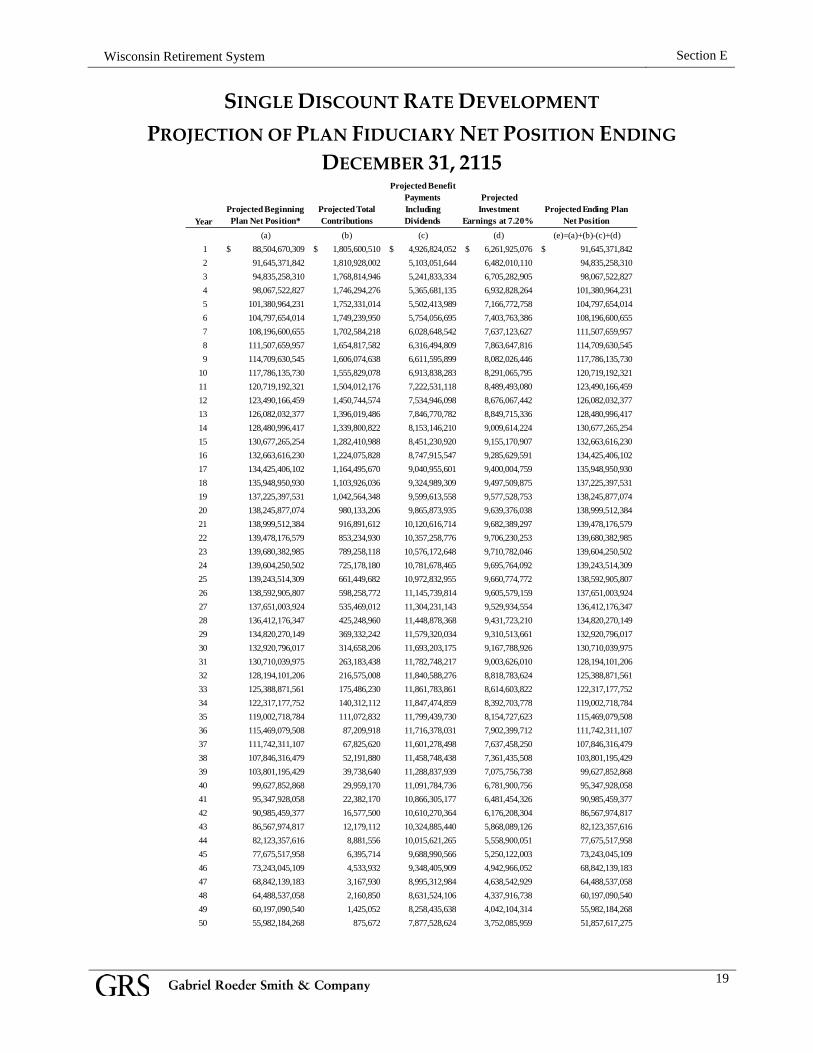
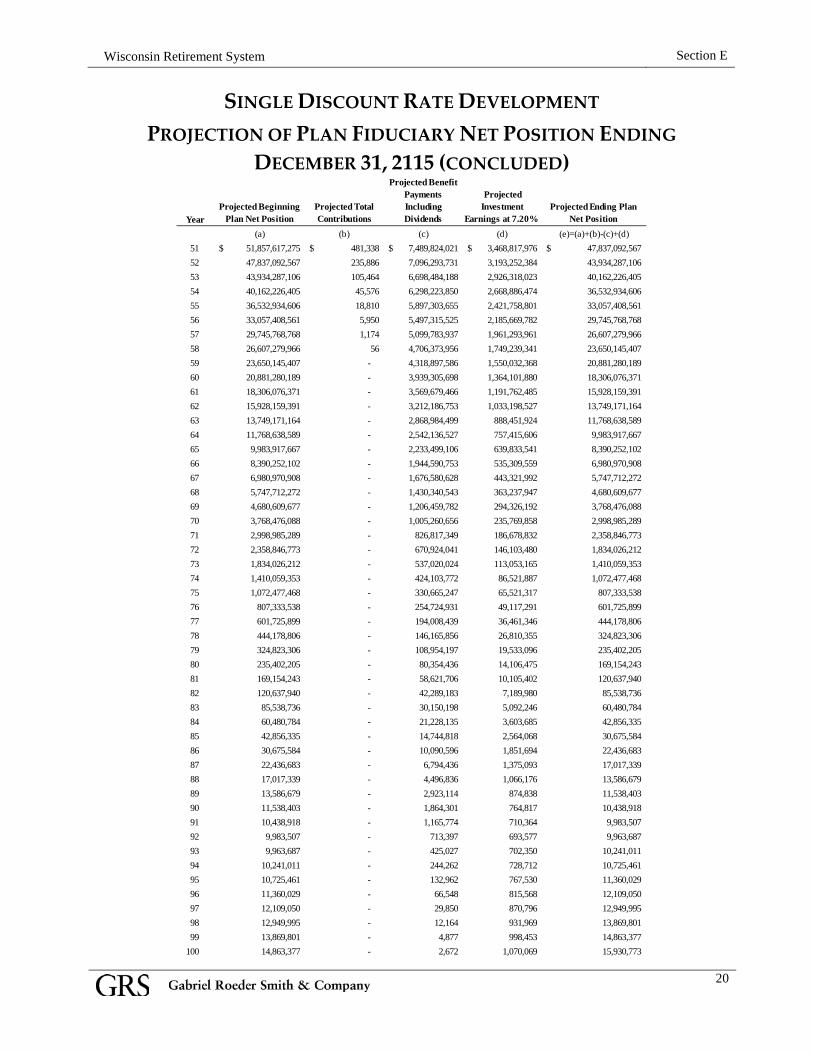
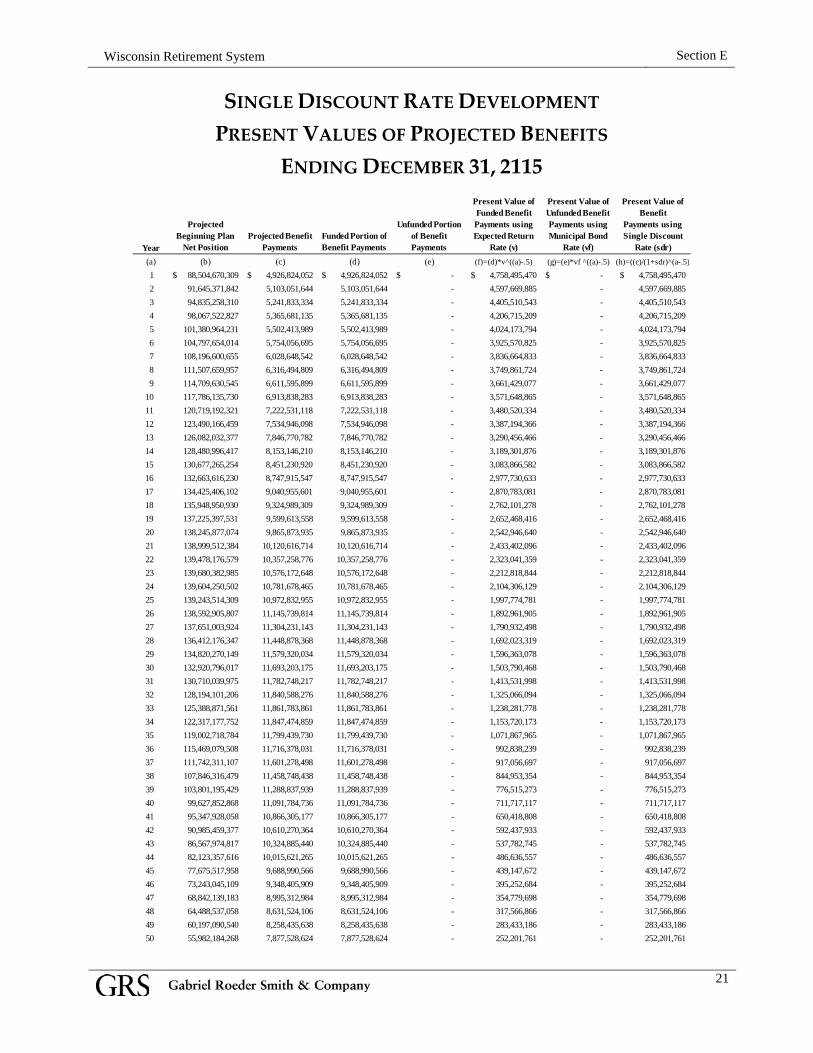
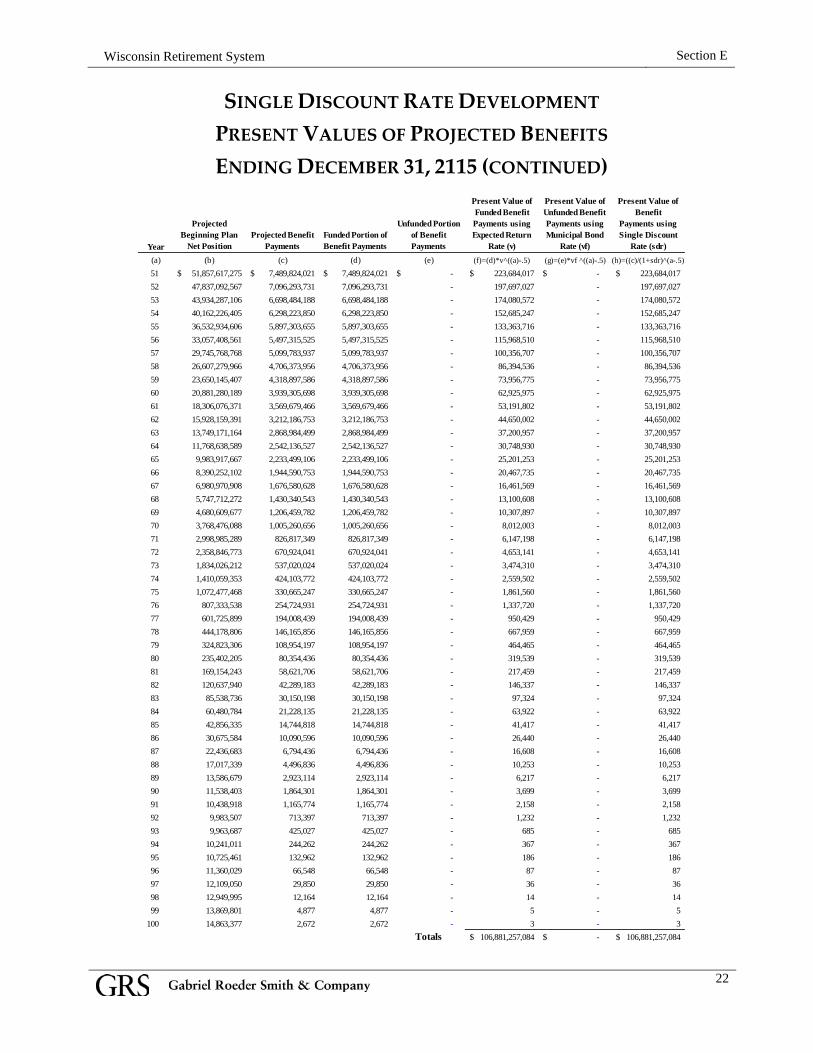
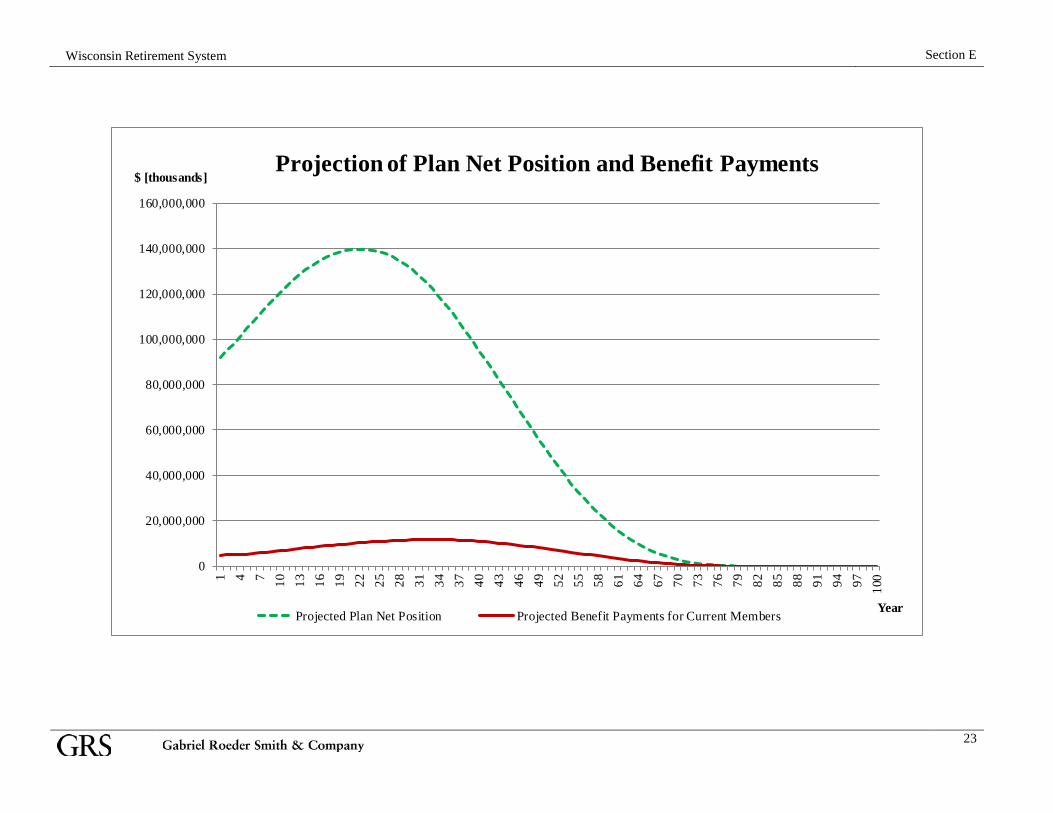
GASB Statement No. 67 includes a specific requirement for the discount rate that is used for the purpose of the measurement of the Total Pension Liability. This rate considers the ability of the fund to meet benefit obligations in the future. To make this determination, employer contributions, employee contributions, benefit payments, expenses and investment returns are projected into the future. The Plan Net Position (assets) in future years can then be determined and compared to its obligation to make benefit payments in those years. As long as assets are projected to be on hand in a future year, the assumed valuation discount rate is used. In years where assets are not projected to be sufficient to meet benefit payments, the use of a municipal bond rate is required, as described in the following paragraph. The Single Discount Rate (SDR) is equivalent to applying these two rates to the benefits that are projected to be paid during the different time periods. The SDR reflects (1) the long-term expected rate of return on pension plan investments (during the period in which the fiduciary net position is projected to be sufficient to pay benefits) and (2) tax-exempt municipal bond rate based on an index of 20-year general obligation bonds with an average AA credit rating (which is published by the Bond Buyer Index) as of the measurement date (to the extent that the contributions for use with the long-term expected rate of return are not met). For the purpose of this valuation, the expected rate of return on pension plan investments is 7.20%; the municipal bond rate is 3.57%; and the resulting single discount rate is 7.20%. The tables in this section provide background for the development of the single discount rate. The Projection of Contributions table shows the development of expected contributions in future years. Normal Cost contributions for future hires are not included (nor are their liabilities). The contribution rate for the first year was developed from the 2014 actuarial valuations (13.60%). Expected contribution rates gradually increase as the unrecognized asset losses from the Market Recognition Account are phased in over the next 5 years. The expected contribution rate then remains level for 20 years and is assumed to migrate to the ultimate contribution rate of 13.4% once the Experience Amortization Reserve (EAR) component is paid down. The Projection of Plan Fiduciary Net Position table shows the development of expected asset levels in future years. Please note, that for the purposes of this projection, we have reduced the Plan Fiduciary Net Position as of December 31, 2013 to the Actuarial Accrued Liability as of December 31, 2013 (the amount of overfunding was set to zero to simplify the projection). The Present Values of Projected Benefit Payments table shows the development of the Single Discount Rate (SDR). It breaks down the benefit payments into present values for funded and unfunded portions and shows the equivalent total at the SDR. The WRS funding policy as it affects the closed group cannot be modelled with 100% accuracy. In reality, assets that appear to be left over after all benefit obligations are satisfied would be assigned to the funding benefits of people who enter the plan after the measurement date.
Section E
17
Wisconsin Retirement System
SINGLE DISCOUNT RATE DEVELOPMENT PROJECTION OF CONTRIBUTIONS ENDING DECEMBER 31, 2115
Payroll for Current Employees
Contributions from Current Employees
Normal Cost Contributions
UALContributions
Total Contributions
0 13,273,088,436$ 1 13,276,474,329 902,800,255$ 902,800,255$ -$ 1,805,600,510$ 2 12,935,200,015 905,464,001 905,464,001 - 1,810,928,002 3 12,634,392,472 884,407,473 884,407,473 - 1,768,814,946 4 12,341,302,304 873,147,138 873,147,138 - 1,746,294,276 5 12,043,512,125 876,165,507 876,165,507 - 1,752,331,014 6 11,738,604,914 874,619,975 874,619,975 - 1,749,239,950 7 11,425,512,815 851,292,109 851,292,109 - 1,702,584,218 8 11,104,965,790 827,408,791 827,408,791 - 1,654,817,582 9 10,777,867,059 803,037,319 803,037,319 - 1,606,074,638
10 10,440,684,744 777,914,539 777,914,539 - 1,555,829,078 11 10,092,957,638 752,006,088 752,006,088 - 1,504,012,176 12 9,735,495,337 725,372,287 725,372,287 - 1,450,744,574 13 9,368,252,300 698,009,743 698,009,743 - 1,396,019,486 14 8,990,986,344 669,900,411 669,900,411 - 1,339,800,822 15 8,605,861,035 641,205,494 641,205,494 - 1,282,410,988 16 8,214,391,932 612,037,914 612,037,914 - 1,224,075,828 17 7,814,568,030 582,247,835 582,247,835 - 1,164,495,670 18 7,408,104,065 551,963,018 551,963,018 - 1,103,926,036 19 6,996,324,876 521,282,174 521,282,174 - 1,042,564,348 20 6,577,368,904 490,066,603 490,066,603 - 980,133,206 21 6,152,974,255 458,445,806 458,445,806 - 916,891,612 22 5,725,794,077 426,617,465 426,617,465 - 853,234,930 23 5,296,465,595 394,629,059 394,629,059 - 789,258,118 24 4,866,445,076 362,589,090 362,589,090 - 725,178,180 25 4,438,782,956 330,724,841 330,724,841 - 661,449,682 26 4,014,728,431 299,129,386 299,129,386 - 598,258,772 27 3,593,365,885 267,734,506 267,734,506 - 535,469,012 28 3,173,499,696 212,624,480 212,624,480 - 425,248,960 29 2,756,210,756 184,666,121 184,666,121 - 369,332,242 30 2,348,195,560 157,329,103 157,329,103 - 314,658,206 31 1,964,055,510 131,591,719 131,591,719 - 263,183,438 32 1,616,231,404 108,287,504 108,287,504 - 216,575,008 33 1,309,598,732 87,743,115 87,743,115 - 175,486,230 34 1,047,105,313 70,156,056 70,156,056 - 140,312,112 35 828,901,725 55,536,416 55,536,416 - 111,072,832 36 650,820,285 43,604,959 43,604,959 - 87,209,918 37 506,161,343 33,912,810 33,912,810 - 67,825,620 38 389,491,641 26,095,940 26,095,940 - 52,191,880 39 296,557,017 19,869,320 19,869,320 - 39,738,640 40 223,575,890 14,979,585 14,979,585 - 29,959,170 41 167,031,119 11,191,085 11,191,085 - 22,382,170 42 123,712,682 8,288,750 8,288,750 - 16,577,500 43 90,888,897 6,089,556 6,089,556 - 12,179,112 44 66,280,269 4,440,778 4,440,778 - 8,881,556 45 47,729,204 3,197,857 3,197,857 - 6,395,714 46 33,835,309 2,266,966 2,266,966 - 4,533,932 47 23,641,258 1,583,965 1,583,965 - 3,167,930 48 16,125,749 1,080,425 1,080,425 - 2,160,850 49 10,634,717 712,526 712,526 - 1,425,052 50 6,534,869 437,836 437,836 - 875,672
Year
Section E
18
Wisconsin Retirement System
SINGLE DISCOUNT RATE DEVELOPMENT PROJECTION OF CONTRIBUTIONS ENDING DECEMBER 31, 2115
(CONCLUDED) Payroll for
Current EmployeesContributions from Current Employees
Normal CostContributions
UALContributions
Total Contributions
51 3,592,075$ 240,669$ 240,669$ -$ 481,338$ 52 1,760,337 117,943 117,943 - 235,886 53 787,037 52,732 52,732 - 105,464 54 340,120 22,788 22,788 - 45,576 55 140,362 9,405 9,405 - 18,810 56 44,395 2,975 2,975 - 5,950 57 8,750 587 587 - 1,174 58 413 28 28 - 56 59 - - - - - 60 - - - - - 61 - - - - - 62 - - - - - 63 - - - - - 64 - - - - - 65 - - - - - 66 - - - - - 67 - - - - - 68 - - - - - 69 - - - - - 70 - - - - - 71 - - - - - 72 - - - - - 73 - - - - - 74 - - - - - 75 - - - - - 76 - - - - - 77 - - - - - 78 - - - - - 79 - - - - - 80 - - - - - 81 - - - - - 82 - - - - - 83 - - - - - 84 - - - - - 85 - - - - - 86 - - - - - 87 - - - - - 88 - - - - - 89 - - - - - 90 - - - - - 91 - - - - - 92 - - - - - 93 - - - - - 94 - - - - - 95 - - - - - 96 - - - - - 97 - - - - - 98 - - - - - 99 - - - - -
100 - - - - -
Year
Section E
19
Wisconsin Retirement System
SINGLE DISCOUNT RATE DEVELOPMENT PROJECTION OF PLAN FIDUCIARY NET POSITION ENDING
DECEMBER 31, 2115
Projected Beginning Plan Net Position*
Projected Total Contributions
Projected Benefit Payments Including Dividends
Projected Investment
Earnings at 7.20%Projected Ending Plan
Net Position(a) (b) (c) (d) (e)=(a)+(b)-(c)+(d)
1 88,504,670,309$ 1,805,600,510$ 4,926,824,052$ 6,261,925,076$ 91,645,371,842$ 2 91,645,371,842 1,810,928,002 5,103,051,644 6,482,010,110 94,835,258,310 3 94,835,258,310 1,768,814,946 5,241,833,334 6,705,282,905 98,067,522,827 4 98,067,522,827 1,746,294,276 5,365,681,135 6,932,828,264 101,380,964,231 5 101,380,964,231 1,752,331,014 5,502,413,989 7,166,772,758 104,797,654,014 6 104,797,654,014 1,749,239,950 5,754,056,695 7,403,763,386 108,196,600,655 7 108,196,600,655 1,702,584,218 6,028,648,542 7,637,123,627 111,507,659,957 8 111,507,659,957 1,654,817,582 6,316,494,809 7,863,647,816 114,709,630,545 9 114,709,630,545 1,606,074,638 6,611,595,899 8,082,026,446 117,786,135,730
10 117,786,135,730 1,555,829,078 6,913,838,283 8,291,065,795 120,719,192,321 11 120,719,192,321 1,504,012,176 7,222,531,118 8,489,493,080 123,490,166,459 12 123,490,166,459 1,450,744,574 7,534,946,098 8,676,067,442 126,082,032,377 13 126,082,032,377 1,396,019,486 7,846,770,782 8,849,715,336 128,480,996,417 14 128,480,996,417 1,339,800,822 8,153,146,210 9,009,614,224 130,677,265,254 15 130,677,265,254 1,282,410,988 8,451,230,920 9,155,170,907 132,663,616,230 16 132,663,616,230 1,224,075,828 8,747,915,547 9,285,629,591 134,425,406,102 17 134,425,406,102 1,164,495,670 9,040,955,601 9,400,004,759 135,948,950,930 18 135,948,950,930 1,103,926,036 9,324,989,309 9,497,509,875 137,225,397,531 19 137,225,397,531 1,042,564,348 9,599,613,558 9,577,528,753 138,245,877,074 20 138,245,877,074 980,133,206 9,865,873,935 9,639,376,038 138,999,512,384 21 138,999,512,384 916,891,612 10,120,616,714 9,682,389,297 139,478,176,579 22 139,478,176,579 853,234,930 10,357,258,776 9,706,230,253 139,680,382,985 23 139,680,382,985 789,258,118 10,576,172,648 9,710,782,046 139,604,250,502 24 139,604,250,502 725,178,180 10,781,678,465 9,695,764,092 139,243,514,309 25 139,243,514,309 661,449,682 10,972,832,955 9,660,774,772 138,592,905,807 26 138,592,905,807 598,258,772 11,145,739,814 9,605,579,159 137,651,003,924 27 137,651,003,924 535,469,012 11,304,231,143 9,529,934,554 136,412,176,347 28 136,412,176,347 425,248,960 11,448,878,368 9,431,723,210 134,820,270,149 29 134,820,270,149 369,332,242 11,579,320,034 9,310,513,661 132,920,796,017 30 132,920,796,017 314,658,206 11,693,203,175 9,167,788,926 130,710,039,975 31 130,710,039,975 263,183,438 11,782,748,217 9,003,626,010 128,194,101,206 32 128,194,101,206 216,575,008 11,840,588,276 8,818,783,624 125,388,871,561 33 125,388,871,561 175,486,230 11,861,783,861 8,614,603,822 122,317,177,752 34 122,317,177,752 140,312,112 11,847,474,859 8,392,703,778 119,002,718,784 35 119,002,718,784 111,072,832 11,799,439,730 8,154,727,623 115,469,079,508 36 115,469,079,508 87,209,918 11,716,378,031 7,902,399,712 111,742,311,107 37 111,742,311,107 67,825,620 11,601,278,498 7,637,458,250 107,846,316,479 38 107,846,316,479 52,191,880 11,458,748,438 7,361,435,508 103,801,195,429 39 103,801,195,429 39,738,640 11,288,837,939 7,075,756,738 99,627,852,868 40 99,627,852,868 29,959,170 11,091,784,736 6,781,900,756 95,347,928,058 41 95,347,928,058 22,382,170 10,866,305,177 6,481,454,326 90,985,459,377 42 90,985,459,377 16,577,500 10,610,270,364 6,176,208,304 86,567,974,817 43 86,567,974,817 12,179,112 10,324,885,440 5,868,089,126 82,123,357,616 44 82,123,357,616 8,881,556 10,015,621,265 5,558,900,051 77,675,517,958 45 77,675,517,958 6,395,714 9,688,990,566 5,250,122,003 73,243,045,109 46 73,243,045,109 4,533,932 9,348,405,909 4,942,966,052 68,842,139,183 47 68,842,139,183 3,167,930 8,995,312,984 4,638,542,929 64,488,537,058 48 64,488,537,058 2,160,850 8,631,524,106 4,337,916,738 60,197,090,540 49 60,197,090,540 1,425,052 8,258,435,638 4,042,104,314 55,982,184,268 50 55,982,184,268 875,672 7,877,528,624 3,752,085,959 51,857,617,275
Year
Section E
20
Wisconsin Retirement System
SINGLE DISCOUNT RATE DEVELOPMENT PROJECTION OF PLAN FIDUCIARY NET POSITION ENDING
DECEMBER 31, 2115 (CONCLUDED)
Projected Beginning Plan Net Position
Projected Total Contributions
Projected Benefit Payments Including Dividends
Projected Investment
Earnings at 7.20%Projected Ending Plan
Net Position(a) (b) (c) (d) (e)=(a)+(b)-(c)+(d)
51 51,857,617,275$ 481,338$ 7,489,824,021$ 3,468,817,976$ 47,837,092,567$ 52 47,837,092,567 235,886 7,096,293,731 3,193,252,384 43,934,287,106 53 43,934,287,106 105,464 6,698,484,188 2,926,318,023 40,162,226,405 54 40,162,226,405 45,576 6,298,223,850 2,668,886,474 36,532,934,606 55 36,532,934,606 18,810 5,897,303,655 2,421,758,801 33,057,408,561 56 33,057,408,561 5,950 5,497,315,525 2,185,669,782 29,745,768,768 57 29,745,768,768 1,174 5,099,783,937 1,961,293,961 26,607,279,966 58 26,607,279,966 56 4,706,373,956 1,749,239,341 23,650,145,407 59 23,650,145,407 - 4,318,897,586 1,550,032,368 20,881,280,189 60 20,881,280,189 - 3,939,305,698 1,364,101,880 18,306,076,371 61 18,306,076,371 - 3,569,679,466 1,191,762,485 15,928,159,391 62 15,928,159,391 - 3,212,186,753 1,033,198,527 13,749,171,164 63 13,749,171,164 - 2,868,984,499 888,451,924 11,768,638,589 64 11,768,638,589 - 2,542,136,527 757,415,606 9,983,917,667 65 9,983,917,667 - 2,233,499,106 639,833,541 8,390,252,102 66 8,390,252,102 - 1,944,590,753 535,309,559 6,980,970,908 67 6,980,970,908 - 1,676,580,628 443,321,992 5,747,712,272 68 5,747,712,272 - 1,430,340,543 363,237,947 4,680,609,677 69 4,680,609,677 - 1,206,459,782 294,326,192 3,768,476,088 70 3,768,476,088 - 1,005,260,656 235,769,858 2,998,985,289 71 2,998,985,289 - 826,817,349 186,678,832 2,358,846,773 72 2,358,846,773 - 670,924,041 146,103,480 1,834,026,212 73 1,834,026,212 - 537,020,024 113,053,165 1,410,059,353 74 1,410,059,353 - 424,103,772 86,521,887 1,072,477,468 75 1,072,477,468 - 330,665,247 65,521,317 807,333,538 76 807,333,538 - 254,724,931 49,117,291 601,725,899 77 601,725,899 - 194,008,439 36,461,346 444,178,806 78 444,178,806 - 146,165,856 26,810,355 324,823,306 79 324,823,306 - 108,954,197 19,533,096 235,402,205 80 235,402,205 - 80,354,436 14,106,475 169,154,243 81 169,154,243 - 58,621,706 10,105,402 120,637,940 82 120,637,940 - 42,289,183 7,189,980 85,538,736 83 85,538,736 - 30,150,198 5,092,246 60,480,784 84 60,480,784 - 21,228,135 3,603,685 42,856,335 85 42,856,335 - 14,744,818 2,564,068 30,675,584 86 30,675,584 - 10,090,596 1,851,694 22,436,683 87 22,436,683 - 6,794,436 1,375,093 17,017,339 88 17,017,339 - 4,496,836 1,066,176 13,586,679 89 13,586,679 - 2,923,114 874,838 11,538,403 90 11,538,403 - 1,864,301 764,817 10,438,918 91 10,438,918 - 1,165,774 710,364 9,983,507 92 9,983,507 - 713,397 693,577 9,963,687 93 9,963,687 - 425,027 702,350 10,241,011 94 10,241,011 - 244,262 728,712 10,725,461 95 10,725,461 - 132,962 767,530 11,360,029 96 11,360,029 - 66,548 815,568 12,109,050 97 12,109,050 - 29,850 870,796 12,949,995 98 12,949,995 - 12,164 931,969 13,869,801 99 13,869,801 - 4,877 998,453 14,863,377
100 14,863,377 - 2,672 1,070,069 15,930,773
Year
Section E
21
Wisconsin Retirement System
SINGLE DISCOUNT RATE DEVELOPMENT PRESENT VALUES OF PROJECTED BENEFITS
ENDING DECEMBER 31, 2115
Projected Beginning Plan
Net PositionProjected Benefit
PaymentsFunded Portion of Benefit Payments
Unfunded Portion of Benefit Payments
Present Value of Funded Benefit Payments using Expected Return
Rate (v)
Present Value of Unfunded Benefit Payments using Municipal Bond
Rate (vf)
Present Value of Benefit
Payments using Single Discount
Rate (sdr)(b) (c) (d) (e) (f)=(d)*v^((a)-.5) (g)=(e)*vf ^((a)-.5) (h)=((c)/(1+sdr)^(a-.5)
1 88,504,670,309$ 4,926,824,052$ 4,926,824,052$ -$ 4,758,495,470$ -$ 4,758,495,470$ 2 91,645,371,842 5,103,051,644 5,103,051,644 - 4,597,669,885 - 4,597,669,885 3 94,835,258,310 5,241,833,334 5,241,833,334 - 4,405,510,543 - 4,405,510,543 4 98,067,522,827 5,365,681,135 5,365,681,135 - 4,206,715,209 - 4,206,715,209 5 101,380,964,231 5,502,413,989 5,502,413,989 - 4,024,173,794 - 4,024,173,794 6 104,797,654,014 5,754,056,695 5,754,056,695 - 3,925,570,825 - 3,925,570,825 7 108,196,600,655 6,028,648,542 6,028,648,542 - 3,836,664,833 - 3,836,664,833 8 111,507,659,957 6,316,494,809 6,316,494,809 - 3,749,861,724 - 3,749,861,724 9 114,709,630,545 6,611,595,899 6,611,595,899 - 3,661,429,077 - 3,661,429,077
10 117,786,135,730 6,913,838,283 6,913,838,283 - 3,571,648,865 - 3,571,648,865 11 120,719,192,321 7,222,531,118 7,222,531,118 - 3,480,520,334 - 3,480,520,334 12 123,490,166,459 7,534,946,098 7,534,946,098 - 3,387,194,366 - 3,387,194,366 13 126,082,032,377 7,846,770,782 7,846,770,782 - 3,290,456,466 - 3,290,456,466 14 128,480,996,417 8,153,146,210 8,153,146,210 - 3,189,301,876 - 3,189,301,876 15 130,677,265,254 8,451,230,920 8,451,230,920 - 3,083,866,582 - 3,083,866,582 16 132,663,616,230 8,747,915,547 8,747,915,547 - 2,977,730,633 - 2,977,730,633 17 134,425,406,102 9,040,955,601 9,040,955,601 - 2,870,783,081 - 2,870,783,081 18 135,948,950,930 9,324,989,309 9,324,989,309 - 2,762,101,278 - 2,762,101,278 19 137,225,397,531 9,599,613,558 9,599,613,558 - 2,652,468,416 - 2,652,468,416 20 138,245,877,074 9,865,873,935 9,865,873,935 - 2,542,946,640 - 2,542,946,640 21 138,999,512,384 10,120,616,714 10,120,616,714 - 2,433,402,096 - 2,433,402,096 22 139,478,176,579 10,357,258,776 10,357,258,776 - 2,323,041,359 - 2,323,041,359 23 139,680,382,985 10,576,172,648 10,576,172,648 - 2,212,818,844 - 2,212,818,844 24 139,604,250,502 10,781,678,465 10,781,678,465 - 2,104,306,129 - 2,104,306,129 25 139,243,514,309 10,972,832,955 10,972,832,955 - 1,997,774,781 - 1,997,774,781 26 138,592,905,807 11,145,739,814 11,145,739,814 - 1,892,961,905 - 1,892,961,905 27 137,651,003,924 11,304,231,143 11,304,231,143 - 1,790,932,498 - 1,790,932,498 28 136,412,176,347 11,448,878,368 11,448,878,368 - 1,692,023,319 - 1,692,023,319 29 134,820,270,149 11,579,320,034 11,579,320,034 - 1,596,363,078 - 1,596,363,078 30 132,920,796,017 11,693,203,175 11,693,203,175 - 1,503,790,468 - 1,503,790,468 31 130,710,039,975 11,782,748,217 11,782,748,217 - 1,413,531,998 - 1,413,531,998 32 128,194,101,206 11,840,588,276 11,840,588,276 - 1,325,066,094 - 1,325,066,094 33 125,388,871,561 11,861,783,861 11,861,783,861 - 1,238,281,778 - 1,238,281,778 34 122,317,177,752 11,847,474,859 11,847,474,859 - 1,153,720,173 - 1,153,720,173 35 119,002,718,784 11,799,439,730 11,799,439,730 - 1,071,867,965 - 1,071,867,965 36 115,469,079,508 11,716,378,031 11,716,378,031 - 992,838,239 - 992,838,239 37 111,742,311,107 11,601,278,498 11,601,278,498 - 917,056,697 - 917,056,697 38 107,846,316,479 11,458,748,438 11,458,748,438 - 844,953,354 - 844,953,354 39 103,801,195,429 11,288,837,939 11,288,837,939 - 776,515,273 - 776,515,273 40 99,627,852,868 11,091,784,736 11,091,784,736 - 711,717,117 - 711,717,117 41 95,347,928,058 10,866,305,177 10,866,305,177 - 650,418,808 - 650,418,808 42 90,985,459,377 10,610,270,364 10,610,270,364 - 592,437,933 - 592,437,933 43 86,567,974,817 10,324,885,440 10,324,885,440 - 537,782,745 - 537,782,745 44 82,123,357,616 10,015,621,265 10,015,621,265 - 486,636,557 - 486,636,557 45 77,675,517,958 9,688,990,566 9,688,990,566 - 439,147,672 - 439,147,672 46 73,243,045,109 9,348,405,909 9,348,405,909 - 395,252,684 - 395,252,684 47 68,842,139,183 8,995,312,984 8,995,312,984 - 354,779,698 - 354,779,698 48 64,488,537,058 8,631,524,106 8,631,524,106 - 317,566,866 - 317,566,866 49 60,197,090,540 8,258,435,638 8,258,435,638 - 283,433,186 - 283,433,186 50 55,982,184,268 7,877,528,624 7,877,528,624 - 252,201,761 - 252,201,761
Year(a)
Section E
22
Wisconsin Retirement System
SINGLE DISCOUNT RATE DEVELOPMENT PRESENT VALUES OF PROJECTED BENEFITS ENDING DECEMBER 31, 2115 (CONTINUED)
Projected Beginning Plan
Net PositionProjected Benefit
PaymentsFunded Portion of Benefit Payments
Unfunded Portion of Benefit Payments
Present Value of Funded Benefit Payments using Expected Return
Rate (v)
Present Value of Unfunded Benefit Payments using Municipal Bond
Rate (vf)
Present Value of Benefit
Payments using Single Discount
Rate (sdr)(b) (c) (d) (e) (f)=(d)*v^((a)-.5) (g)=(e)*vf ^((a)-.5) (h)=((c)/(1+sdr)^(a-.5)
51 51,857,617,275$ 7,489,824,021$ 7,489,824,021$ -$ 223,684,017$ -$ 223,684,017$ 52 47,837,092,567 7,096,293,731 7,096,293,731 - 197,697,027 - 197,697,027 53 43,934,287,106 6,698,484,188 6,698,484,188 - 174,080,572 - 174,080,572 54 40,162,226,405 6,298,223,850 6,298,223,850 - 152,685,247 - 152,685,247 55 36,532,934,606 5,897,303,655 5,897,303,655 - 133,363,716 - 133,363,716 56 33,057,408,561 5,497,315,525 5,497,315,525 - 115,968,510 - 115,968,510 57 29,745,768,768 5,099,783,937 5,099,783,937 - 100,356,707 - 100,356,707 58 26,607,279,966 4,706,373,956 4,706,373,956 - 86,394,536 - 86,394,536 59 23,650,145,407 4,318,897,586 4,318,897,586 - 73,956,775 - 73,956,775 60 20,881,280,189 3,939,305,698 3,939,305,698 - 62,925,975 - 62,925,975 61 18,306,076,371 3,569,679,466 3,569,679,466 - 53,191,802 - 53,191,802 62 15,928,159,391 3,212,186,753 3,212,186,753 - 44,650,002 - 44,650,002 63 13,749,171,164 2,868,984,499 2,868,984,499 - 37,200,957 - 37,200,957 64 11,768,638,589 2,542,136,527 2,542,136,527 - 30,748,930 - 30,748,930 65 9,983,917,667 2,233,499,106 2,233,499,106 - 25,201,253 - 25,201,253 66 8,390,252,102 1,944,590,753 1,944,590,753 - 20,467,735 - 20,467,735 67 6,980,970,908 1,676,580,628 1,676,580,628 - 16,461,569 - 16,461,569 68 5,747,712,272 1,430,340,543 1,430,340,543 - 13,100,608 - 13,100,608 69 4,680,609,677 1,206,459,782 1,206,459,782 - 10,307,897 - 10,307,897 70 3,768,476,088 1,005,260,656 1,005,260,656 - 8,012,003 - 8,012,003 71 2,998,985,289 826,817,349 826,817,349 - 6,147,198 - 6,147,198 72 2,358,846,773 670,924,041 670,924,041 - 4,653,141 - 4,653,141 73 1,834,026,212 537,020,024 537,020,024 - 3,474,310 - 3,474,310 74 1,410,059,353 424,103,772 424,103,772 - 2,559,502 - 2,559,502 75 1,072,477,468 330,665,247 330,665,247 - 1,861,560 - 1,861,560 76 807,333,538 254,724,931 254,724,931 - 1,337,720 - 1,337,720 77 601,725,899 194,008,439 194,008,439 - 950,429 - 950,429 78 444,178,806 146,165,856 146,165,856 - 667,959 - 667,959 79 324,823,306 108,954,197 108,954,197 - 464,465 - 464,465 80 235,402,205 80,354,436 80,354,436 - 319,539 - 319,539 81 169,154,243 58,621,706 58,621,706 - 217,459 - 217,459 82 120,637,940 42,289,183 42,289,183 - 146,337 - 146,337 83 85,538,736 30,150,198 30,150,198 - 97,324 - 97,324 84 60,480,784 21,228,135 21,228,135 - 63,922 - 63,922 85 42,856,335 14,744,818 14,744,818 - 41,417 - 41,417 86 30,675,584 10,090,596 10,090,596 - 26,440 - 26,440 87 22,436,683 6,794,436 6,794,436 - 16,608 - 16,608 88 17,017,339 4,496,836 4,496,836 - 10,253 - 10,253 89 13,586,679 2,923,114 2,923,114 - 6,217 - 6,217 90 11,538,403 1,864,301 1,864,301 - 3,699 - 3,699 91 10,438,918 1,165,774 1,165,774 - 2,158 - 2,158 92 9,983,507 713,397 713,397 - 1,232 - 1,232 93 9,963,687 425,027 425,027 - 685 - 685 94 10,241,011 244,262 244,262 - 367 - 367 95 10,725,461 132,962 132,962 - 186 - 186 96 11,360,029 66,548 66,548 - 87 - 87 97 12,109,050 29,850 29,850 - 36 - 36 98 12,949,995 12,164 12,164 - 14 - 14 99 13,869,801 4,877 4,877 - 5 - 5
100 14,863,377 2,672 2,672 - 3 - 3 Totals 106,881,257,084$ -$ 106,881,257,084$
Year(a)
Section E
23
Wisconsin Retirement System
0
20,000,000
40,000,000
60,000,000
80,000,000
100,000,000
120,000,000
140,000,000
160,000,0001 4 7 10 13 16 19 22 25 28 31 34 37 40 43 46 49 52 55 58 61 64 67 70 73 76 79 82 85 88 91 94 97 100
$ [thousands]
Year
Projection of Plan Net Position and Benefit Payments
Projected Plan Net Position Projected Benefit Payments for Current Members
SECTION F SUMMARY OF ASSUMPTIONS
Section A Financial Statements
Section F
24
Wisconsin Retirement System
SUMMARY OF ASSUMPTIONS USED TO DEVELOP TOTAL PENSION LIABILITY
ASSUMPTIONS ADOPTED BY ETF BOARD AFTER CONSULTING WITH ACTUARY
Economic Assumptions
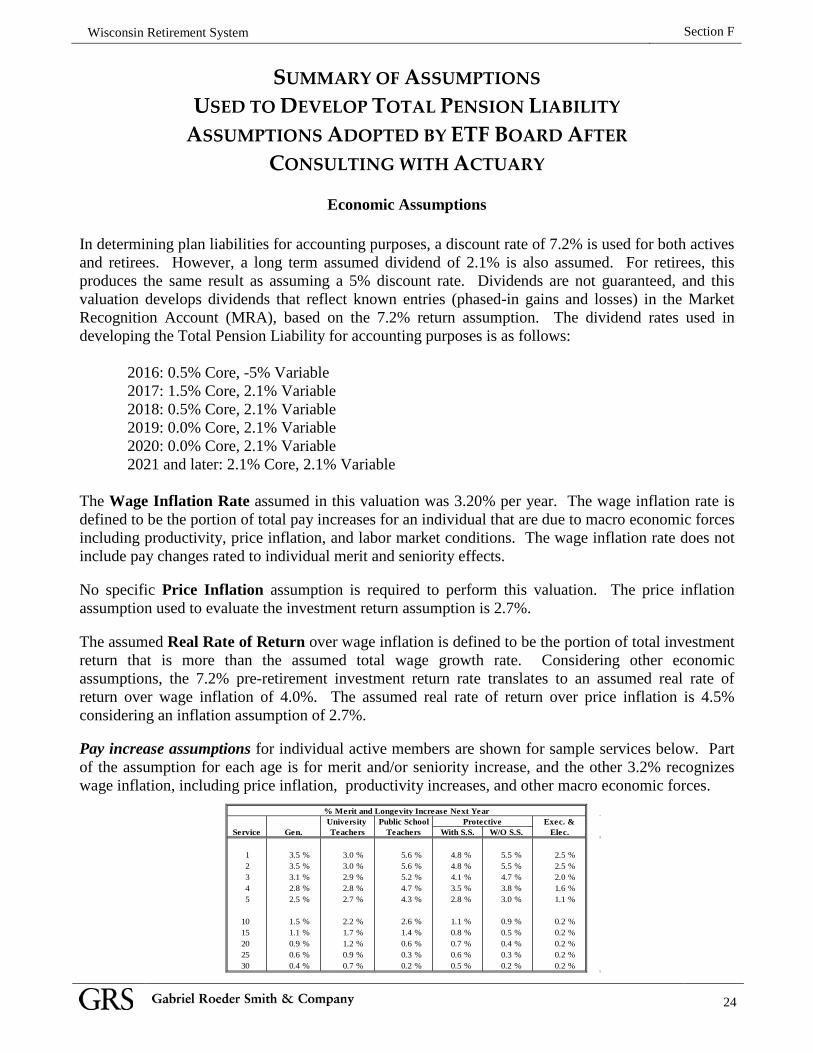
In determining plan liabilities for accounting purposes, a discount rate of 7.2% is used for both actives and retirees. However, a long term assumed dividend of 2.1% is also assumed. For retirees, this produces the same result as assuming a 5% discount rate. Dividends are not guaranteed, and this valuation develops dividends that reflect known entries (phased-in gains and losses) in the Market Recognition Account (MRA), based on the 7.2% return assumption. The dividend rates used in developing the Total Pension Liability for accounting purposes is as follows:
2016: 0.5% Core, -5% Variable 2017: 1.5% Core, 2.1% Variable 2018: 0.5% Core, 2.1% Variable 2019: 0.0% Core, 2.1% Variable 2020: 0.0% Core, 2.1% Variable 2021 and later: 2.1% Core, 2.1% Variable
The Wage Inflation Rate assumed in this valuation was 3.20% per year. The wage inflation rate is defined to be the portion of total pay increases for an individual that are due to macro economic forces including productivity, price inflation, and labor market conditions. The wage inflation rate does not include pay changes rated to individual merit and seniority effects. No specific Price Inflation assumption is required to perform this valuation. The price inflation assumption used to evaluate the investment return assumption is 2.7%. The assumed Real Rate of Return over wage inflation is defined to be the portion of total investment return that is more than the assumed total wage growth rate. Considering other economic assumptions, the 7.2% pre-retirement investment return rate translates to an assumed real rate of return over wage inflation of 4.0%. The assumed real rate of return over price inflation is 4.5% considering an inflation assumption of 2.7%. Pay increase assumptions for individual active members are shown for sample services below. Part of the assumption for each age is for merit and/or seniority increase, and the other 3.2% recognizes wage inflation, including price inflation, productivity increases, and other macro economic forces.
University Public School Exec. &Service Gen. Teachers Teachers With S.S. W/O S.S. Elec.
1 3.5 % 3.0 % 5.6 % 4.8 % 5.5 % 2.5 % 2 3.5 % 3.0 % 5.6 % 4.8 % 5.5 % 2.5 % 3 3.1 % 2.9 % 5.2 % 4.1 % 4.7 % 2.0 % 4 2.8 % 2.8 % 4.7 % 3.5 % 3.8 % 1.6 % 5 2.5 % 2.7 % 4.3 % 2.8 % 3.0 % 1.1 %
10 1.5 % 2.2 % 2.6 % 1.1 % 0.9 % 0.2 % 15 1.1 % 1.7 % 1.4 % 0.8 % 0.5 % 0.2 % 20 0.9 % 1.2 % 0.6 % 0.7 % 0.4 % 0.2 % 25 0.6 % 0.9 % 0.3 % 0.6 % 0.3 % 0.2 % 30 0.4 % 0.7 % 0.2 % 0.5 % 0.2 % 0.2 %
Protective% Merit and Longevity Increase Next Year
Section F
25
Wisconsin Retirement System
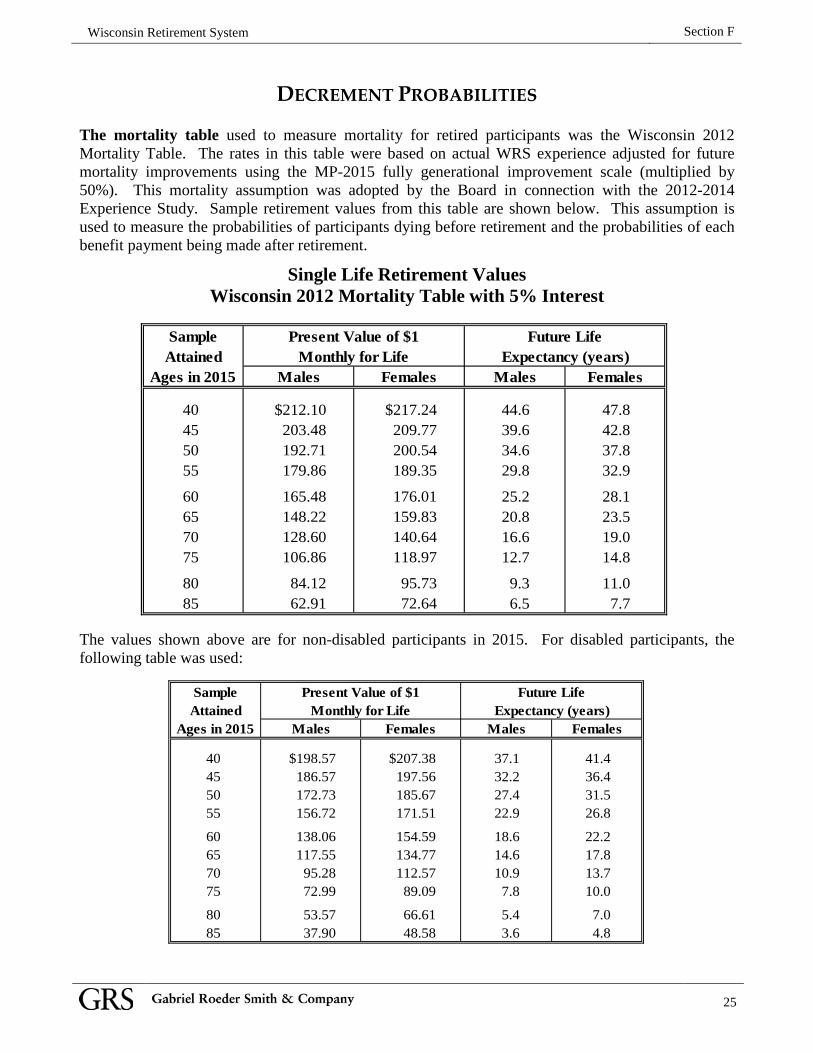
DECREMENT PROBABILITIES The mortality table used to measure mortality for retired participants was the Wisconsin 2012 Mortality Table. The rates in this table were based on actual WRS experience adjusted for future mortality improvements using the MP-2015 fully generational improvement scale (multiplied by 50%). This mortality assumption was adopted by the Board in connection with the 2012-2014 Experience Study. Sample retirement values from this table are shown below. This assumption is used to measure the probabilities of participants dying before retirement and the probabilities of each benefit payment being made after retirement.
Single Life Retirement Values Wisconsin 2012 Mortality Table with 5% Interest
SampleAttained
Ages in 2015 Males Females
40 44.6 47.8 45 39.6 42.8 50 34.6 37.8 55 29.8 32.9
60 25.2 28.1 65 20.8 23.5 70 16.6 19.0 75 12.7 14.8
80 9.3 11.0 85 6.5 7.7
179.86
$212.10 203.48 192.71
Future LifeExpectancy (years)Monthly for Life
Present Value of $1
Males Females
95.73 72.64
165.48 148.22 128.60
$217.24 209.77 200.54 189.35
84.12 62.91
176.01 159.83 140.64 118.97 106.86
The values shown above are for non-disabled participants in 2015. For disabled participants, the following table was used:
SampleAttained
Ages in 2015 Males Females
40 37.1 41.4 45 32.2 36.4 50 27.4 31.5 55 22.9 26.8
60 18.6 22.2 65 14.6 17.8 70 10.9 13.7 75 7.8 10.0
80 5.4 7.0 85 3.6 4.8
$207.38 197.56 185.67 171.51
53.57 37.90
154.59 134.77 112.57
89.09 72.99
66.61 48.58
117.55 95.28
156.72
138.06
$198.57 186.57 172.73
Future LifeExpectancy (years)Monthly for Life
Present Value of $1
Males Females
Section F
26
Wisconsin Retirement System
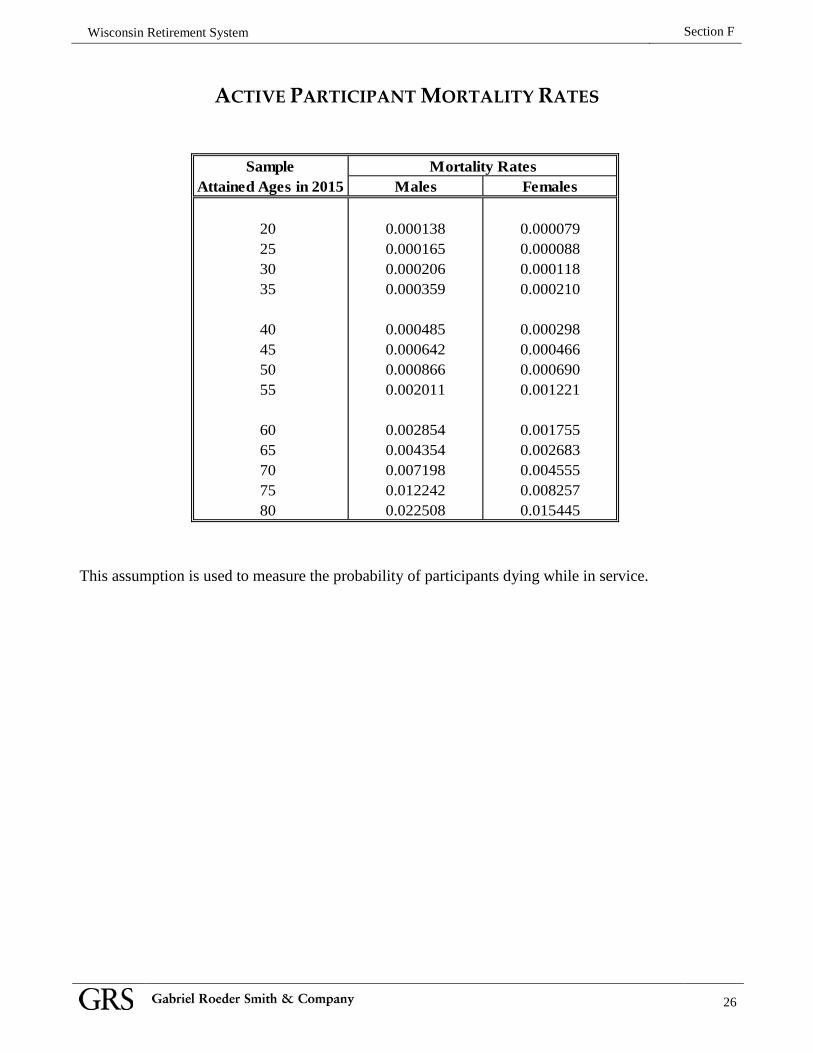
ACTIVE PARTICIPANT MORTALITY RATES
SampleAttained Ages in 2015
20253035
40455055
6065707580
Mortality RatesMales
0.000138
Females
0.000079
0.0043540.004555
0.001221
0.000466
0.001755
0.000690
0.0082570.0122420.022508
0.007198
0.015445
0.0001650.0002060.000359
0.0004850.0006420.0008660.002011
0.002854
0.0000880.0001180.000210
0.000298
0.002683
This assumption is used to measure the probability of participants dying while in service.
Section F
27
Wisconsin Retirement System
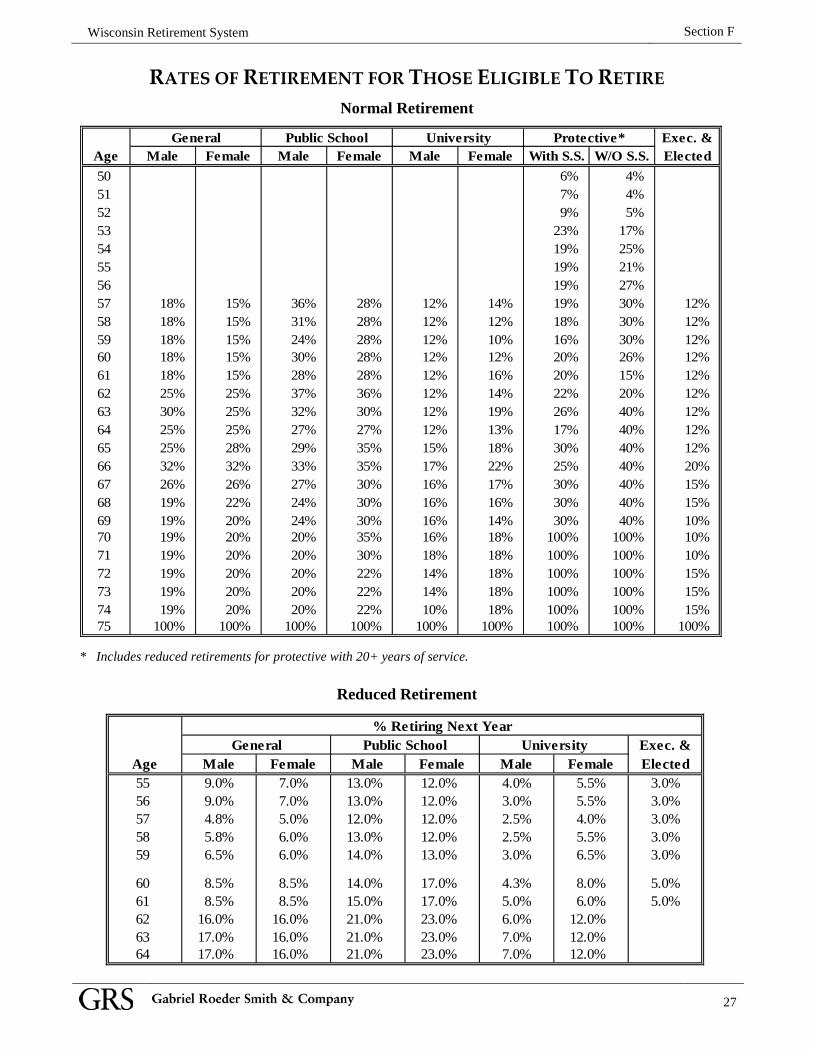
RATES OF RETIREMENT FOR THOSE ELIGIBLE TO RETIRE Normal Retirement
Exec. &Age Male Female Male Female Male Female With S.S. W/O S.S. Elected50 6% 4% 51 7% 4% 52 9% 5% 53 23% 17% 54 19% 25% 55 19% 21% 56 19% 27% 57 18% 15% 36% 28% 12% 14% 19% 30% 12% 58 18% 15% 31% 28% 12% 12% 18% 30% 12% 59 18% 15% 24% 28% 12% 10% 16% 30% 12% 60 18% 15% 30% 28% 12% 12% 20% 26% 12% 61 18% 15% 28% 28% 12% 16% 20% 15% 12% 62 25% 25% 37% 36% 12% 14% 22% 20% 12% 63 30% 25% 32% 30% 12% 19% 26% 40% 12% 64 25% 25% 27% 27% 12% 13% 17% 40% 12% 65 25% 28% 29% 35% 15% 18% 30% 40% 12% 66 32% 32% 33% 35% 17% 22% 25% 40% 20% 67 26% 26% 27% 30% 16% 17% 30% 40% 15% 68 19% 22% 24% 30% 16% 16% 30% 40% 15% 69 19% 20% 24% 30% 16% 14% 30% 40% 10% 70 19% 20% 20% 35% 16% 18% 100% 100% 10% 71 19% 20% 20% 30% 18% 18% 100% 100% 10% 72 19% 20% 20% 22% 14% 18% 100% 100% 15% 73 19% 20% 20% 22% 14% 18% 100% 100% 15% 74 19% 20% 20% 22% 10% 18% 100% 100% 15% 75 100% 100% 100% 100% 100% 100% 100% 100% 100%
General Public School University Protective*
* Includes reduced retirements for protective with 20+ years of service.
Reduced Retirement
Exec. &Age Male Female Male Female Male Female Elected55 9.0% 7.0% 13.0% 12.0% 4.0% 5.5% 3.0% 56 9.0% 7.0% 13.0% 12.0% 3.0% 5.5% 3.0% 57 4.8% 5.0% 12.0% 12.0% 2.5% 4.0% 3.0% 58 5.8% 6.0% 13.0% 12.0% 2.5% 5.5% 3.0% 59 6.5% 6.0% 14.0% 13.0% 3.0% 6.5% 3.0%
60 8.5% 8.5% 14.0% 17.0% 4.3% 8.0% 5.0% 61 8.5% 8.5% 15.0% 17.0% 5.0% 6.0% 5.0% 62 16.0% 16.0% 21.0% 23.0% 6.0% 12.0% 63 17.0% 16.0% 21.0% 23.0% 7.0% 12.0% 64 17.0% 16.0% 21.0% 23.0% 7.0% 12.0%
UniversityPublic SchoolGeneral% Retiring Next Year
Section F
28
Wisconsin Retirement System
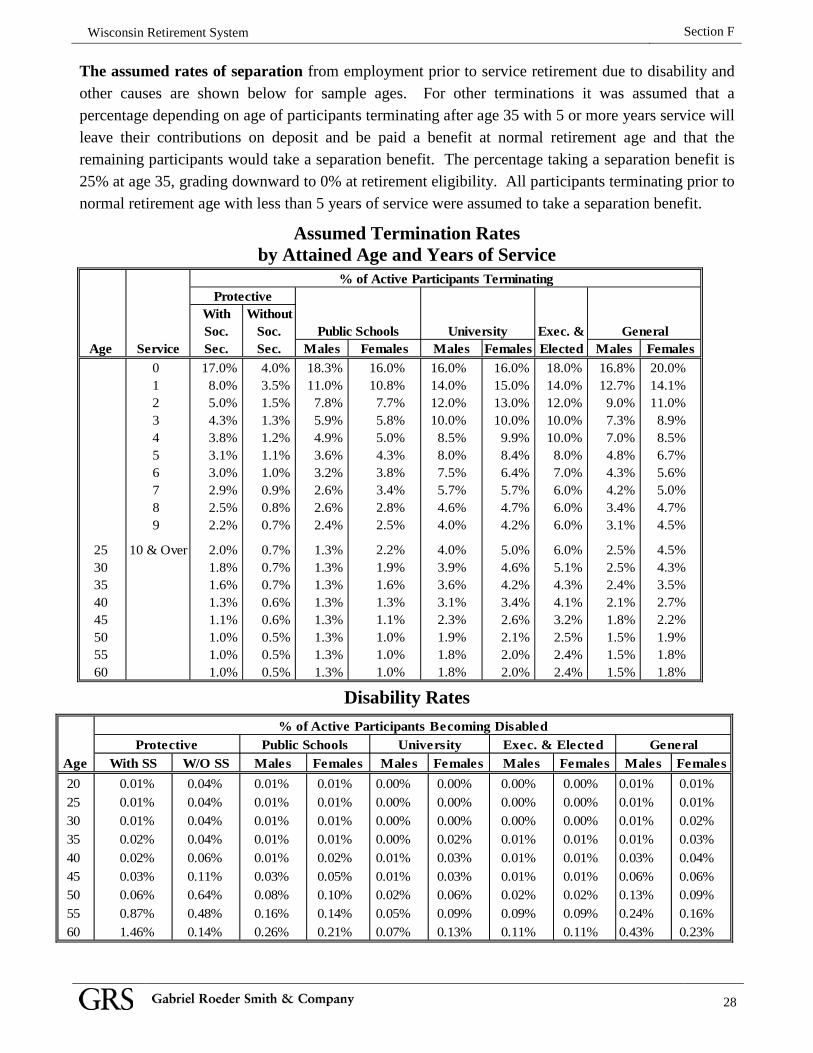
The assumed rates of separation from employment prior to service retirement due to disability and other causes are shown below for sample ages. For other terminations it was assumed that a percentage depending on age of participants terminating after age 35 with 5 or more years service will leave their contributions on deposit and be paid a benefit at normal retirement age and that the remaining participants would take a separation benefit. The percentage taking a separation benefit is 25% at age 35, grading downward to 0% at retirement eligibility. All participants terminating prior to normal retirement age with less than 5 years of service were assumed to take a separation benefit.
Assumed Termination Rates by Attained Age and Years of Service
With WithoutSoc. Soc. Exec. &
Age Service Sec. Sec. Males Females Elected Males0 17.0% 4.0% 18.3% 16.0% 18.0% 16.8% 1 8.0% 3.5% 11.0% 15.0% 14.0% 12.7% 2 5.0% 1.5% 7.8% 13.0% 12.0% 9.0% 3 4.3% 1.3% 5.9% 10.0% 10.0% 7.3% 4 3.8% 1.2% 4.9% 9.9% 10.0% 7.0% 5 3.1% 1.1% 3.6% 8.4% 8.0% 4.8% 6 3.0% 1.0% 3.2% 6.4% 7.0% 4.3% 7 2.9% 0.9% 2.6% 5.7% 6.0% 4.2% 8 2.5% 0.8% 2.6% 4.7% 6.0% 3.4% 9 2.2% 0.7% 2.4% 4.2% 6.0% 3.1%
25 10 & Over 2.0% 0.7% 1.3% 5.0% 6.0% 2.5% 30 1.8% 0.7% 1.3% 4.6% 5.1% 2.5% 35 1.6% 0.7% 1.3% 4.2% 4.3% 2.4% 40 1.3% 0.6% 1.3% 3.4% 4.1% 2.1% 45 1.1% 0.6% 1.3% 2.6% 3.2% 1.8% 50 1.0% 0.5% 1.3% 2.1% 2.5% 1.5% 55 1.0% 0.5% 1.3% 2.0% 2.4% 1.5% 60 1.0% 0.5% 1.3% 2.0% 2.4% 1.5%
% of Active Participants Terminating
4.5% 4.3% 3.5%
16.0% 14.1% 11.0% 8.9%
1.6%
General
20.0% FemalesMalesFemales
5.8%
2.3% 1.9% 1.8% 1.8% 1.8%
2.2% 1.9% 1.8%
1.0%
10.0% 8.5%
4.0% 3.9%
8.0%
5.7%
4.0%
3.6%
1.0% 1.0% 1.1% 1.3%
5.0%
7.7%
1.9% 2.2%
Protective
4.3%
3.4%
2.5%
Public Schools
10.8%
2.8%
3.8%
University
3.1%
16.0% 14.0% 12.0%
4.5%
5.0% 4.6% 4.7%
6.7% 7.5% 5.6%
2.7%
8.5%
Disability Rates
Age202530354045505560
0.09%
0.00% 0.00%
0.02% 0.03% 0.03% 0.06%
Males
0.04% 0.04%
0.01% 0.01% 0.01% 0.00%
0.00%
Males
0.14%
0.02% 0.05% 0.10%
0.21%
0.01% 0.01%
ProtectiveW/O SS0.04% 0.01%
With SS Females
0.03% 0.06% 0.87% 0.48%
0.14%
0.04% 0.06% 0.11% 0.64%
0.23%
General
0.13% 0.24% 0.43%
Females0.01% 0.01%
0.01% 0.03%
0.09% 0.16%
0.06%
0.02% 0.03% 0.04% 0.06%
Males0.01% 0.01% 0.01%
% of Active Participants Becoming Disabled
0.02% 0.02% 0.09% 0.09%
0.01% 0.01% 0.01% 0.01%
0.00%
University
0.02% 0.05%
Females
0.00% 0.01% 0.01% 0.02% 0.02%
Public SchoolsMales
0.00% 0.00% 0.00%
0.11% 0.11%
Exec. & Elected
0.00% 0.01% 0.01%
Females0.00% 0.00%
0.26%
0.01% 0.03% 0.08% 0.16%
0.01% 0.01% 0.01% 0.01%
0.13% 0.07% 1.46%
0.00% 0.01%

SECTION G PLAN PROVISIONS
Section B Financial Statements
Section G
29
Wisconsin Retirement System
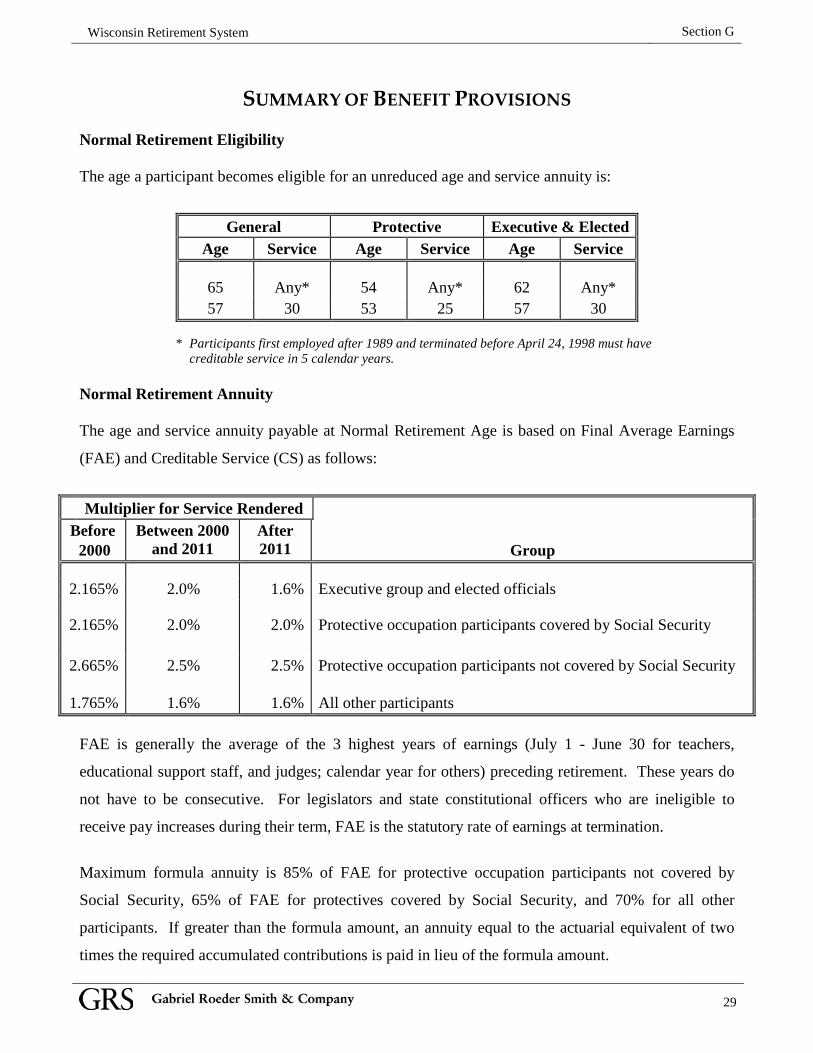
SUMMARY OF BENEFIT PROVISIONS
Normal Retirement Eligibility The age a participant becomes eligible for an unreduced age and service annuity is:
General Protective Executive & Elected
Age Service Age Service Age Service
65 Any* 54 Any* 62 Any* 57 30 53 25 57 30
* Participants first employed after 1989 and terminated before April 24, 1998 must have
creditable service in 5 calendar years. Normal Retirement Annuity The age and service annuity payable at Normal Retirement Age is based on Final Average Earnings
(FAE) and Creditable Service (CS) as follows:
Multiplier for Service Rendered Before 2000
Between 2000 and 2011
After 2011
Group
2.165% 2.0% 1.6% Executive group and elected officials
2.165% 2.0% 2.0% Protective occupation participants covered by Social Security
2.665% 2.5% 2.5% Protective occupation participants not covered by Social Security
1.765% 1.6% 1.6% All other participants FAE is generally the average of the 3 highest years of earnings (July 1 - June 30 for teachers,
educational support staff, and judges; calendar year for others) preceding retirement. These years do
not have to be consecutive. For legislators and state constitutional officers who are ineligible to
receive pay increases during their term, FAE is the statutory rate of earnings at termination.
Maximum formula annuity is 85% of FAE for protective occupation participants not covered by
Social Security, 65% of FAE for protectives covered by Social Security, and 70% for all other
participants. If greater than the formula amount, an annuity equal to the actuarial equivalent of two
times the required accumulated contributions is paid in lieu of the formula amount.
Section G
30
Wisconsin Retirement System
Early Retirement. Any participant who has attained age 55 and any Protective occupation participant who has attained age 50 may apply for an early retirement annuity. The benefit is reduced 0.4% for each month that the annuity effective date precedes the Normal Retirement Age. For Non-Protective participants terminating after 6/30/90, the 0.4% is reduced for months after the attainment of age 57 and before the annuity effective date by .001111% for each month of creditable service.
Voluntary Termination Before Immediate Benefit Eligibility. Participant may either (i) receive a refund of accumulated contributions, or (ii) leave contributions on deposit and apply for a retirement annuity on or after the minimum retirement age based upon age and accrued service at time of termination.
Post-Retirement Adjustments. Annuities are increased annually if the investment income credited to retired life funds is in excess of the assumed benefit rate (presently 5%), other plan experiences are within projected ranges, and the resulting adjustment would be at least 0.5%.
Disability Annuity. Eligibility: generally total and permanent incapacity to engage in gainful employment. Participant must have completed at least 6 months of creditable service (in at least 5 out of the last 7 calendar years) preceding application for disability. Service requirement is waived if disability is from service-related causes. For protective occupations, eligibility also can be met if a member has 15 years of service, is between the ages of 50 and 55 and unable to safely and efficiently perform one’s duties.
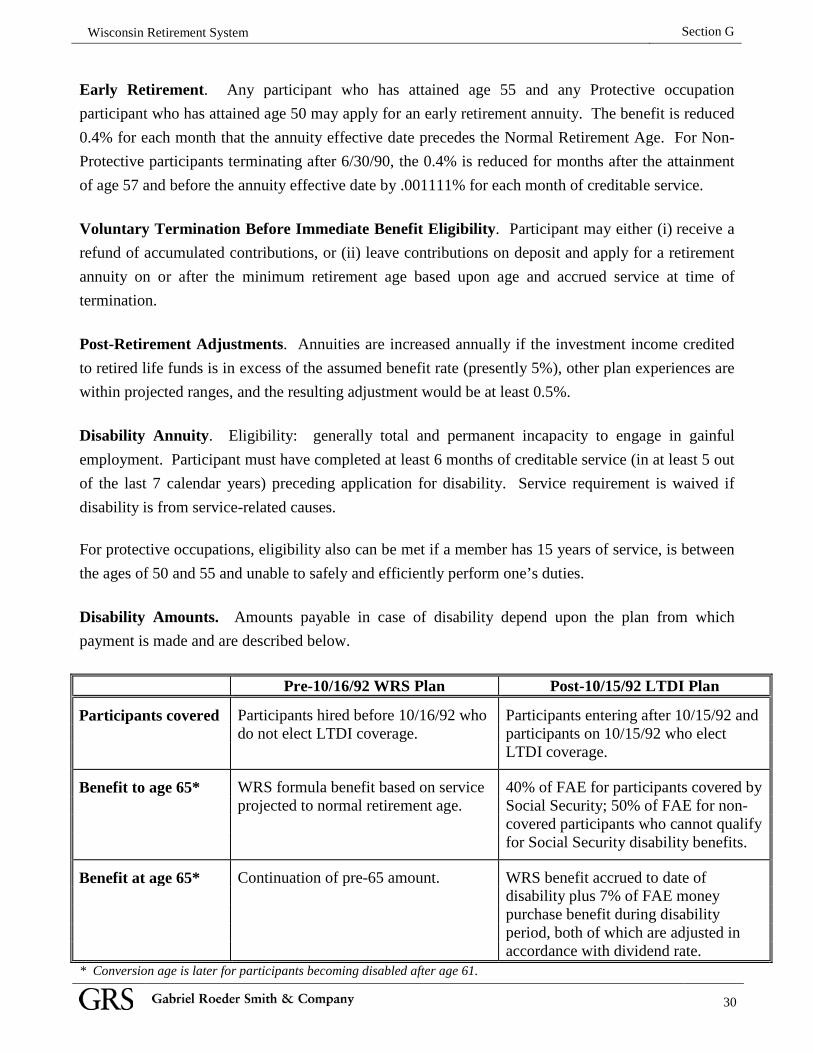
Disability Amounts. Amounts payable in case of disability depend upon the plan from which payment is made and are described below.
Pre-10/16/92 WRS Plan Post-10/15/92 LTDI Plan
Participants covered Participants hired before 10/16/92 who Participants entering after 10/15/92 and do not elect LTDI coverage. participants on 10/15/92 who elect LTDI coverage.
Benefit to age 65* WRS formula benefit based on service 40% of FAE for participants covered by projected to normal retirement age. Social Security; 50% of FAE for non- covered participants who cannot qualify for Social Security disability benefits.
Benefit at age 65* Continuation of pre-65 amount. WRS benefit accrued to date of disability plus 7% of FAE money purchase benefit during disability period, both of which are adjusted in accordance with dividend rate. * Conversion age is later for participants becoming disabled after age 61.
Section G
31
Wisconsin Retirement System
Death-in-Service.
(a) Prior to age 50 for Protective participants, age 55 for others, the benefit is the
equivalent of twice the accumulated employee contributions required and all additional
contributions and employer amounts contributed prior to 1974 for teachers, or 1966 for
others.
(b) After age 50 for Protective participants, age 55 for others, the benefit is the amount that
would have been paid if participant had retired and elected 100% survivor option.
Benefit is payable to any natural living person.
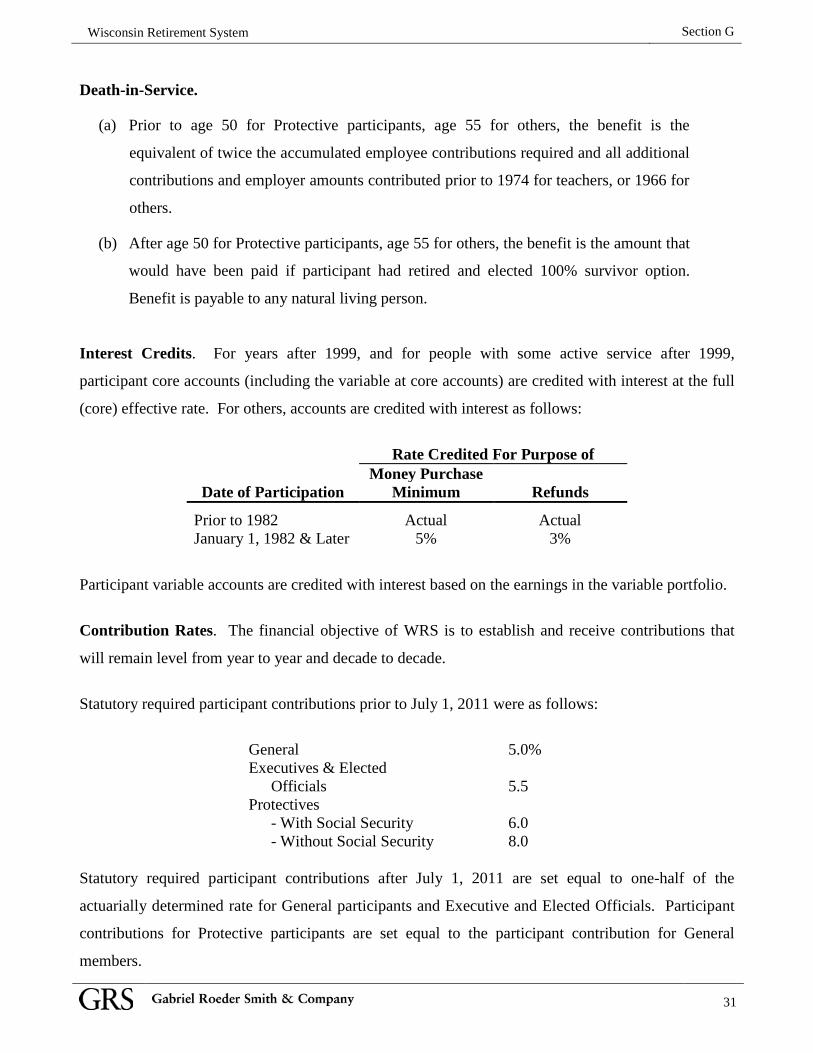
Interest Credits. For years after 1999, and for people with some active service after 1999,
participant core accounts (including the variable at core accounts) are credited with interest at the full
(core) effective rate. For others, accounts are credited with interest as follows:
Rate Credited For Purpose of Money Purchase
Date of Participation Minimum Refunds
Prior to 1982 Actual Actual January 1, 1982 & Later 5% 3%
Participant variable accounts are credited with interest based on the earnings in the variable portfolio.
Contribution Rates. The financial objective of WRS is to establish and receive contributions that
will remain level from year to year and decade to decade.
Statutory required participant contributions prior to July 1, 2011 were as follows:
General 5.0% Executives & Elected
Officials 5.5 Protectives
- With Social Security 6.0 - Without Social Security 8.0
Statutory required participant contributions after July 1, 2011 are set equal to one-half of the
actuarially determined rate for General participants and Executive and Elected Officials. Participant
contributions for Protective participants are set equal to the participant contribution for General
members.
Section G
32
32
Wisconsin Retirement System
Normal Form of Benefit. The normal form of benefit is a straight life annuity with no death
benefits. Optional forms of benefit which are actuarially reduced are listed below:
• A life annuity with 60 or 180 monthly payments guaranteed.
• A joint survivorship annuity with 75% continued to beneficiary.
• A joint survivorship annuity with 100% continued to beneficiary.
• A joint survivorship annuity reduced 25% upon either your death or your beneficiary’s
death.
• A joint survivorship annuity with 100% continued to beneficiary combined with 180
monthly payments guaranteed.
For formula benefit calculations, optional forms are calculated at the lower of the current age or
age 62 (Normal Retirement Age for Protective occupations).
Vesting. Participants hired prior to July 1, 2011 vest immediately. After July 1, 2011,
participants vest after 5 years of service.

SECTION H GLOSSARY OF TERMS Financial Statements
Section H
33
Wisconsin Retirement System
GLOSSARY OF TERMS Actuarial Accrued Liability (AAL)
The AAL is the difference between the actuarial present value of all benefits and the actuarial value of future normal costs. The definition comes from the fundamental equation of funding which states that the present value of all benefits is the sum of the Actuarial Accrued Liability and the present value of future normal costs. The AAL may also be referred to as "accrued liability" or "actuarial liability."
Actuarial Assumptions These assumptions are estimates of future experience with respect to rates
of mortality, disability, turnover, retirement, rate or rates of investment income and compensation increases. Actuarial assumptions are generally based on past experience, often modified for projected changes in conditions. Economic assumptions (compensation increases, payroll growth, inflation and investment return) consist of an underlying real rate of return plus an assumption for a long-term average rate of inflation.
Accrued Service Service credited under the system which was rendered before the date of
the actuarial valuation. Actuarial Equivalent A single amount or series of amounts of equal actuarial value to another
single amount or series of amounts, computed on the basis of appropriate actuarial assumptions.
Actuarial Cost Method A mathematical budgeting procedure for allocating the dollar amount of the
actuarial present value of the pension trust benefits between future normal cost and actuarial accrued liability. The actuarial cost method may also be referred to as the actuarial funding method.
Actuarial Gain (Loss) The difference in liabilities between actual experience and expected
experience during the period between two actuarial valuations is the gain (loss) on the accrued liabilities.
Actuarial Present Value (APV)
The amount of funds currently required to provide a payment or series of payments in the future. The present value is determined by discounting future payments at predetermined rates of interest and probabilities of payment.
Actuarial Valuation The actuarial valuation report determines, as of the actuarial valuation
date, the service cost, total pension liability, and related actuarial present value of projected benefit payments for pensions.
Actuarial Valuation Date The date as of which an actuarial valuation is performed. Actuarially Determined Contribution (ADC) or Annual Required Contribution (ARC)
A calculated contribution into a defined benefit pension plan for the reporting period, most often determined based on the funding policy of the plan. Typically the Actuarially Determined Contribution has a normal cost payment and an amortization payment.
Section H
34
Wisconsin Retirement System
GLOSSARY OF TERMS Amortization Payment The amortization payment is the periodic payment required to pay off an
interest-discounted amount with payments of interest and principal. Amortization Method The method used to determine the periodic amortization payment may be
a level dollar amount, or a level percent of pay amount. The period will typically be expressed in years, and the method will either be “open” (meaning, reset each year) or “closed” (the number of years remaining will decline each year).
Cost-of-Living Adjustments Postemployment benefit changes intended to adjust benefit payments for
the effects of inflation. Cost-Sharing Multiple-Employer Defined Benefit Pension Plan (cost-sharing pension plan)
A multiple-employer defined benefit pension plan in which the pension obligations to the employees of more than one employer are pooled and pension plan assets can be used to pay the benefits of the employees of any employer that provides pensions through the pension plan.
Covered-Employee Payroll The payroll of covered employees, which is typically only the
pensionable pay and does not include pay above any pay cap. Deferred Retirement Option Program (DROP)
A program that permits a plan member to elect a calculation of benefit payments based on service credits and salary, as applicable, as of the DROP entry date. The plan member continues to provide service to the employer and is paid for the service by the employer after the DROP entry date; however, the pensions that would have been paid to the plan member are credited to an individual member account within the defined benefit pension plan until the end of the DROP period. Other variations for DROP exist and will be more fully detailed in the plan provision section of the valuation report.
Deferred Inflows and Outflows
The deferred inflows and outflows of pension resources are amounts used under GASB Statement No. 68 in developing the annual pension expense. Deferred inflows and outflows arise with differences between expected and actual experiences; changes of assumptions. The portion of these amounts not included in pension expense should be included in the deferred inflows or outflows of resources.
Discount Rate
For GASB purposes, the discount rate is the single rate of return that results in the present value of all projected benefit payments to be equal to the sum of the funded and unfunded projected benefit payments, specifically:
1. The benefit payments to be made while the pension plans’ fiduciary net position is projected to be greater than the benefit payments that are projected to be made in the period and;
2. The present value of the benefit payments not in (1) above, discounted using the municipal bond rate.
Section H
35
Wisconsin Retirement System
GLOSSARY OF TERMS Entry Age Actuarial Cost Method (EAN)
The EAN is a funding method for allocating the costs of the plan between the normal cost and the accrued liability. The actuarial present value of the projected benefits of each individual included in an actuarial valuation is allocated on a level basis (either level dollar or level percent of pay) over the earnings or service of the individual between entry age and assumed exit ages(s). The portion of the actuarial present value allocated to a valuation year is the normal cost. The portion of this actuarial present value not provided for at a valuation date by the actuarial present value of future normal costs is the actuarial accrued liability. The sum of the accrued liability plus the present value of all future normal costs is the present value of all benefits.
GASB The Governmental Accounting Standards Board is an organization that
exists in order to promulgate accounting standards for governmental entities.
Fiduciary Net Position The fiduciary net position is the value of the assets of the trust. Long-Term Expected Rate of Return
The long-term rate of return is the expected return to be earned over the entire trust portfolio based on the asset allocation of the portfolio.
Money-Weighted Rate of Return
The money-weighted rate of return is a method of calculating the returns that adjusts for the changing amounts actually invested. For purposes of GASB Statement No. 67, money-weighted rate of return is calculated as the internal rate of return on pension plan investments, net of pension plan investment expense.
Multiple-Employer Defined Benefit Pension Plan
A multiple-employer plan is a defined benefit pension plan that is used to provide pensions to the employees of more than one employer.
Municipal Bond Rate The Municipal Bond Rate is the discount rate to be used for those benefit
payments that occur after the assets of the trust have been depleted. Net Pension Liability (NPL) The NPL is the liability of employers and non-employer contribution
entities to plan members for benefits provided through a defined benefit pension plan.
Non-Employer Contribution Entities
Non-employer contribution entities are entities that make contributions to a pension plan that is used to provide pensions to the employees of other entities. For purposes of the GASB Accounting statement plan members are not considered non-employer contribution entities.
Normal Cost The actuarial present value of the pension trust benefits allocated to the
current year by the actuarial cost method.
Section H
36
Wisconsin Retirement System
GLOSSARY OF TERMS Other Postemployment Benefits (OPEB)
All postemployment benefits other than retirement income (such as death benefits, life insurance, disability, and long-term care) that are provided separately from a pension plan, as well as postemployment healthcare benefits regardless of the manner in which they are provided. Other post-employment benefits do not include termination benefits.
Real Rate of Return The real rate of return is the rate of return on an investment after
adjustment to eliminate inflation. Service Cost The service cost is the portion of the actuarial present value of projected
benefit payments that is attributed to a valuation year. Total Pension Expense The total pension expense is the sum of the following items that are
recognized at the end of the employer’s fiscal year:
1. Service Cost 2. Interest on the Total Pension Liability 3. Current-Period Benefit Changes 4. Employee Contributions (made negative for addition here) 5. Projected Earnings on Plan Investments (made negative for addition here) 6. Pension Plan Administrative Expense 7. Other Changes in Plan Fiduciary Net Position 8. Recognition of Outflow (Inflow) of Resources due to Liabilities 9. Recognition of Outflow (Inflow) of Resources due to Assets
Total Pension Liability (TPL) The TPL is the portion of the actuarial present value of projected benefit
payments that is attributed to past periods of member service. Unfunded Actuarial Accrued Liability (UAAL)
The UAAL is the difference between actuarial accrued liability and valuation assets.
Valuation Assets
The valuation assets are the assets used in determining the unfunded liability of the plan. For purposes of the GASB Statement No. 67, the valuation asset is equal to the market value of assets.