Embed Size (px)
Citation preview
by
The Institute for Latino StudiesUniversity of Notre Dame
with support from the Joyce Foundation
July 2005
© University of Notre Dame, 2005

C2 Measuring the Minority Education Gap
The Institute for Latino Studies,
in keeping with the distinctive mission,
values, and traditions
of the University of Notre Dame,
promotes understanding and appreciation
of the social, cultural, and religious life
of US Latinos
through advancing research,
expanding knowledge,
and strengthening community.

3CReport to the Joyce Foundation
Acknowledgements
I would like to acknowledge the many contributors to this report: Dr. Belinda De La Rosa of Indiana University; Dr. Philip García of California State University; Dr. Martha Zurita of the Institute for Latino Studies; Ms. Stella Flores of Harvard University; Mr. Victor Sáenz of the University of California, Los Angeles; Ms. Caroline Domingo of the Institute for Latino Studies; and the Institute’s Director of Research Dr. Timothy Ready, who also coordinated the project and provided the guidance needed to see it through to completion.
I would also like to thank the Institute’s staff, based at the University of Notre Dame and at our Metropolitan Chicago office in Berwyn, for all their help.
We at the Institute hope that this report and its policy recommendations will be useful to all who wish to improve the education of Illinois’ children.
Gilberto Cárdenas Assistant Provost, University of Notre Dame, and Director of the Institute for Latino Studies
The Institute for Latino Studies at the University of Notre Dame wishes to thank the Joyce Foundation for its generous support of this project. Our report, Measuring the Minority Education Gap in Metropolitan Chicago, would not have been possible without that support, which has allowed us to assess the causes of the achievement gap and formulate recommendations about how to reduce it. In this regard we emphasize the important role that information systems can play.

C4 Measuring the Minority Education Gap

5CReport to the Joyce Foundation 5C
Executive Summary
• The 2002 No Child Left Behind Act (NCLB) has thrust the racial and ethnic achievement gap, as measured by standardized tests, to the forefront of education policy.
• Latinos and African Americans, two groups that historically have been poorly served by schools, comprise a large and growing segment of the school-age population.
• Of the 3.2 million children living in Illinois, 1.2 million (35.7 percent) are Latino or African American (Census 2000).
• Of the 2.2 million children in metro Chicago, nearly half (46 percent) are Latino or African American—up from 40 percent in 1990 (1990 and 2000 Censuses).
• The percentage of Latinos among all Chicago-area children has risen sharply, from 16 percent to 23.2 percent, while the non-Hispanic White and African American percentages have decreased, from 56 percent to 47.7 percent and from 24 percent to 23 percent respectively (1990 and 2000 Censuses).
• Chicago-area schools are highly segregated by race, ethnicity, and class.
• According to state-mandated achievement test results, the predominately Latino and African American school districts in the Chicago metro area that were examined in this study are underperforming and have not been meeting the specified benchmarks for achievement. None of the minority high school districts examined met the benchmarks in any of the three areas tested: reading, writing, and math. In contrast, the predominantly White districts that were examined in this report exceeded the benchmarks standards for achievement.
• Nearly all of the predominantly Latino and African American schools have been designated either as academic watch or warning schools by the Illinois State Board of Education for not having met Annual Yearly Progress goals, as required by the NCLB Act.
• Corresponding to the pattern of racial and ethnic disparities in achievement are parallel patterns of disparity in access to learning resources and in the quality of the instructional environments. In the minority schools per capita instructional expenditures are lower for the most part; average class sizes are higher; more teachers are not fully certified; and there is a much higher concentration of children in poverty. In short, especially in elementary schools, those students with the greatest educational needs have the least access to resources that could help to close the achievement gap.
• Illinois’ student information system is meeting the minimum requirements mandated by the NCLB Act. Further, it provides additional information on the distri-bution of education-relevant resources that are key to any serious strategy to narrow the now well-documented gaps in achievement. With the implementation of recommenda-tions outlined in Chapter Two Illinois’ student information system could be even more effective in informing policies and practices to achieve the twin goals of educational excellence and equity.
C6 Measuring the Minority Education GapC6
Table of ContentsIntroduction ................................................................................................................................................................................................................. 7
Chapter One: The Quest for Eduity and Excellence in Education ................................................................................................................. 8
Demographic Context ........................................................................................................................................................................................ 8
Persistence of the Achievement Gap .............................................................................................................................................................. 9
A New Element: No Child Left Behind ...................................................................................................................................................... 10
Chapter Two: A Model Student Information System ..................................................................................................................................... 11
No Child Left Behind’s Impact on Data Reporting ................................................................................................................................ 12
The Benchmarks ............................................................................................................................................................................................... 12
No Child Left Behind Compliance .............................................................................................................................................................. 13
The California Benchmarks ............................................................................................................................................................................ 14
Recommendations on Illinois Data Reporting ......................................................................................................................................... 15
Chapter Summary ............................................................................................................................................................................................ 22
Chapter Three: Illinois State Board of Education Report Card ................................................................................................................... 23
Methodology ...................................................................................................................................................................................................... 23
Chicago Metro Area School Districts and Academic Achievement ................................................................................................. 24
Comparison of Seven Elementary School Districts in the Chicago Metro Area ........................................................................... 24
Comparison of Three High School Districts in the Chicago Metro Area ....................................................................................... 25
Chapter Four: The Impact of Social Characteristics ....................................................................................................................................... 27
School Demographics and Attendance ...................................................................................................................................................... 27
School Improvement Status ........................................................................................................................................................................... 29
Class Size and Student-to-Staff Ratios ........................................................................................................................................................ 29
Teacher Quality, Preparation, and Compensation .................................................................................................................................. 30
District Expenditures and Sources of Revenue ........................................................................................................................................ 31
Chapter Summary ............................................................................................................................................................................................. 32
Chapter Five: Paradoxes, Perverse Incentives, and the Struggle for Equity and Excellence in Education ...................................... 33
Paradoxes ............................................................................................................................................................................................................ 33
Perverse Incentives ........................................................................................................................................................................................... 34
The Role of Litigation ....................................................................................................................................................................................... 35
‘Golden Spike’ Schools ..................................................................................................................................................................................... 36
Chapter Six: Summary and Recommendations ............................................................................................................................................... 38
Implications ........................................................................................................................................................................................................ 39
Policy Recommendations ............................................................................................................................................................................... 41
References .................................................................................................................................................................................................................... 43
7CReport to the Joyce Foundation
students with the greatest educational needs generally have access to the fewest educational resources. While this is true in most places in the United States, the problem is more acute in Illinois than virtually anywhere else in the nation.
Although more school funding by no means guarantees higher achievement for students, the relative lack of funding of schools serving the most disadvantaged students makes it difficult, if not impossible, to invest in the kinds of educational resources or to create the kinds of instructional environments that are most conducive to learning (Levin 1996; National Research Council 1999).
In order to address these issues we need a state data system that not only calls attention to patterns of achievement across schools and among racial and ethnic groups but also provides information about access to education-relevant resources and to the characteristics of school and community environments that are related to school achievement.
Chapter One of this report highlights the demographic changes in the Chicago metro area and provides educational context. Chapter Two compares the Illinois state student information system to the California student information system and provides data reporting recommendations. Chapter Three concentrates on measuring the achievement gap in the ten school districts examined. Chapter Four focuses on parallel patterns of disparities in school finances, educational resources, and in the instructional environment. Chapter Five broaches high-stakes testing, the role of litigation, and characteristics of high-performing schools in high poverty areas. Chapter Six summarizes the previous chapters and presents policy recommendations drawn from this research.
As this report makes clear, the educational achievement gap reflects deep and pervasive disparities in access to resources that are relevant for learning—both in the schools and in families and communities. A state data system that provides a more comprehensive, specific, and holistic view of the range of factors associated with achievement in schools will be a useful tool for informing policies intended to narrow the gaps. This report explores how various factors are related to each other and to patterns of achievement in ten districts and also recommends the inclusion of data about some of those factors in the Illinois state education data system.
7C
In this era of heightened accountability spurred on by the federal No Child Left Behind (NCLB) legislation, it is important to highlight the policy implications of the continuing and in some cases expanding educational achievement gap that is associated with race and ethnicity. Data reporting requirements mandated by the NCLB Act have led to a heightened awareness of specific educational disparities in and among schools and school districts in the United States. This report, concentrating on data from ten districts in the Chicago area, spotlights the breadth and depth of the achievement gap and how closely it corresponds to a parallel pattern of disparities in access to learning resources and in quality of instructional environments. The examination of the Illinois educational data system, with a special focus on the gaps that exist in ten suburban Cook County districts, provides a useful case study of the role that state education data systems can play not only in highlighting disparities in educational achievement but also in informing policies that can help achieve the twin goals of educational excellence and equity.
The academic achievement gap, most often described in terms of racial differences between minority and nonminority stu-dent groups or between advantaged and disadvantaged groups on measures of academic performance, is a very complex and persistent problem in this country. Despite efforts such as the recent NCLB legislation, Latinos and African Americans lag far behind Whites and Asians in almost every educational outcome that is measured. The persistence of large achievement gaps cannot help but impair the ability of the State of Illinois, and of all segments of its diverse citizenry, to successfully compete in the twenty-first century.
The academic achievement gap is but one high-profile manifestation of deeper, systemic disparities associated with race, ethnicity, and class in metro Chicago and throughout the United States. Yet, education is seen by many as the key to breaking down these deep-seated societal disparities. Paradoxically, policy discussions of recent years tend to place little emphasis on minority young people’s lack of access—especially for those who are enrolled in highly segregated, high poverty, urban and inner-ring suburban schools—to high-quality educational resources. Indeed, Illinois ranked last among all fifty states with a grade of ‘F’ in Education Week ’s 2004 state rankings of equity in the distribution of education resources (Education Week 2004). In Illinois those
Introduction
C8 Measuring the Minority Education Gap
Of particular importance is the relative youthfulness of the Latino population.
Demographic ContextThe Latino and African American populations, which historically have been poorly served by the nation’s public schools, are growing nationwide and in Illinois. This poses a challenge for educators and for public policymakers who seek to improve the educational profile of their communities, both in general and for these populations in particular. Federal Reserve Chairman Alan Greenspan has warned that the future of the US economy depends on all of its citizens obtaining the best education possible (Greenspan 2000). In a Washington Times article former Education Secretary Rod Paige noted that raising the educational level of a population by one year will raise a country’s gross domestic product by 3 to 6 percent (Archibald 2004). Paige went on to say that “if you look at the average performance, there are 17 countries ahead of the US.”
Here are some key demographic facts concerning Illinois and metropolitan Chicago:
• Illinois is home to over 12 million individuals. The percentage of the population that is White and not of Hispanic origin is 67.8 percent. A large and growing percentage, 27.3 percent, is African American or Latino. Asians and American Indians comprise another 3.6 percent, and another 7.7 percent claim another race or two or more races (US Census Bureau 2000).
• Nationally the Latino population has increased almost 60 percent since 1990 (US Census Bureau 2001). The US Census Bureau indicates that the Latino population in Illinois increased from the 1.5 million identified in the 2000 census to 1.7 million in 2003 (American Community Survey 2003).
• In 2000 the state of Illinois ranked ninth in the nation in the percentage of residents who are Latino, at 12.3 percent (US Census Bureau 2001).
• Nationally, 25.7 percent of the general population were under the age of 18 in 2000; however, among Latinos 35 percent were under 18 (US Census Bureau 2001).
• Of the 3.2 million children living in Illinois, 1.2 million (35.7 percent) are Latino or African American (Census 2000).
• Of the 2.2 million children in metro Chicago, nearly half (46 percent) were Latino or African American in 2000—up from 40 percent in 1990 (1990 and 2000 Censuses).
• During the same period the percentage of non-Hispanic Whites among all Chicago-area children decreased from 56 percent to 47.7 percent while the Latino percentage rose sharply from 16 percent to 23.2 percent. African Americans decreased slightly as a percentage of all Chicago-area children from 24 percent in 1990 to 23 percent in 2000 (1990 and 2000 Censuses).
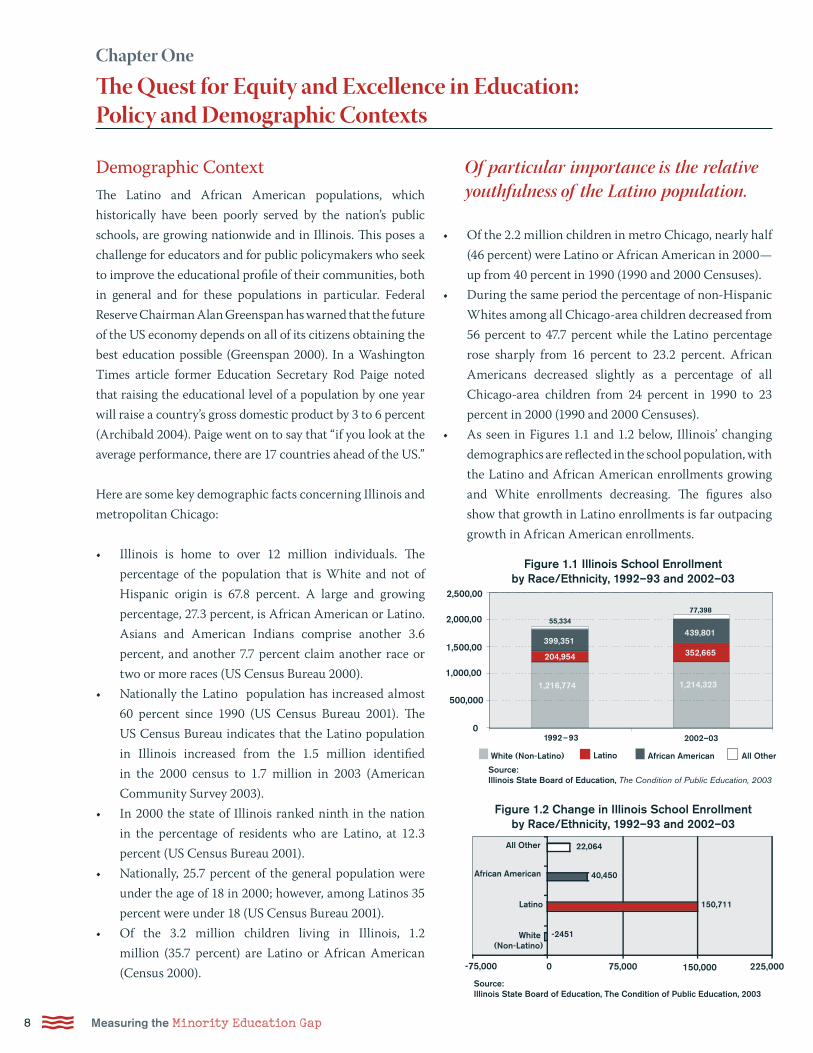
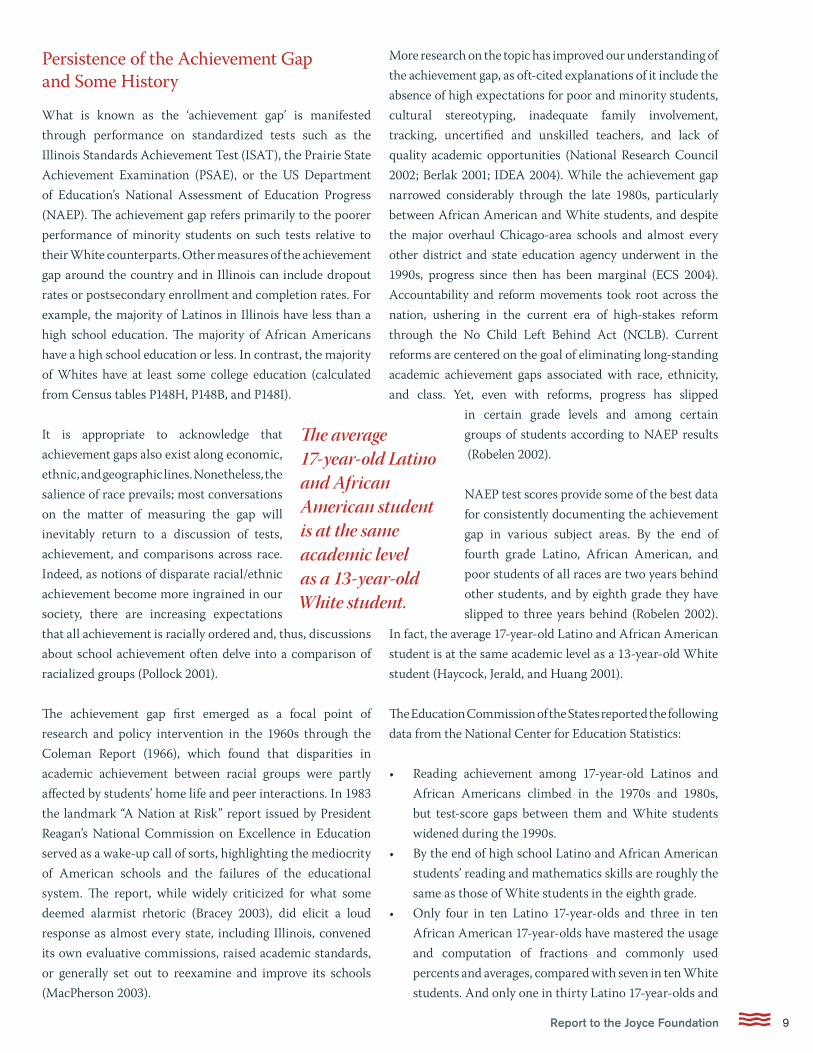
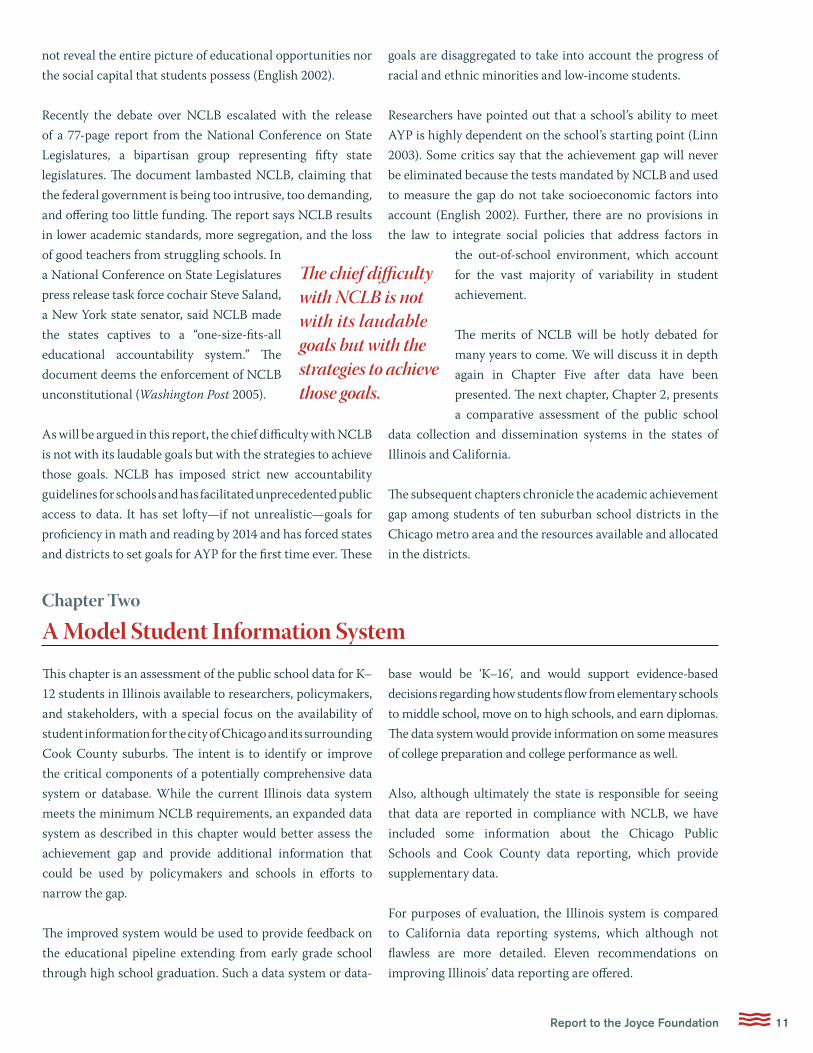
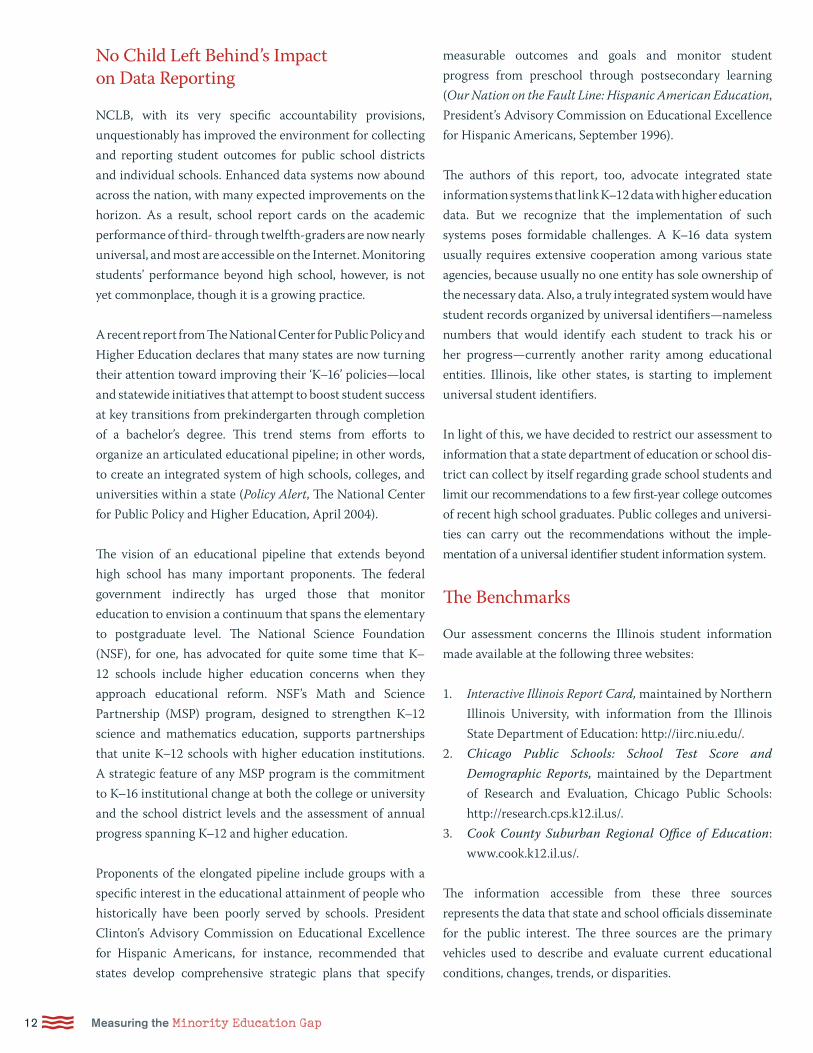
• As seen in Figures 1.1 and 1.2 below, Illinois’ changing demographics are reflected in the school population, with the Latino and African American enrollments growing and White enrollments decreasing. The figures also show that growth in Latino enrollments is far outpacing growth in African American enrollments.
Latino
1992–93 2002–03
White (Non-Latino) African American All Other
Source: Illinois State Board of Education, The Condition of Public Education, 2003
Figure 1.1 Illinois School Enrollmentby Race/Ethnicity, 1992–93 and 2002–03
2,500,00
1,500,00
500,000
0
1,000,00
2,000,00
1,216,774 1,214,323
439,801399,351
352,665204,954
55,33477,398
White (Non-Latino)
Source: Illinois State Board of Education, The Condition of Public Education, 2003
-75,000
Figure 1.2 Change in Illinois School Enrollment by Race/Ethnicity, 1992–93 and 2002–03
Latino
African American
All Other
0 75,000 225,000150,000
22,064
40,450
150,711
-2451
Chapter One
The Quest for Equity and Excellence in Education: Policy and Demographic Contexts
9CReport to the Joyce Foundation
Persistence of the Achievement Gap and Some History
What is known as the ‘achievement gap’ is manifested through performance on standardized tests such as the Illinois Standards Achievement Test (ISAT), the Prairie State Achievement Examination (PSAE), or the US Department of Education’s National Assessment of Education Progress (NAEP). The achievement gap refers primarily to the poorer performance of minority students on such tests relative to their White counterparts. Other measures of the achievement gap around the country and in Illinois can include dropout rates or postsecondary enrollment and completion rates. For example, the majority of Latinos in Illinois have less than a high school education. The majority of African Americans have a high school education or less. In contrast, the majority of Whites have at least some college education (calculated from Census tables P148H, P148B, and P148I).
It is appropriate to acknowledge that achievement gaps also exist along economic, ethnic, and geographic lines. Nonetheless, the salience of race prevails; most conversations on the matter of measuring the gap will inevitably return to a discussion of tests, achievement, and comparisons across race. Indeed, as notions of disparate racial/ethnic achievement become more ingrained in our society, there are increasing expectations that all achievement is racially ordered and, thus, discussions about school achievement often delve into a comparison of racialized groups (Pollock 2001).
The achievement gap first emerged as a focal point of research and policy intervention in the 1960s through the Coleman Report (1966), which found that disparities in academic achievement between racial groups were partly affected by students’ home life and peer interactions. In 1983 the landmark “A Nation at Risk” report issued by President Reagan’s National Commission on Excellence in Education served as a wake-up call of sorts, highlighting the mediocrity of American schools and the failures of the educational system. The report, while widely criticized for what some deemed alarmist rhetoric (Bracey 2003), did elicit a loud response as almost every state, including Illinois, convened its own evaluative commissions, raised academic standards, or generally set out to reexamine and improve its schools (MacPherson 2003).
More research on the topic has improved our understanding of the achievement gap, as oft-cited explanations of it include the absence of high expectations for poor and minority students, cultural stereotyping, inadequate family involvement, tracking, uncertified and unskilled teachers, and lack of quality academic opportunities (National Research Council 2002; Berlak 2001; IDEA 2004). While the achievement gap narrowed considerably through the late 1980s, particularly between African American and White students, and despite the major overhaul Chicago-area schools and almost every other district and state education agency underwent in the 1990s, progress since then has been marginal (ECS 2004). Accountability and reform movements took root across the nation, ushering in the current era of high-stakes reform through the No Child Left Behind Act (NCLB). Current reforms are centered on the goal of eliminating long-standing academic achievement gaps associated with race, ethnicity, and class. Yet, even with reforms, progress has slipped
in certain grade levels and among certain groups of students according to NAEP results (Robelen 2002).
NAEP test scores provide some of the best data for consistently documenting the achievement gap in various subject areas. By the end of fourth grade Latino, African American, and poor students of all races are two years behind other students, and by eighth grade they have slipped to three years behind (Robelen 2002).
In fact, the average 17-year-old Latino and African American student is at the same academic level as a 13-year-old White student (Haycock, Jerald, and Huang 2001).
The Education Commission of the States reported the following data from the National Center for Education Statistics:
• Reading achievement among 17-year-old Latinos and African Americans climbed in the 1970s and 1980s, but test-score gaps between them and White students widened during the 1990s.
• By the end of high school Latino and African American students’ reading and mathematics skills are roughly the same as those of White students in the eighth grade.
• Only four in ten Latino 17-year-olds and three in ten African American 17-year-olds have mastered the usage and computation of fractions and commonly used percents and averages, compared with seven in ten White students. And only one in thirty Latino 17-year-olds and
The average 17-year-old Latino and African American student is at the same academic level as a 13-year-old White student.

C10 Measuring the Minority Education Gap
one in a hundred African American 17-year-olds can do multistep problem solving and elementary algebra, compared with about one in ten White students.
• Among 18- to 24-year-olds about 90 percent of Whites and 94 percent of Asian Americans have either completed high school or earned a GED. Among Latinos the rate drops to 63 percent, and among African Americans, 81 percent.
• Latinos are about one-third as likely and African Americans about half as likely as White students to earn a bachelor’s degree by age 29.
A New Element: No Child Left Behind (NCLB) and the Achievement GapThe No Child Left Behind Act of 2002 has thrust the achievement gap—as measured by standardized tests—to the center of policy intervention. NCLB represents one of the most prescriptive, authoritative, and ambitious public education policies ever enacted by the federal government, and states including Illinois have responded accordingly. No other federal or government education policy has so deliberately, so forcefully, and so definitively addressed the challenge of closing the achievement gap. In fact, eliminating the achievement gap lies directly at the heart of NCLB’s goal of enabling students of all backgrounds to achieve proficiency in reading and mathematics by 2014.
Among its most important provisions, NCLB requires that: • States implement an accountability system that is
based on challenging state standards in reading and mathematics.
• States have a highly qualified teacher in every classroom by 2005–06.
• States achieve adequate yearly progress (AYP) in the proficiency of students in grades 3 through 8 in reading and math across all critical subgroups of students.
• All students reach or exceed proficiency in reading and math within twelve years.
• The test-score or achievement gap between advantaged and disadvantaged students narrow.
The NCLB act has spurred the high-stakes testing furor that has forced many schools to show progress toward improving reading and math skills or face decreased funding. School districts and schools that fail to make AYP toward statewide proficiency goals in improving their scores and graduation rate will, over time, be subject to various interventions, corrective actions, and restructuring measures aimed at getting them back on track. NCLB also mandates that states and school districts annually publish school-level test scores disaggregated by gender and race, among other student characteristics. This NCLB provision is perhaps most relevant to this study, as schools are required to publish these data in order to show that AYP is being made both in the aggregate and across key student subgroups. The intent of this policy was to focus the attention of the education establishment as well as to accelerate the timetable for implementation of meaningful school reform.
NCLB has drawn the attention of many critics. Among the most stinging criticisms are that it is too prescriptive, that it is underfunded, and that its school choice provisions are counterproductive and in the end weaken rather than strengthen underperforming schools. Many prominent education organizations, including teacher unions and advocacy groups, have come out fervently against NCLB policies, while others such as the Education Trust have been instrumental in its implementation.
Some critics complain that NCLB leans too heavily on norm-referenced standardized tests that are weak measures of academic performance to determine student proficiency, teacher excellence, and school accountability. Students are often not allowed to pass on to the next grade or graduate from high school if they do not pass a test. However, these tests do
11CReport to the Joyce Foundation
This chapter is an assessment of the public school data for K–12 students in Illinois available to researchers, policymakers, and stakeholders, with a special focus on the availability of student information for the city of Chicago and its surrounding Cook County suburbs. The intent is to identify or improve the critical components of a potentially comprehensive data system or database. While the current Illinois data system meets the minimum NCLB requirements, an expanded data system as described in this chapter would better assess the achievement gap and provide additional information that could be used by policymakers and schools in efforts to narrow the gap.
The improved system would be used to provide feedback on the educational pipeline extending from early grade school through high school graduation. Such a data system or data-
base would be ‘K–16’, and would support evidence-based decisions regarding how students flow from elementary schools to middle school, move on to high schools, and earn diplomas. The data system would provide information on some measures of college preparation and college performance as well.
Also, although ultimately the state is responsible for seeing that data are reported in compliance with NCLB, we have included some information about the Chicago Public Schools and Cook County data reporting, which provide supplementary data.
For purposes of evaluation, the Illinois system is compared to California data reporting systems, which although not flawless are more detailed. Eleven recommendations on improving Illinois’ data reporting are offered.
Chapter Two
A Model Student Information System
not reveal the entire picture of educational opportunities nor the social capital that students possess (English 2002).
Recently the debate over NCLB escalated with the release of a 77-page report from the National Conference on State Legislatures, a bipartisan group representing fifty state legislatures. The document lambasted NCLB, claiming that the federal government is being too intrusive, too demanding, and offering too little funding. The report says NCLB results in lower academic standards, more segregation, and the loss of good teachers from struggling schools. In a National Conference on State Legislatures press release task force cochair Steve Saland, a New York state senator, said NCLB made the states captives to a “one-size-fits-all educational accountability system.” The document deems the enforcement of NCLB unconstitutional (Washington Post 2005).
As will be argued in this report, the chief difficulty with NCLB is not with its laudable goals but with the strategies to achieve those goals. NCLB has imposed strict new accountability guidelines for schools and has facilitated unprecedented public access to data. It has set lofty—if not unrealistic—goals for proficiency in math and reading by 2014 and has forced states and districts to set goals for AYP for the first time ever. These
goals are disaggregated to take into account the progress of racial and ethnic minorities and low-income students.
Researchers have pointed out that a school’s ability to meet AYP is highly dependent on the school’s starting point (Linn 2003). Some critics say that the achievement gap will never be eliminated because the tests mandated by NCLB and used to measure the gap do not take socioeconomic factors into account (English 2002). Further, there are no provisions in the law to integrate social policies that address factors in
the out-of-school environment, which account for the vast majority of variability in student achievement.
The merits of NCLB will be hotly debated for many years to come. We will discuss it in depth again in Chapter Five after data have been presented. The next chapter, Chapter 2, presents a comparative assessment of the public school
data collection and dissemination systems in the states of Illinois and California.
The subsequent chapters chronicle the academic achievement gap among students of ten suburban school districts in the Chicago metro area and the resources available and allocated in the districts.
The chief difficulty with NCLB is not with its laudable goals but with the strategies to achieve those goals.
C12 Measuring the Minority Education Gap
measurable outcomes and goals and monitor student progress from preschool through postsecondary learning (Our Nation on the Fault Line: Hispanic American Education, President’s Advisory Commission on Educational Excellence for Hispanic Americans, September 1996).
The authors of this report, too, advocate integrated state information systems that link K–12 data with higher education data. But we recognize that the implementation of such systems poses formidable challenges. A K–16 data system usually requires extensive cooperation among various state agencies, because usually no one entity has sole ownership of the necessary data. Also, a truly integrated system would have student records organized by universal identifiers—nameless numbers that would identify each student to track his or her progress—currently another rarity among educational entities. Illinois, like other states, is starting to implement universal student identifiers.
In light of this, we have decided to restrict our assessment to information that a state department of education or school dis-trict can collect by itself regarding grade school students and limit our recommendations to a few first-year college outcomes of recent high school graduates. Public colleges and universi-ties can carry out the recommendations without the imple-mentation of a universal identifier student information system.
The Benchmarks
Our assessment concerns the Illinois student information made available at the following three websites:
1. Interactive Illinois Report Card, maintained by Northern Illinois University, with information from the Illinois State Department of Education: http://iirc.niu.edu/.
2. Chicago Public Schools: School Test Score and Demographic Reports, maintained by the Department of Research and Evaluation, Chicago Public Schools: http://research.cps.k12.il.us/.
3. Cook County Suburban Regional Office of Education: www.cook.k12.il.us/.
The information accessible from these three sources represents the data that state and school officials disseminate for the public interest. The three sources are the primary vehicles used to describe and evaluate current educational conditions, changes, trends, or disparities.
No Child Left Behind’s Impact on Data Reporting
NCLB, with its very specific accountability provisions, unquestionably has improved the environment for collecting and reporting student outcomes for public school districts and individual schools. Enhanced data systems now abound across the nation, with many expected improvements on the horizon. As a result, school report cards on the academic performance of third- through twelfth-graders are now nearly universal, and most are accessible on the Internet. Monitoring students’ performance beyond high school, however, is not yet commonplace, though it is a growing practice.
A recent report from The National Center for Public Policy and Higher Education declares that many states are now turning their attention toward improving their ‘K–16’ policies—local and statewide initiatives that attempt to boost student success at key transitions from prekindergarten through completion of a bachelor’s degree. This trend stems from efforts to organize an articulated educational pipeline; in other words, to create an integrated system of high schools, colleges, and universities within a state (Policy Alert, The National Center for Public Policy and Higher Education, April 2004).
The vision of an educational pipeline that extends beyond high school has many important proponents. The federal government indirectly has urged those that monitor education to envision a continuum that spans the elementary to postgraduate level. The National Science Foundation (NSF), for one, has advocated for quite some time that K–12 schools include higher education concerns when they approach educational reform. NSF’s Math and Science Partnership (MSP) program, designed to strengthen K–12 science and mathematics education, supports partnerships that unite K–12 schools with higher education institutions. A strategic feature of any MSP program is the commitment to K–16 institutional change at both the college or university and the school district levels and the assessment of annual progress spanning K–12 and higher education.
Proponents of the elongated pipeline include groups with a specific interest in the educational attainment of people who historically have been poorly served by schools. President Clinton’s Advisory Commission on Educational Excellence for Hispanic Americans, for instance, recommended that states develop comprehensive strategic plans that specify
13CReport to the Joyce Foundation
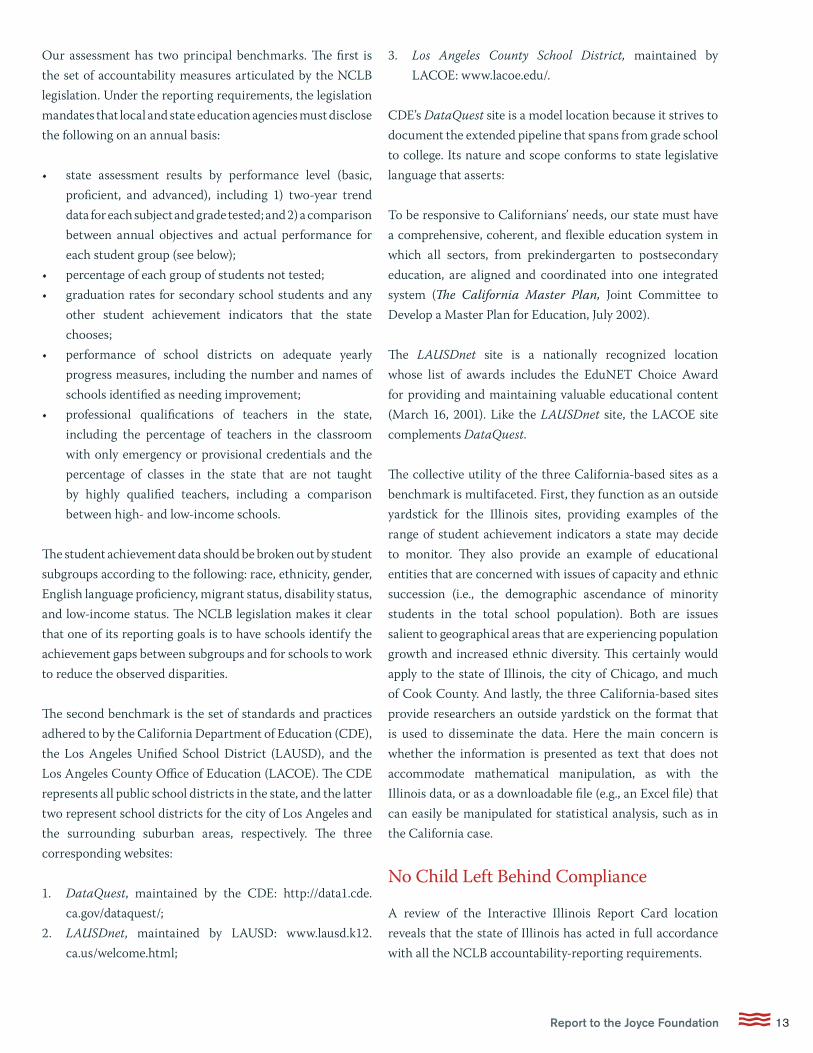
Our assessment has two principal benchmarks. The first is the set of accountability measures articulated by the NCLB legislation. Under the reporting requirements, the legislation mandates that local and state education agencies must disclose the following on an annual basis:
• state assessment results by performance level (basic, proficient, and advanced), including 1) two-year trend data for each subject and grade tested; and 2) a comparison between annual objectives and actual performance for each student group (see below);
• percentage of each group of students not tested; • graduation rates for secondary school students and any
other student achievement indicators that the state chooses;
• performance of school districts on adequate yearly progress measures, including the number and names of schools identified as needing improvement;
• professional qualifications of teachers in the state, including the percentage of teachers in the classroom with only emergency or provisional credentials and the percentage of classes in the state that are not taught by highly qualified teachers, including a comparison between high- and low-income schools.
The student achievement data should be broken out by student subgroups according to the following: race, ethnicity, gender, English language proficiency, migrant status, disability status, and low-income status. The NCLB legislation makes it clear that one of its reporting goals is to have schools identify the achievement gaps between subgroups and for schools to work to reduce the observed disparities.
The second benchmark is the set of standards and practices adhered to by the California Department of Education (CDE), the Los Angeles Unified School District (LAUSD), and the Los Angeles County Office of Education (LACOE). The CDE represents all public school districts in the state, and the latter two represent school districts for the city of Los Angeles and the surrounding suburban areas, respectively. The three corresponding websites:
1. DataQuest, maintained by the CDE: http://data1.cde.ca.gov/dataquest/;
2. LAUSDnet, maintained by LAUSD: www.lausd.k12.ca.us/welcome.html;
3. Los Angeles County School District, maintained by LACOE: www.lacoe.edu/.
CDE’s DataQuest site is a model location because it strives to document the extended pipeline that spans from grade school to college. Its nature and scope conforms to state legislative language that asserts:
To be responsive to Californians’ needs, our state must have a comprehensive, coherent, and flexible education system in which all sectors, from prekindergarten to postsecondary education, are aligned and coordinated into one integrated system (The California Master Plan, Joint Committee to Develop a Master Plan for Education, July 2002).
The LAUSDnet site is a nationally recognized location whose list of awards includes the EduNET Choice Award for providing and maintaining valuable educational content (March 16, 2001). Like the LAUSDnet site, the LACOE site complements DataQuest.
The collective utility of the three California-based sites as a benchmark is multifaceted. First, they function as an outside yardstick for the Illinois sites, providing examples of the range of student achievement indicators a state may decide to monitor. They also provide an example of educational entities that are concerned with issues of capacity and ethnic succession (i.e., the demographic ascendance of minority students in the total school population). Both are issues salient to geographical areas that are experiencing population growth and increased ethnic diversity. This certainly would apply to the state of Illinois, the city of Chicago, and much of Cook County. And lastly, the three California-based sites provide researchers an outside yardstick on the format that is used to disseminate the data. Here the main concern is whether the information is presented as text that does not accommodate mathematical manipulation, as with the Illinois data, or as a downloadable file (e.g., an Excel file) that can easily be manipulated for statistical analysis, such as in the California case.
No Child Left Behind Compliance
A review of the Interactive Illinois Report Card location reveals that the state of Illinois has acted in full accordance with all the NCLB accountability-reporting requirements.
C14 Measuring the Minority Education Gap
To start, Illinois report cards for districts and individual schools prominently describe outcomes on Adequate Yearly Progress (AYP). As stated earlier in this report, these outcomes refer to the performance goals that schools are expected to achieve under state and federal law. NCLB mandates that by 2014 all students in Illinois schools must meet or exceed Illinois Learning Standards in both reading and math. Illinois reports outcomes from two tests indicating overall student performance for schools and performance for selected grades: the Illinois Standards Achievement Test (ISAT) and the Prairie State Achievement Examination (PSAE). There is a separate test for students enrolled in state-approved transitional bilingual programs: the Illinois Measure of Annual Growth in English (IMAGE). There is another separate test for students with disabilities: the Illinois Alternate Assessment (IAA). Illinois reports outcomes on the IMAGE and IAA tests as well.
Each of the measures for overall performance on these tests shows outcomes for two consecutive years. The statistics are grade specific; they indicate the proportion of students in each grade who meet or exceed established standards.
The Interactive Illinois Report Card location has tables for total enrollment and the percentages of test takers. There is also a posting of four-year graduation rates. Each graduation rate for a particular class is calculated by dividing the number of students who graduated from a school in June by an estimate of the number of students who entered that school in the fall four years earlier. In addition, one-year dropout rates are available. These rates represent the percentage of high school students in grades 9 through 12 (or equivalent) who drop out in a given year. The calculating formula for the one-year dropout rate is: dropouts (9–12) divided by total enrollment (9–12).
Each of the student tables at the Interactive Illinois Report Card location reports unique statistics for the following groups: 1) All Students, 2) Male, 3) Female, 4) White, 5) African American, 6) Hispanic, 7) Asian/Pacific Islander, 8) Native American, 9) LEP (Limited English Proficient), 10) Migrant, 11) Students with Disabilities, and 12) Econom-ically Disadvantaged (determined by qualification for free and reduced lunch programs).
There is teacher information as well. First, there are the number of full-time-equivalent faculty and percentage
distributions for gender and race/ethnicity. Second, there are indicators of the average years of teaching experience. Next, there are proportions on the following qualifications: teachers with bachelor’s degrees, teachers with master’s or above, and teachers with emergency or provisional credentials. Completing the Interactive Illinois Report Card site are descriptive statistics on revenues and expenditures, salaries, staff-to-student ratios, average class sizes, and time devoted to teaching core subjects.
The California Benchmarks
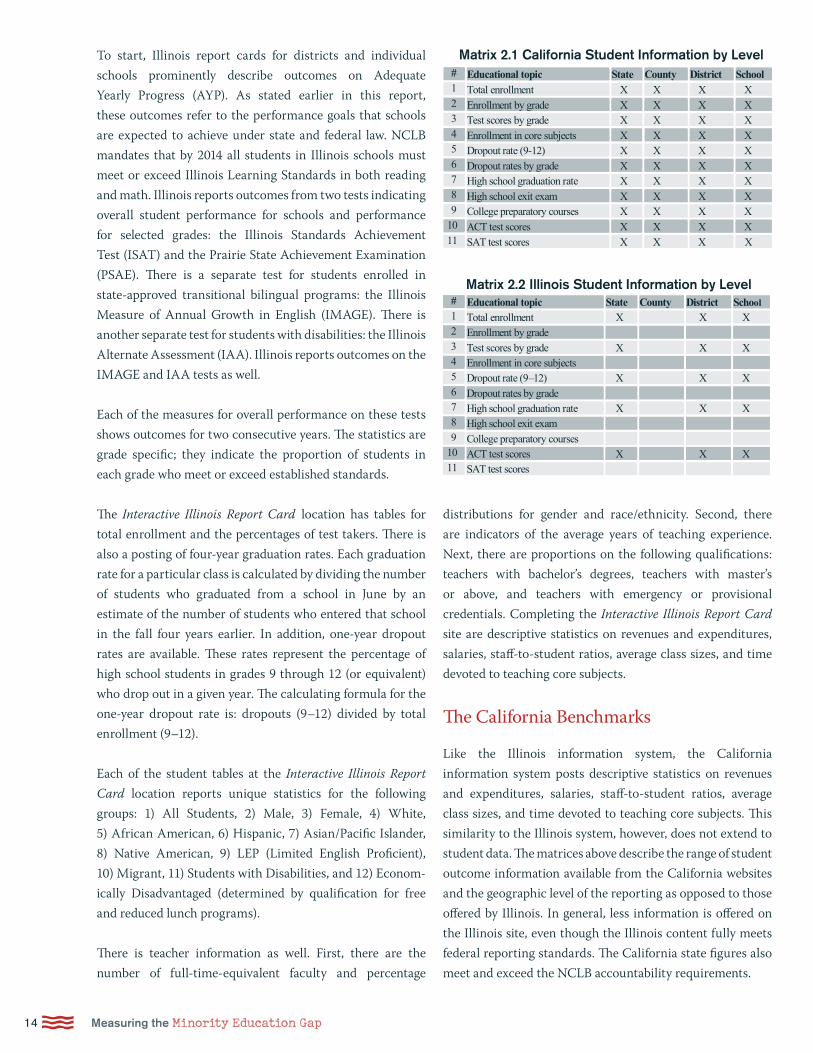
Like the Illinois information system, the California information system posts descriptive statistics on revenues and expenditures, salaries, staff-to-student ratios, average class sizes, and time devoted to teaching core subjects. This similarity to the Illinois system, however, does not extend to student data. The matrices above describe the range of student outcome information available from the California websites and the geographic level of the reporting as opposed to those offered by Illinois. In general, less information is offered on the Illinois site, even though the Illinois content fully meets federal reporting standards. The California state figures also meet and exceed the NCLB accountability requirements.
Matrix 2.1 California Student Information by Level# Educational topic State County District School 1 Total enrollment X X X X 2 Enrollment by grade X X X X 3 Test scores by grade X X X X 4 Enrollment in core subjects X X X X 5 Dropout rate (9-12) X X X X 6 Dropout rates by grade X X X X 7 High school graduation rate X X X X 8 High school exit exam X X X X 9 College preparatory courses X X X X
10 ACT test scores X X X X 11 SAT test scores X X X X
# Educational topic State County District School 1 Total enrollment X X X 2 Enrollment by grade 3 Test scores by grade X X X 4 Enrollment in core subjects 5 Dropout rate (9–12) X X X 6 Dropout rates by grade 7 High school graduation rate X X X 8 High school exit exam 9 College preparatory courses
10 ACT test scores X X X 11 SAT test scores
Matrix 2.2 Illinois Student Information by Level
15CReport to the Joyce Foundation
Recommendations on Illinois Data Reporting
Here we illustrate commonalities and differences by con-trasting reporting on specific topics from both states and offer eleven recommendations on how Illinois’ data reporting could be improved.
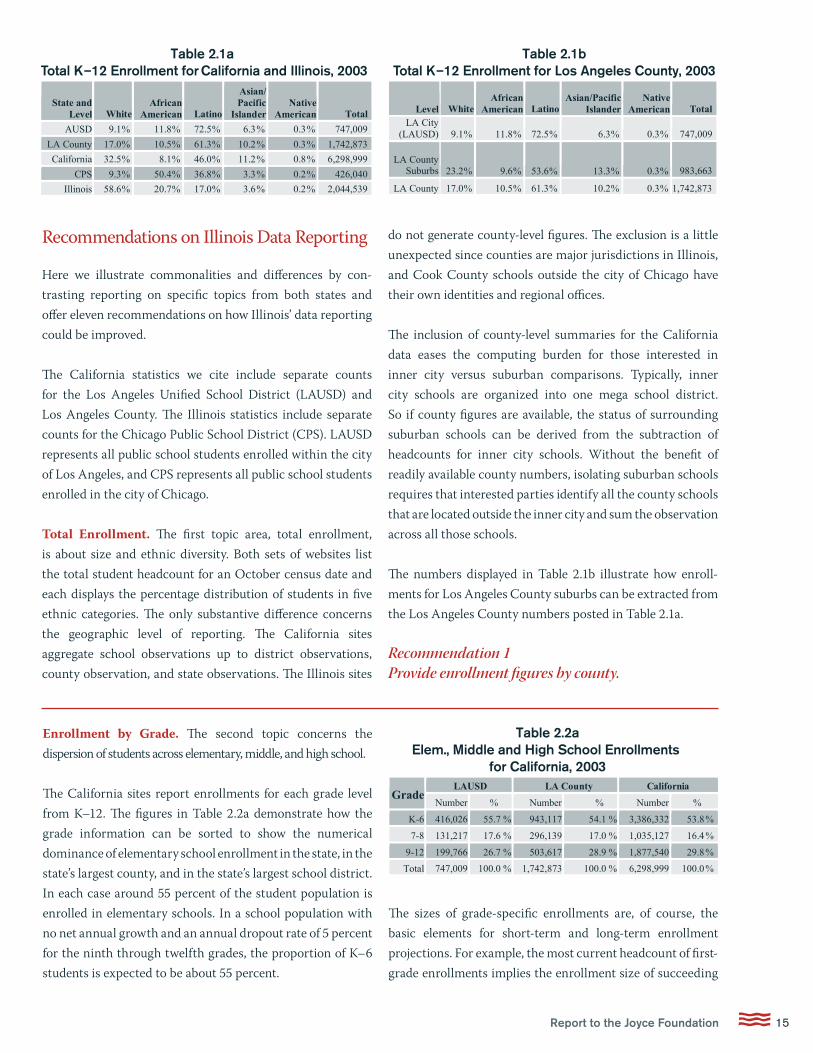
The California statistics we cite include separate counts for the Los Angeles Unified School District (LAUSD) and Los Angeles County. The Illinois statistics include separate counts for the Chicago Public School District (CPS). LAUSD represents all public school students enrolled within the city of Los Angeles, and CPS represents all public school students enrolled in the city of Chicago.
Total Enrollment. The first topic area, total enrollment, is about size and ethnic diversity. Both sets of websites list the total student headcount for an October census date and each displays the percentage distribution of students in five ethnic categories. The only substantive difference concerns the geographic level of reporting. The California sites aggregate school observations up to district observations, county observation, and state observations. The Illinois sites
do not generate county-level figures. The exclusion is a little unexpected since counties are major jurisdictions in Illinois, and Cook County schools outside the city of Chicago have their own identities and regional offices.
The inclusion of county-level summaries for the California data eases the computing burden for those interested in inner city versus suburban comparisons. Typically, inner city schools are organized into one mega school district. So if county figures are available, the status of surrounding suburban schools can be derived from the subtraction of headcounts for inner city schools. Without the benefit of readily available county numbers, isolating suburban schools requires that interested parties identify all the county schools that are located outside the inner city and sum the observation across all those schools.
The numbers displayed in Table 2.1b illustrate how enroll-ments for Los Angeles County suburbs can be extracted from the Los Angeles County numbers posted in Table 2.1a.
Recommendation 1 Provide enrollment figures by county.
State and Level White
African American Latino
Asian/ Pacific
Islander Native
American Total
AUSD 9.1 % 11.8 % 72.5 % 6.3 % 0.3 % 747,009
LA County 17.0 % 10.5 % 61.3 % 10.2 % 0.3 % 1,742,873
California 32.5 % 8.1 % 46.0 % 11.2 % 0.8 % 6,298,999
CPS 9.3 % 50.4 % 36.8 % 3.3 % 0.2 % 426,040
Illinois 58.6 % 20.7 % 17.0 % 3.6 % 0.2 % 2,044,539
Table 2.1a Total K–12 Enrollment for California and Illinois, 2003
Level White
African American Latino
Asian/Pacific Islander
Native American Total
LA City (LAUSD) 9.1 % 11.8 % 72.5 % 6.3 % 0.3 % 747,009
LA County Suburbs 23.2 % 9.6 % 53.6 % 13.3 % 0.3 % 983,663
LA County 17.0 % 10.5 % 61.3 % 10.2 % 0.3 % 1,742,873
Table 2.1b Total K–12 Enrollment for Los Angeles County, 2003
LAUSD LA County CaliforniaGrade
Number % Number % Number %
K-6 416,026 55.7 % 943,117 54.1 % 3,386,332 53.8 %
7-8 131,217 17.6 % 296,139 17.0 % 1,035,127 16.4 %
9-12 199,766 26.7 % 503,617 28.9 % 1,877,540 29.8 %
Total 747,009 100.0 % 1,742,873 100.0 % 6,298,999 100.0 %
Table 2.2a Elem., Middle and High School Enrollments
for California, 2003
Enrollment by Grade. The second topic concerns the dispersion of students across elementary, middle, and high school.
The California sites report enrollments for each grade level from K–12. The figures in Table 2.2a demonstrate how the grade information can be sorted to show the numerical dominance of elementary school enrollment in the state, in the state’s largest county, and in the state’s largest school district. In each case around 55 percent of the student population is enrolled in elementary schools. In a school population with no net annual growth and an annual dropout rate of 5 percent for the ninth through twelfth grades, the proportion of K–6 students is expected to be about 55 percent.
The sizes of grade-specific enrollments are, of course, the basic elements for short-term and long-term enrollment projections. For example, the most current headcount of first-grade enrollments implies the enrollment size of succeeding
C16 Measuring the Minority Education Gap
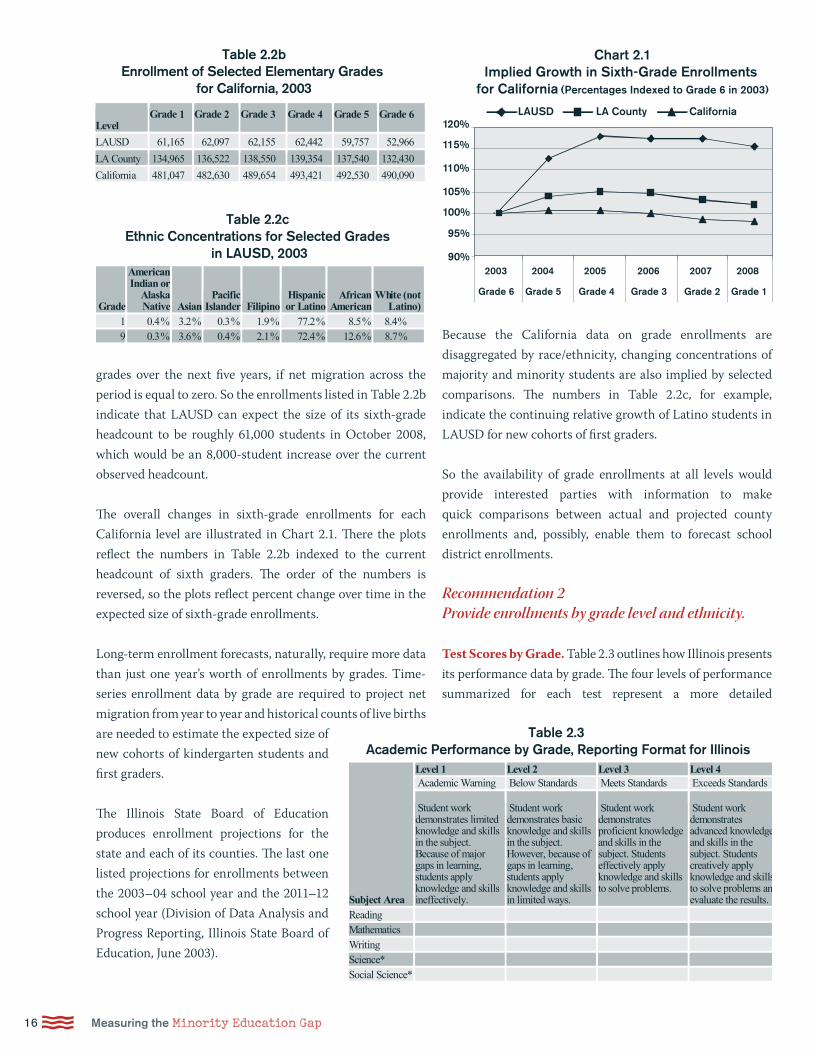
grades over the next five years, if net migration across the period is equal to zero. So the enrollments listed in Table 2.2b indicate that LAUSD can expect the size of its sixth-grade headcount to be roughly 61,000 students in October 2008, which would be an 8,000-student increase over the current observed headcount.
The overall changes in sixth-grade enrollments for each California level are illustrated in Chart 2.1. There the plots reflect the numbers in Table 2.2b indexed to the current headcount of sixth graders. The order of the numbers is reversed, so the plots reflect percent change over time in the expected size of sixth-grade enrollments.
Long-term enrollment forecasts, naturally, require more data than just one year’s worth of enrollments by grades. Time-series enrollment data by grade are required to project net migration from year to year and historical counts of live births are needed to estimate the expected size of new cohorts of kindergarten students and first graders.
The Illinois State Board of Education produces enrollment projections for the state and each of its counties. The last one listed projections for enrollments between the 2003–04 school year and the 2011–12 school year (Division of Data Analysis and Progress Reporting, Illinois State Board of Education, June 2003).
Because the California data on grade enrollments are disaggregated by race/ethnicity, changing concentrations of majority and minority students are also implied by selected comparisons. The numbers in Table 2.2c, for example, indicate the continuing relative growth of Latino students in LAUSD for new cohorts of first graders.
So the availability of grade enrollments at all levels would provide interested parties with information to make quick comparisons between actual and projected county enrollments and, possibly, enable them to forecast school district enrollments.
Recommendation 2 Provide enrollments by grade level and ethnicity.
Test Scores by Grade. Table 2.3 outlines how Illinois presents its performance data by grade. The four levels of performance summarized for each test represent a more detailed
Grade
American Indian or
Alaska Native Asian
Pacific Islander Filipino
Hispanic or Latino
African American
White (notLatino)
1 0.4 % 3.2 % 0.3 % 1.9 % 77.2 % 8.5 % 8.4% 9 0.3 % 3.6 % 0.4 % 2.1 % 72.4 % 12.6 % 8.7 %
Table 2.2c Ethnic Concentrations for Selected Grades
in LAUSD, 2003
Level 1 Level 2 Level 3 Level 4 Academic Warning Below Standards Meets Standards Exceeds Standards
Subject Area
Student work demonstrates limited knowledge and skills in the subject. Because of major gaps in learning, students apply knowledge and skills ineffectively.
Student work demonstrates basic knowledge and skills in the subject. However, because of gaps in learning, students apply knowledge and skills in limited ways.
Student work demonstrates proficient knowledge and skills in the subject. Students effectively apply knowledge and skills to solve problems.
Student work demonstrates advanced knowledge and skills in the subject. Students creatively apply knowledge and skills to solve problems and evaluate the results.
Reading Mathematics Writing Science* Social Science*
* Middle and high schools.
Table 2.3 Academic Performance by Grade, Reporting Format for Illinois
Table 2.2bEnrollment of Selected Elementary Grades
for California, 2003
Level
Grade 1 Grade 2 Grade 3 Grade 4 Grade 5 Grade 6
LAUSD 61,165 62,097 62,155 62,442 59,757 52,966
LA County 134,965 136,522 138,550 139,354 137,540 132,430
California 481,047 482,630 489,654 493,421 492,530 490,090
LAUSD LA County California
2003 20052004 20072006 2008
Grade 1Grade 6 Grade 5 Grade 4 Grade 3 Grade 2
120%
115%
110%
105%
100%
95%
90%
Chart 2.1Implied Growth in Sixth-Grade Enrollments
for California (Percentages Indexed to Grade 6 in 2003)
17CReport to the Joyce Foundation
presentation than the three-level classification specified by NCLB. So Illinois performance postings are exemplary.
Clear and specific standards are hallmarks of the Illinois accountability system. Each of the Illinois performance tests is aligned with consensus standards for each subject area under review at each relevant grade level. This is done by just fourteen states (“Editorial Projects in Education,” Education Week Vol. 23, 17, p. 133).
Thus, at this time, academic performance is one topic area that does not carry a recommendation.
Enrollment in Core Subjects. The next topic highlights participation in eleventh- and twelfth-grade core subjects, that is, subjects that are part of performance testing in math and science for students in those grades. These subjects are important because they are introductory courses to college-level material, are requirements for the college-track curriculum in high school, and may be requirements for admission to college. The figures in Table 2.4 demonstrate how enrollments in core courses are presented for California students. The numbers also indicate the similarities and differences associated with gender.
Recommendation 3 Post enrollments in core courses for eleventh and twelfth graders.
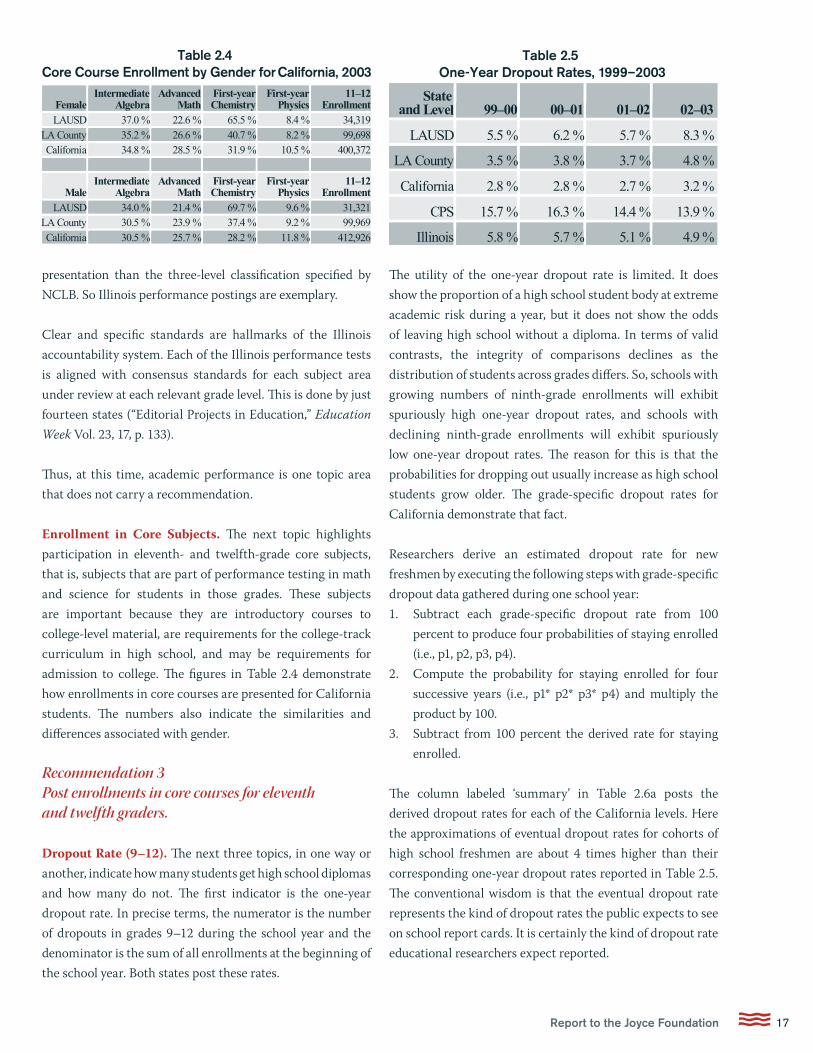
Dropout Rate (9–12). The next three topics, in one way or another, indicate how many students get high school diplomas and how many do not. The first indicator is the one-year dropout rate. In precise terms, the numerator is the number of dropouts in grades 9–12 during the school year and the denominator is the sum of all enrollments at the beginning of the school year. Both states post these rates.
The utility of the one-year dropout rate is limited. It does show the proportion of a high school student body at extreme academic risk during a year, but it does not show the odds of leaving high school without a diploma. In terms of valid contrasts, the integrity of comparisons declines as the distribution of students across grades differs. So, schools with growing numbers of ninth-grade enrollments will exhibit spuriously high one-year dropout rates, and schools with declining ninth-grade enrollments will exhibit spuriously low one-year dropout rates. The reason for this is that the probabilities for dropping out usually increase as high school students grow older. The grade-specific dropout rates for California demonstrate that fact.
Researchers derive an estimated dropout rate for new freshmen by executing the following steps with grade-specific dropout data gathered during one school year: 1. Subtract each grade-specific dropout rate from 100
percent to produce four probabilities of staying enrolled (i.e., p1, p2, p3, p4).
2. Compute the probability for staying enrolled for four successive years (i.e., p1* p2* p3* p4) and multiply the product by 100.
3. Subtract from 100 percent the derived rate for staying enrolled.
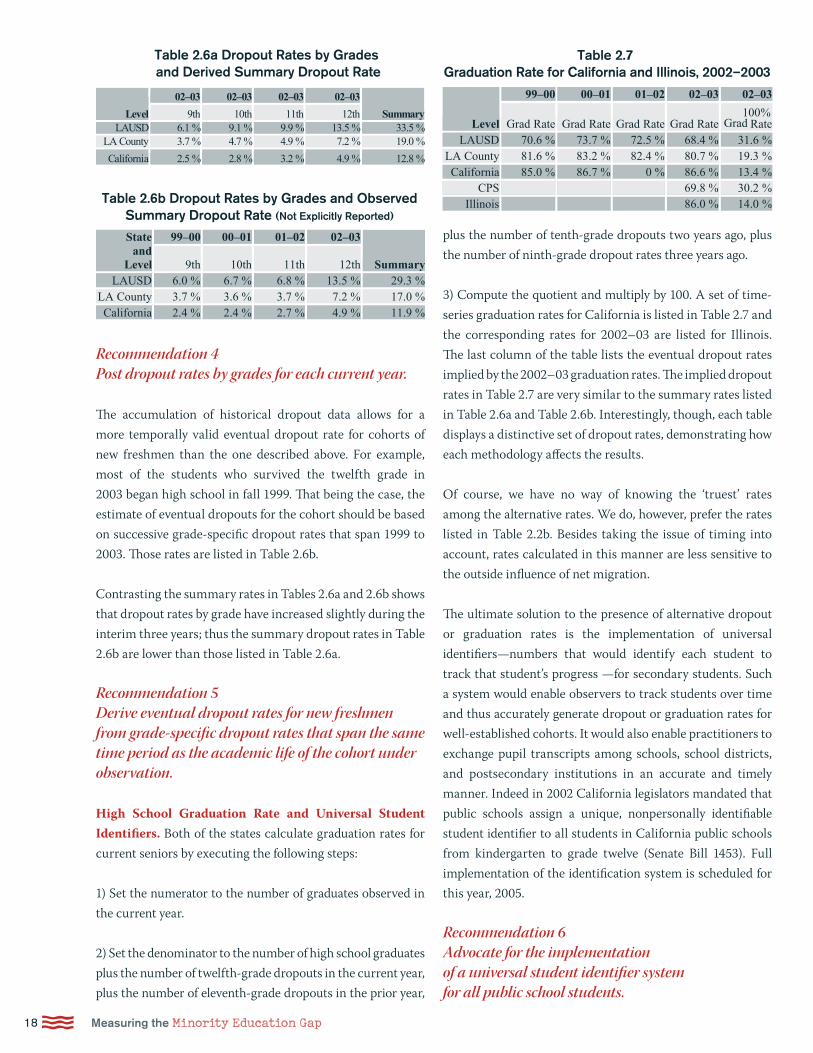
The column labeled ‘summary’ in Table 2.6a posts the derived dropout rates for each of the California levels. Here the approximations of eventual dropout rates for cohorts of high school freshmen are about 4 times higher than their corresponding one-year dropout rates reported in Table 2.5. The conventional wisdom is that the eventual dropout rate represents the kind of dropout rates the public expects to see on school report cards. It is certainly the kind of dropout rate educational researchers expect reported.
Female Intermediate
Algebra Advanced
Math First-year Chemistry
First-year Physics
11–12 Enrollment
LAUSD 37.0 % 22.6 % 65.5 % 8.4 % 34,319 LA County 35.2 % 26.6 % 40.7 % 8.2 % 99,698 California 34.8 % 28.5 % 31.9 % 10.5 % 400,372
Male Intermediate
Algebra Advanced
Math First-year Chemistry
First-year Physics
11–12 Enrollment
LAUSD 34.0 % 21.4 % 69.7 % 9.6 % 31,321 LA County 30.5 % 23.9 % 37.4 % 9.2 % 99,969 California 30.5 % 25.7 % 28.2 % 11.8 % 412,926
Table 2.4 Core Course Enrollment by Gender for California, 2003
State and
Level 99–00 00–01 01–02 02–03
LAUSD 5.5 % 6.2 % 5.7 % 8.3 %
LA County 3.5 % 3.8 % 3.7 % 4.8 %
California 2.8 % 2.8 % 2.7 % 3.2 %
CPS 15.7 % 16.3 % 14.4 % 13.9 %
Illinois 5.8 % 5.7 % 5.1 % 4.9 %
Table 2.5 One-Year Dropout Rates, 1999–2003
C18 Measuring the Minority Education Gap
plus the number of tenth-grade dropouts two years ago, plus the number of ninth-grade dropout rates three years ago.
3) Compute the quotient and multiply by 100. A set of time-series graduation rates for California is listed in Table 2.7 and the corresponding rates for 2002–03 are listed for Illinois. The last column of the table lists the eventual dropout rates implied by the 2002–03 graduation rates. The implied dropout rates in Table 2.7 are very similar to the summary rates listed in Table 2.6a and Table 2.6b. Interestingly, though, each table displays a distinctive set of dropout rates, demonstrating how each methodology affects the results.
Of course, we have no way of knowing the ‘truest’ rates among the alternative rates. We do, however, prefer the rates listed in Table 2.2b. Besides taking the issue of timing into account, rates calculated in this manner are less sensitive to the outside influence of net migration.
The ultimate solution to the presence of alternative dropout or graduation rates is the implementation of universal identifiers—numbers that would identify each student to track that student’s progress —for secondary students. Such a system would enable observers to track students over time and thus accurately generate dropout or graduation rates for well-established cohorts. It would also enable practitioners to exchange pupil transcripts among schools, school districts, and postsecondary institutions in an accurate and timely manner. Indeed in 2002 California legislators mandated that public schools assign a unique, nonpersonally identifiable student identifier to all students in California public schools from kindergarten to grade twelve (Senate Bill 1453). Full implementation of the identification system is scheduled for this year, 2005.
Recommendation 6 Advocate for the implementation of a universal student identifier system for all public school students.
Recommendation 4 Post dropout rates by grades for each current year.
The accumulation of historical dropout data allows for a more temporally valid eventual dropout rate for cohorts of new freshmen than the one described above. For example, most of the students who survived the twelfth grade in 2003 began high school in fall 1999. That being the case, the estimate of eventual dropouts for the cohort should be based on successive grade-specific dropout rates that span 1999 to 2003. Those rates are listed in Table 2.6b.
Contrasting the summary rates in Tables 2.6a and 2.6b shows that dropout rates by grade have increased slightly during the interim three years; thus the summary dropout rates in Table 2.6b are lower than those listed in Table 2.6a.
Recommendation 5 Derive eventual dropout rates for new freshmen from grade-specific dropout rates that span the same time period as the academic life of the cohort under observation.
High School Graduation Rate and Universal Student Identifiers. Both of the states calculate graduation rates for current seniors by executing the following steps:
1) Set the numerator to the number of graduates observed in the current year.
2) Set the denominator to the number of high school graduates plus the number of twelfth-grade dropouts in the current year, plus the number of eleventh-grade dropouts in the prior year,
99–00 00–01 01–02 02–03 02–03
Level Grad Rate Grad Rate Grad Rate Grad Rate 100 %
Grad RateLAUSD 70.6 % 73.7 % 72.5 % 68.4 % 31.6 %
LA County 81.6 % 83.2 % 82.4 % 80.7 % 19.3 %California 85.0 % 86.7 % 0 % 86.6 % 13.4 %
CPS 69.8 % 30.2 %Illinois 86.0 % 14.0 %
Table 2.7 Graduation Rate for California and Illinois, 2002–2003
02–03 02–03 02–03 02–03 Level 9th 10th 11th 12th Summary
LAUSD 6.1 % 9.1 % 9.9 % 13.5 % 33.5 %LA County 3.7 % 4.7 % 4.9 % 7.2 % 19.0 %
California 2.5 % 2.8 % 3.2 % 4.9 % 12.8 %
Table 2.6a Dropout Rates by Grades and Derived Summary Dropout Rate
99–00 00–01 01–02 02–03 State and
Level 9th 10th 11th 12th Summary LAUSD 6.0 % 6.7 % 6.8 % 13.5 % 29.3 %
LA County 3.7 % 3.6 % 3.7 % 7.2 % 17.0 % California 2.4 % 2.4 % 2.7 % 4.9 % 11.9 %
Table 2.6b Dropout Rates by Grades and Observed Summary Dropout Rate (Not Explicitly Reported)
19CReport to the Joyce Foundation
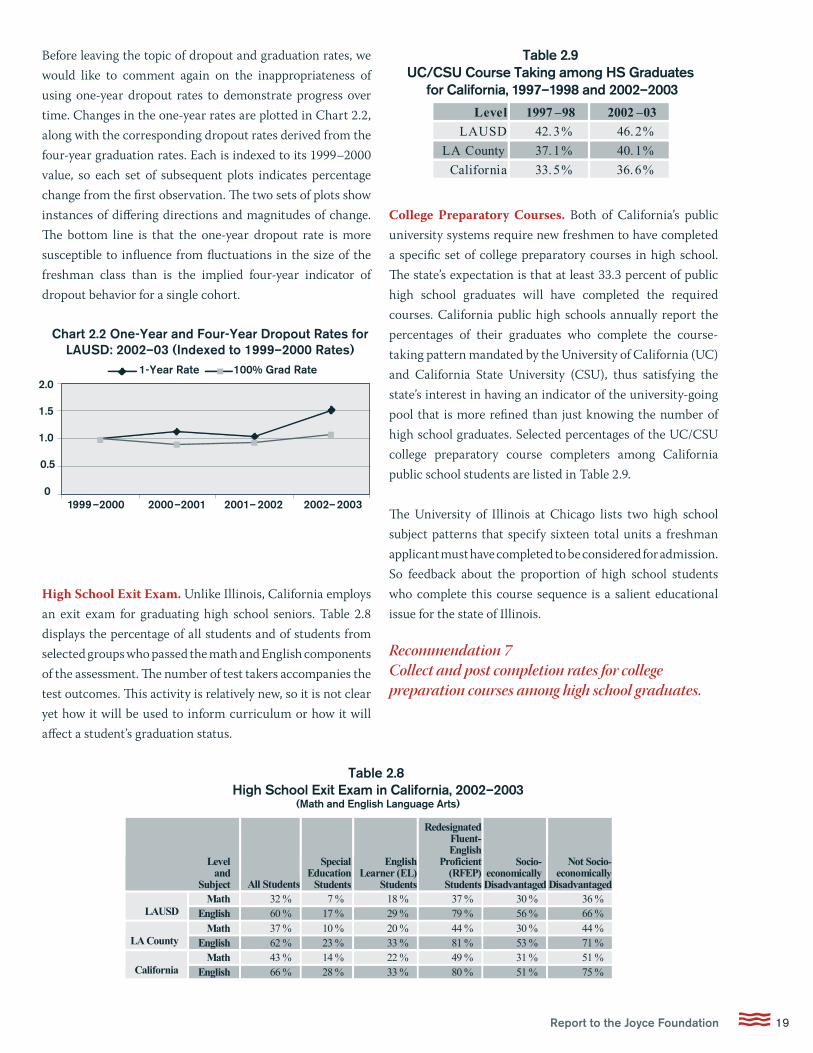
Before leaving the topic of dropout and graduation rates, we would like to comment again on the inappropriateness of using one-year dropout rates to demonstrate progress over time. Changes in the one-year rates are plotted in Chart 2.2, along with the corresponding dropout rates derived from the four-year graduation rates. Each is indexed to its 1999–2000 value, so each set of subsequent plots indicates percentage change from the first observation. The two sets of plots show instances of differing directions and magnitudes of change. The bottom line is that the one-year dropout rate is more susceptible to influence from fluctuations in the size of the freshman class than is the implied four-year indicator of dropout behavior for a single cohort.
High School Exit Exam. Unlike Illinois, California employs an exit exam for graduating high school seniors. Table 2.8 displays the percentage of all students and of students from selected groups who passed the math and English components of the assessment. The number of test takers accompanies the test outcomes. This activity is relatively new, so it is not clear yet how it will be used to inform curriculum or how it will affect a student’s graduation status.
College Preparatory Courses. Both of California’s public university systems require new freshmen to have completed a specific set of college preparatory courses in high school. The state’s expectation is that at least 33.3 percent of public high school graduates will have completed the required courses. California public high schools annually report the percentages of their graduates who complete the course-taking pattern mandated by the University of California (UC) and California State University (CSU), thus satisfying the state’s interest in having an indicator of the university-going pool that is more refined than just knowing the number of high school graduates. Selected percentages of the UC/CSU college preparatory course completers among California public school students are listed in Table 2.9.
The University of Illinois at Chicago lists two high school subject patterns that specify sixteen total units a freshman applicant must have completed to be considered for admission. So feedback about the proportion of high school students who complete this course sequence is a salient educational issue for the state of Illinois.
Recommendation 7 Collect and post completion rates for college preparation courses among high school graduates.
1-Year Rate
01999–2000 2000–2001 2001– 2002 2002–2003
100% Grad Rate
0.5
1.0
1.5
2.0
Chart 2.2 One-Year and Four-Year Dropout Rates for LAUSD: 2002–03 (Indexed to 1999–2000 Rates)
Level and
Subject All Students
Special Education
Students
English Learner (EL)
Students
Redesignated Fluent-English
Proficient (RFEP)
Students
Socio-economicallyDisadvantaged
Not Socio- economically
Disadvantaged
Math 32 % 7 % 18 % 37 % 30 % 36 % LAUSD English 60 % 17 % 29 % 79 % 56 % 66 %
Math 37 % 10 % 20 % 44 % 30 % 44 % LA County English 62 % 23 % 33 % 81 % 53 % 71 %
Math 43 % 14 % 22 % 49 % 31 % 51 % California English 66 % 28 % 33 % 80 % 51 % 75 %
Table 2.8 High School Exit Exam in California, 2002–2003
(Math and English Language Arts)
Level 1997 –98 2002 –03
LAUSD 42.3 % 46.2 %
LA County 37.1 % 40.1 %
California 33.5 % 36.6 %
Table 2.9 UC/CSU Course Taking among HS Graduates
for California, 1997–1998 and 2002–2003
C20 Measuring the Minority Education Gap
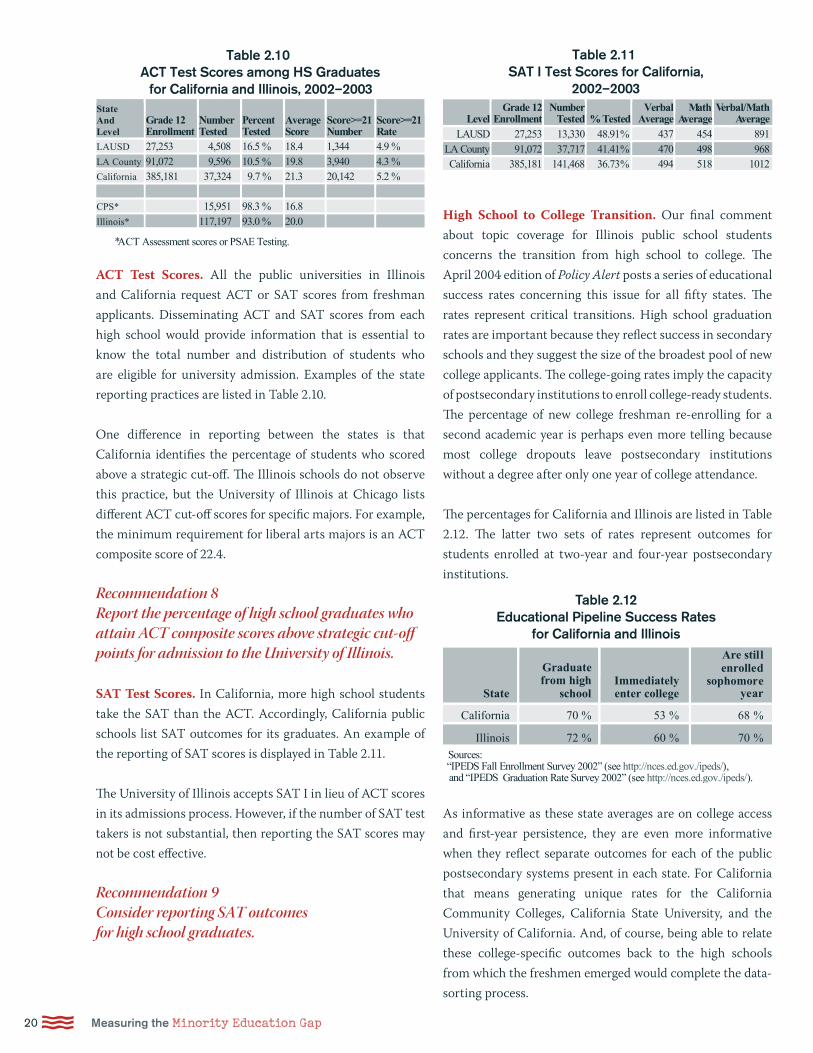
ACT Test Scores. All the public universities in Illinois and California request ACT or SAT scores from freshman applicants. Disseminating ACT and SAT scores from each high school would provide information that is essential to know the total number and distribution of students who are eligible for university admission. Examples of the state reporting practices are listed in Table 2.10.
One difference in reporting between the states is that California identifies the percentage of students who scored above a strategic cut-off. The Illinois schools do not observe this practice, but the University of Illinois at Chicago lists different ACT cut-off scores for specific majors. For example, the minimum requirement for liberal arts majors is an ACT composite score of 22.4.
Recommendation 8 Report the percentage of high school graduates who attain ACT composite scores above strategic cut-off points for admission to the University of Illinois.
SAT Test Scores. In California, more high school students take the SAT than the ACT. Accordingly, California public schools list SAT outcomes for its graduates. An example of the reporting of SAT scores is displayed in Table 2.11.
The University of Illinois accepts SAT I in lieu of ACT scores in its admissions process. However, if the number of SAT test takers is not substantial, then reporting the SAT scores may not be cost effective.
Recommendation 9 Consider reporting SAT outcomes for high school graduates.
High School to College Transition. Our final comment about topic coverage for Illinois public school students concerns the transition from high school to college. The April 2004 edition of Policy Alert posts a series of educational success rates concerning this issue for all fifty states. The rates represent critical transitions. High school graduation rates are important because they reflect success in secondary schools and they suggest the size of the broadest pool of new college applicants. The college-going rates imply the capacity of postsecondary institutions to enroll college-ready students. The percentage of new college freshman re-enrolling for a second academic year is perhaps even more telling because most college dropouts leave postsecondary institutions without a degree after only one year of college attendance.
The percentages for California and Illinois are listed in Table 2.12. The latter two sets of rates represent outcomes for students enrolled at two-year and four-year postsecondary institutions.
As informative as these state averages are on college access and first-year persistence, they are even more informative when they reflect separate outcomes for each of the public postsecondary systems present in each state. For California that means generating unique rates for the California Community Colleges, California State University, and the University of California. And, of course, being able to relate these college-specific outcomes back to the high schools from which the freshmen emerged would complete the data-sorting process.
State
Graduate from high
school Immediately enter college
Are stillenrolled
sophomoreyear
California 70 % 53 % 68 %
Illinois 72 % 60 % 70 %Sources:“IPEDS Fall Enrollment Survey 2002” (see http://nces.ed.gov./ipeds/), and “IPEDS Graduation Rate Survey 2002” (see http://nces.ed.gov./ipeds/).
Table 2.12 Educational Pipeline Success Rates
for California and Illinois
Level Grade 12
Enrollment Number
Tested % Tested Verbal
Average Math
Average Verbal/Math
AverageLAUSD 27,253 13,330 48.91 % 437 454 891
LA County 91,072 37,717 41.41 % 470 498 968California 385,181 141,468 36.73 % 494 518 1012
Table 2.11 SAT I Test Scores for California,
2002–2003State And Level
Grade 12 Enrollment
Number Tested
Percent Tested
Average Score
Score>=21 Number
Score>=21 Rate
LAUSD 27,253 4,508 16.5 %%
18.4 1,344 4.9 %LA County 91,072 9,596 10.5 19.8 3,940 4.3 % California 385,181 37,324 9.7 % 21.3 20,142 5.2 % CPS* 15,951 98.3 % 16.8 Illinois* 117,197 93.0 % 20.0
*ACT Assessment scores or PSAE Testing.
Table 2.10 ACT Test Scores among HS Graduates
for California and Illinois, 2002–2003
21CReport to the Joyce Foundation
California’s colleges and universities, in fact, report percentages for these two college outcomes for students from specific high schools. California State University, for example, annually publishes how many freshmen originated from specific high schools and reports how many survived their first year of study (see Academic Performance Reports at www.asd.calstate.edu/as). The feedback to high schools also includes first-year grade point averages and assessments of college proficiency in math and English. The high school origins of the freshmen are determined by the information entered on the undergraduate applications. This shows that institutions of higher learning can give individual high schools feedback regarding the early college experience of their recent graduates. Although the Illinois higher education system is organized differently from that of California, there is no reason why Illinois colleges and universities could not provide similarly useful information for their feeder schools.
Recommendation 10 Petition Illinois’ institutions of higher education to produce school-specific reports on the college-going rates for recent graduates from Illinois public high schools and college performance during their freshman year.
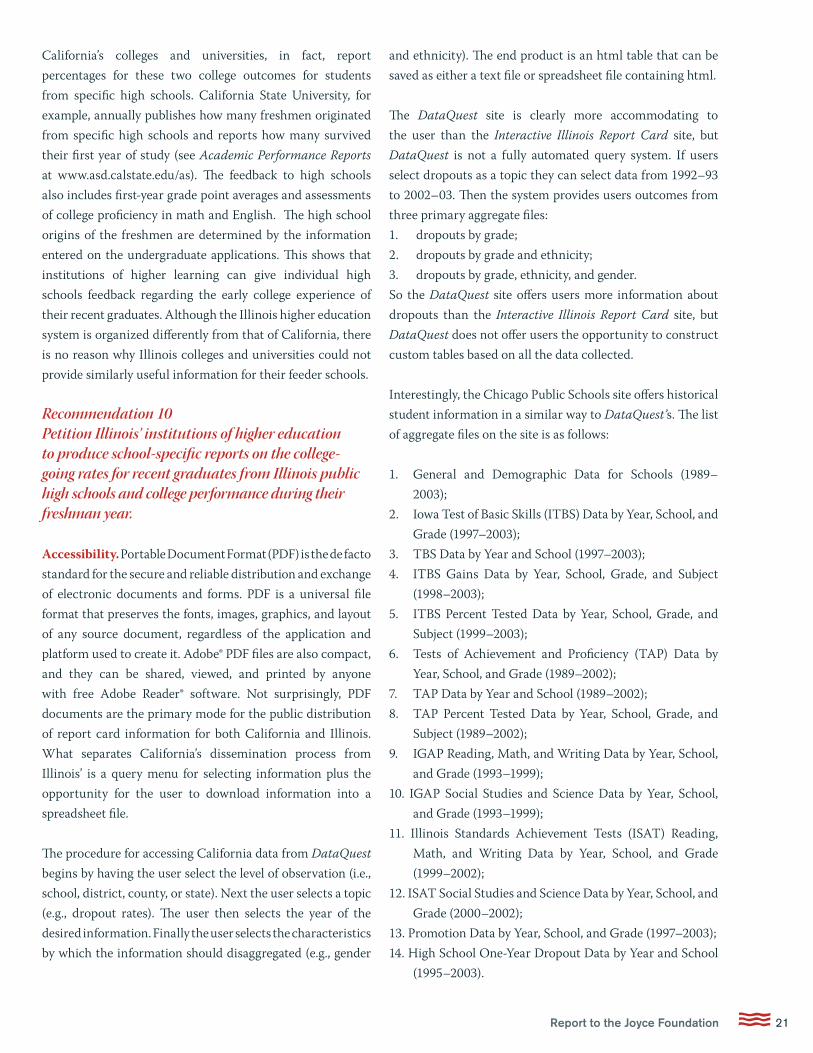
Accessibility. Portable Document Format (PDF) is the de facto standard for the secure and reliable distribution and exchange of electronic documents and forms. PDF is a universal file format that preserves the fonts, images, graphics, and layout of any source document, regardless of the application and platform used to create it. Adobe® PDF files are also compact, and they can be shared, viewed, and printed by anyone with free Adobe Reader® software. Not surprisingly, PDF documents are the primary mode for the public distribution of report card information for both California and Illinois. What separates California’s dissemination process from Illinois’ is a query menu for selecting information plus the opportunity for the user to download information into a spreadsheet file.
The procedure for accessing California data from DataQuest begins by having the user select the level of observation (i.e., school, district, county, or state). Next the user selects a topic (e.g., dropout rates). The user then selects the year of the desired information. Finally the user selects the characteristics by which the information should disaggregated (e.g., gender
and ethnicity). The end product is an html table that can be saved as either a text file or spreadsheet file containing html.
The DataQuest site is clearly more accommodating to the user than the Interactive Illinois Report Card site, but DataQuest is not a fully automated query system. If users select dropouts as a topic they can select data from 1992–93 to 2002–03. Then the system provides users outcomes from three primary aggregate files: 1. dropouts by grade;2. dropouts by grade and ethnicity;3. dropouts by grade, ethnicity, and gender.So the DataQuest site offers users more information about dropouts than the Interactive Illinois Report Card site, but DataQuest does not offer users the opportunity to construct custom tables based on all the data collected.
Interestingly, the Chicago Public Schools site offers historical student information in a similar way to DataQuest’s. The list of aggregate files on the site is as follows:
1. General and Demographic Data for Schools (1989–2003);
2. Iowa Test of Basic Skills (ITBS) Data by Year, School, and Grade (1997–2003);
3. TBS Data by Year and School (1997–2003);4. ITBS Gains Data by Year, School, Grade, and Subject
(1998–2003);5. ITBS Percent Tested Data by Year, School, Grade, and
Subject (1999–2003);6. Tests of Achievement and Proficiency (TAP) Data by
Year, School, and Grade (1989–2002);7. TAP Data by Year and School (1989–2002);8. TAP Percent Tested Data by Year, School, Grade, and
Subject (1989–2002);9. IGAP Reading, Math, and Writing Data by Year, School,
and Grade (1993–1999);10. IGAP Social Studies and Science Data by Year, School,
and Grade (1993–1999); 11. Illinois Standards Achievement Tests (ISAT) Reading,
Math, and Writing Data by Year, School, and Grade (1999–2002);
12. ISAT Social Studies and Science Data by Year, School, and Grade (2000–2002);
13. Promotion Data by Year, School, and Grade (1997–2003);14. High School One-Year Dropout Data by Year and School
(1995–2003).

C22 Measuring the Minority Education Gap
Chapter Summary
The Illinois data information system does meet the minimum requirement of the NCLB act; however, a more sophisticated data information system would better assess the achievement gap and help identify and address the needs of school-age children in the state.
Our Illinois/California comparisons generated eleven recommendations regarding indicators that Illinois public schools and institutes of higher learning could implement to provide better data to researchers and policymakers. (See Chapter 6, page 36 for the full list.) Most of the recommendations fall into the category of fuller disclosure for data that are already collected.
The greatest challenge is to move toward a data collection system that is student based, with unique student identifiers that link records from different sources.
The one cautionary note is to move away from using the one-year dropout rate for all high school students to suggest annual progress. This rate understates the dropout phenomenon for new high school students, and it can rise or fall simply because of an increase or decrease in the size of the incoming freshman class.
The next chapters offer a comparative look by race at the social and educational characteristics of children in ten target school districts.
The downside is that none of the aggregate files on Chicago students provides numbers for the separate subgroups.
Recommendation 11 Develop a student information system that permits users to retrieve data via a query system and select the level of observation, the topic of interest, the year, and subgroup totals. The query system should also offer users the option of downloading their queried tables into text files or spreadsheet files.
23CReport to the Joyce Foundation
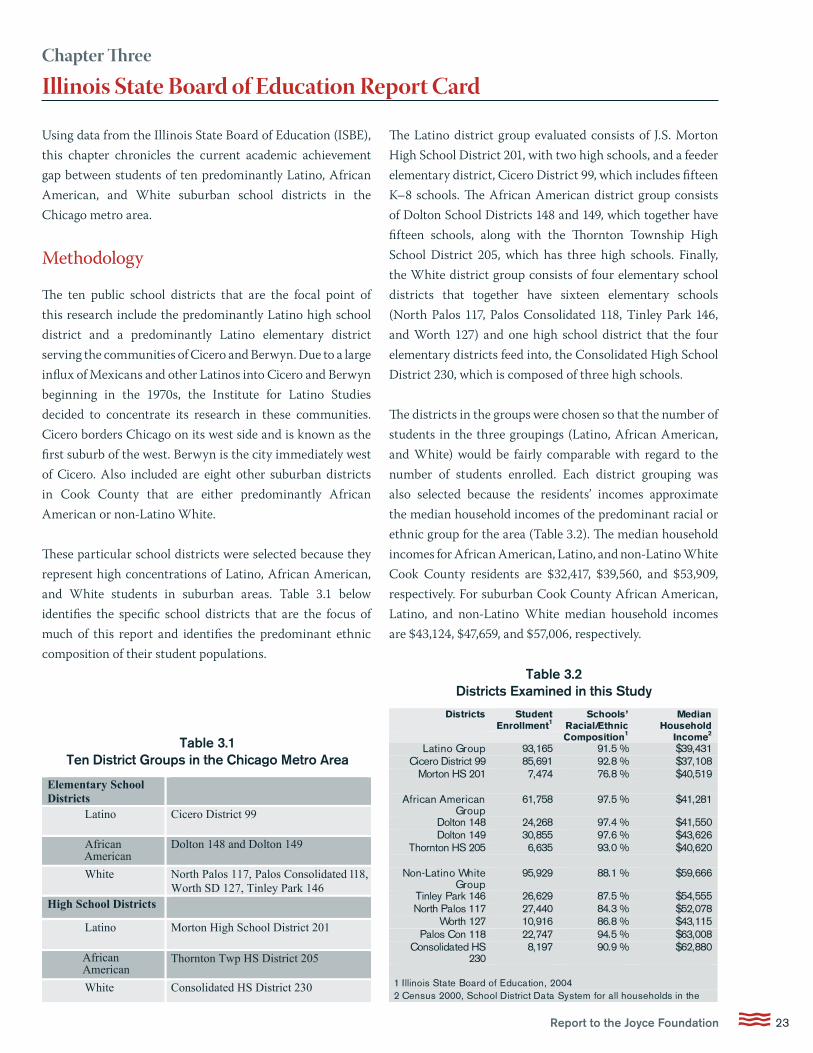
Using data from the Illinois State Board of Education (ISBE), this chapter chronicles the current academic achievement gap between students of ten predominantly Latino, African American, and White suburban school districts in the Chicago metro area.
Methodology
The ten public school districts that are the focal point of this research include the predominantly Latino high school district and a predominantly Latino elementary district serving the communities of Cicero and Berwyn. Due to a large influx of Mexicans and other Latinos into Cicero and Berwyn beginning in the 1970s, the Institute for Latino Studies decided to concentrate its research in these communities. Cicero borders Chicago on its west side and is known as the first suburb of the west. Berwyn is the city immediately west of Cicero. Also included are eight other suburban districts in Cook County that are either predominantly African American or non-Latino White.
These particular school districts were selected because they represent high concentrations of Latino, African American, and White students in suburban areas. Table 3.1 below identifies the specific school districts that are the focus of much of this report and identifies the predominant ethnic composition of their student populations.
The Latino district group evaluated consists of J.S. Morton High School District 201, with two high schools, and a feeder elementary district, Cicero District 99, which includes fifteen K–8 schools. The African American district group consists of Dolton School Districts 148 and 149, which together have fifteen schools, along with the Thornton Township High School District 205, which has three high schools. Finally, the White district group consists of four elementary school districts that together have sixteen elementary schools (North Palos 117, Palos Consolidated 118, Tinley Park 146, and Worth 127) and one high school district that the four elementary districts feed into, the Consolidated High School District 230, which is composed of three high schools.
The districts in the groups were chosen so that the number of students in the three groupings (Latino, African American, and White) would be fairly comparable with regard to the number of students enrolled. Each district grouping was also selected because the residents’ incomes approximate the median household incomes of the predominant racial or ethnic group for the area (Table 3.2). The median household incomes for African American, Latino, and non-Latino White Cook County residents are $32,417, $39,560, and $53,909, respectively. For suburban Cook County African American, Latino, and non-Latino White median household incomes are $43,124, $47,659, and $57,006, respectively.
Elementary School Districts
Latino Cicero District 99
African Dolton 148 and Dolton 149
White North Palos 117, Palos Consolidated 118, Worth SD 127, Tinley Park 146
High School Districts
Latino Morton High School District 201
Thornton Twp HS District 205
White Consolidated HS District 230
American
AfricanAmerican
Table 3.1 Ten District Groups in the Chicago Metro Area
Districts Student Enrollment1
Schools’ Racial/Ethnic
Median Household
Composition1 Income2
Latino Group 93,165 91.5 % $39,431 Cicero District 99 85,691 92.8 % $37,108
Morton HS 201 7,474 76.8 % $40,519
African American Group
61,758 97.5 % $41,281
Dolton 148 24,268 97.4 % $41,550 Dolton 149 30,855 97.6 % $43,626
Thornton HS 205 6,635 93.0 % $40,620
Non-Latino White Group
95,929 88.1 % $59,666
Tinley Park 146 26,629 87.5 % $54,555 North Palos 117 27,440 84.3 % $52,078
Worth 127 10,916 86.8 % $43,115 Palos Con 118 22,747 94.5 % $63,008
Consolidated HS 230
8,197 90.9 % $62,880
1 Illinois State Board of Education, 2004 2 Census 2000, School District Data System for all households in the
district.
Table 3.2 Districts Examined in this Study
Chapter Three
Illinois State Board of Education Report Card
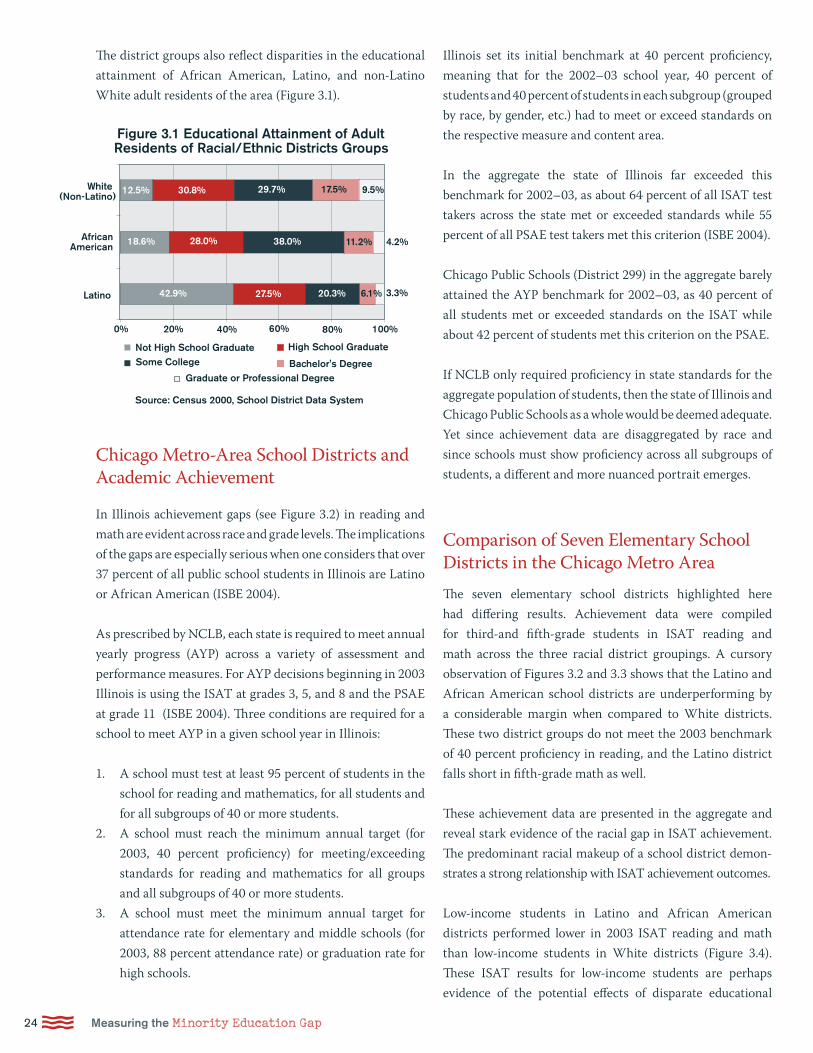
C24 Measuring the Minority Education Gap
The district groups also reflect disparities in the educational attainment of African American, Latino, and non-Latino White adult residents of the area (Figure 3.1).
Chicago Metro-Area School Districts and Academic Achievement
In Illinois achievement gaps (see Figure 3.2) in reading and math are evident across race and grade levels. The implications of the gaps are especially serious when one considers that over 37 percent of all public school students in Illinois are Latino or African American (ISBE 2004).
As prescribed by NCLB, each state is required to meet annual yearly progress (AYP) across a variety of assessment and performance measures. For AYP decisions beginning in 2003 Illinois is using the ISAT at grades 3, 5, and 8 and the PSAE at grade 11 (ISBE 2004). Three conditions are required for a school to meet AYP in a given school year in Illinois:
1. A school must test at least 95 percent of students in the school for reading and mathematics, for all students and for all subgroups of 40 or more students.
2. A school must reach the minimum annual target (for 2003, 40 percent proficiency) for meeting/exceeding standards for reading and mathematics for all groups and all subgroups of 40 or more students.
3. A school must meet the minimum annual target for attendance rate for elementary and middle schools (for 2003, 88 percent attendance rate) or graduation rate for high schools.
Illinois set its initial benchmark at 40 percent proficiency, meaning that for the 2002–03 school year, 40 percent of students and 40 percent of students in each subgroup (grouped by race, by gender, etc.) had to meet or exceed standards on the respective measure and content area.
In the aggregate the state of Illinois far exceeded this benchmark for 2002–03, as about 64 percent of all ISAT test takers across the state met or exceeded standards while 55 percent of all PSAE test takers met this criterion (ISBE 2004).
Chicago Public Schools (District 299) in the aggregate barely attained the AYP benchmark for 2002–03, as 40 percent of all students met or exceeded standards on the ISAT while about 42 percent of students met this criterion on the PSAE.
If NCLB only required proficiency in state standards for the aggregate population of students, then the state of Illinois and Chicago Public Schools as a whole would be deemed adequate. Yet since achievement data are disaggregated by race and since schools must show proficiency across all subgroups of students, a different and more nuanced portrait emerges.
Comparison of Seven Elementary School Districts in the Chicago Metro AreaThe seven elementary school districts highlighted here had differing results. Achievement data were compiled for third-and fifth-grade students in ISAT reading and math across the three racial district groupings. A cursory observation of Figures 3.2 and 3.3 shows that the Latino and African American school districts are underperforming by a considerable margin when compared to White districts. These two district groups do not meet the 2003 benchmark of 40 percent proficiency in reading, and the Latino district falls short in fifth-grade math as well.
These achievement data are presented in the aggregate and reveal stark evidence of the racial gap in ISAT achievement. The predominant racial makeup of a school district demon-strates a strong relationship with ISAT achievement outcomes.
Low-income students in Latino and African American districts performed lower in 2003 ISAT reading and math than low-income students in White districts (Figure 3.4). These ISAT results for low-income students are perhaps evidence of the potential effects of disparate educational
Figure 3.1 Educational Attainment of Adult Residents of Racial/Ethnic Districts Groups
White (Non-Latino)
African American
Latino
Not High School GraduateSome College
Graduate or Professional Degree
High School Graduate
Bachelor's Degree
Source: Census 2000, School District Data System
20%
17.5% 9.5%29.7%30.8%12.5%
18.6% 11.2%28.0% 38.0% 4.2%
3.3%6.1%20.3%27.5%42.9%
40% 60% 80% 100%0%
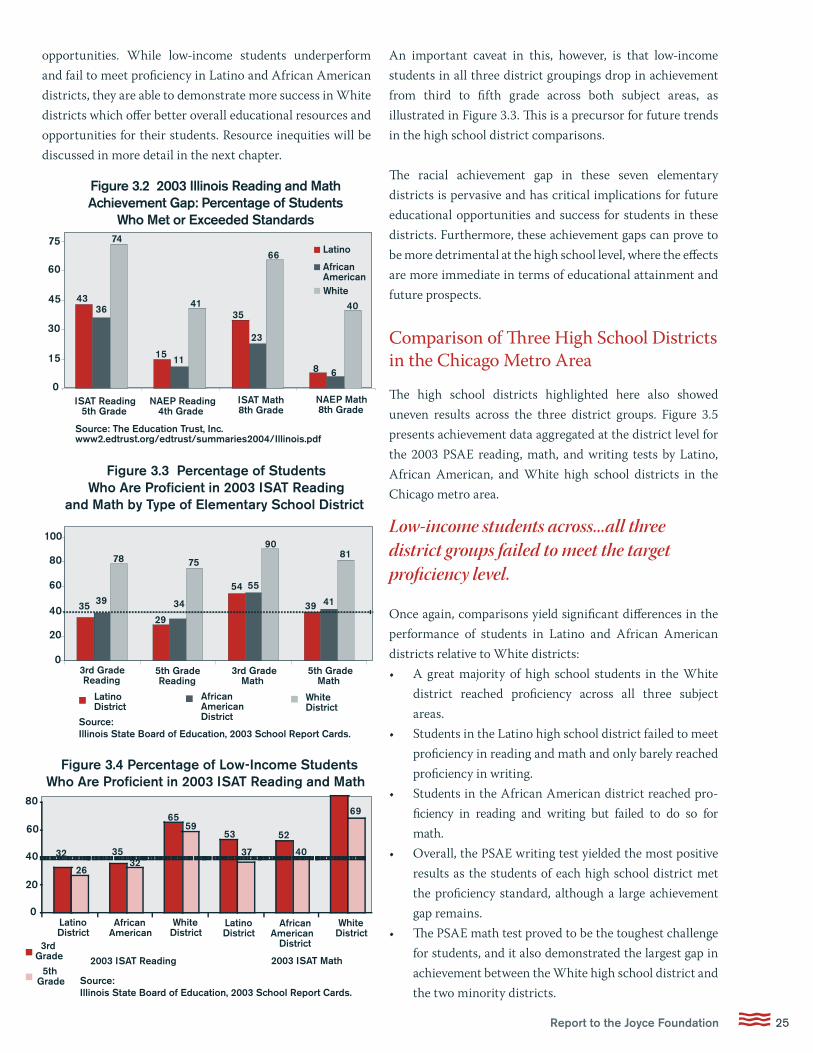
25CReport to the Joyce Foundation
opportunities. While low-income students underperform and fail to meet proficiency in Latino and African American districts, they are able to demonstrate more success in White districts which offer better overall educational resources and opportunities for their students. Resource inequities will be discussed in more detail in the next chapter.
An important caveat in this, however, is that low-income students in all three district groupings drop in achievement from third to fifth grade across both subject areas, as illustrated in Figure 3.3. This is a precursor for future trends in the high school district comparisons.
The racial achievement gap in these seven elementary districts is pervasive and has critical implications for future educational opportunities and success for students in these districts. Furthermore, these achievement gaps can prove to be more detrimental at the high school level, where the effects are more immediate in terms of educational attainment and future prospects.
Comparison of Three High School Districts in the Chicago Metro Area
The high school districts highlighted here also showed uneven results across the three district groups. Figure 3.5 presents achievement data aggregated at the district level for the 2003 PSAE reading, math, and writing tests by Latino, African American, and White high school districts in the Chicago metro area.
Once again, comparisons yield significant differences in the performance of students in Latino and African American districts relative to White districts: • A great majority of high school students in the White
district reached proficiency across all three subject areas.
• Students in the Latino high school district failed to meet proficiency in reading and math and only barely reached proficiency in writing.
• Students in the African American district reached pro-ficiency in reading and writing but failed to do so for math.
• Overall, the PSAE writing test yielded the most positive results as the students of each high school district met the proficiency standard, although a large achievement gap remains.
• The PSAE math test proved to be the toughest challenge for students, and it also demonstrated the largest gap in achievement between the White high school district and the two minority districts.
Figure 3.2 2003 Illinois Reading and Math Achievement Gap: Percentage of Students
Who Met or Exceeded Standards
ISAT Reading5th Grade
75
NAEP Reading4th Grade
ISAT Math8th Grade
NAEP Math8th Grade
15
30
60
45
0
4336
74
15 11
4135
23
66
8 6
40
Latino
White
African American
Source: The Education Trust, Inc. www2.edtrust.org/edtrust/summaries2004/Illinois.pdf
5th Grade Reading
100
20
40
80
60
0
Latino District
White District
African American District
3rd Grade Reading
3rd Grade Math
5th Grade Math
35 39
78
29
34
75
54 55
90
39 41
81
Source: Illinois State Board of Education, 2003 School Report Cards.
Figure 3.3 Percentage of Students Who Are Proficient in 2003 ISAT Reading
and Math by Type of Elementary School District
20
40
80
60
0
Figure 3.4 Percentage of Low-Income StudentsWho Are Proficient in 2003 ISAT Reading and Math
5th Grade
3rd Grade
Latino District
White District
African American
2003 ISAT Reading 2003 ISAT Math
Latino District
White District
African American
District
32
26
3532
6559
53
37
52
40
69
Source: Illinois State Board of Education, 2003 School Report Cards.
Low-income students across...all three district groups failed to meet the target proficiency level.
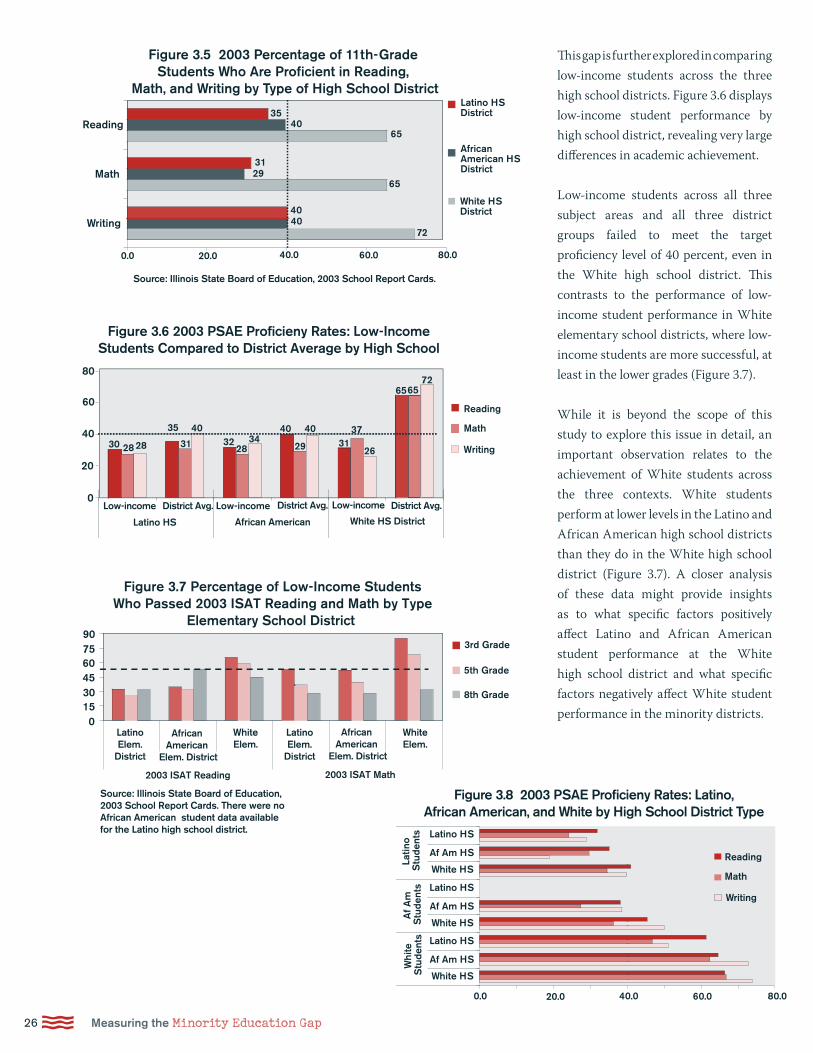
C26 Measuring the Minority Education Gap
This gap is further explored in comparing low-income students across the three high school districts. Figure 3.6 displays low-income student performance by high school district, revealing very large differences in academic achievement.
Low-income students across all three subject areas and all three district groups failed to meet the target proficiency level of 40 percent, even in the White high school district. This contrasts to the performance of low-income student performance in White elementary school districts, where low-income students are more successful, at least in the lower grades (Figure 3.7).
While it is beyond the scope of this study to explore this issue in detail, an important observation relates to the achievement of White students across the three contexts. White students perform at lower levels in the Latino and African American high school districts than they do in the White high school district (Figure 3.7). A closer analysis of these data might provide insights as to what specific factors positively affect Latino and African American student performance at the White high school district and what specific factors negatively affect White student performance in the minority districts.
Latino HSDistrict
White HS District
African American HS District
20.0 40.0 80.060.00.0
Figure 3.5 2003 Percentage of 11th-Grade Students Who Are Proficient in Reading,
Math, and Writing by Type of High School District
Math
Writing
Reading35
4065
4040
72
3129
65
Source: Illinois State Board of Education, 2003 School Report Cards.
Figure 3.6 2003 PSAE Proficieny Rates: Low-Income Students Compared to District Average by High School
30 28 28
20
40
80
60
0
Math
Writing
Reading
Latino HS White HS DistrictAfrican American
Low-income District Avg. Low-income District Avg. Low-income District Avg.
35
31
4032
2834
40
29 3137
26
656572
40
75
1530
6045
0
Figure 3.7 Percentage of Low-Income Students Who Passed 2003 ISAT Reading and Math by Type
Elementary School District
5th Grade
3rd Grade
8th Grade
90
Latino Elem.
District
White Elem.
African American
Elem. District
2003 ISAT Math2003 ISAT Reading
Latino Elem.
District
White Elem.
African American
Elem. District
Source: Illinois State Board of Education, 2003 School Report Cards. There were no African American student data available for the Latino high school district.
Figure 3.8 2003 PSAE Proficieny Rates: Latino, African American, and White by High School District Type
Math
Writing
Reading
Latino HS
White HS
Af Am HS
20.0 40.0 80.060.00.0
Latino HS
White HS
Af Am HS
Latino HS
White HS
Af Am HS
Latin
o S
tude
nts
Whi
te
Stu
dent
sA
f Am
S
tude
nts
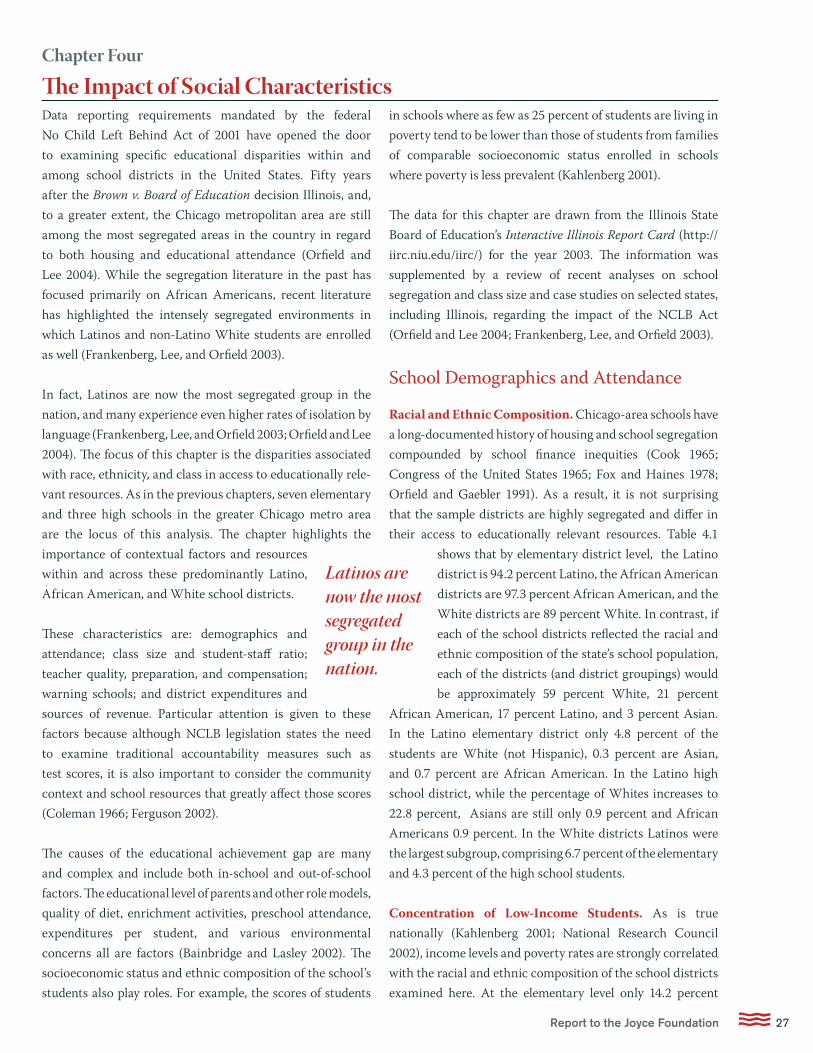
27CReport to the Joyce Foundation
Data reporting requirements mandated by the federal No Child Left Behind Act of 2001 have opened the door to examining specific educational disparities within and among school districts in the United States. Fifty years after the Brown v. Board of Education decision Illinois, and, to a greater extent, the Chicago metropolitan area are still among the most segregated areas in the country in regard to both housing and educational attendance (Orfield and Lee 2004). While the segregation literature in the past has focused primarily on African Americans, recent literature has highlighted the intensely segregated environments in which Latinos and non-Latino White students are enrolled as well (Frankenberg, Lee, and Orfield 2003).
In fact, Latinos are now the most segregated group in the nation, and many experience even higher rates of isolation by language (Frankenberg, Lee, and Orfield 2003; Orfield and Lee 2004). The focus of this chapter is the disparities associated with race, ethnicity, and class in access to educationally rele-vant resources. As in the previous chapters, seven elementary and three high schools in the greater Chicago metro area are the locus of this analysis. The chapter highlights the importance of contextual factors and resources within and across these predominantly Latino, African American, and White school districts.
These characteristics are: demographics and attendance; class size and student-staff ratio; teacher quality, preparation, and compensation; warning schools; and district expenditures and sources of revenue. Particular attention is given to these factors because although NCLB legislation states the need to examine traditional accountability measures such as test scores, it is also important to consider the community context and school resources that greatly affect those scores (Coleman 1966; Ferguson 2002).
The causes of the educational achievement gap are many and complex and include both in-school and out-of-school factors. The educational level of parents and other role models, quality of diet, enrichment activities, preschool attendance, expenditures per student, and various environmental concerns all are factors (Bainbridge and Lasley 2002). The socioeconomic status and ethnic composition of the school’s students also play roles. For example, the scores of students
in schools where as few as 25 percent of students are living in poverty tend to be lower than those of students from families of comparable socioeconomic status enrolled in schools where poverty is less prevalent (Kahlenberg 2001).
The data for this chapter are drawn from the Illinois State Board of Education’s Interactive Illinois Report Card (http://iirc.niu.edu/iirc/) for the year 2003. The information was supplemented by a review of recent analyses on school segregation and class size and case studies on selected states, including Illinois, regarding the impact of the NCLB Act (Orfield and Lee 2004; Frankenberg, Lee, and Orfield 2003).
School Demographics and Attendance
Racial and Ethnic Composition. Chicago-area schools have a long-documented history of housing and school segregation compounded by school finance inequities (Cook 1965; Congress of the United States 1965; Fox and Haines 1978; Orfield and Gaebler 1991). As a result, it is not surprising that the sample districts are highly segregated and differ in their access to educationally relevant resources. Table 4.1
shows that by elementary district level, the Latino district is 94.2 percent Latino, the African American districts are 97.3 percent African American, and the White districts are 89 percent White. In contrast, if each of the school districts reflected the racial and ethnic composition of the state’s school population, each of the districts (and district groupings) would be approximately 59 percent White, 21 percent
African American, 17 percent Latino, and 3 percent Asian. In the Latino elementary district only 4.8 percent of the students are White (not Hispanic), 0.3 percent are Asian, and 0.7 percent are African American. In the Latino high school district, while the percentage of Whites increases to 22.8 percent, Asians are still only 0.9 percent and African Americans 0.9 percent. In the White districts Latinos were the largest subgroup, comprising 6.7 percent of the elementary and 4.3 percent of the high school students.
Concentration of Low-Income Students. As is true nationally (Kahlenberg 2001; National Research Council 2002), income levels and poverty rates are strongly correlated with the racial and ethnic composition of the school districts examined here. At the elementary level only 14.2 percent
Chapter Four
The Impact of Social Characteristics
Latinos are now the most segregated group in the nation.
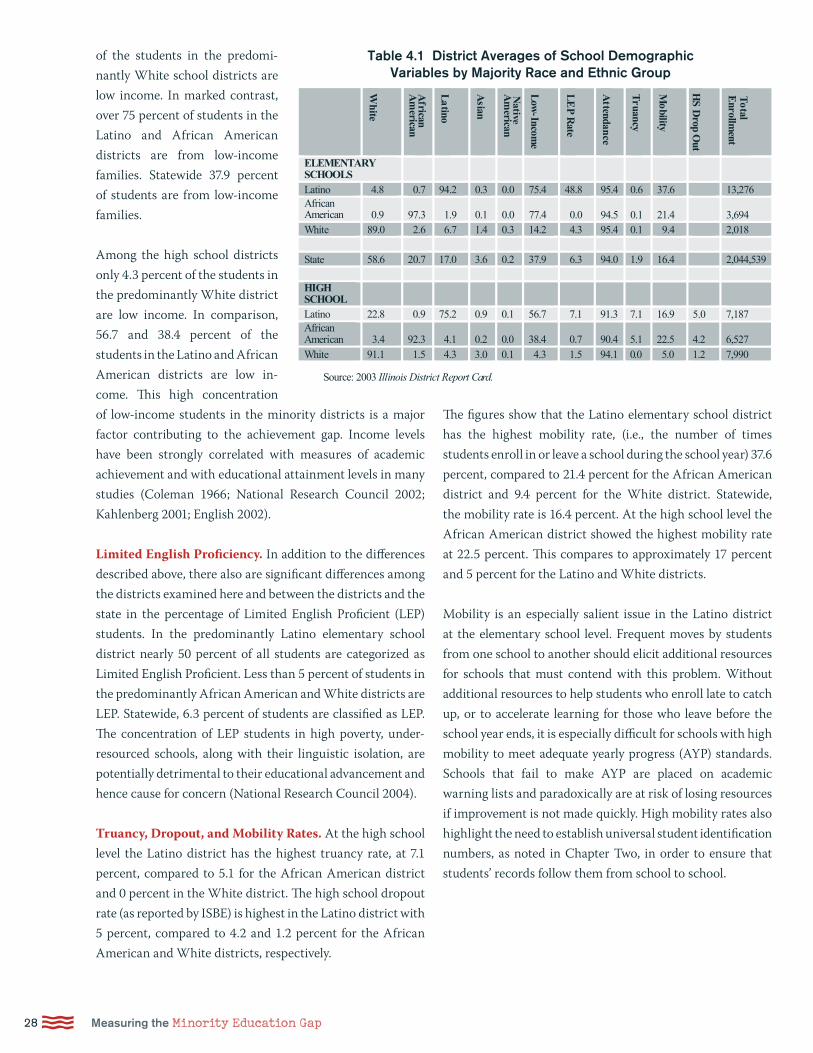
C28 Measuring the Minority Education Gap
of the students in the predomi-nantly White school districts are low income. In marked contrast, over 75 percent of students in the Latino and African American districts are from low-income families. Statewide 37.9 percent of students are from low-income families.
Among the high school districts only 4.3 percent of the students in the predominantly White district are low income. In comparison, 56.7 and 38.4 percent of the students in the Latino and African American districts are low in-come. This high concentration of low-income students in the minority districts is a major factor contributing to the achievement gap. Income levels have been strongly correlated with measures of academic achievement and with educational attainment levels in many studies (Coleman 1966; National Research Council 2002; Kahlenberg 2001; English 2002).
Limited English Proficiency. In addition to the differences described above, there also are significant differences among the districts examined here and between the districts and the state in the percentage of Limited English Proficient (LEP) students. In the predominantly Latino elementary school district nearly 50 percent of all students are categorized as Limited English Proficient. Less than 5 percent of students in the predominantly African American and White districts are LEP. Statewide, 6.3 percent of students are classified as LEP. The concentration of LEP students in high poverty, under-resourced schools, along with their linguistic isolation, are potentially detrimental to their educational advancement and hence cause for concern (National Research Council 2004).
Truancy, Dropout, and Mobility Rates. At the high school level the Latino district has the highest truancy rate, at 7.1 percent, compared to 5.1 for the African American district and 0 percent in the White district. The high school dropout rate (as reported by ISBE) is highest in the Latino district with 5 percent, compared to 4.2 and 1.2 percent for the African American and White districts, respectively.
The figures show that the Latino elementary school district has the highest mobility rate, (i.e., the number of times students enroll in or leave a school during the school year) 37.6 percent, compared to 21.4 percent for the African American district and 9.4 percent for the White district. Statewide, the mobility rate is 16.4 percent. At the high school level the African American district showed the highest mobility rate at 22.5 percent. This compares to approximately 17 percent and 5 percent for the Latino and White districts.
Mobility is an especially salient issue in the Latino district at the elementary school level. Frequent moves by students from one school to another should elicit additional resources for schools that must contend with this problem. Without additional resources to help students who enroll late to catch up, or to accelerate learning for those who leave before the school year ends, it is especially difficult for schools with high mobility to meet adequate yearly progress (AYP) standards. Schools that fail to make AYP are placed on academic warning lists and paradoxically are at risk of losing resources if improvement is not made quickly. High mobility rates also highlight the need to establish universal student identification numbers, as noted in Chapter Two, in order to ensure that students’ records follow them from school to school.
White
African
Am
erican
Latino
Asian
Native
Am
erican
Low
-Income
LE
P Rate
Attendance
Truancy
Mobility
HS
Drop
Out
Total
Enrollm
ent
ELEMENTARY SCHOOLS Latino 4.8 0.7 94.2 0.3 0.0 75.4 48.8 95.4 0.6 37.6 13,276 African American 0.9 97.3 1.9 0.1 0.0 77.4 0.0 94.5 0.1 21.4 3,694 White 89.0 2.6 6.7 1.4 0.3 14.2 4.3 95.4 0.1 9.4 2,018 State 58.6 20.7 17.0 3.6 0.2 37.9 6.3 94.0 1.9 16.4 2,044,539 HIGH SCHOOL Latino 22.8 0.9 75.2 0.9 0.1 56.7 7.1 91.3 7.1 16.9 5 7,187 African American 3.4 92.3 4.1 0.2 0 38.4 0.7 90.4 5.1 22.5 4.2 6,527 White 91.1 1.5 4.3 3 0.1 4.3 1.5 94.1 0 5 1.2 7,990
Source: 2003 Illinois District Report Card.
.0.0
.0 .0
.0
Table 4.1 District Averages of School Demographic Variables by Majority Race and Ethnic Group
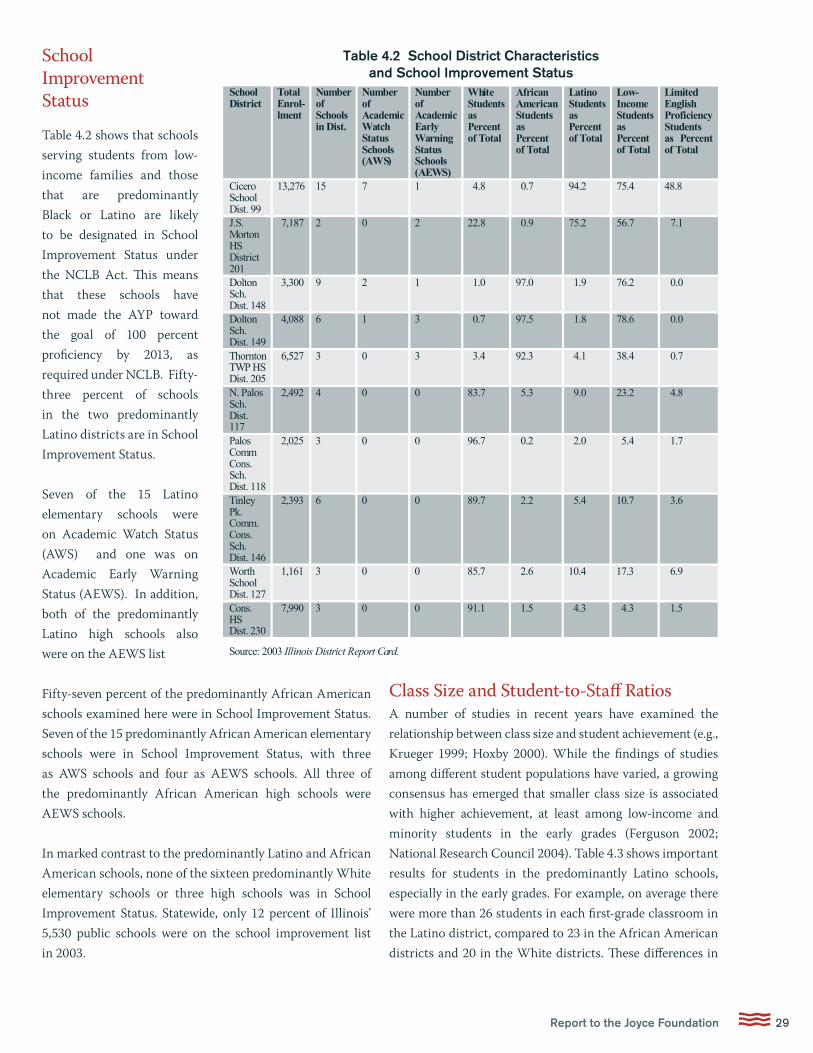
29CReport to the Joyce Foundation
School Improvement Status
Table 4.2 shows that schools serving students from low-income families and those that are predominantly Black or Latino are likely to be designated in School Improvement Status under the NCLB Act. This means that these schools have not made the AYP toward the goal of 100 percent proficiency by 2013, as required under NCLB. Fifty-three percent of schools in the two predominantly Latino districts are in School Improvement Status.
Seven of the 15 Latino elementary schools were on Academic Watch Status (AWS) and one was on Academic Early Warning Status (AEWS). In addition, both of the predominantly Latino high schools also were on the AEWS list
Fifty-seven percent of the predominantly African American schools examined here were in School Improvement Status. Seven of the 15 predominantly African American elementary schools were in School Improvement Status, with three as AWS schools and four as AEWS schools. All three of the predominantly African American high schools were AEWS schools.
In marked contrast to the predominantly Latino and African American schools, none of the sixteen predominantly White elementary schools or three high schools was in School Improvement Status. Statewide, only 12 percent of Illinois’ 5,530 public schools were on the school improvement list in 2003.
Class Size and Student-to-Staff RatiosA number of studies in recent years have examined the relationship between class size and student achievement (e.g., Krueger 1999; Hoxby 2000). While the findings of studies among different student populations have varied, a growing consensus has emerged that smaller class size is associated with higher achievement, at least among low-income and minority students in the early grades (Ferguson 2002; National Research Council 2004). Table 4.3 shows important results for students in the predominantly Latino schools, especially in the early grades. For example, on average there were more than 26 students in each first-grade classroom in the Latino district, compared to 23 in the African American districts and 20 in the White districts. These differences in
School District
Total Enrol-lment
Number of Schools in Dist.
Number of Academic Watch Status Schools (AWS)
Number of Academic Early Warning Status Schools (AEWS)
White Students as Percent of Total
African American Students as Percent of Total
Latino Students as Percent of Total
Low- Income Students as Percent of Total
Limited English Proficiency Students as Percent of Total
Cicero School Dist. 99
13,276 15 7 1 4.8 0.7 94.2 75.4 48.8
J.S. Morton HS District 201
7,187 2 0 2 22.8 0.9 75.2 56.7 7.1
Dolton Sch. Dist. 148
3,300 9 2 1 1.0 97.0 1.9 76.2 0.0
Dolton Sch. Dist. 149
4,088 6 1 3 0.7 97.5 1.8 78.6 0.0
Thornton TWP HS Dist. 205
6,527 3 0 3 3.4 92.3 4.1 38.4 0.7
N. Palos Sch. Dist. 117
2,492 4 0 0 83.7 5.3 9.0 23.2 4.8
Palos Comm Cons. Sch. Dist. 118
2,025 3 0 0 96.7 0.2 2.0 5.4 1.7
Tinley Pk. Comm. Cons. Sch. Dist. 146
2,393 6 0 0 89.7 2.2 5.4 10.7 3.6
Worth School Dist. 127
1,161 3 0 0 85.7 2.6 10.4 17.3 6.9
Cons. HS Dist. 230
7,990 3 0 0 91.1 1.5 4.3 4.3 1.5
Source: 2003 Illinois District Report Card.
Table 4.2 School District Characteristics and School Improvement Status
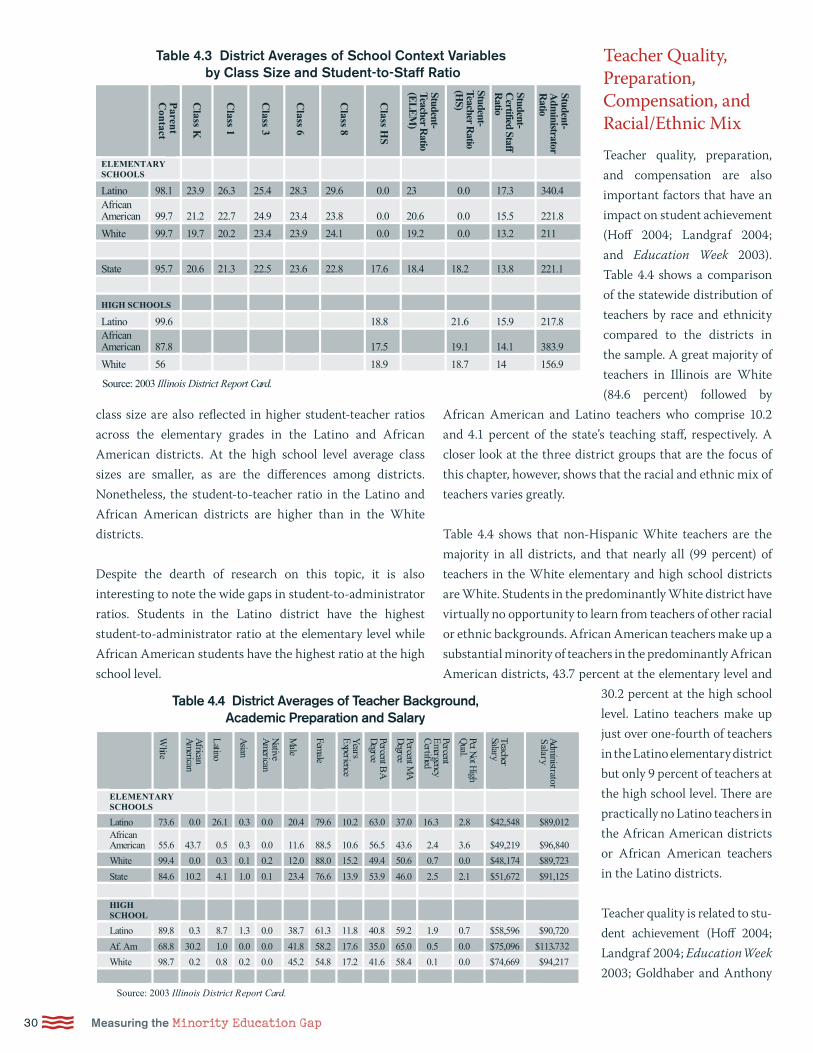
C30 Measuring the Minority Education Gap
class size are also reflected in higher student-teacher ratios across the elementary grades in the Latino and African American districts. At the high school level average class sizes are smaller, as are the differences among districts. Nonetheless, the student-to-teacher ratio in the Latino and African American districts are higher than in the White districts.
Despite the dearth of research on this topic, it is also interesting to note the wide gaps in student-to-administrator ratios. Students in the Latino district have the highest student-to-administrator ratio at the elementary level while African American students have the highest ratio at the high school level.
Teacher Quality, Preparation, Compensation, and Racial/Ethnic MixTeacher quality, preparation, and compensation are also important factors that have an impact on student achievement (Hoff 2004; Landgraf 2004; and Education Week 2003). Table 4.4 shows a comparison of the statewide distribution of teachers by race and ethnicity compared to the districts in the sample. A great majority of teachers in Illinois are White (84.6 percent) followed by
African American and Latino teachers who comprise 10.2 and 4.1 percent of the state’s teaching staff, respectively. A closer look at the three district groups that are the focus of this chapter, however, shows that the racial and ethnic mix of teachers varies greatly.
Table 4.4 shows that non-Hispanic White teachers are the majority in all districts, and that nearly all (99 percent) of teachers in the White elementary and high school districts are White. Students in the predominantly White district have virtually no opportunity to learn from teachers of other racial or ethnic backgrounds. African American teachers make up a substantial minority of teachers in the predominantly African American districts, 43.7 percent at the elementary level and
30.2 percent at the high school level. Latino teachers make up just over one-fourth of teachers in the Latino elementary district but only 9 percent of teachers at the high school level. There are practically no Latino teachers in the African American districts or African American teachers in the Latino districts.
Teacher quality is related to stu-dent achievement (Hoff 2004; Landgraf 2004; Education Week 2003; Goldhaber and Anthony
Parent
Contact
Class K
Class 1
Class 3
Class 6
Class 8
Class H
S
Student-Teacher R
atio(E
LE
M)
Student-Teacher R
atio(H
S)
Student-C
ertified StaffR
atio
Student-A
dministrator
Ratio
ELEMENTARY SCHOOLS
Latino 98.1 23.9 26.3 25.4 28.3 29.6 0.0 23 0.0 17.3 340.4 African American 99.7 21.2 22.7 24.9 23.4 23.8 0.0 20.6 0.0 15.5 221.8
White 99.7 19.7 20.2 23.4 23.9 24.1 0.0 19.2 0.0 13.2 211
State 95.7 20.6 21.3 22.5 23.6 22.8 17.6 18.4 18.2 13.8 221.1
HIGH SCHOOLS
Latino 99.6 18.8 21.6 15.9 217.8 African American 87.8 17.5 19.1 14.1 383.9
White 56 18.9 18.7 14 156.9
Source: 2003 Illinois District Report Card.
Table 4.3 District Averages of School Context Variables by Class Size and Student-to-Staff Ratio
White
African
Am
erican
Latino
Asian
Native
Am
erican
Male
Female
Years
Experience
Percent BA
Degree
Percent MA
D
egree
Percent E
mergency
Certified
Pct Not H
igh Q
ual.
Teacher Salary
Adm
inistratorS
alary
ELEMENTARY SCHOOLS
Latino 73.6 0.0 26.1 0.3 0.0 20.4 79.6 10.2 63.0 37.0 16.3 2.8 $42,548 $89,012 African American 55.6 43.7 0.5 0.3 0.0 11.6 88.5 10.6 56.5 43.6 2.4 3.6 $49,219 $96,840
White 99.4 0.0 0.3 0.1 0.2 12.0 88.0 15.2 49.4 50.6 0.7 0.0 $48,174 $89,723
State 84.6 10.2 4.1 1.0 0.1 23.4 76.6 13.9 53.9 46.0 2.5 2.1 $51,672 $91,125
HIGH SCHOOL
Latino 89.8 0.3 8.7 1.3 0.0 38.7 61.3 11.8 40.8 59.2 1.9 0.7 $58,596 $90,720
Af. Am 68.8 30.2 1.0 0.0 0.0 41.8 58.2 17.6 35.0 65.0 0.5 0.0 $75,096 $113,732
White 98.7 0.2 0.8 0.2 0.0 45.2 54.8 17.2 41.6 58.4 0.1 0.0 $74,669 $94,217
Source: 2003 Illinois District Report Card.
Table 4.4 District Averages of Teacher Background,Academic Preparation and Salary
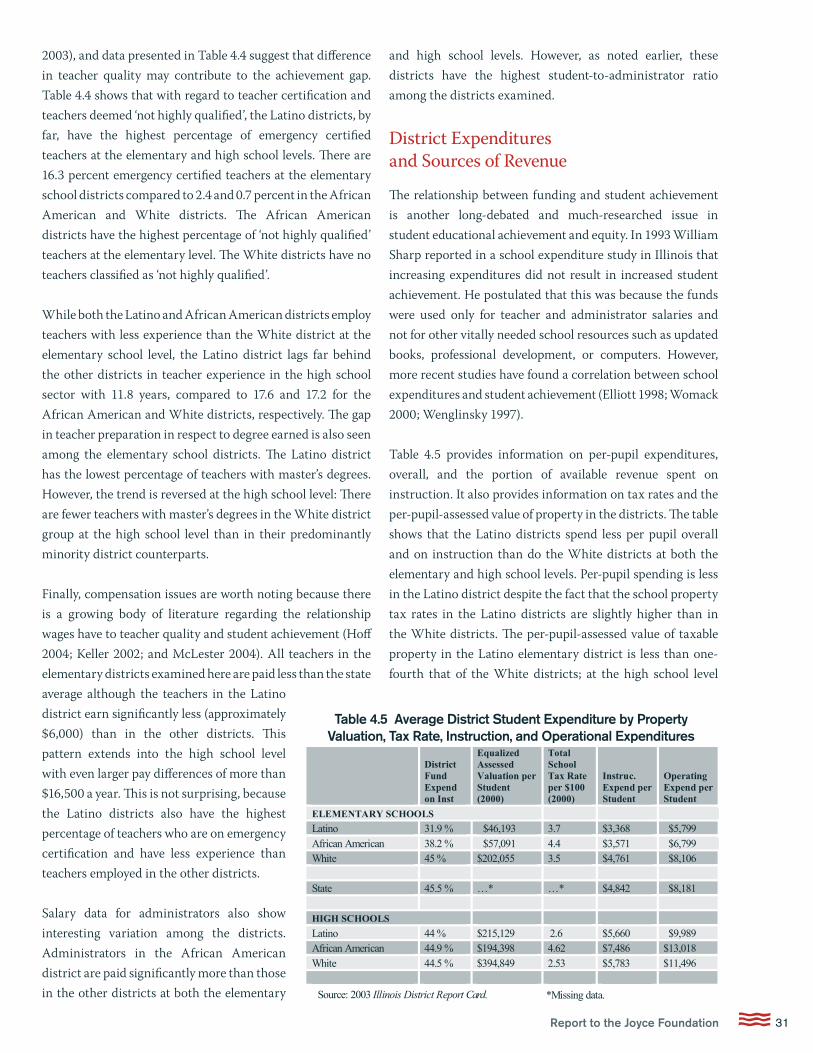
31CReport to the Joyce Foundation
2003), and data presented in Table 4.4 suggest that difference in teacher quality may contribute to the achievement gap. Table 4.4 shows that with regard to teacher certification and teachers deemed ‘not highly qualified’, the Latino districts, by far, have the highest percentage of emergency certified teachers at the elementary and high school levels. There are 16.3 percent emergency certified teachers at the elementary school districts compared to 2.4 and 0.7 percent in the African American and White districts. The African American districts have the highest percentage of ‘not highly qualified’ teachers at the elementary level. The White districts have no teachers classified as ‘not highly qualified’.
While both the Latino and African American districts employ teachers with less experience than the White district at the elementary school level, the Latino district lags far behind the other districts in teacher experience in the high school sector with 11.8 years, compared to 17.6 and 17.2 for the African American and White districts, respectively. The gap in teacher preparation in respect to degree earned is also seen among the elementary school districts. The Latino district has the lowest percentage of teachers with master’s degrees. However, the trend is reversed at the high school level: There are fewer teachers with master’s degrees in the White district group at the high school level than in their predominantly minority district counterparts.
Finally, compensation issues are worth noting because there is a growing body of literature regarding the relationship wages have to teacher quality and student achievement (Hoff 2004; Keller 2002; and McLester 2004). All teachers in the elementary districts examined here are paid less than the state average although the teachers in the Latino district earn significantly less (approximately $6,000) than in the other districts. This pattern extends into the high school level with even larger pay differences of more than $16,500 a year. This is not surprising, because the Latino districts also have the highest percentage of teachers who are on emergency certification and have less experience than teachers employed in the other districts.
Salary data for administrators also show interesting variation among the districts. Administrators in the African American district are paid significantly more than those in the other districts at both the elementary
and high school levels. However, as noted earlier, these districts have the highest student-to-administrator ratio among the districts examined.
District Expenditures and Sources of Revenue
The relationship between funding and student achievement is another long-debated and much-researched issue in student educational achievement and equity. In 1993 William Sharp reported in a school expenditure study in Illinois that increasing expenditures did not result in increased student achievement. He postulated that this was because the funds were used only for teacher and administrator salaries and not for other vitally needed school resources such as updated books, professional development, or computers. However, more recent studies have found a correlation between school expenditures and student achievement (Elliott 1998; Womack 2000; Wenglinsky 1997).
Table 4.5 provides information on per-pupil expenditures, overall, and the portion of available revenue spent on instruction. It also provides information on tax rates and the per-pupil-assessed value of property in the districts. The table shows that the Latino districts spend less per pupil overall and on instruction than do the White districts at both the elementary and high school levels. Per-pupil spending is less in the Latino district despite the fact that the school property tax rates in the Latino districts are slightly higher than in the White districts. The per-pupil-assessed value of taxable property in the Latino elementary district is less than one-fourth that of the White districts; at the high school level
District Fund Expend on Inst
Equalized Assessed Valuation per Student (2000)
Total School Tax Rate per $100 (2000)
Instruc. Expend per Student
Operating Expend per Student
ELEMENTARY SCHOOLS
Latino 31.9 % $46,193 3.7 $3,368 $5,799 African American 38.2 % $57,091 4.4 $3,571 $6,799 White 45 % $202,055 3.5 $4,761 $8,106 State 45.5 % …* …* $4,842 $8,181
HIGH SCHOOLS
Latino 44 % $215,129 2.6 $5,660 $9,989 African American 44.9 % $194,398 4.62 $7,486 $13,018 White 44.5 % $394,849 2.53 $5,783 $11,496
Source: 2003 Illinois District Report Card. *Missing data.
Table 4.5 Average District Student Expenditure by PropertyValuation, Tax Rate, Instruction, and Operational Expenditures
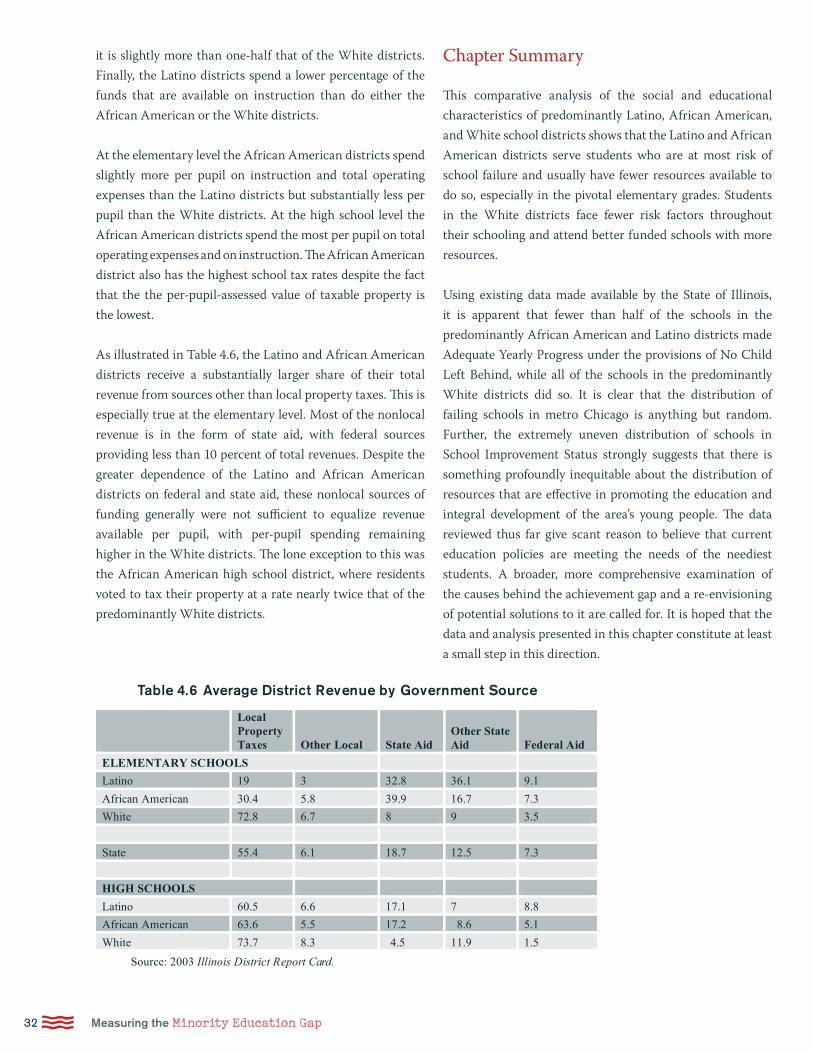
C32 Measuring the Minority Education Gap
it is slightly more than one-half that of the White districts. Finally, the Latino districts spend a lower percentage of the funds that are available on instruction than do either the African American or the White districts.
At the elementary level the African American districts spend slightly more per pupil on instruction and total operating expenses than the Latino districts but substantially less per pupil than the White districts. At the high school level the African American districts spend the most per pupil on total operating expenses and on instruction. The African American district also has the highest school tax rates despite the fact that the the per-pupil-assessed value of taxable property is the lowest.
As illustrated in Table 4.6, the Latino and African American districts receive a substantially larger share of their total revenue from sources other than local property taxes. This is especially true at the elementary level. Most of the nonlocal revenue is in the form of state aid, with federal sources providing less than 10 percent of total revenues. Despite the greater dependence of the Latino and African American districts on federal and state aid, these nonlocal sources of funding generally were not sufficient to equalize revenue available per pupil, with per-pupil spending remaining higher in the White districts. The lone exception to this was the African American high school district, where residents voted to tax their property at a rate nearly twice that of the predominantly White districts.
Chapter Summary
This comparative analysis of the social and educational characteristics of predominantly Latino, African American, and White school districts shows that the Latino and African American districts serve students who are at most risk of school failure and usually have fewer resources available to do so, especially in the pivotal elementary grades. Students in the White districts face fewer risk factors throughout their schooling and attend better funded schools with more resources.
Using existing data made available by the State of Illinois, it is apparent that fewer than half of the schools in the predominantly African American and Latino districts made Adequate Yearly Progress under the provisions of No Child Left Behind, while all of the schools in the predominantly White districts did so. It is clear that the distribution of failing schools in metro Chicago is anything but random. Further, the extremely uneven distribution of schools in School Improvement Status strongly suggests that there is something profoundly inequitable about the distribution of resources that are effective in promoting the education and integral development of the area’s young people. The data reviewed thus far give scant reason to believe that current education policies are meeting the needs of the neediest students. A broader, more comprehensive examination of the causes behind the achievement gap and a re-envisioning of potential solutions to it are called for. It is hoped that the data and analysis presented in this chapter constitute at least a small step in this direction.
Table 4.6 Average District Revenue by Government Source
Local Property Taxes Other Local State Aid
Other State Aid Federal Aid
ELEMENTARY SCHOOLS
Latino 19 3 32.8 36.1 9.1
African American 30.4 5.8 39.9 16.7 7.3
White 72.8 6.7 8 9 3.5
State 55.4 6.1 18.7 12.5 7.3
HIGH SCHOOLS
Latino 60.5 6.6 17.1 7 8.8
African American 63.6 5.5 17.2 8.6 5.1
White 73.7 8.3 4.5 11.9 1.5
Source: 2003 Illinois District Report Card.
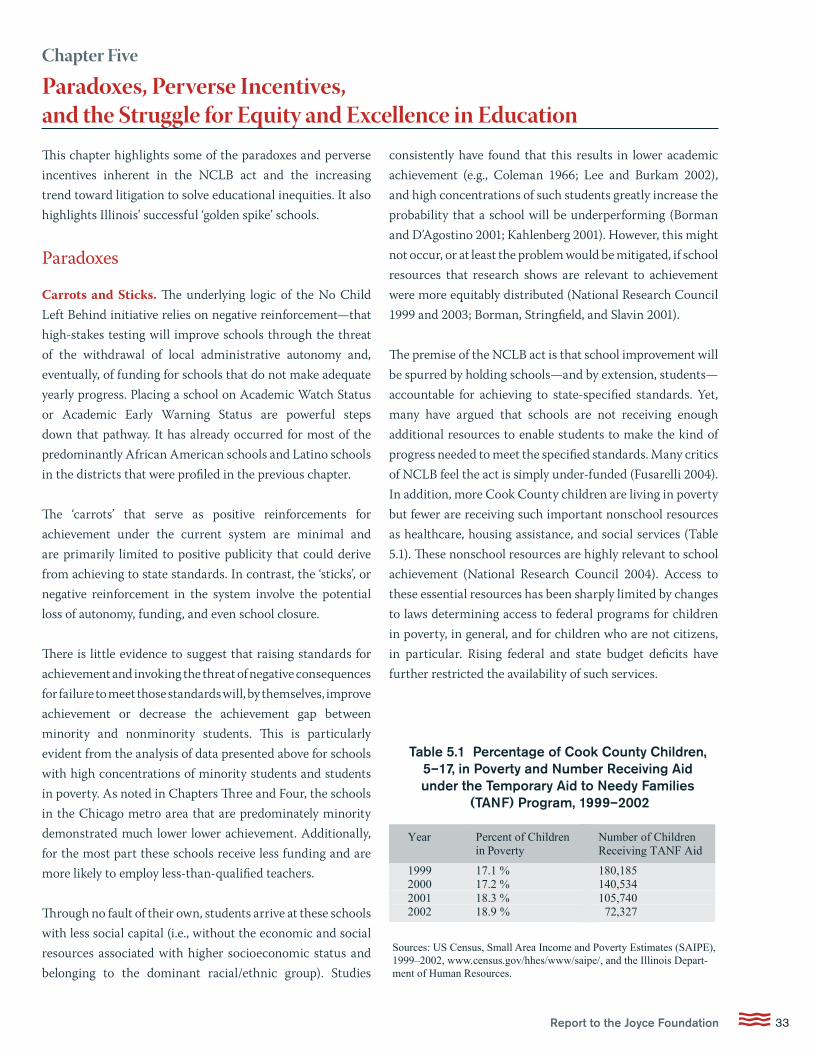
33CReport to the Joyce Foundation
This chapter highlights some of the paradoxes and perverse incentives inherent in the NCLB act and the increasing trend toward litigation to solve educational inequities. It also highlights Illinois’ successful ‘golden spike’ schools.
Paradoxes
Carrots and Sticks. The underlying logic of the No Child Left Behind initiative relies on negative reinforcement—that high-stakes testing will improve schools through the threat of the withdrawal of local administrative autonomy and, eventually, of funding for schools that do not make adequate yearly progress. Placing a school on Academic Watch Status or Academic Early Warning Status are powerful steps down that pathway. It has already occurred for most of the predominantly African American schools and Latino schools in the districts that were profiled in the previous chapter.
The ‘carrots’ that serve as positive reinforcements for achievement under the current system are minimal and are primarily limited to positive publicity that could derive from achieving to state standards. In contrast, the ‘sticks’, or negative reinforcement in the system involve the potential loss of autonomy, funding, and even school closure.
There is little evidence to suggest that raising standards for achievement and invoking the threat of negative consequences for failure to meet those standards will, by themselves, improve achievement or decrease the achievement gap between minority and nonminority students. This is particularly evident from the analysis of data presented above for schools with high concentrations of minority students and students in poverty. As noted in Chapters Three and Four, the schools in the Chicago metro area that are predominately minority demonstrated much lower lower achievement. Additionally, for the most part these schools receive less funding and are more likely to employ less-than-qualified teachers.
Through no fault of their own, students arrive at these schools with less social capital (i.e., without the economic and social resources associated with higher socioeconomic status and belonging to the dominant racial/ethnic group). Studies
consistently have found that this results in lower academic achievement (e.g., Coleman 1966; Lee and Burkam 2002), and high concentrations of such students greatly increase the probability that a school will be underperforming (Borman and D’Agostino 2001; Kahlenberg 2001). However, this might not occur, or at least the problem would be mitigated, if school resources that research shows are relevant to achievement were more equitably distributed (National Research Council 1999 and 2003; Borman, Stringfield, and Slavin 2001).
The premise of the NCLB act is that school improvement will be spurred by holding schools—and by extension, students—accountable for achieving to state-specified standards. Yet, many have argued that schools are not receiving enough additional resources to enable students to make the kind of progress needed to meet the specified standards. Many critics of NCLB feel the act is simply under-funded (Fusarelli 2004). In addition, more Cook County children are living in poverty but fewer are receiving such important nonschool resources as healthcare, housing assistance, and social services (Table 5.1). These nonschool resources are highly relevant to school achievement (National Research Council 2004). Access to these essential resources has been sharply limited by changes to laws determining access to federal programs for children in poverty, in general, and for children who are not citizens, in particular. Rising federal and state budget deficits have further restricted the availability of such services.
Chapter Five
Paradoxes, Perverse Incentives, and the Struggle for Equity and Excellence in Education
Year Percent of Children in Poverty
Number of Children Receiving TANF Aid
1999 17.1 % 180,185 2000 17.2 % 140,534 2001 18.3 % 105,740 2002 18.9 % 72,327
Sources: US Census, Small Area Income and Poverty Estimates (SAIPE), 1999–2002, www.census.gov/hhes/www/saipe/, and the Illinois Depart-ment of Human Resources.
Table 5.1 Percentage of Cook County Children, 5–17, in Poverty and Number Receiving Aid under the Temporary Aid to Needy Families
(TANF) Program, 1999–2002
C34 Measuring the Minority Education Gap
Testing and Boosting Student Achievement. Testing can play an important role in informing teachers, students, and parents whether specified learning objectives are being achieved. However, high-stakes testing that functions to stigmatize schools that serve the neediest students as underachieving and that eventually could result in the loss of resources for those schools is unlikely to boost student achievement. In contrast, schools that use testing to evaluate the quality of instruction and to provide diagnostic information to make it better are more likely improve learning outcomes for their students (McGee 2003). Information derived from formative assessments also can be used to monitor individual student progress and to indicate in what areas students need extra support. Developing a data system that allows teachers to evaluate the progress and diagnose the needs of individual students as they move from school to school would be especially useful (see recommendations in Chapter 2 and Chapter 6).
Perverse Incentives
An over-reliance on standardized tests can create perverse incentives to engage in a variety of practices that are unrelated to improving students’ mastery of the subject matter. These include teaching to the test and unscrupulous manipulations of data (Rau et al. 2001; Curriculum Review 2001; Jacob and Levitt 2003).
Standardized tests place an emphasis on teacher-directed drills, which emphasize rote learning over efforts to improve students’ ability to apply knowledge in problem solving in a variety of school and community based contexts (National Research Council 2000; Kornhaber 2004). This may be particularly detrimental to minority students in poor schools, where helping students to see the relevance of school-based learning to their lives and their futures is particularly important (National Research Council 2004). In many schools class time that might otherwise have been devoted to academic content is instead spent on developing test-taking skills to improve scores on specific high-stakes tests (Kornhaber 2004).
Another dysfunctional result of the current system’s emphasis on high-stakes testing is increased incentives to cheat. Well-documented cases of cheating occurred in Texas and New York in 1999 and similar occurrences have been
found in California, Massachusetts, and Nevada (Jacob and Levitt 2003; School Law News 2000; Teacher Magazine 2000; Hurst 2004; and Labi et al. 1999). In one widely publicized case, a school in Lake Forest, Illinois, was found cheating on standardized tests (Toch and Wagner 1992). In 2003 another study estimated that between 4 to 5 percent of teachers in Chicago public schools have cheated on standardized tests (Jacob and Levitt 2003; McLure 2003).
Some schools have learned that children who have been retained in grade (held back) tend to test higher on the same curriculum the second time around (Woods 2004). However, students who have been held back are at a higher risk of dropping out (Alexander et al. 2001; Coeyman 1999; Brooks-Gunn et al. 1993; Eide and Showalter 1999; Egemba and Crawford 2003). If low-scoring students drop out of school, their poor performance will no longer drag down the average score for the school. By placing far more emphasis on test scores than on graduation rates, NCLB creates incentives that may encourage schools to ‘push-out’ their weakest students. Again, the current system creates perverse incentives for schools to take actions that appear to boost their success under NCLB-inspired accountability systems but that do not lead to better outcomes for those students with the greatest needs.
Dealing with truancy is another example of how current education policy can create perverse incentives. Rau et al. pointed out that in 2001 the Chicago School Reform Board allowed high schools to expel 16-year-old students with 40 or more unexcused absences, a de facto expulsion policy, and to withhold promotion for those with 20 or more absences. In addition, it appears that some schools used the policy as a pretext to also expel ‘20-day’ students as a means to improve their standardized test scores (Rau et al. 2001).
While there is no evidence that the schools examined in this study engage in these types of activities, it behooves all Illinois educators, administrators, and policymakers to take note and guard against such practices.
An over-reliance on standardized tests can create perverse incentives.
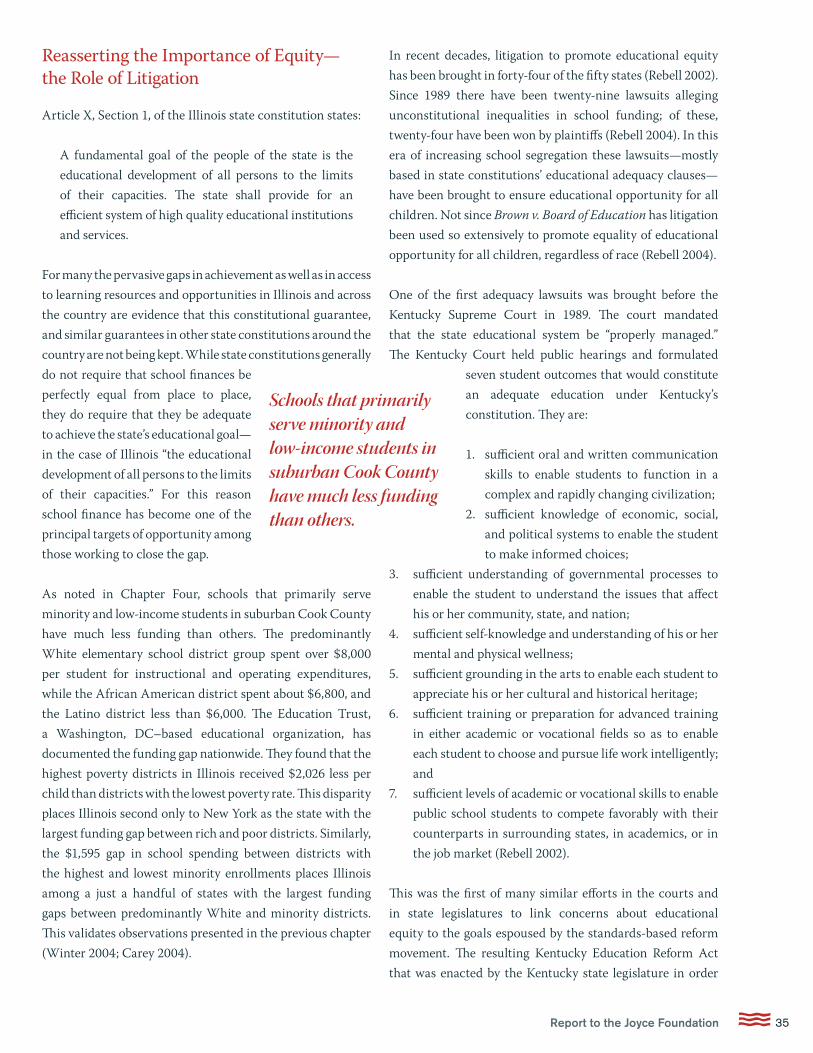
35CReport to the Joyce Foundation
Reasserting the Importance of Equity— the Role of Litigation
Article X, Section 1, of the Illinois state constitution states:
A fundamental goal of the people of the state is the educational development of all persons to the limits of their capacities. The state shall provide for an efficient system of high quality educational institutions and services.
For many the pervasive gaps in achievement as well as in access to learning resources and opportunities in Illinois and across the country are evidence that this constitutional guarantee, and similar guarantees in other state constitutions around the country are not being kept. While state constitutions generally do not require that school finances be perfectly equal from place to place, they do require that they be adequate to achieve the state’s educational goal—in the case of Illinois “the educational development of all persons to the limits of their capacities.” For this reason school finance has become one of the principal targets of opportunity among those working to close the gap.
As noted in Chapter Four, schools that primarily serve minority and low-income students in suburban Cook County have much less funding than others. The predominantly White elementary school district group spent over $8,000 per student for instructional and operating expenditures, while the African American district spent about $6,800, and the Latino district less than $6,000. The Education Trust, a Washington, DC–based educational organization, has documented the funding gap nationwide. They found that the highest poverty districts in Illinois received $2,026 less per child than districts with the lowest poverty rate. This disparity places Illinois second only to New York as the state with the largest funding gap between rich and poor districts. Similarly, the $1,595 gap in school spending between districts with the highest and lowest minority enrollments places Illinois among a just a handful of states with the largest funding gaps between predominantly White and minority districts. This validates observations presented in the previous chapter (Winter 2004; Carey 2004).
In recent decades, litigation to promote educational equity has been brought in forty-four of the fifty states (Rebell 2002). Since 1989 there have been twenty-nine lawsuits alleging unconstitutional inequalities in school funding; of these, twenty-four have been won by plaintiffs (Rebell 2004). In this era of increasing school segregation these lawsuits—mostly based in state constitutions’ educational adequacy clauses—have been brought to ensure educational opportunity for all children. Not since Brown v. Board of Education has litigation been used so extensively to promote equality of educational opportunity for all children, regardless of race (Rebell 2004).
One of the first adequacy lawsuits was brought before the Kentucky Supreme Court in 1989. The court mandated that the state educational system be “properly managed.” The Kentucky Court held public hearings and formulated
seven student outcomes that would constitute an adequate education under Kentucky’s constitution. They are:
1. sufficient oral and written communication skills to enable students to function in a complex and rapidly changing civilization;
2. sufficient knowledge of economic, social, and political systems to enable the student to make informed choices;
3. sufficient understanding of governmental processes to enable the student to understand the issues that affect his or her community, state, and nation;
4. sufficient self-knowledge and understanding of his or her mental and physical wellness;
5. sufficient grounding in the arts to enable each student to appreciate his or her cultural and historical heritage;
6. sufficient training or preparation for advanced training in either academic or vocational fields so as to enable each student to choose and pursue life work intelligently; and
7. sufficient levels of academic or vocational skills to enable public school students to compete favorably with their counterparts in surrounding states, in academics, or in the job market (Rebell 2002).
This was the first of many similar efforts in the courts and in state legislatures to link concerns about educational equity to the goals espoused by the standards-based reform movement. The resulting Kentucky Education Reform Act that was enacted by the Kentucky state legislature in order
Schools that primarily serve minority and low-income students in suburban Cook County have much less funding than others.
C36 Measuring the Minority Education Gap
to comply with the court order has become a national model of standard-based reform. The Kentucky model, although by no means a panacea, is more balanced than most because of its emphasis on both standards and the adequacy of learning resources (Rebell 2002).
New Jersey Supreme Court decisions over the past decade have led to the institution of higher curriculum standards that are supported by increased resources for preschool programs, increased school construction, and other resources (Rebell 2004). In Texas litigation that focused on inequalities in the school finance system created a ‘Robin Hood’ finance system where the property taxes of richer districts were used to subsidize poorer ones. This Robin Hood system was recently deemed unconstitutional on the grounds that the entire $30 billion state education budget is failing to provide an “adequate suitable education as required by the Texas Constitution” (Stutz 2004). The judge in this most recent Texas suit noted that:
The key to changing our future is to close the gap in academic achievement between the haves and the have-nots…the rub is the cost of closing the gap needed to improve instruction for those students (Stutz 2004).
State courts have proven to be an important venue for pursuing educational policies that emphasize the adequacy of resources needed to achieve to standards. Time will tell whether states that have taken steps to promote a more equitable and adequate distribution of educational resources are more successful in closing achievement gaps.
‘Golden Spike’ Schools
In their recent book Bridging the Achievement Gap J. E. Chubb and T. Loveless (2002) highlight various prominent studies that show how schools and districts have enhanced the academic achievement of poor and minority students by focusing on core academic skills, reducing class sizes, introducing more challenging curricula, and offering vouchers in urban school districts. Others too have made a strong case for standards-based curricula, high-stakes testing, and the expansion of voucher and charter school programs as key strategies for closing the achievement gap (Thernstrom and Thernstrom 2003; Wong 2003). Nonetheless, many of these well-intentioned observers miss the point by often faulting ethnic and cultural factors as barriers for Latino and African American student achievement.
Indeed, Mica Pollock (2001) argues that part of the problem with the racial achievement gap is that principal players (i.e., teachers, administrators, researchers, etc.) are either too reluctant to speak out publicly and discuss this issue in meaningful ways or are too quick to put forth a cultural deficit explanation for disparate achievement across race. Public discussions about the racial achievement gap often end up suppressing the very question that is of most interest (Pollock 2001).
We, the authors of this report, acknowledge that not all the news is negative. There are success stories of schools and districts that have stared the achievement gap in the face and prevailed. Some of these success stories have served as blueprints for other schools and districts around the country.
In 1997 Vermont passed a sweeping Equal Educational Opportunity Act that established a uniform statewide property tax and a per-pupil block grant for every district. As a result of this act the achievement gap of fourth graders in poor and wealthy districts has decreased (Rebell and Metzler 2002).
Illinois is second only to New York as the state with the largest funding gap between rich and poor districts.

37CReport to the Joyce Foundation
Despite the deep chasm in the achievement gap between Whites and minorities in Illinois, there have been some public schools that have managed to narrow the gap. In Illinois such schools are called ‘golden spike’ schools and they have shown distinct commonalities in leadership, literacy, personnel, community engagement, and other characteristics that contribute to their success (McGee 2003).
Glenn McGee from Northern Illinois University studied these high poverty, high performing schools in Illinois. He found that the common characteristics of these schools were:
• having exemplary principals who are leaders of learning, who are resourceful, who craft a culture of high standards and high expectations, and who model leadership daily;
• employing a hard-working, devoted staff who have the highest expectations and demand excellence;
• implementing policies, programs, and services to include parents in the school and to educate parents in both parenting and academic skills;
• providing access to good nutrition and health care and ensuring that schools are safe and secure;
• funding school-wide professional development on school improvement planning;
• sharing local and state assessment data and using those data to improve teaching and learning;
• holding frequent celebrations and ceremonies;• having strong connection to early childhood programs;• instituting early literacy practices and programs that
focus on prevention and early intervention, including access to books in the classroom and formal recognition of reading progress as top priorities;
• providing ready access to a host of after-school, before-school, and Saturday programs;
• ensuring that most students attend summer school;• using technology to enhance learning and as a tool for
analyzing and charting data;• focusing school improvement plans on a small number of
improvement initiatives that are embraced, supported, and sustained by the entire school community (McGee 2003).
C38 Measuring the Minority Education Gap
Chapter One provides the demographic context of the educational system in Illinois. The chapter points out that Latinos are a very fast-growing and youthful population and that African Americans also have a high fertility rate. The state, and in particular the greater Chicago metro area, cannot afford to ignore this fast-growing future labor force. Unfortunately, there is no evidence that the educational achievement gap between these two populations and Whites is decreasing. The chapter cites standardized tests as the primary measures of the achievement gap in Illinois—particularly the Illinois Standards Achievement Test (ISAT), the Prairie States Achievement Examination (PSAE), and the National Assessment of Education Progress (NAEP).
Chapter Two details eleven recommendations that would enable Illinois to not only meet but to exceed NCLB data reporting requirements. The chapter stresses that an important first step is to have a comprehensive and holistic data system. While the current data system meets the minimum requirements of the NCLB act, it can be expanded to provide more data that would provide beneficial information to policymakers and also be used in formative evaluation by the schools. The recommendations are to:
1. Provide enrollment figures by county.2. Provide enrollments by grade level and ethnicity.3. Post enrollments in core courses for eleventh and
twelfth graders.4. Post dropout rates by grades for each current year.5. Derive eventual dropout rates for new freshmen
from grade-specific dropout rates that span the same time period as the academic life of the cohort under observation.
6. Advocate for the implementation of a universal student identifier system for all public school students.
7. Collect and post completion rates of college preparation courses among high school graduates.
8. Report the percentage of high school graduates who attain ACT composite scores above strategic cut-off points for admission to the University of Illinois.
9. Consider reporting SAT outcomes for high school graduates.
10. Petition Illinois’ institutions of higher education to produce school-specific reports on the college-going rates for recent graduates from Illinois public high schools and college performance during their freshman year.
11. Develop a student information system that permits users to retrieve data via a query system and select the level of observation, the topic of interest, the year, and subgroup totals. The query system should also offer users the option of downloading their queried tables into text files or spreadsheet files.
In Chapter Three ISAT data are examined to identify the magnitude and dimensions of the achievement gaps in the ten school districts studied. This chapter documents the existence and racial aspects of the achievement gap in the
greater Chicago metro area. We found that the White districts consistently had higher reading and math scores at the elementary school level than did the minority districts. Even low-income students in the White districts scored higher than their counterparts in the Latino and African American districts. At the high school level the disparities continue with regard to math, reading, and writing scores. While
Latinos met the achievement goal in writing and African Americans met the goal in writing and reading, their White counterparts outscored both Latinos and African Americans in all three categories. The White students in the Latino and African American districts outscored their classmates in those districts. The White students in the White districts outscored their White counterparts in the minority districts by a considerable margin. Latino and African American students in the White districts outscored their counterparts in the minority districts as well.
Chapter Four continues this discussion by looking more closely at other characteristics and finds that students in the Latino and African American districts faced more poverty, language isolation, higher truancy and mobility rates, less qualified teachers, and a lower tax base from which to fund their schools. This is particularly evident at the elementary
Chapter Six
Summary and Recommendations
Closing the achievement gap is key to greater racial and ethnic equality in general.
39CReport to the Joyce Foundation
school level. The schools in the Latino district, despite acute needs related to the high percentage of limited English proficiency students, spend less on instruction and operating expenditures than all the other districts examined. In part this is due to the low tax base in the Latino districts. While the Latino and African American districts tax themselves at higher rates, they usually have less money to support their schools because their property has lower value. The White districts have a 4 to 1 advantage in the valuation of property and though they tax themselves at a lower rate, they have more money available to fund their school districts. This is evident in their higher expenditures per pupil in comparison to the Latino and African American elementary school districts and to Latinos in the high school districts.
Chapter Five identifies some of the paradoxes and perverse incentives inherent in the NCLB act, and the increasing trend toward litigation to solve educational inequities. It also highlights common characteristics of Illinois’ successful ‘golden spike’ schools.
Implications
The long-term effects of the achievement gap on educational attainment and opportunities for minority and disadvantaged students are unrelenting, and thus the issue continues to draw the attention of policymakers and researchers. The achievement gap severely tilts the playing field for students, creating far different opportunities for success in school, for completing school, for succeeding in higher education, and for ultimately leading a productive life (McGee 2003). The racial/ethnic gap in high school achievement limits the college, career, and life choices of many Latino and African American students. It fosters divisions in and out of schools, weakens the economy, and ultimately exacerbates our nation’s poverty- and crime-related problems (Wing 2004).
The data presented here documenting the achievement gap serve as an uneasy reminder of the current state of public education in urban settings, forcing us to take notice and to act. Policymakers have reason to be concerned about the educational progress of the growing number of minority school-age children in Illinois. It is these children who will become the new work force in our increasingly technological society. How will these children succeed and become productive citizens if they do not receive the education necessary for taking their place in society? Policymakers and
the residents of Illinois must work to assure that this growing segment in the population gets a solid education.
One would venture to say that the new NCLB policy has changed everything. Before NCLB achievement data were much harder to find and generally were not disaggregated. Since the implementation of NCLB each state and district is required to publish school-level test data disaggregated by race, making it next to impossible for this issue to be ignored any longer, especially within highly scrutinized urban educational systems like those in the Chicago metro area.
Despite the improved access to data, some argue that the Illinois’ racial achievement gap has not diminished—in part because of neglect by policymakers and in part because minority and low-income student achievement is still not an explicit priority (McGee 2003). It is much easier to measure inequality in achievement with standardized tests than to implement reforms that are adequate to the task of improving outcomes for the neediest students.
Any policy or programmatic effort aimed at the issue of the achievement gap in Illinois must acknowledge that closing the achievement gap is key to achieving greater racial and ethnic equality in general (Jencks and Phillips 1998). Further, educators and policymakers must sincerely agree with the basic premise that all students have a fundamental right to a quality public education that enables them to graduate from high school prepared to become active and productive citizens, eligible for four-year universities, and eager for meaningful work opportunities (IDEA 2004).
The list of characteristics of ‘golden spike’ schools examined in Chapter Five points to the fact that there is no one magic solution that will alleviate all the problems facing the Illinois school system. A holistic approach is key to developing a model to narrow the gap. Important activities range from using technology to inform instructional and curriculum change to holding frequent ceremonies. Improving health care, strong connections to early childhood programs, strong leadership, community building, professional development for teachers, and involving the family are but a few more examples of successful activities in ‘golden spike’ schools. All of these activities and the others listed in Chapter Five must be implemented in order to holistically improve the education of minority students in metro Chicago.
C40 Measuring the Minority Education Gap
So the challenge for Illinois, as for the nation, is how to achieve the twin goals of educational excellence and equity. In addition to focusing on school-specific issues, we need to find innovative ways to address the out-of-school challenges facing low-income and minority students. No strategy to significantly close the achievement gap can be expected to succeed without addressing issues in the broader community that affect the family.
Given the deep roots of educational inequities in the United States in general and in Illinois in particular, achieving equality of access to educational resources for students in predominantly minority, low-income districts, though a step
forward, would not be enough. To overcome entrenched inequalities, students in disadvantaged schools will need ‘more than equal’ resources to overcome the effects of poverty as well as race- and ethnic-related inequalities. However, with additional resources comes the need for additional accountability. There must be reason to believe that additional resources will be used wisely and will make a difference. Continued policy research is an important component of accountability. To this end, an improved data system is needed to provide essential information about individual students and about the effectiveness of instruction. We offer the following list of policy recommendations to guide thinking and efforts as we move forward to face this challenge.
41CReport to the Joyce Foundation
Policy Recommendations
more information about school funding, teacher quality, and other information of concern to families and communities.
• Focusing on schools is not enough: We need smart investment in families and communities.
• Refocus policy research to examine how schools, families, and communities can work together to promote the integral development of young people.
• Invest wisely, make the money matter. While money by itself is no panacea, short-changing the schools that serve the neediest children is a sure recipe for failure. Funding that is both equitable and adequate and appropriately directed is an essential step towards success.
Overcoming the deep and pervasive achievement gap in education poses a challenge that will require the implementation of policies and practices that go beyond those that are currently in place. The challenge will be met not just by directing more attention to the achievement gap but through effective action to address the broad range of factors associated with race, ethnicity, and class that produce disparate patterns of access to learning opportunities and resources. While more research surely is needed, lack of knowledge of what to do may not be the main problem. Knowledge is power—but only if there is the will to use it.
• Acknowledge that the achievement gap is not only harmful to poor and minority students but also directly affects the existing and future economy and welfare of the entire state.
• Develop strategies to dismantle the pervasive segregation of Chicago-area students by race, ethnicity, and class.
• Change the manner in which resources are allocated such that schools serving those with the greatest needs receive enough of the kinds of resources that will make a difference.
• Conduct research into curricula and teaching methods to identify the approaches that work best to convince students that their schooling is relevant to their life chances.
• Learn from the successes of effective schools, such as the ‘golden spike’ schools, and apply those lessons to inform how best to use resources in support of the integral growth and development of our young people.
• Ensure that the ISAT and PSAE or other tests that may be administered in the future truly reflect the curriculum taught in the schools.
• De-emphasize the current punitive high-stakes approach to testing and replace it with a diagnostic approach in which test data are primarily used to enable teachers to monitor each student’s progress and adapt instruction to his or her individual learning strengths and weaknesses.
• Improve the student data system by implementing the eleven recommendations in Chapter Two.
• Disseminate a balanced set of information about achievement and equality of access to learning resources so as to increase the involvement of parents and other interested parties as active stakeholders in the educational process. For example, expand the School Report Cards currently available to the public to include

C42 Measuring the Minority Education Gap
43CReport to the Joyce Foundation
References
Alexander, Karl, et al. 2001. “The Dropout Process in Life Course Perspective: Early Risk Factors at Home and School.” Teachers College Record 103 (5): 760–822.
American Community Survey. 2003. http://www.census.gov/acs/www/index.html.
Archibald, G. 2004. “‘Achievement Gap’ Hurting US Educational Standing.” Washington Times, September 14, 2001. http://washingtontimes.com/national/20040913-111542-6476r.htm.
Bainbridge, W., and T. Lasley, 2002. “Demographics, Diversity, and K–12 Accountability: The Challenge of Closing the Achievement Gap.” Education and Urban Society 34 (4): 422–37.
Berlak, Howard. 2001. “Race and the Achievement Gap.” Rethinking Schools 15 (4, summer). www.rethinkingschools.org/archive/15_04/Race154.shtml.
Blagojevich, Rod. 2004a. “Illinois State of the State Address.” January 15. http://www.illinois.gov/Gov/pdfdocs/2004sosspeech.pdf (accessed June 30, 2004).
———. 2004b. “Illinois’ Children Deserve Better Education.” Chicago Sun-Times, editorial, January 25, 34.
Borman, Geoffrey D., and Jerome V. D’Agostino. 2001. “Title I and Student Achievement: A Quantitative Synthesis.” In Borman, Stringfield, and Slavin, eds., 25–58.
Borman, Geoffrey D., Samuel C. Stringfield, and Robert E. Slavin, eds. 2001. Title I: Compensatory Education at the Crossroads. Mahwah, NJ: Lawrence Erlbaum Associates.
Bracey, Gerald W. 2003. “April Foolishness: The 20th Anniversary of ‘A Nation at Risk’.” Phi Delta Kappan 24 (8): 616–21.
Brooks-Gunn, Jeanne, et al. 1993. “Who Drops out of and Who Continues beyond High School? A 20-Year Followup of Black Urban Youth.” Journal of Research on Adolescence 3 (3): 271.
Brooks-Gunn, Jeanne, Greg J. Duncan, and Nancy Meritato. 1997. “Poor Families, Poor Outcomes: The Well-Being of Children and Youth.” In Greg. J. Duncan and Jeanne Brooks-Gunn, eds., Consequences of Growing up Poor. New York: Russell Sage Foundation.
Carey, Kevin. 2004. The Funding Gap 2004: Many States Still Shortchange Low-Income and Minority Students. A report of the Education Trust, Washington, DC. http://www2.edtrust.org/NR/rdonlyres/30B3C1B3-3DA6-4809-AFB9-2DAACF11CF88/0/funding2004.pdf
Chicago Public Schools. 2004. Chicago Public Schools Education Plan: Key Accomplishments. http://edplan.cps.k12.il.us/accomplishments.html (accessed June 30, 2004).
Chubb, J. E., and T. Loveless. 2002. Bridging the Achievement Gap. Washington, DC: Brookings Institution Press.
Coeyman, Marjorie. 1999. “Repeating a Grade Gains Favor in Schools.” Christian Science Monitor 91 (90): 15.
Coleman, James, et al. 1966. Equality of Educational Opportunity. Washington DC: US Government Printing Office.
C44 Measuring the Minority Education Gap
Congress of the United States. 1965. De Facto School Segregation: Hearings before a Special Subcommittee on Investigation of De Facto Racial Segregation in Chicago Public Schools. Washington, DC, July 27–28. ERIC document #ED029077.
Cook, Junerous. 1965. Public School Segregation: City of Chicago, 1963–64 and 1964–65. Chicago Urban League, IL. ERIC document #ED002075.
Curriculum Review. 2001. “What They’re Saying: Why Some Schools Cheat on Standardized Tests.” Curriculum Review 41 (2): 3.
Department of Public Health. 2003. Vital Statistics Illinois, 1999. Illinois Center for Health Statistics. www.iph.state.il.us/pdf/1999 percent20vital percent20statistics percent20Illinois.pdf.
ECS (Education Commission of the States). 1997. Investing in Student Achievement. Report number BBB00544. Denver, CO.: Education Commission of the States.
———. 2004. Closing the Achievement Gap; Quick Facts. www.ecs.org/html/issueSection.asp?print=true&issueID=194&subIssueID=0&s=Quick+Facts.
Education Week. 2003. “To Close the Gap, Quality Counts.” http://counts.edweek.org/sreports/qc03/templates/article.cfm?slug=17exec.h22.
———. “Quality Counts 2004: Illinois Report Card.” www.edweek.org/ (accessed June 30, 2004).
Egemba, Maria, and James Crawford. 2003. “An Analysis of Hispanic Students’ Dropout Rates.” ERIC document #ED477542.
Eide, Eric, and Mark Showalter. 1999. “The Effect of Grade Retention on Educational and Labor Market Outcomes.” ERIC document #ED435133.
Elliott, Marta. 1998. “School Finance and Opportunities to Learn: Does Money Well Spent Enhance Students’ Achievement?” Sociology of Education 71 (3): 223–45.
English, F. 2002. “On the Intractability of the Achievement Gap in Urban Schools and the Discursive Practice of Continuing Racial Discrimination.” Education and Urban Society 34 (3, May): 298–311.
Federation for American Immigration Reform. Immigration Issue Centers: Illegal Immigration: Employer Sanctions. www.fairus.org/ImmigrationIssueCenters/ImmigrationIssueCenters.cfm?ID=1188&c=13.
Ferguson, Ron. 2002. “Why Racial Integration and Other Policies since Brown v. Board of Education Have Only Partially Succeeded in Narrowing the Achievement Gap.” In T. Ready, C. Edley Jr., and C. Snow, eds., Achieving High Educational Standards for All. National Research Council Washington, DC: National Academies Press.
Fox, Roger, and Deborah Haines. 1978. “Where Blacks Live: Race and Residence in Chicago in the 1970s.” ERIC document #ED186506.
Frankenberg, E., C. Lee, and G. Orfield. 2003. A Multiracial Society with Segregated Schools: Are We Losing the Dream? Cambridge, MA: The Civil Rights Project at Harvard University.
45CReport to the Joyce Foundation
Fusarelli, Lance. 2004. “The Potential Impact of the No Child Left Behind Act on Equity and Diversity in American Education.” Educational Policy 18 (1): 71–94.
Galarza, Ernesto. 1964. Merchants of Labor, the Mexican Bracero Story: An Account of the Managed Migration of Mexican Farm Workers in California, 1942–1960. San José, CA: Rosicrucian Press.
Goldhaber, D., and E. Anthony. 2003. “Teacher Quality and Student Achievement.” Urban Diversity Series, Report #UDS-115.
Greenspan, A. 2000. “Alan Greenspan Delivers Remarks before the National Community Reinvestment Coalition.” FDCH Political Transcripts, March 22. AN: 103677110165.
Haycock, K., C. Jerald, and S. Huang. 2001. “Closing the Gap: Done in a Decade.” Thinking K–16 2 (spring): 3–21.
Hayes, Matt. 2003. “INS Fails to Enforce Employer Sanctions.” University of California Agricultural Personnel Management Program. http://are.berkeley.edu/APMP/pubs/i9news/sanctions010903.html.
Hoff, David. 2004. “Governors Study Teacher Quality.” Education Week 23 (37): 24.
Hoxby, C.M. 2000. “The Effects of Class Size on Student Achievement: New Evidence from Population Variation.” Quarterly Journal of Economics 1239–85.
Hurst, Marianne. 2004. “Nevada Report Reveals Spike in Test Irregularities.” Education Week 24 (6): 19.
IDEA (Institute for Democracy, Education, and Access). 2004. http://www.idea.gseis.ucla.edu/index.html.
ISBE (Illinois State Board of Education). 2003a. Interactive Illinois Report Card. http://iirc.niu.edu/ (accessed June 30, 2004).
———. 2003b. Response to the Peer Review Visit of March 27. http://isbe.state.il.us/nclb/pdfs/account_workbook.pdf.
———. 2004. Illinois Learning Standards. http://www.isbe.net/ils/Default.htm (accessed June 30, 2004).
ISBE and Illinois Board of Higher Education. 1988. Our Future at Risk: A Report of the Joint Committee on Minority Student Achievement. April.
Jacob, Brian, and Steven Levitt. 2003. “Rotten Apples: An Investigation of the Prevalence and Predictors of Teacher Cheating.” Quarterly Journal of Economics 118 (3): 843–78.
Jencks, C., and M. Phillips. 1998. The Black-White Test Score Gap. Washington, DC: Brookings Institution Press.
Kahlenberg, Richard D. 2001. All Together Now: Creating Middle-Class Schools through Public School Choice. Washington, DC: Brookings.
Keller, Bess. 2002. “Report Urges Experimentation with Teacher-Pay Schemes.” Education Week 21 (39): 11.
Kim, J., and G. L. Sunderman. 2004. Large Mandates and Limited Resources: State Response to the No Child Left Behind Act and Implications for Accountability. Cambridge, MA: The Civil Rights Project at Harvard University.
Kornhaber, Mindy. 2004. “Appropriate and Inappropriate Forms of Testing, Assessment, and Accountability.” Educational Policy 18 (1): 45–70.
C46 Measuring the Minority Education Gap
Krueger, A. 1999. “Experimental Estimates of Education Production Functions.” Quarterly Journal of Economics 114 (2): 497–532.
Labi, Nadya, et al. 1999. “When Teachers Cheat.” Time 154 (25): 86.
Landgraf, Kurt. 2004. Importance of Highly Qualified Teachers. Statement of K. Landgraf, President and CEO of the Educational Testing Service, to the Committee on House Education and the Workforce. FDCH Congressional Testimony on April 21.
Lee, Valerie E., and David T Burkam. 2002. Inequality at the Starting Gate: Social Background Differences in Achievement as Children Begin School. Washington, DC: Economic Policy Institute.
Levin, Henry. 1996. “Economics of School Reform for At-Risk Students.” In National Research Council, Improving America’s Schools: The Role of Incentives, 225–40. Washington, DC: National Academy Press.
Linn, R. L. 2003. “Requirements for Measuring Adequate Yearly Progress.” CRESST Policy Brief 6, winter. Los Angeles: University of California, National Center for Research on Evaluation, Standards, and Student Testing.
MacPherson, K. 2003. “A Nation Still at Educational Risk.” Post-Gazette National Bureau, August 31, A-11.
McGee, Glenn M. 2003. “Closing Illinois’ Achievement Gap: Lessons From the ‘Golden Spike’ High Poverty High Performing Schools.” Paper presented at the annual meeting of the American Educational Research Association, April 21, Chicago, IL.
McLester, Susan. 2004. “Teacher Compensation: Let’s Get with the Program.” Technology & Learning 24 (8): 4.
McLure, Jason. 2003. “Testing: Cheater Teacher.” Newsweek 142 (22): 12.
National Commission on Excellence in Education. 1983. A Nation at Risk: The Imperative of Educational Reform. Washington, DC: US Department of Education.
National Conference of State Legislatures. 2005. Task Force on No Child Left Behind: Final Report. Denver: National Conference of State Legislatures.
National PTA. 2004. Title I of the Elementary and Secondary Education Act. http://www.pta.org/ptawashington/issues/titleone.asp.
National Research Council. 1999. Making Money Matter: Financing America’s Schools, Helen F. Ladd and Janet S. Hansen, eds. Washington, DC: National Academy Press.
———. 2000. How People Learn: Brain, Mind, Experience and School, John D. Bransford, Ann L. Brown, and Rodney Cocking, eds. Washington, DC: National Academy Press.
———. 2002. Achieving High Educational Standards for All, Timothy Ready, Christopher Edley Jr., and Catherine E. Snow, eds. Washington, DC: National Academy Press.
———. 2003. Measuring Access to Learning Opportunities, Willis D. Hawley and Timothy Ready, eds. Washington, DC: National Academies Press.
———. 2004. Engaging Schools: Fostering High School Students’ Motivation to Learn. Committee on Increasing High School Students’ Engagement and Motivation to Learn. Washington, DC: National Academies Press.
47CReport to the Joyce Foundation
OBGYN.net. 2004. “US CDC Releases Annual Summary of Pediatric Vital Statistics for 2002.” www.obgyn.net/newsheadlines/headline_medical_news-Pediatrics-20040121-8.asp.
Orfield, Gary, and Ken Gaebler. 1991. “Residential Segregation and the 1990 Census.” Metropolitan Chicago Census Analysis Project. Report No. 1. Urban League, IL. ERIC document #ED346215.
Orfield, G., and C. Lee. 2004. Brown at 50: King’s Dream or Plessy’s Nightmare. Cambridge, MA: The Civil Rights Project at Harvard University.
Paulson, Amanda. 2004. “Chicago Hope: ‘Maybe This Will Work’.” Christian Science Monitor, September 21. www.csmonitor.com/2004/0921/p11s01-legn.html.
Pollock, Mica. 2001. “How the Question We Ask Most about Race in Education Is the Very Question We Most Suppress.” Educational Researcher 30 (9, December): 2–11.
Rau, W., N. M. Shelly, and F. Beck. 2001. “The Dark Engine of Illinois Education: A Sociological Critique of a ‘Well-Crafted (Testing) Machine’.” Educational Policy 15 (3): 404–31.
Rebell, M. 2002. “Educational Adequacy, Democracy and the Courts.” In Timothy Ready, Christopher Edley Jr., and Catherine Snow, eds., Achieving High Educational Standards for All. Washington, DC: National Academic Press.
———. 2004. “Why Adequacy Lawsuits Matter.” Education Week, August 11. www.edweek.org/ew/ew_printstory.cfm?slug=44rebell.h23.
Rebell, M., and Jeffrey Metzler. 2002. “Rapid Response, Radical Reform: The Story of School Finance Litigation in Vermont.” Journal of Law and Education 31 (2): 167.
Robelen, E.W. 2002. “Taking on the Achievement Gap.” Naperville, IL: North Central Regional Education Laboratory. www.ncrel.org/gap/takeon/toc.htm.
Sacks, P. 1997. “Standardizing Testing: Meritocracy’s Crooked Yardstick.” Change March/April: 25–28.
School Law News. 2000. “Magazine Finds Cheating on Massachusetts Standardized Tests.” 28 (5): 6.
Sharp, William. 1993. “School Spending: Is There a Relationship between Spending and Student Achievement? A Correlation Study of Illinois Schools.” ERIC Document # ED357503.
Stutz, T. 2004. “‘Robin Hood’ System Rejected: School Finance Method Unconstitutional, Judge Finds; State Plans Appeal.” Dallas Morning News, September 16.
Teacher Magazine. 2000. “Cheat Sheet.” 11 (5): 49.
Thernstrom, A., and S. Thernstrom. 2003. No Excuses: Closing the Racial Gap in Learning. New York: Simon & Schuster.
Toch, T., and B. Wagner. 1992. “Schools for Scandal.” U.S. News & World Report 112 (16): 66–72.
US Census Bureau. 2000. Census 2000 Summary File 1 (SF 1) 100-Percent Data. http://factfinder.census.gov/servlet/GCTTable?_bm=y&-geo_id=D&-ds_name=D&-_lang=en&-redoLog=false&-format=ST-8&-mt_name=DEC_2000_SF1_U_GCTP6_US9.
C48 Measuring the Minority Education Gap
———. 2001. “The Hispanic Population: Census 2000 Brief.” C2KBR/01-3, issued May 2001 by the US Department of Commerce, Economics and Statistics Administration.
———. 2004a. Annual Estimates of the Population by Sex, Race and Hispanic or Latino Origin for States: April 1, 2000 to July 1, 2003. www.census.gov/popest/states/asrh/tables/SC-EST2003-03/SC-EST2003-03-17.pdf.
———. 2004b. American FactFinder Table QT-PL. Race, Hispanic or Latino, and Age: 2000. http://factfinder.census.gov/servlet/QTTable?_bm=y&-_caller=geoselect&-BucketID=NO&-type=null&-subject=Race percent20(Including percent20Detailed percent20Categories percent20of percent20Race)&-Tables=DEC_2000_SF1_U_QTP3&-redoLog=false&-EC_NAME=NO&-_lang=en&-geo_id=04000US17&-ExpandSubject=NO&-CONTEXT=qt&-format=&-what=2&-ds_name=DEC_2000_PL_U&-qr_name=DEC_2000_PL_U_QTPL&-table=DEC_2000_SF1_U_DP1&-WhatTable=qt,&-ExpandItem=NO.
———. 2004c. Tables 148H, 148B, and 148I, Educational Attainment for the Population 25 Years and Over. http://factfinder.census.gov/servlet/DTTable?_bm=y&-context=dt&-ds_name=DEC_2000_SF3_U&-CONTEXT=dt&-mt_name=DEC_2000_SF3_U_P148B&-mt_name=DEC_2000_SF3_U_P148H&-mt_name=DEC_2000_SF3_U_P148I&-tree_id=403&-redoLog=true&-all_geo_types=N&-geo_id=04000US17&-format=&-_lang=en.
Washington Post. 1995. “Bennett, Alexander Spell It Out; Time to Close the Book on Education Department, Former Chiefs Say.” January 25, A 23.
———. 2005. “State Officials Seek Changes In ‘No Child’.” February 24, A 7.
Wenglinsky, Harold. 1997. “When Money Matters: How Educational Expenditures Improve Student Performance and How They Don’t. A Policy Information Perspective.” ERIC document #ED412271.
Wing, Jean Yonemura. 2004. “Closing the Racial Achievement Gap in Diverse California High Schools.” UCACCORD Public Policy Series, PB-003-0504. http://ucaccord.gseis.ucla.edu/publications/pubs/wing.pdf.
Winter, Greg. 2004. “Wider Gap Found between Wealthy and Poor Schools.” New York Times, October 6.
Womack, Sid. 2000. “The Relationship between Resources and Academic Achievement.” ERIC document #ED456498.
Wong, K. 2003. “The Big Stick: School Reform in Chicago Depended on Setting Standards and Promoting System-Wide Improvement.” Education Next winter: 44–49.
Woods, E. Gregory. 2004. “Reducing the Dropout Rate. Northwest Regional Educational Laboratory.” School Improvement Research Series, Close-Up #17. www.nwrel.org/scpd/sirs/9/c017.html (accessed December 7, 2004).