Embed Size (px)
Citation preview

1
With thanks to Derek Nee & Bob Spunt
Functional Connectivity: PPI and beta Series

2
• Localization– What areas of the
brain respond to experimental manipulation?
– Localize functions to distinct regions of the brain
• Integration– How do regions of the
brain influence each other?
– How is this influence affected by experimental manipulation?
– Mechanize functions to brain interactions
Localization vs integration

3
Basic Idea

4
Some common approaches
• Between subjects functional connectivity• Time series correlations• Beta Series
– Look for changes in correlation as a function of condition• Are X and Y more tightly coupled in condition A compared to condition
B?
• Psychophysiological Interaction (PPI)– Look for changes in the regression slope as a function of condition
• Does more X activation produce more Y activation in condition A compared to condition B?
5
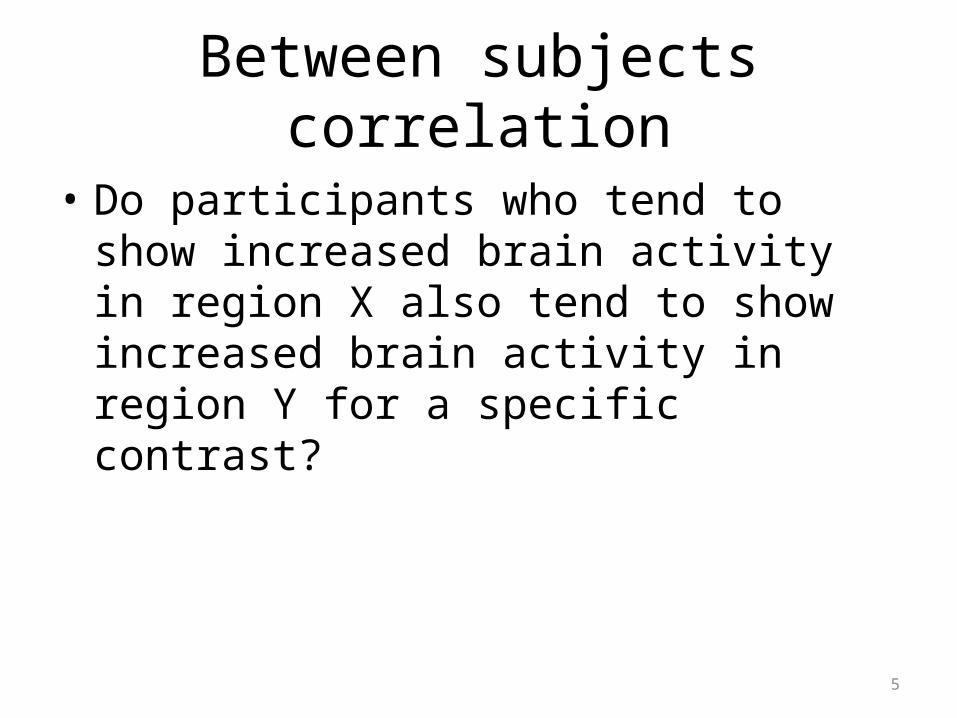
Between subjects correlation
• Do participants who tend to show increased brain activity in region X also tend to show increased brain activity in region Y for a specific contrast?

6
Example

7
Why/ How Example
• Do people who show more activity in DMPFC also show more activity in other regions associated with mentalizing?– As opposed to the appearance of a “network”
coming from multiple different people activating sub regions
• Slightly stronger evidence

8
How to do it
• Method 1 (ROI method):– Extract parameter estimates at group level from a priori
hypothesized ROIs– Examine their correlations with one another
• Method 2 (whole brain search)– Extract PEs at group level from an a priori hypothesized ROI
or peak voxel in a theoretically relevant cluster– Regress onto brain activity in whole brain analysis at group
level• Variants (see yesterday’s lecture)

9
Between subjects connectivity
Strengths• Very simple to run• Very simple to understand• Easy to combine with other
individual difference measures
Limits• Throws out a lot of
temporal information • Does not actually get at
whether regions are coactive during the task (only individual differences across people)
• No ability to make causal inference

10
Within subject approaches
• For a given seed region– Find areas that show changes in their relationship with
the seed region • Within conditions• As a function of different task conditions
• Beta series– takes advantage of within trial variation• PPI– treats within trail variability as noise in a more
traditional interaction analysis

11
Example
• What brain regions is DMPFC working with during attribution? – i.e., “why” in the how/why task

12
Standard GLM
• Typical GLM for our experiment:
Y = β0 + Xwhyβwhy + Xhowβhow + ε
Xwhy is predictor for ‘why’ condition
Xhow is predictor for ‘how’ condition
• Trials are combined into a single predictor– Individual trial variation considered noise
Trial1 Trial2 Trial3 TrialN

13
Beta series GLM• Beta series method assumes that individual trial variation is
meaningful
• For a given seed region, what other regions show similar trial-by-trial variability?– i.e. simple correlation
• To examine between-trial variability, need a separate predictor for each trial
Y = β0 + Xwhy1βwhy1 + Xwhy2βwhy2 + Xwhy3βwhy3 + … + XwhyNβwhyN +
Xhow1βhow1 + Xhow2βhow2 + Xhow3βhow3 + … + XhowNβhowN + ε

14
Beta series
Each predictor is now replaced with a series of predictors
When fit to the GLM, this will yield a series of betas
why1 = 1.1
why2 = 1.3
why2 = 0.7

15
Beta series correlation
why1 = 1.1
why2 = 1.3
why3 = 0.7…whyN = 1.8
Take beta series from seed region
Correlate the seed beta series with the beta series at every other voxel of the brain
Yields a correlation map
Map of correlations during why events (note: not real
data for this task)

16
Beta series correlation
1 = 0.6
2 = 1.1
3 = 0.3…N = 1.4
Repeat process for a different event
Correlate the seed beta series with the beta series at every other voxel of the brain
Yields a correlation map
Map of correlations during attend how events (note: not real data for this task)

17
Note
• Can learn descriptive information about what regions co-vary during specific task conditions
• But, to figure out what is specific to our condition of interest…– Logic similar to subtraction analysis in standard
GLM analysis

18
Beta series Comparison
_ =
Examine changes in correlations as a function of condition through simple subtraction
Note: important to first normalize the correlation maps, so that t-statistics can be performed Send normalized
correlation diff maps (1 per subject) to 2nd level
for simple one-sample t-test

19
Selected other examples• Persistence of emotional memories (Ritchey et al., Cerebral Cortex
2008) – Increased connectivity between amygdala and hippocampus during
encoding predicts increased temporal durability of emotional memories
• Emotional regulation in depression (Heller et al., PNAS 2010) – Decreased NAcc activity in depressed individuals is related to diminished
connectivity between NAcc and PFC
• Individual differences in financial risk-taking (Samanez-Larkin et al., J Neurosci 2010) – Individuals with reduced connectivity between the NAcc and PFC made
more risk-seeking mistakes
20
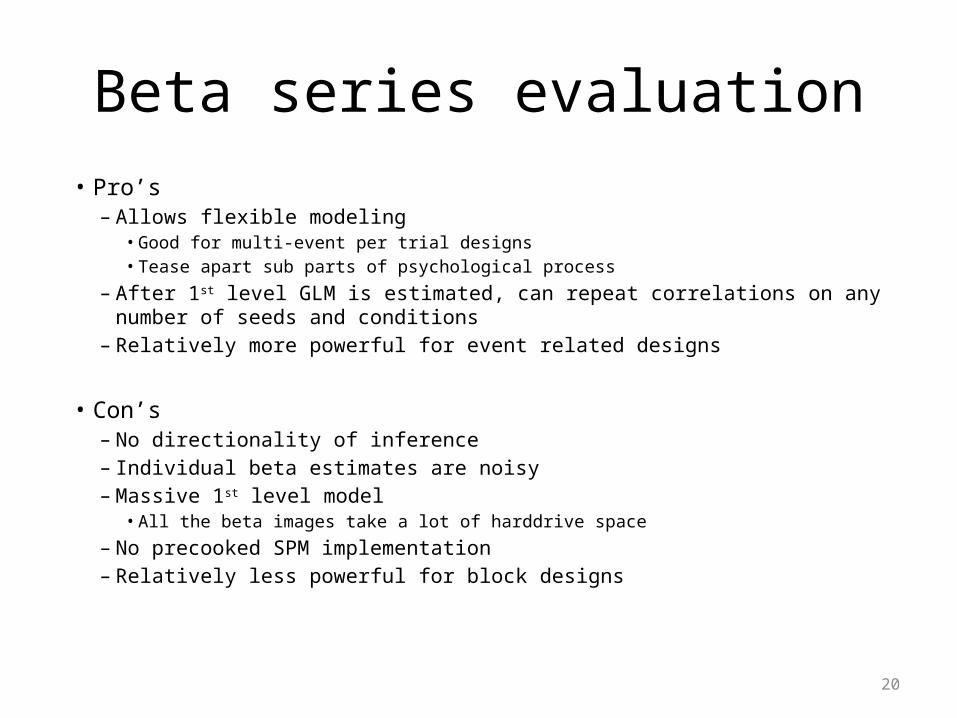
Beta series evaluation• Pro’s
– Allows flexible modeling• Good for multi-event per trial designs• Tease apart sub parts of psychological process
– After 1st level GLM is estimated, can repeat correlations on any number of seeds and conditions
– Relatively more powerful for event related designs
• Con’s– No directionality of inference– Individual beta estimates are noisy– Massive 1st level model
• All the beta images take a lot of harddrive space
– No precooked SPM implementation– Relatively less powerful for block designs

21
Within subject approaches
• Beta Series– Look for changes in correlation as a function of condition
• Are X and Y more tightly coupled in condition A compared to condition B?
• Psychophysiological Interaction (PPI)– Look for changes in the regression slope as a function of
condition• Does more X activation produce more Y activation in condition
A compared to condition B?

22
PsychoPhysiological Interaction (PPI)
• Specifies the GLM with 3 predictors of interest– 1) Psychological term
• Contrast of interest– E.g. why – how
– 2) Physiological term• Time series from seed region
– E.g. DMPFC
– 3) Interaction term• Psych X Phys• Interaction of the seed time series
with the psychological contrast of interest

23
PPI GLM
Y = β0 + (why – how)β1 + DMPFCβ2 + (why - how)*DMPFCβ3 + ε
• Hypothesis:– H0: β3 = 0, there is no interaction
– Ha: β3 > 0, positive interaction
Psychological variable Physiological variable Interaction
how
why
DMPFC ActivationTP
J Acti
vatio
n
Interaction
24
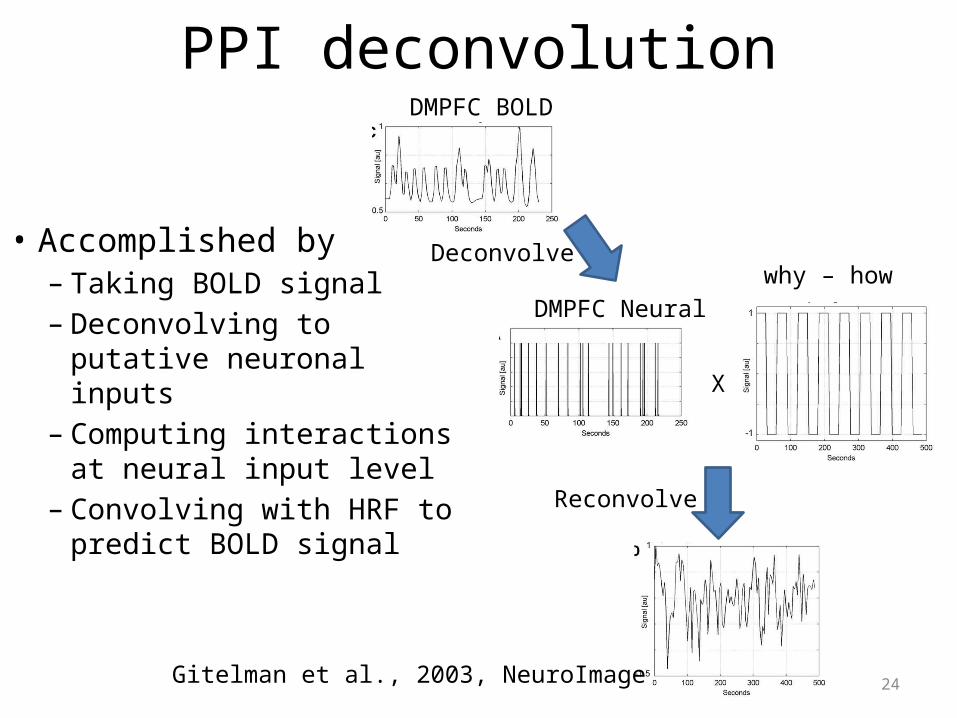
PPI deconvolution
• Accomplished by– Taking BOLD signal– Deconvolving to putative
neuronal inputs– Computing interactions at
neural input level– Convolving with HRF to
predict BOLD signal
DMPFC BOLD
Deconvolve
DMPFC Neuralwhy – how
X
Reconvolve
Gitelman et al., 2003, NeuroImage

25
Interpreting PPIs (do not make causal claims)
• 2 possible interpretations:– 1) Contribution of the source area to
the seed area response (or vice versa) depends upon experimental context• E.g. DMPFC input to TPJ is modulated
by attribution
– 2) Seed response to experimental context depends on activation in the source area (or vice versa)• E.g. Effect of attribution on TPJ is
modulated by DMPFC
TPJDMP
FC
Attribution
TPJDMPFC
Attribution
26
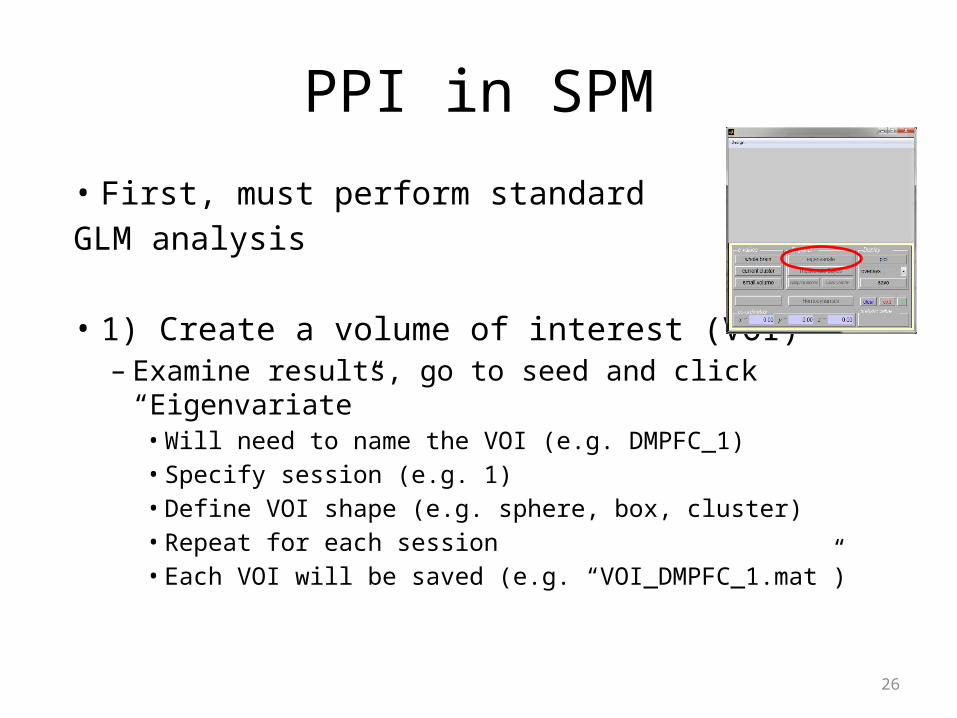
PPI in SPM
• First, must perform standard GLM analysis
• 1) Create a volume of interest (VOI)– Examine results, go to seed and click “Eigenvariate”
• Will need to name the VOI (e.g. DMPFC_1)• Specify session (e.g. 1)• Define VOI shape (e.g. sphere, box, cluster)• Repeat for each session• Each VOI will be saved (e.g. “VOI_DMPFC_1.mat”)

27
PPI In SPM
• 2) click “PPIs” in the main menu– Select the standard GLM’s “SPM.mat”– Select “psychophysiological interaction”– SPM will go through each predictor in the standard GLM
and ask if you want to include it as part of the Psychological variable• If included, set a weight (i.e. 1 for why, -1 for how)
– Name the PPI (e.g. DMPFC_why-how1)– Repeat for each session– Each PPI will be saved (e.g. “PPI_ DMPFC_why-how1.mat”)

28
PPI IN SPM
• 3) Specify a new GLM: a GLM for PPI– Each of the saved PPI_.mat files
contains the 3 regressors of interest– PPI.ppi – the interaction– PPI.P – the psychological term– PPI.Y – the physiological term– For each session, load the appropriate
PPI_.mat file in MATLAB and type the above variables in as regressors
– Include any other nuisance regressors you normally would (e.g. motion regressors)

29
PPI In SPM• 4) After estimating, the contrast is
simply a 1 for the interaction term (e.g. [1 0 0 0] for the design to the right)
• 5) Submit the interaction contrasts from each subject to second-level one-sample t-test
• For more precise details on each step and a tutorial data set, consult the SPM8 manual

30
PPI Pros and Cons• Pro’s
– Model-based with an approximated neuronal input structure– Implemented in SPM
• Con’s– New model for each seed– New model for each psychological contrast– Optimized for simple (e.g. 2-condition) designs, but may not be
suitable for more complex designs• See http://www.nitrc.org/projects/gppi/ for a potential solution to this
– Claims to be “effective connectivity”, but still is not much more than a simple correlation
31
Comparison of PPI and beta series
• gPPI and beta series produced bigger effects than sPPI – Modeling each condition separately may produce
better effects that treating the contrast in one step• A comparison of statistical methods for
detecting context-modulated functional connectivity in fMRI
• Cisler, Bush & Steele, 2014, Neuroimage

32
Selected shortcomings• Both beta series and PPI require a task
– Scott will talk about task-free/resting-state connectivity
• Both beta series and PPI requires specification of seeds– Places strong constraints on revealed networks– May prefer a data driven approach
• Neither beta series nor PPI specify direction of influence– May want methods to examine effective connectivity
• Scott and Luis will cover methods that are well-suited to address these shortcomings

33
Questions?