Embed Size (px)
Citation preview

A weekly publication of the Agricultural Marketing Service www.ams.usda.gov/GTR
June 3, 2021
Contents
Article/ Calendar
Grain
Transportation Indicators
Rail
Barge
Truck
Exports
Ocean
Brazil
Mexico
Grain Truck/Ocean Rate Advisory
Datasets
Specialists
Subscription Information
--------------
The next release is
June 10, 2021
Preferred citation: U.S. Department of Agriculture, Agricultural Marketing Service. Grain Transportation Report. June 3, 2021. Web: http://dx.doi.org/10.9752/TS056.06-03-2021
Grain Transportation Report
WEEKLY HIGHLIGHTS
Increase in Maximum Length for Vessels Transiting Neopanamax Locks
On May 21, 2021, the Panama Canal Authority announced an increase to the maximum allowable length for vessels transiting the
Neopanamax locks. Effective immediately, the maximum overall length for commercial and non-commercial vessels that will be accepted
for regular transits of the locks is 370.33 meters (1,215 feet). Vessels measuring 367.28-370.33 meters (1,205-1,215 feet) must be
equipped with a fully operational bow thruster—a propulsion device that aids ship’s maneuverability. If a vessel in this longer but still
allowed range lacks the bow thruster, it may be assigned additional resources (including tugboat assistance) at the vessel’s expense and be
subject to transit delays. Such vessels will be assigned an extra, assistive tug when approaching Agua Clara locks from Gatun Lake
(northbound). The Panama Canal is a vital outlet for U.S. grain and other container shipments destined for Asia.
Illinois Releases Highway Improvement Program for FY 2022-27
On May 19, the State of Illinois released its proposed highway improvement program for fiscal years (FY) 2022-27. The program
allocates $20.7 billion in total investment, including $3.3 billion for fiscal year 2022. Over the next 6 years, the plan aims to improve
2,779 miles of roadway and 7.9 million square feet of bridge deck. Additionally, $42 million is allocated for upgrading local truck routes.
Other major investments include $5.79 billion for roadway reconstruction and preservation, $4.82 billion for bridge improvements, and
$2.59 billion for roadway expansion efforts. According to the American Road and Transportation Builders Association, about 8.8 percent
of Illinois’s bridges are classified as structurally deficient. The planned investment is funded by Rebuild Illinois—an infrastructure
improvement initiative approved in 2019 that supports investment in road and bridges.
ADM Announces Plan To Open Soybean Crush Plant in North Dakota
On May 10, the Archer-Daniels-Midland Company (ADM) announced plans to open North Dakota’s first soybean crush facility in
Spiritwood, ND. ADM’s plant will have the capacity to process 150,000 bushels of soybeans into soybean meal and oil per day. ADM
anticipates the plant will open in the fall of 2023. Spiritwood, ND, is located on a BNSF rail line and is just north of I-94. Adding soybean
processing capacity to North Dakota in the future may alter the regional supply and demand structure for rail and truck transportation.
Snapshots by Sector
Export Sales
For the week ending May 20, unshipped balances of wheat, corn, and soybeans totaled 25.3 million metric tons (mmt). This was 7
percent lower than last week but 15 percent higher than the same time last year. Net corn export sales were 0.556 mmt, up significantly
from the past week. Net soybean export sales were 0.056 mmt, down 34 percent from the previous week. Net weekly wheat export sales
were 0.029 mmt, down 76 percent from the previous week.
Rail
U.S. Class I railroads originated 25,396 grain carloads during the week ending May 22. This was unchanged from the previous week, 16
percent more than last year, and 14 percent more than the 3-year average.
Average June shuttle secondary railcar bids/offers (per car) were $281 below tariff for the week ending May 27. This was $38 less than
last week and $188 lower than this week last year. There were no non-shuttle bids/offers this week.
Barge
For the week ending May 29, barge grain movements totaled 860,760 tons. This was 16 percent less than the previous week and 9
percent more than the same period last year.
For the week ending May 29, 535 grain barges moved down river— 43 fewer barges than the previous week. There were 777 grain
barges unloaded in New Orleans, 9 percent higher than the previous week.
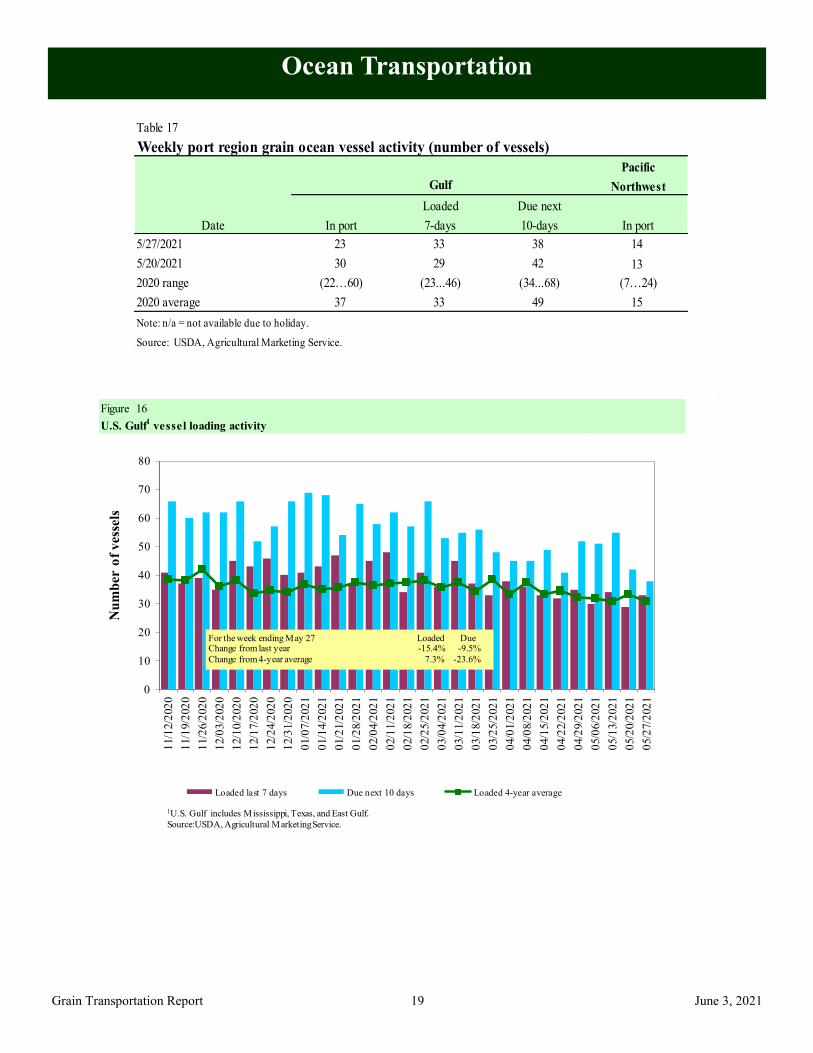
Ocean
For the week ending May 27, 33 ocean going grain vessels were loaded in the Gulf—15 percent fewer than the same period last year.
Within the next 10 days (starting May 28), 38 vessels were expected to be loaded—10 percent fewer than the same period last year.
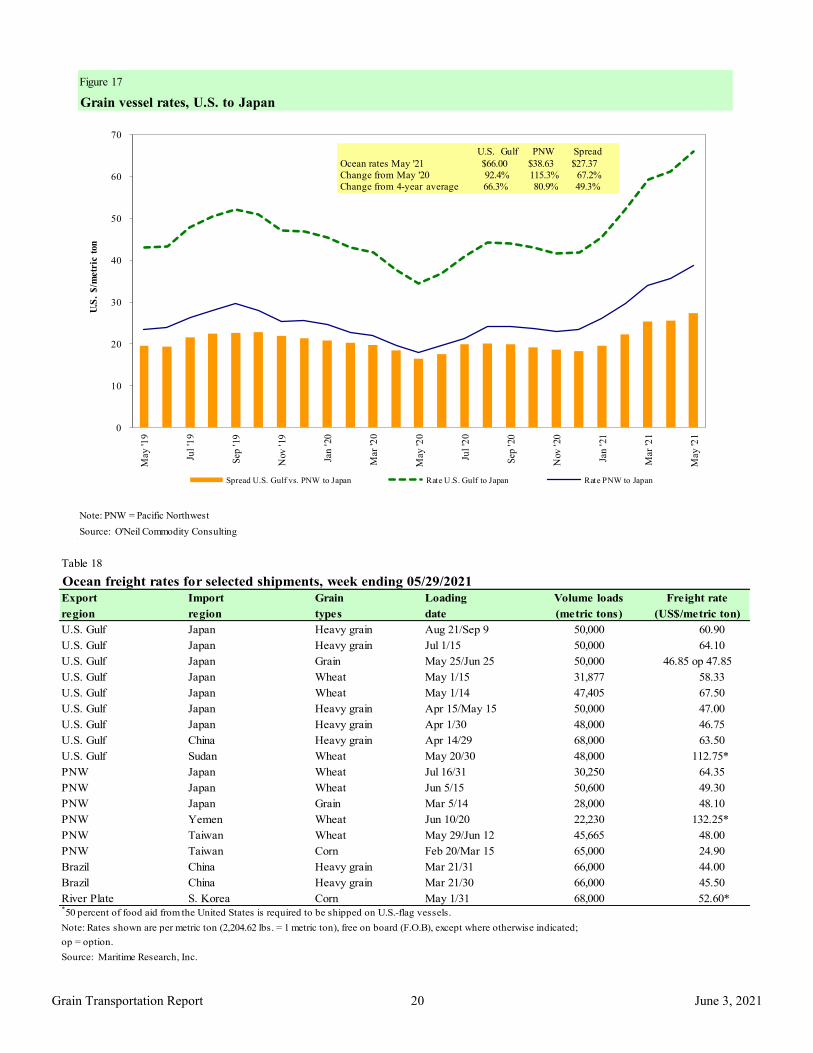
As of May 27, the rate for shipping a metric ton (mt) of grain from the U.S. Gulf to Japan was $66.00. This was unchanged from the
previous week. The rate from the Pacific Northwest (PNW) to Japan was $38.50 per mt, unchanged from the previous week.
Fuel
For the week ending May 31, the U.S. average diesel fuel price increased 0.2 cents from the previous week to $3.255 per gallon, 86.9
cents above the same week last year.
Contact Us

June 3, 2021
Grain Transportation Report 2
Feature Article/Calendar
U.S. Soybean Landed Costs Increased, as Brazil’s Varied, in the First Quarter
United States and Brazil are the world’s two leading producers of soybeans, and both compete for the same overseas markets,
including China and Europe. According to USDA’s May World Agriculture Supply and Demand Estimates (WASDE), Brazil
is projected to export 86 million metric tons (mmt) of soybeans in marketing year (MY) 2020/21, versus 62.05 mmt by the
United States.
Given the prominence of China and Europe as soybean importers, low transportation and landed costs of soybeans to these
destinations are essential to the competitiveness of both the United States and Brazil. This article compares quarterly and
yearly changes in the costs of moving soybeans from the United States and Brazil to Shanghai, China (table 1) and to
Hamburg, Germany (table 2).
Quarter-to-quarter transportation costs. From fourth quarter 2020 to first quarter 2021 (quarter to quarter), costs rose for
exporting U.S. soybeans through the U.S. Gulf to China (table 1) and Germany (table 2). It also cost more to ship soybeans
from the Pacific Northwest (PNW) to China (table 1). Through both the Gulf and PNW routes, the cost increases were due to
rising truck and ocean freight rates. Truck rates rose partly because of increased demand for trucking services and higher
diesel fuel prices (GTR fig. 13). Ocean freight rates rose in response to strong trade of bulk commodities, such as iron ore
and grain (Grain Transportation Report (GTR) April 15, 2021). In addition, the upper segment of Mississippi River was
2020 2020 2021 2020 2020 2021
1st
qtr. 4th
qtr. 1st
qtr. Yr. to yr. Qtr. to qtr. 1st
qtr. 4th
qtr. 1st
qtr. Yr. to yr. Qtr. to qtr.
Minneapolis, MN Davenport, IA
Truck 10.70 11.38 13.66 27.66 20.04 10.70 11.38 13.66 27.66 20.04
Rail1
36.73 - 36.38 -0.95 - 33.03 - 33.33 0.91 -
Barge 9.02 41.35 12.49 38.47 -69.79 9.02 32.31 12.49 38.47 -61.34
Ocean2
41.98 40.79 50.88 21.20 24.74 41.98 40.79 50.88 21.20 24.74
Total transportation 98.43 93.52 113.41 15.22 21.27 94.73 84.48 110.36 16.50 30.63
Farm value3
289.79 364.86 465.42 60.61 27.56 315.02 377.11 456.85 45.02 21.15
Landed cost4
388.22 458.38 578.83 49.10 26.28 409.75 461.59 567.21 38.43 22.88
Transport % of landed cost 25.35 20.40 19.59 23.12 18.30 19.46
Fargo, ND Sioux Falls, SD
Truck 10.70 11.38 13.66 27.66 20.04 10.70 11.38 13.66 27.66 20.04
Rail1
57.10 57.10 57.10 0.00 0.00 58.09 58.09 58.09 0.00 0.00
Ocean 22.28 22.65 28.60 28.37 26.27 22.28 22.65 28.60 28.37 26.27
Total transportation 90.08 91.13 99.36 10.30 9.03 91.07 92.12 100.35 10.19 8.93
Farm value 288.44 352.13 439.70 52.44 24.87 304.97 356.29 442.15 44.98 24.10
Landed cost 378.52 443.26 539.06 42.41 21.61 396.04 448.41 542.50 36.98 20.98
Transport % of landed cost 23.80 20.56 18.43 23.00 20.54 18.50
Truck 68.33 54.20 60.94 -10.82 12.44 40.67 30.89 36.83 -9.44 19.23
Ocean7
35.50 31.67 37.00 4.23 16.83 37.25 33.42 38.75 4.03 15.95
Total transportation 103.83 85.87 97.94 -5.67 14.06 77.92 64.31 75.58 -3.00 17.52
Farm Value8
282.59 490.89 463.10 63.88 -5.66 285.74 442.13 466.39 63.22 5.49
Landed Cost 386.42 576.76 561.04 45.19 -2.73 363.66 506.44 541.97 49.03 7.02
Transport % of landed cost 26.87 14.89 17.46 21.43 12.70 13.95
1Rail rates include fuel surcharges, but do not include the cost of purchasing empty rail cars in the secondary rail markets,
which could exceed the rail tariff rate plus fuel surcharge shown in the table.2Source for the U.S. ocean freight rates: O'Neil Commodity Consulting.
3Source for the U.S farm values: USDA, National Agricultural Statistics Service.
4Landed cost is transportation cost plus farm value.
5Producing regions: MT= Mato Grosso, GO = Goiás.
6Export ports.
7Source for Brazil's ocean freight rates: University of São Paulo, Brazil and USDA, Agricultural Marketing Service.
8Source for Brazil's farm values: Companhia Nacional de Abastecimento.
Note: qtr. = quarter; yr. = year; mt = metric ton; total may not add exactly because of rounding.
Source: Compiled by the USDA, Agricultural Marketing Service.
Percent change
--$/mt-- --$/mt--
South GO5 - Paranagua
6
--$/mt-- --$/mt--
Via PNW
Table 1-Quarterly costs of transporting soybeans from United States and Brazil to Shanghai, China
United States (via U.S. Gulf)
Brazil
North MT5 - Santos
6
Percent change

June 3, 2021
Grain Transportation Report 3
closed for navigation during the winter. Where the river was closed, soybeans moved by rail transportation instead of barge,
then later transferred to barges to complete the trip to New Orleans for export. Because rail is costlier than barge,
transportation costs rose for these rail-detoured barge trips. In Brazil, transportation costs rose in response to higher truck and
ocean freight rates.
Year-to-year transportation costs. From first quarter 2020 to first quarter 2021 (year to year), transportation costs increased
in the United States, but declined in Brazil. In the United States, higher truck, barge and ocean freight rates pushed up
transportation costs. In Brazil, lower truck rates more than offset an increase in ocean freight rates, causing transportation
cost to fall.
Quarter-to-quarter landed costs. From quarter to quarter, landed costs increased in the United States, but varied in Brazil.
For shipments through the U.S. Gulf and PNW, landed-cost increases reflected both rising transportation costs and rising
farm values. In Brazil, landed costs for shipments out of South Goiás rose because of higher transportation costs and farm
values. In contrast, landed costs fell for shipments out of North Mato Grosso because of reduced farm values that more than
offset an increase in transportation costs. In first quarter 2021, the transportation share of U.S. landed costs was 18-20 percent
for shipments to China (table 1) and 15 percent for shipments to Germany (table 2). The transportation share of Brazil’s total
landed costs was 14-17 percent for shipments to China (table 1) and 13-17 percent for shipments to Germany (table 2).
Year-to-year landed costs. Year to year, landed costs rose in both countries, though the reasons varied by country. For
exports from the United Sates, the increase reflected higher transportation costs and higher soybean farm values. However,
for shipments out of Brazil, landed costs rose only because of higher farm values.
U.S. exports to China. According to USDA’s Federal Grain Inspection Service, China imported 7.60 mmt of U.S. soybeans
in first quarter 2021, versus 24.38 mmt in the previous quarter and 2.90 mmt in first quarter 2020. Lower U.S. transportation
and landed costs to China could boost soybean exports to China. For more on soybean transportation, see Brazil Soybean
Transportation. [email protected]
2020 2020 2021 2020 2020 2021
1st
qtr. 4th
qtr. 1st
qtr. Yr. to yr. Qtr. to qtr. 1st
qtr. 4th
qtr. 1st
qtr. Yr. to yr. Qtr. to qtr.
Minneapolis, MN Davenport, IA
Truck 10.70 11.38 13.66 27.66 20.04 10.70 11.38 13.66 27.66 20.04
Rail1
36.73 - 36.38 -0.95 - 33.03 - 33.33 0.91 -
Barge 9.02 41.35 12.49 38.47 -69.79 9.02 32.31 12.49 38.47 -61.34
Ocean2
14.82 19.02 19.75 33.27 3.84 14.82 19.02 19.75 33.27 3.84
Total transportation 71.27 71.75 82.28 15.45 14.68 67.57 62.71 79.23 17.26 26.34
Farm value3
289.79 364.86 465.42 60.61 27.56 315.02 377.11 456.85 45.02 21.15
Landed cost4
361.06 436.61 547.70 51.69 25.44 382.59 439.82 536.08 40.12 21.89
Transport % of landed cost 19.74 16.43 15.02 17.66 14.26 14.78
Truck 68.33 54.20 60.94 -10.82 12.44 40.67 30.89 36.83 -9.44 19.23
Ocean7
29.25 25.25 31.25 6.84 23.76 30.00 25.35 31.00 3.33 22.29
Total transportation 97.58 79.45 92.19 -5.52 16.04 70.67 56.24 67.83 -4.02 20.61
Farm value8
282.59 490.89 463.10 63.88 -5.66 285.74 442.13 466.39 63.22 5.49
Landed cost 380.17 570.34 555.29 46.06 -2.64 356.41 498.37 534.22 49.89 7.19
Transport % of landed cost 25.67 13.93 16.60 19.83 11.28 12.70
1Rail rates include fuel surcharges, but do not include the cost of purchasing empty rail cars in the
secondary rail markets, which could exceed the rail tariff rate plus fuel surcharge shown in the table.2Source for the U.S. ocean rates: O'Neil Commodity Consulting.
3Source for the U.S. farm values: USDA/National Agrocultural Statistics Service
.
5Producing regions: MT= Mato Grosso, GO = Goiás.
6Export ports.
7Source for Brazil's ocean rates:University of São Paulo, Brazil and USDA/Agricultural Marketing Service.
8Source for Brazil's farm values: Companhia Nacional de Abastecimento.
Note: qtr. = quarter; yr. = year; mt = metric ton; total may not add exactly because of rounding.
Source: Compiled by the USDA, Agricultural Marketing Service.
4Landed cost is total cost plus farm value.
--$/mt-- --$/mt--
--$/mt-- --$/mt--
Table 2-Quarterly costs of transporting soybeans from United States and Brazil to Hamburg, Germany
Percent change Percent change
United States (via U.S. Gulf)
Brazil
North MT5 - Santos
6South GO
5 - Paranagua
6

June 3, 2021
Grain Transportation Report 4
Grain Transportation Indicators
The grain bid summary illustrates the market relationships for commodities. Positive and negative adjustments in differential
between terminal and futures markets, and the relationship to inland market points, are indicators of changes in fundamental mar-
ket supply and demand. The map may be used to monitor market and time differentials.
Table 2
Market Update: U.S. origins to export position price spreads ($/bushel)
Commodity Origin–destination 5/28/2021 5/21/2021
Corn IL–Gulf -0.76 -0.76
Corn NE–Gulf -0.81 -0.79
Soybean IA–Gulf -0.79 -0.69
HRW KS–Gulf -1.98 -1.93
HRS ND–Portland -1.81 -2.01
Note: nq = no quote; n/a = not available; HRW = hard red winter wheat; HRS = hard red spring wheat.
Source: USDA, Agricultural Marketing Service.
Table 1
Grain transport cost indicators1
Truck Barge Ocean
For the week ending Non-Shuttle Shuttle Gulf Pacific
06/02/21 218 297 212 185 295 2730 % # DIV/0 ! - 12 % 0 % 0 %
05/26/21 218 297 214 210 295 273
1Indicator: Base year 2000 = 100. Weekly updates include truck = diesel ($/gallon); rail = near-month secondary rail market bid and monthly tariff
rate with fuel surcharge ($/car); barge = Illinois River barge rate (index = percent of tariff rate); ocean = routes to Japan ($/metric ton);
n/a = not available.
Source: USDA, Agricultural Marketing Service.
Rail
Gulf-Louisiana
Gulf - Texas
Inland Bids: 12% HRW, 14% HRS, #1 SRW, #1 DUR, #1 SWW, #2 Y Corn, #1 Y Soybeans
Export Bids: Ord. HRW, 14% HRS, #2 SRW, #2 DUR, #2 SWW, #2 Y Corn, #1 Y Soybeans
Sources...U.S. Inland:
GeoGrain
USDA Weekly Bids
U.S. Export: Corn & Soybean - Export Grain Bids, AMS
USDA Wheat Bids - Weekly Wheat Report, U.S. Wheat Associates, Wash., D.C.
Great Lakes-Duluth
Portland
MTND
NE
MN
OK
ILKS
IA
SD
IN
30-day to Arrive
Elevator Bid
Corn 6.53
Sybn 14.46
Corn 6.75
Sybn 15.24
SRW 6.55
Corn 6.72
Sybn 15.34
HRW 7.68
HRS 8.58
SWW 8.80
Corn 6.66
Sybn NA
HRW 5.70
HRS 6.75
HRW 5.97
HRW 7.83
DUR NA
HRS 8.98
SRW 7.69
Corn 7.48
Sybn 16.03
HRW 5.78
Corn 6.68
Sybn 14.92
HRW NA
Corn 6.67
Sybn 15.01 Corn 6.79
Sybn 15.46
HRS 6.77
DUR 7.35
Corn 6.32
Sybn 14.58
HRW 5.85
Corn 6.75
Sybn 14.83
HRW 6.58
HRS 7.54
Great Lakes-Toledo
WA
Atlantic Coast
HRS 8.13
DUR NA
OH
NC
FUTURES: Week Ago Year Ago
5/28/2021 5/21/2021 5/29/2020
Kansas City Wht Jul 6.2660 6.1040 4.6120
Minneapolis Wht Jul NA 7.0040 5.2500
Chicago Wht Jul 6.7920 6.5840 5.1440
Chicago Corn Jul 6.6840 6.4960 3.2260
Chicago Sybn Jul 15.4460 15.1900 8.4340
(AR, MS and AL combined)
Corn 6.32
Sybn 14.58
Figure 1 Grain bid summary

June 3, 2021
Grain Transportation Report 5
Rail Transportation
Railroads originate approximately 24 percent of U.S. grain shipments. Trends in these loadings are indicative of
market conditions and expectations.
Figure 2
Rail deliveries to port
0
1
2
3
4
5
6
7
8
9
10
01/0
2/1
9
02/2
7/1
9
04/2
4/1
9
06/1
9/1
9
08/1
4/1
9
10/0
9/1
9
12/0
4/1
9
01/2
9/2
0
03/2
5/2
0
05/2
0/2
0
07/1
5/2
0
09/0
9/2
0
11/0
4/2
0
12/3
0/2
0
02/2
4/2
1
04/2
1/2
1
06/1
6/2
1
08/1
1/2
1
10/0
6/2
1
10
00
carlo
ads -
4-w
eek
ave
rag
e
Pacific Northwest: 4 weeks ending 5/26—up 28% from same period last year; up 12% from the 4-year average.
Texas Gulf: 4 weeks ending 5/26—unchanged from same period last year; down 3% from the 4-year average.
Mississippi River: 4 weeks ending 5/26—up 43% from same period last year; up 41 % from the 4-year average.
Cross-border: 4 weeks ending 5/22—up 26% from same period last year; up 20% from the 4-year average.
Source: USDA, Agricultural Marketing Service.
Table 3
Rail deliveries to port (carloads)1
Mississippi Pacific Atlantic & Cross-border
For the week ending Gulf Texas Gulf Northwest East Gulf Total Week ending Mexico3
5/26/2021p
739 1,090 6,221 81 8,131 5/22/2021 3,516
5/19/2021r
850 1,115 5,999 120 8,084 5/15/2021 3,532
2021 YTDr
32,226 33,658 140,879 9,887 216,650 2021 YTD 56,916
2020 YTDr
9,254 16,825 97,100 4,195 127,374 2020 YTD 49,911
2021 YTD as % of 2020 YTD 348 200 145 236 170 % change YTD 114
Last 4 weeks as % of 20202
143 100 128 85 124 Last 4wks. % 2020 126
Last 4 weeks as % of 4-year avg.2
141 97 112 39 109 Last 4wks. % 4 yr. 120
Total 2020 45,294 64,116 299,882 24,458 433,750 Total 2020 126,407
Total 2019 40,974 51,167 251,181 16,192 359,514 Total 2019 127,6221Data is incomplete as it is voluntarily provided.
2 Compared with same 4-weeks in 2020 and prior 4-year average.
3 Cross-border weekly data is approximately 15 percent below the Association of American Railroads' reported weekly carloads received by Mexican railroads.
to reflect switching between Kansas City Southern de Mexico (KCSM) and Grupo Mexico.
YTD = year-to-date; p = preliminary data; r = revised data; n/a = not available; wks. = weeks; avg. = average.
Source: USDA, Agricultural Marketing Service.

June 3, 2021
Grain Transportation Report 6
Figure 3
Total weekly U.S. Class I railroad grain carloads
15
17
19
21
23
25
27
29
31
1,0
00
car
load
s
Prior 3-year, 4-week average Current 4-week average
For the 4 weeks ending May 22, grain carloads were unchanged from the previous week, up 20 percent from last year,
and up 14 percent from the 3-year average.
Source: Association of American Railroads.
Table 4
Class I rail carrier grain car bulletin (grain carloads originated)
For the week ending:
5/22/2021 CSXT NS BNSF KCS UP CN CP
This week 1,942 2,882 12,884 1,413 6,275 25,396 3,293 4,884
This week last year 1,923 2,032 10,959 1,193 5,761 21,868 4,485 4,954
2021 YTD 40,127 52,058 262,894 21,788 132,497 509,364 96,720 109,718
2020 YTD 35,782 48,504 223,921 22,101 102,846 433,154 80,778 90,334
2021 YTD as % of 2020 YTD 112 107 117 99 129 118 120 121
Last 4 weeks as % of 2020* 122 111 121 129 118 120 100 112
Last 4 weeks as % of 3-yr. avg.** 107 97 113 131 123 114 102 121
Total 2020 91,659 130,578 613,630 57,782 296,701 1,190,350 238,700 261,778
*The past 4 weeks of this year as a percent of the same 4 weeks last year.
**The past 4 weeks as a percent of the same period from the prior 3-year average. YTD = year-to-date; avg. = average; yr. = year.
Note: NS = Norfolk Southern; KCS = Kansas City Southern; UP = Union Pacific; CN = Canadian National; CP = Canadian Pacific.
Source: Association of American Railroads.
East WestU.S. total
Canada
Table 5
Railcar auction offerings1
($/car)2
Jun-21 Jun-20 Jul-21 Jul-20 Aug-21 Aug-20 Sep-21 Sep-20
COT grain units no bids 2 no bids no bids no bids no bids no bids no bids
COT grain single-car 301 4 234 6 0 0 0 0
GCAS/Region 1 no offer no bid no offer no bid no offer no bid n/a n/a
GCAS/Region 2 no offer 2 no offer 4 no offer 4 n/a n/a
1Auction offerings are for single-car and unit train shipments only.
2Average premium/discount to tariff, last auction. n/a = not available.
3BNSF - COT = BNSF Railway Certificate of Transportation; north grain and south grain bids were combined effective the week ending 6/24/06.
4UP - GCAS = Union Pacific Railroad Grain Car Allocation System.
Region 1 includes: AR, IL, LA, MO, NM, OK, TX, WI, and Duluth, MN.
Region 2 includes: CO, IA, KS, MN, NE, WY, and Kansas City and St. Joseph, MO.
Source: USDA, Agricultural Marketing Service.
UP4
Delivery period
BNSF3
For the week ending:
5/27/2021

June 3, 2021
Grain Transportation Report 7
The secondary rail market information reflects trade values for service that was originally purchased from the railroad carrier as some form of guaranteed freight. The auction and secondary rail values are indicators of rail service quality and demand/supply.
Figure 4
Bids/offers for railcars to be delivered in June 2021, secondary market
-400
-300
-200
-100
0
100
200
300
400
500
10/2
9/2
02
0
11/1
2/2
02
0
11/2
6/2
02
0
12/1
0/2
02
0
12/2
4/2
02
0
1/7
/20
21
1/2
1/2
021
2/4
/20
21
2/1
8/2
021
3/4
/20
21
3/1
8/2
021
4/1
/20
21
4/1
5/2
021
4/2
9/2
021
5/1
3/2
021
5/2
7/2
021
6/1
0/2
021
Avera
ge p
rem
ium
/dis
cou
nt
to t
ari
ff
($/c
ar)
Shuttle Non-shuttle
Shuttle prior 3-yr. avg. (same week) Non-shuttle prior 3-yr. avg. (same week)5/27/2021
Note: Non-shuttle bids include unit-train and single-car bids. n/a = not available; avg. = average; yr. = year; BNSF = BNSF Railway; UP = Union Pacific Railroad.Source: USDA, Agricultural Marketing Service.
n/a
UPBNSF
-$263
n/a
-$300Shuttle
Non-shuttle
There were no non-shuttle bids/offers this week.Average shuttle bids/offers fell $38 this week and are $281 below the peak.
Figure 5
Bids/offers for railcars to be delivered in July 2021, secondary market
-400
-300
-200
-100
0
100
200
300
400
500
11/2
6/2
02
0
12/1
0/2
02
0
12/2
4/2
02
0
1/7
/20
21
1/2
1/2
021
2/4
/20
21
2/1
8/2
021
3/4
/20
21
3/1
8/2
021
4/1
/20
21
4/1
5/2
021
4/2
9/2
021
5/1
3/2
021
5/2
7/2
021
6/1
0/2
021
6/2
4/2
021
7/8
/20
21
Avera
ge p
rem
ium
/dis
cou
nt
to t
ari
ff
($/c
ar)
Shuttle Non-shuttle
Shuttle prior 3-yr. avg. (same week) Non-shuttle prior 3-yr. avg. (same week)5/27/2021
Note: Non-shuttle bids include unit-train and single-car bids. n/a = not available; avg. = average; yr. = year; BNSF = BNSF Railway; UP = Union Pacific Railroad.Source: USDA, Agricultural Marketing Service.
n/a
UPBNSF
-$250
n/a
-$325Shuttle
Non-shuttle
There were no non-shuttle bids/offers this week.Average shuttle bids/offers fell $63 this week and are $225 below the peak.

June 3, 2021
Grain Transportation Report 8
Figure 6
Bids/offers for railcars to be delivered in August 2021, secondary market
-300
-250
-200
-150
-100
-50
0
50
100
150
200
250
12/3
1/2
02
0
1/1
4/2
021
1/2
8/2
021
2/1
1/2
021
2/2
5/2
021
3/1
1/2
021
3/2
5/2
021
4/8
/20
21
4/2
2/2
021
5/6
/20
21
5/2
0/2
021
6/3
/20
21
6/1
7/2
021
7/1
/20
21
7/1
5/2
021
7/2
9/2
021
8/1
2/2
021
Avera
ge p
rem
ium
/dis
cou
nt
to t
ari
ff
($/c
ar)
Shuttle Non-shuttle
Shuttle prior 3-yr. avg. (same week) Non-shuttle prior 3-yr. avg. (same week)5/27/2021
Note: Non-shuttle bids include unit-train and single-car bids. n/a = not available; avg. = average; yr. = year; BNSF = BNSF Railway; UP = Union Pacific Railroad.Source: USDA, Agricultural Marketing Service.
n/a
UPBNSF
-$250
n/a
-$225Shuttle
Non-shuttle
There were no non-shuttle bids/offers this week.Average shuttle bids/offers fell $13 this week and are $163 below the peak.
Table 6
Weekly secondary railcar market ($/car)1
Jun-21 Jul-21 Aug-21 Sep-21 Oct-21 Nov-21
BNSF-GF n/a n/a n/a n/a n/a n/a
Change from last week n/a n/a n/a n/a n/a n/a
Change from same week 2020 n/a n/a n/a n/a n/a n/a
UP-Pool n/a n/a n/a n/a n/a n/a
Change from last week n/a n/a n/a n/a n/a n/a
Change from same week 2020 n/a n/a n/a n/a n/a n/a
BNSF-GF (263) (250) (250) 72 1200 n/a
Change from last week (50) 0 0 (6) 0 n/a
Change from same week 2020 (163) n/a n/a n/a n/a n/a
UP-Pool (300) (325) (225) (200) 850 375
Change from last week (25) (125) (25) (25) (25) 0
Change from same week 2020 (213) (225) n/a n/a 675 n/a
1Average premium/discount to tariff, $/car-last week.
Note: Bids listed are market indicators only and are not guaranteed prices. n/a = not available; GF = guaranteed freight; Pool = guaranteed pool;
BNSF = BNSF Railway; UP = Union Pacific Railroad.
Data from James B. Joiner Co., Tradewest Brokerage Co.
Source: USDA, Agricultural Marketing Service.
No
n-s
hu
ttle
For the week ending:
5/27/2021
Sh
utt
le
Delivery period

June 3, 2021
Grain Transportation Report 9
The tariff rail rate is the base price of freight rail service. Together with fuel surcharges and any auction and secondary rail values, the tariff rail rate constitutes the full cost of shipping by rail. Typically, auction and secondary rail values are a small fraction of the full cost of shipping by rail relative to the tariff rate. However, during times of high rail demand or short supply, high auction and secondary rail values can exceed the cost of the tariff rate plus fuel surcharge.
Table 7
Tariff rail rates for unit and shuttle train shipments1
Percent
Tariff change
June 2021 Origin region3
Destination region3
rate/car metric ton bushel2
Y/Y4
Unit train
Wheat Wichita, KS St. Louis, MO $3,695 $106 $37.75 $1.03 5
Grand Forks, ND Duluth-Superior, MN $4,208 $0 $41.79 $1.14 -3
Wichita, KS Los Angeles, CA $7,115 $0 $70.66 $1.92 -2
Wichita, KS New Orleans, LA $4,525 $187 $46.79 $1.27 3
Sioux Falls, SD Galveston-Houston, TX $6,851 $0 $68.03 $1.85 -2
Colby, KS Galveston-Houston, TX $4,801 $205 $49.71 $1.35 3
Amarillo, TX Los Angeles, CA $5,121 $285 $53.68 $1.46 3
Corn Champaign-Urbana, IL New Orleans, LA $3,900 $211 $40.83 $1.04 3
Toledo, OH Raleigh, NC $7,833 $0 $77.79 $1.98 15
Des Moines, IA Davenport, IA $2,455 $45 $24.82 $0.63 3
Indianapolis, IN Atlanta, GA $5,979 $0 $59.37 $1.51 3
Indianapolis, IN Knoxville, TN $5,040 $0 $50.05 $1.27 3
Des Moines, IA Little Rock, AR $3,900 $131 $40.03 $1.02 5
Des Moines, IA Los Angeles, CA $5,780 $383 $61.20 $1.55 6
Soybeans Minneapolis, MN New Orleans, LA $3,631 $218 $38.22 $1.04 4
Toledo, OH Huntsville, AL $6,595 $0 $65.49 $1.78 17
Indianapolis, IN Raleigh, NC $7,125 $0 $70.75 $1.93 3
Indianapolis, IN Huntsville, AL $5,247 $0 $52.11 $1.42 3
Champaign-Urbana, IL New Orleans, LA $4,645 $211 $48.23 $1.31 3
Shuttle train
Wheat Great Falls, MT Portland, OR $4,018 $0 $39.90 $1.09 -3
Wichita, KS Galveston-Houston, TX $4,236 $0 $42.07 $1.14 -3
Chicago, IL Albany, NY $6,376 $0 $63.32 $1.72 -10
Grand Forks, ND Portland, OR $5,676 $0 $56.37 $1.53 -2
Grand Forks, ND Galveston-Houston, TX $5,996 $0 $59.54 $1.62 -2
Colby, KS Portland, OR $6,012 $336 $63.04 $1.72 3
Corn Minneapolis, MN Portland, OR $5,180 $0 $51.44 $1.31 0
Sioux Falls, SD Tacoma, WA $5,140 $0 $51.04 $1.30 0
Champaign-Urbana, IL New Orleans, LA $3,820 $211 $40.03 $1.02 3
Lincoln, NE Galveston-Houston, TX $3,880 $0 $38.53 $0.98 0
Des Moines, IA Amarillo, TX $4,320 $165 $44.54 $1.13 5
Minneapolis, MN Tacoma, WA $5,180 $0 $51.44 $1.31 0
Council Bluffs, IA Stockton, CA $5,100 $0 $50.65 $1.29 2
Soybeans Sioux Falls, SD Tacoma, WA $5,850 $0 $58.09 $1.58 0
Minneapolis, MN Portland, OR $5,900 $0 $58.59 $1.59 0
Fargo, ND Tacoma, WA $5,750 $0 $57.10 $1.55 0
Council Bluffs, IA New Orleans, LA $4,875 $244 $50.83 $1.38 3
Toledo, OH Huntsville, AL $4,945 $0 $49.11 $1.34 3
Grand Island, NE Portland, OR $5,260 $344 $55.65 $1.51 41A unit train refers to shipments of at least 25 cars. Shuttle train rates are generally available for qualified shipments of
75-120 cars that meet railroad efficiency requirements.
2Approximate load per car = 111 short tons (100.7 metric tons): corn 56 pounds per bushel (lbs/bu), wheat and soybeans 60 lbs/bu.
3Regional economic areas are defined by the Bureau of Economic Analysis (BEA).
4Percentage change year over year (Y/Y) calculated using tariff rate plus fuel surcharge.
Source: BNSF Railway, Canadian National Railway, CSX Transportation, and Union Pacific Railroad.
Tariff plus surcharge per:Fuel
surcharge
per car

June 3, 2021
Grain Transportation Report 10
Table 8
Tariff rail rates for U.S. bulk grain shipments to MexicoDate: Percent
change4
Commodity Destination region per car1
per car2
metric ton3
bushel3
Y/Y
Wheat MT Chihuahua, CI $7,384 $0 $75.45 $2.05 -2
OK Cuautitlan, EM $6,813 $146 $71.10 $1.93 2
KS Guadalajara, JA $7,531 $697 $84.08 $2.29 5
TX Salinas Victoria, NL $4,347 $89 $45.33 $1.23 2
Corn IA Guadalajara, JA $8,902 $593 $97.01 $2.46 3
SD Celaya, GJ $8,140 $0 $83.17 $2.11 0
NE Queretaro, QA $8,300 $304 $87.91 $2.23 3
SD Salinas Victoria, NL $6,905 $0 $70.55 $1.79 0
MO Tlalnepantla, EM $7,665 $297 $81.34 $2.06 3
SD Torreon, CU $7,690 $0 $78.57 $1.99 0
Soybeans MO Bojay (Tula), HG $8,547 $557 $93.01 $2.53 3
NE Guadalajara, JA $9,157 $580 $99.49 $2.70 3
IA El Castillo, JA $9,410 $0 $96.15 $2.61 -1
KS Torreon, CU $8,014 $400 $85.96 $2.34 3
Sorghum NE Celaya, GJ $7,772 $523 $84.76 $2.15 4
KS Queretaro, QA $8,108 $183 $84.71 $2.15 1
NE Salinas Victoria, NL $6,713 $147 $70.08 $1.78 1
NE Torreon, CU $7,092 $364 $76.18 $1.93 31Rates are based upon published tariff rates for high-capacity shuttle trains. Shuttle trains are available for qualified
shipments of 75-110 cars that meet railroad efficiency requirements.2Fuel surcharge adjusted to reflect the change in Ferrocarril Mexicano, S.A. de C.V railroad fuel surcharge policy as of 10/01/2009.
3Approximate load per car = 97.87 metric tons: Corn & Sorghum 56 lbs/bu, Wheat & Soybeans 60 lbs/bu.
4Percentage change calculated using tariff rate plus fuel surchage; Y/Y = year over year.
Sources: BNSF Railway, Union Pacific Railroad, Kansas City Southern.
Origin
state
June 2021 Tariff rate plus
fuel surcharge per:Tariff rate
Fuel
surcharge
Figure 7
Railroad fuel surcharges, North American weighted average1
$0.00
$0.05
$0.10
$0.15
$0.20
$0.25
$0.30
Dolla
rs p
er
railc
ar
mile
3-year monthly average
Fuel surcharge* ($/mile/railcar)
June 2021: $0.16/mile, unchanged from last month's surcharge of $0.16/mile; up 13 cents from the June 2020 surcharge of $0.03/mile; and up 5 cents from the June prior 3-year average of $0.11/mile.
1 Weighted by each Class I railroad's proportion of grain traffic for the prior year.
* Beginning January 2009, the Canadian Pacific fuel surcharge is computed by a monthly average of the bi-weekly fuel surcharge.
**CSX strike price changed from $2.00/gal. to $3.75/gal. starting January 1, 2015.
Sources: BNSF Railway, Canadian National Railway, CSX Transportation, Canadian Pacific Railway, Union Pacific Railroad, Kansas City
Southern Railway, Norfolk Southern Corporation.

June 3, 2021
Grain Transportation Report 11
Barge Transportation
Figure 9 Benchmark tariff rates Calculating barge rate per ton: (Rate * 1976 tariff benchmark rate per ton)/100
Select applicable index from market quotes are included in tables on this page. The 1976 benchmark rates per ton are provided in map.
Map Credit: USDA, Agricultural Marketing Service
Twin Cities 6.19
Mid-Mississippi 5.32
St. Louis 3.99
Cairo-Memphis 3.14
Illinois 4.64 Cincinnati 4.69
Lower Ohio 4.04
Figure 8
Illinois River barge freight rate1,2,3
1Rate = percent of 1976 tariff benchmark index (1976 = 100 percent);
24-week moving average of the 3-year average.
3No rates data from 06/23/20 to 9/29/20 due to the lock closure for rehabilitation and replacement of lock machinery.
Source: USDA, Agricultural Marketing Service.
0
200
400
600
800
1,000
1,200
06/0
2/20
06/1
6/20
06/3
0/20
07/1
4/20
07/2
8/20
08/1
1/20
08/2
5/20
09/0
8/20
09/2
2/20
10/0
6/20
10/2
0/20
11/0
3/20
11/1
7/20
12/0
1/20
12/1
5/20
12/2
9/20
01/1
2/21
01/2
6/21
02/0
9/21
02/2
3/21
03/0
9/21
03/2
3/21
04/0
6/21
04/2
0/21
05/0
4/21
05/1
8/21
06/0
1/21
Per
cent
of t
arif
f Weekly rate
3-year average
For the week ending June 1: 12 percent smaller than last week, 17 percent
higher than last year, and 16 percent lower than the 3-year average.
Table 9
Weekly barge freight rates: Southbound only
Twin
Cities
Mid-
Mississippi
Lower
Illinois
River St. Louis Cincinnati
Lower
Ohio
Cairo-
Memphis
Rate1
6/1/2021 430 335 333 236 251 251 221
5/25/2021 462 380 378 267 271 271 237
$/ton 6/1/2021 26.62 17.82 15.45 9.42 11.77 10.14 6.94
5/25/2021 28.60 20.22 17.54 10.65 12.71 10.95 7.44- -
Current week % change from the same week:- - -
Last year 21 14 17 24 40 40 24
3-year avg. 2
-2 -15 -16 -15 -12 -12 -13-2 6 6
Rate1
July 401 325 320 228 244 244 216
September 514 490 486 430 476 476 428
Source: USDA, Agricultural Marketing Service.
1Rate = percent of 1976 tariff benchmark index (1976 = 100 percent);
24-week moving average; ton = 2,000 pounds; "-" not available due to closure.

June 3, 2021
Grain Transportation Report 12
Table 10
Barge grain movements (1,000 tons)
For the week ending 05/29/2021 Corn Wheat Soybeans Other Total
Mississippi River
Rock Island, IL (L15) 398 2 25 9 435
Winfield, MO (L25) 534 5 52 12 603
Alton, IL (L26) 679 5 79 17 780
Granite City, IL (L27) 593 5 77 17 691
Illinois River (La Grange) 133 0 31 5 169
Ohio River (Olmsted) 110 2 38 0 150
Arkansas River (L1) 0 18 1 0 20
Weekly total - 2021 703 25 116 17 861
Weekly total - 2020 542 6 239 5 792
2021 YTD1
12,649 537 3,851 167 17,203
2020 YTD1
6,676 659 4,592 46 11,973
2021 as % of 2020 YTD 189 81 84 363 144
Last 4 weeks as % of 20202
159 126 56 198 126
Total 2020 18,942 1,765 19,205 237 40,149
2 As a percent of same period in 2020.
Note: L (as in "L15") refers to a lock, locks, or locks and dam facility.
1 Weekly total, YTD (year-to-date), and calendar year total include MI/27, OH/Olmsted, and AR/1; Other refers to oats, barley, sorghum, and rye.
Total may not add exactly due to rounding..
Source: U.S. Army Corps of Engineers.
Figure 10
Barge movements on the Mississippi River1 (Locks 27 - Granite City, IL)
1 The 3-year average is a 4-week moving average.
Source: U.S. Army Corps of Engineers.
0
200
400
600
800
1,000
1,200
05/3
0/2
0
06/1
3/2
0
06/2
7/2
0
07/1
1/2
0
07/2
5/2
0
08/0
8/2
0
08/2
2/2
0
09/0
5/2
0
09/1
9/2
0
10/0
3/2
0
10/1
7/2
0
10/3
1/2
0
11/1
4/2
0
11/2
8/2
0
12/1
2/2
0
12/2
6/2
0
01/0
9/2
1
01/2
3/2
1
02/0
6/2
1
02/2
0/2
1
03/0
6/2
1
03/2
0/2
1
04/0
3/2
1
04/1
7/2
1
05/0
1/2
1
05/1
5/2
1
05/2
9/2
1
1,0
00
to
ns
SoybeansWheatCorn3-year average
For the week ending May 29: 5 percent higher than last year and 49 percent higher than the 3-year average.

June 3, 2021
Grain Transportation Report 13
Figure 11
Source: U.S. Army Corps of Engineers.
Upbound empty barges transiting Mississippi River Locks 27, Arkansas River Lock
and Dam 1, and Ohio River Olmsted Locks and Dam
0
100
200
300
400
500
600
700
8005
/30
/20
6/1
3/2
0
6/2
7/2
0
7/1
1/2
0
7/2
5/2
0
8/8
/20
8/2
2/2
0
9/5
/20
9/1
9/2
0
10
/3/2
0
10/1
7/2
0
10
/31
/20
11/1
4/2
0
11
/28
/20
12/1
2/2
0
12
/26
/20
1/9
/21
1/2
3/2
1
2/6
/21
2/2
0/2
1
3/6
/21
3/2
0/2
1
4/3
/21
4/1
7/2
1
5/1
/21
5/1
5/2
1
5/2
9/2
1
Nu
mber
of
barg
es
MS Locks 27 AR Lock and Dam 1 Ohio Olmsted Locks and Dam
For the week ending May 29: 879 barges transited the locks, 161 barges more
than the previous week and 39 percent higher than the 3-year average.
Figure 12
Grain barges for export in New Orleans region
Note: Olmsted = Olmsted Locks and Dam.
Source: U.S. Army Corps of Engineers and USDA, Agricultural Marketing Service.
0
200
400
600
800
1,000
1,200
1,400
2/8
/20
2/2
2/2
0
3/7
/20
3/2
1/2
0
4/4
/20
4/1
8/2
0
5/2
/20
5/1
6/2
0
5/3
0/2
0
6/1
3/2
0
6/2
7/2
0
7/1
1/2
0
7/2
5/2
0
8/8
/20
8/2
2/2
0
9/5
/20
9/1
9/2
0
10
/3/2
0
10
/17/2
0
10
/31/2
0
11
/14/2
0
11
/28/2
0
12
/12/2
0
12
/26/2
0
1/9
/21
1/2
3/2
1
2/6
/21
2/2
0/2
1
3/6
/21
3/2
0/2
1
4/3
/21
4/1
7/2
1
5/1
/21
5/1
5/2
1
5/2
9/2
1
Downbound grain barges Locks 27, 1, and Olmsted
Grain barges unloaded in New Orleans
Nu
mber
of
barg
es
For the week ending May 29: 535 barges moved down river, 43 barges fewer than last week;
777 grain barges unloaded in New Orleans, 9 percent higher than the previous week.

June 3, 2021
Grain Transportation Report 14
The weekly diesel price provides a proxy for trends in U.S. truck rates as diesel fuel is a significant expense for truck grain move-
ments.
Truck Transportation
Table 11
Change from
Region Location Price Week ago Year ago
I East Coast 3.239 0.004 0.747
New England 3.165 0.015 0.550
Central Atlantic 3.414 0.008 0.748
Lower Atlantic 3.135 -0.002 0.786
II Midwest 3.197 -0.002 0.971
III Gulf Coast 3.027 -0.002 0.856
IV Rocky Mountain 3.377 0.015 1.037
V West Coast 3.762 0.011 0.862
West Coast less California 3.410 0.015 0.850
California 4.055 0.008 0.874
Total United States 3.255 0.002 0.8691Diesel fuel prices include all taxes. Prices represent an average of all types of diesel fuel.
Source: U.S. Department of Energy, Energy Information Administration.
Retail on-highway diesel prices, week ending 5/31/2021 (U.S. $/gallon)
Figure 13
Weekly diesel fuel prices, U.S. average
Source: U.S. Department of Energy, Energy Information Administration, Retail On-Highway Diesel Prices.
$3.255$2.386
$2.000
$2.100
$2.200
$2.300
$2.400
$2.500
$2.600
$2.700
$2.800
$2.900
$3.000
$3.100
$3.200
$3.300
$3.400
$3.500
11/3
0/20
20
12/7
/202
0
12/1
4/20
20
12/2
1/20
20
12/2
8/20
20
1/4/
2021
1/11
/202
1
1/18
/202
1
1/25
/202
1
2/1/
2021
2/8/
2021
2/15
/202
1
2/22
/202
1
3/1/
2021
3/8/
2021
3/15
/202
1
3/22
/202
1
3/29
/202
1
4/5/
2021
4/12
/202
1
4/19
/202
1
4/26
/202
1
5/3/
2021
5/10
/202
1
5/17
/202
1
5/24
/202
1
5/31
/202
1
$ pe
r ga
llon
Last year Current yearFor the week ending May 31, the U.S. average diesel fuel price increased 0.2 cents from the previous week to $3.255 per gallon, 86.9 cents above the same week last year.

June 3, 2021
Grain Transportation Report 15
Grain Exports
Table 13
Top 5 importers1 of U.S. corn
For the week ending 05/20/2021 Total commitments2 % change
Exports3
2021/22 2020/21 2019/20 current MY 3-yr. avg.
next MY current MY last MY from last MY 2017-19 - 1,000 mt -
Mexico 1,808 14,561 13,478 8 14,869
Japan 624 9,882 8,801 12 11,221
Columbia 0 3,666 3,811 (4) 4,830
Korea 0 3,399 2,171 57 4,011
China 10,744 22,996 1,266 1,716 909
Top 5 importers 13,177 54,503 29,528 85 35,840
Total U.S. corn export sales 14,628 68,577 39,838 72 49,983
% of projected exports 23% 97% 88%
Change from prior week2
5,691 556 427
Top 5 importers' share of U.S. corn
export sales 90% 79% 74% 72%
USDA forecast May 2021 62,341 70,611 45,242 56
Corn use for ethanol USDA forecast,
May 2021 132,080 126,365 123,368 21Based on USDA, Foreign Agricultural Service (FAS) marketing year ranking reports for 2019/20; marketing year (MY) = Sep 1 - Aug 31.
3FAS marketing year ranking reports (carryover plus accumulated export); yr. = year; avg. = average.
2Cumulative exports (shipped) + outstanding sales (unshipped), FAS weekly export sales report, or export sales query. Total commitments change (net sales) from prior week could include
revisions from previous week's outstanding sales or accumulated sales.
Note: A red number in parentheses indicates a negative number; mt = metric ton.
Source: USDA, Foreign Agricultural Service.
Table 12
U.S. export balances and cumulative exports (1,000 metric tons)
Wheat Corn Soybeans Total
For the week ending HRW SRW HRS SWW DUR All wheat
Export balances1
5/20/2021 461 155 542 388 29 1,574 19,440 4,275 25,289
This week year ago 995 175 1,122 705 43 3,041 12,171 6,719 21,931
Cumulative exports-marketing year 2
2020/21 YTD 8,268 1,713 7,229 6,241 654 24,104 49,137 57,244 130,486
2019/20 YTD 9,039 2,268 6,841 4,655 922 23,725 27,668 35,222 86,615
YTD 2020/21 as % of 2019/20 91 76 106 134 71 102 178 163 151
Last 4 wks. as % of same period 2019/20* 67 112 67 90 113 76 179 69 131
Total 2019/20 9,526 2,318 6,960 4,751 922 24,477 42,622 43,994 111,094
Total 2018/19 8,591 3,204 6,776 5,164 479 24,214 48,924 46,189 119,3271 Current unshipped (outstanding) export sales to date.
2 Shipped export sales to date; 2020/21 marketing year now in effect for wheat, corn, and soybeans.
Note: marketing year: wheat = 6/01-5/31, corn and soybeans = 9/01-8/31. YTD = year-to-date; wks. = weeks; HRW= hard red winter; SRW = soft red winter;
HRS= hard red spring; SWW= soft white wheat; DUR= durum.
Source: USDA, Foreign Agricultural Service.

June 3, 2021
Grain Transportation Report 16
Table 14
Top 5 importers1 of U.S. soybeans
For the week ending 5/20/2021 Total commitments2 % change
Exports3
2021/22 2020/21 2019/20 current MY 3-yr. avg.
next MY current MY last MY from last MY 2017-191,000 mt - - 1,000 mt -
China 3,082 35,703 14,745 142 19,106
Mexico 475 4,689 4,439 6 4,591
Egypt 0 2,777 3,000 (7) 2,980
Indonesia 1 2,098 1,772 18 2,360
Japan 74 2,133 2,208 (3) 2,288
Top 5 importers 3,632 47,401 26,163 81 31,324
Total U.S. soybean export sales 7,270 61,519 41,941 47 49,352
% of projected exports 13% 99% 92%
change from prior week2
248 56 644
Top 5 importers' share of U.S.
soybean export sales 50% 77% 62% 63%
USDA forecast, May 2021 56,540 62,125 45,831 1361Based on USDA, Foreign Agricultural Service (FAS) marketing year ranking reports for 2019/20; marketing year (MY) = Sep 1 - Aug 31.
Source: USDA, Foreign Agricultural Service.
3FAS marketing year ranking reports (carryover plus accumulated export); yr. = year; avg. = average.
2Cumulative exports (shipped) + outstanding sales (unshipped), FAS weekly export sales report, or export sales query. The total commitments change (net sales) from prior
week could include revisions from previous week's outstanding sales and/or accumulated sales.
Note: A red number in parentheses indicates a negative number; mt = metric ton.
Table 15
Top 10 importers1 of all U.S. wheat
For the week ending 05/20/2021 Total Commitments2 % change
Exports3
2021/22 2020/21 2019/20 current MY 3-yr. avg.
next MY current MY last MY from last MY 2017-19
1,000 mt - - 1,000 mt -
Mexico 544.9 3,690 3,854 (4) 3,213
Philippines 697.5 3,188 3,578 (11) 2,888
Japan 306.1 2,495 2,780 (10) 2,655
Nigeria 257 1,464 1,575 (7) 1,433
Korea 169.8 1,919 1,659 16 1,372
Indonesia 0 1,008 1,066 (5) 1,195
Taiwan 140.4 1,191 1,428 (17) 1,175
Thailand 0 814 878 (7) 727
Italy 0 617 947 (35) 622
Colombia 87.3 394 793 (50) 618
Top 10 importers 2,203 16,780 18,559 (10) 15,897
Total U.S. wheat export sales 3,951 25,678 26,766 (4) 23,821
% of projected exports 16% 98% 102%
change from prior week2
374 29 210
Top 10 importers' share of
U.S. wheat export sales 56% 65% 69% 67%
USDA forecast, May 2021 24,523 26,294 26,294 01 Based on USDA, Foreign Agricultural Service( FAS) marketing year ranking reports for 2019/20; Marketing year (MY) = Jun 1 - May 31.
Source: USDA, Foreign Agricultural Service.
3 FAS marketing year final reports (carryover plus accumulated export); yr. = year; avg. = average.
2 Cumulative exports (shipped) + outstanding sales (unshipped), FAS weekly export sales report, or export sales query. The total commitments change (net sales) from prior week could include revisions
from the previous week's outstanding and/or accumulated sales.
Note: A red number in parentheses indicates a negative number.
June 3, 2021
Grain Transportation Report 17
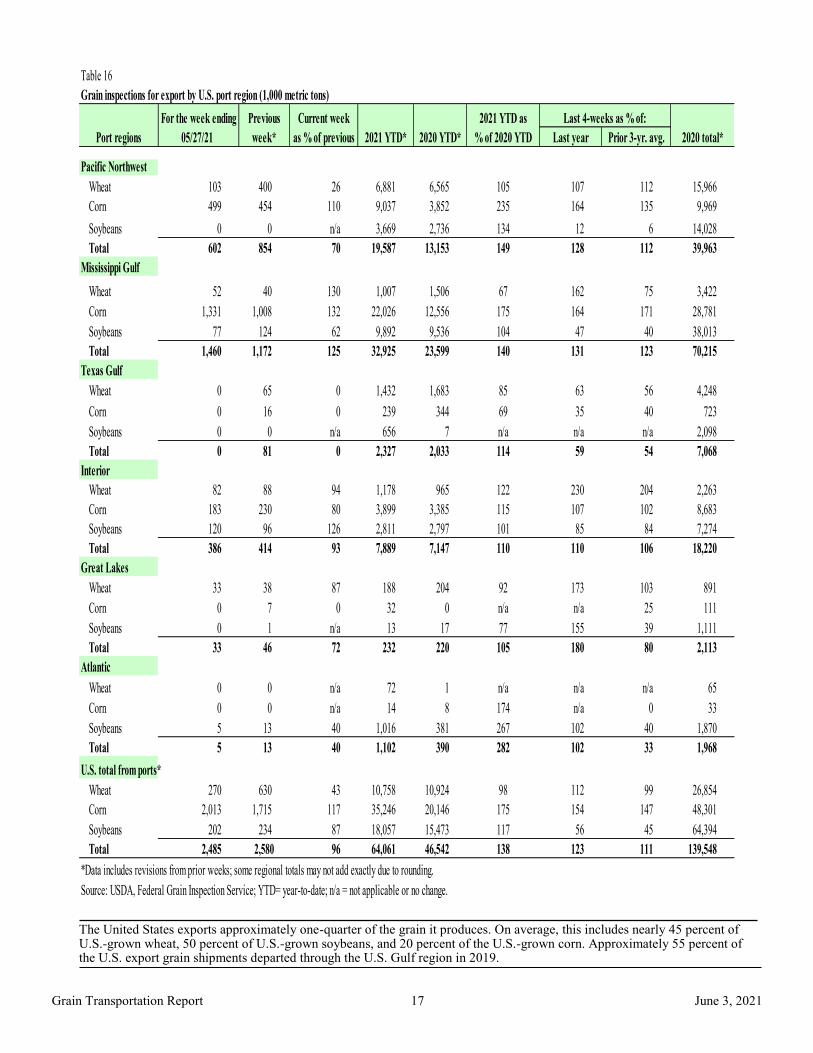
The United States exports approximately one-quarter of the grain it produces. On average, this includes nearly 45 percent of U.S.-grown wheat, 50 percent of U.S.-grown soybeans, and 20 percent of the U.S.-grown corn. Approximately 55 percent of the U.S. export grain shipments departed through the U.S. Gulf region in 2019.
Table 16
Grain inspections for export by U.S. port region (1,000 metric tons)
For the week ending Previous Current week 2021 YTD as
05/27/21 week* as % of previous 2020 YTD* % of 2020 YTD Last year Prior 3-yr. avg.
Pacific Northwest
Wheat 103 400 26 6,881 6,565 105 107 112 15,966
Corn 499 454 110 9,037 3,852 235 164 135 9,969
Soybeans 0 0 n/a 3,669 2,736 134 12 6 14,028
Total 602 854 70 19,587 13,153 149 128 112 39,963
Mississippi Gulf
Wheat 52 40 130 1,007 1,506 67 162 75 3,422
Corn 1,331 1,008 132 22,026 12,556 175 164 171 28,781
Soybeans 77 124 62 9,892 9,536 104 47 40 38,013
Total 1,460 1,172 125 32,925 23,599 140 131 123 70,215
Texas Gulf
Wheat 0 65 0 1,432 1,683 85 63 56 4,248
Corn 0 16 0 239 344 69 35 40 723
Soybeans 0 0 n/a 656 7 n/a n/a n/a 2,098
Total 0 81 0 2,327 2,033 114 59 54 7,068
Interior
Wheat 82 88 94 1,178 965 122 230 204 2,263
Corn 183 230 80 3,899 3,385 115 107 102 8,683
Soybeans 120 96 126 2,811 2,797 101 85 84 7,274
Total 386 414 93 7,889 7,147 110 110 106 18,220
Great Lakes
Wheat 33 38 87 188 204 92 173 103 891
Corn 0 7 0 32 0 n/a n/a 25 111
Soybeans 0 1 n/a 13 17 77 155 39 1,111
Total 33 46 72 232 220 105 180 80 2,113
Atlantic
Wheat 0 0 n/a 72 1 n/a n/a n/a 65
Corn 0 0 n/a 14 8 174 n/a 0 33
Soybeans 5 13 40 1,016 381 267 102 40 1,870
Total 5 13 40 1,102 390 282 102 33 1,968
U.S. total from ports*
Wheat 270 630 43 10,758 10,924 98 112 99 26,854
Corn 2,013 1,715 117 35,246 20,146 175 154 147 48,301
Soybeans 202 234 87 18,057 15,473 117 56 45 64,394
Total 2,485 2,580 96 64,061 46,542 138 123 111 139,548
*Data includes revisions from prior weeks; some regional totals may not add exactly due to rounding.
Source: USDA, Federal Grain Inspection Service; YTD= year-to-date; n/a = not applicable or no change.
Last 4-weeks as % of:
Port regions 2020 total*2021 YTD*
June 3, 2021
Grain Transportation Report 18
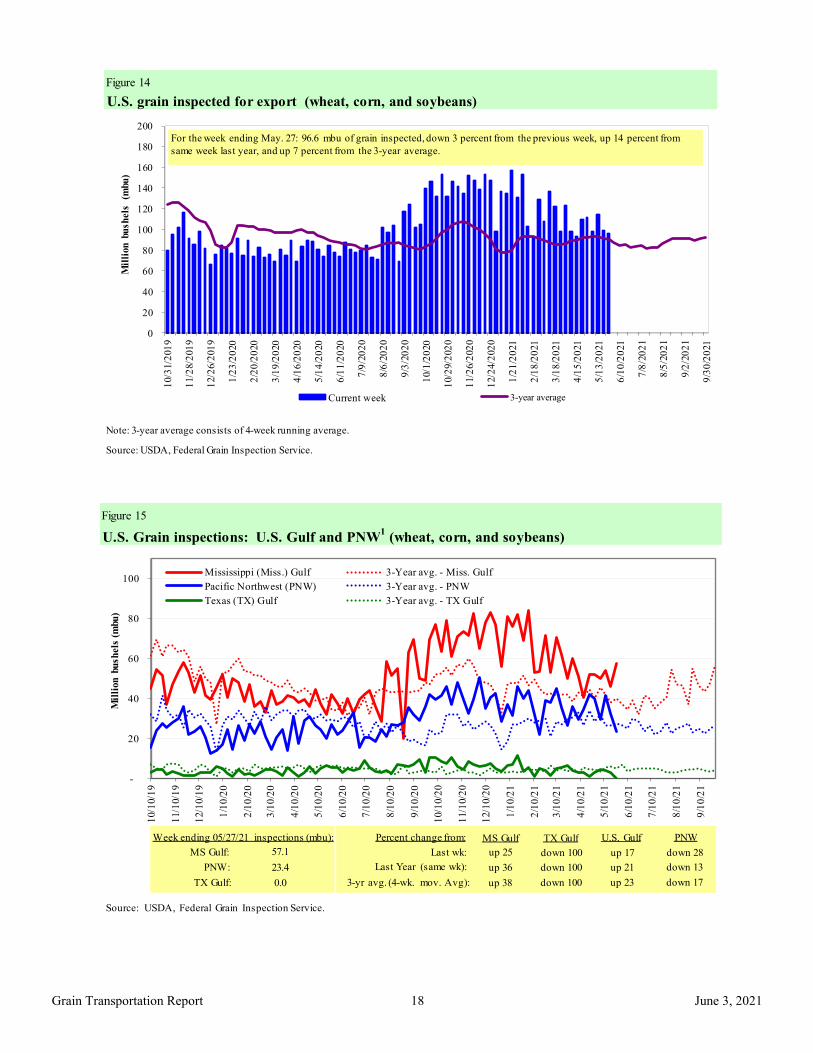
Figure 15
U.S. Grain inspections: U.S. Gulf and PNW1 (wheat, corn, and soybeans)
-
20
40
60
80
100
10/1
0/1
9
11/1
0/1
9
12/1
0/1
9
1/1
0/2
0
2/1
0/2
0
3/1
0/2
0
4/1
0/2
0
5/1
0/2
0
6/1
0/2
0
7/1
0/2
0
8/1
0/2
0
9/1
0/2
0
10/1
0/2
0
11/
10/
20
12/1
0/2
0
1/1
0/2
1
2/1
0/2
1
3/1
0/2
1
4/1
0/2
1
5/1
0/2
1
6/1
0/2
1
7/1
0/2
1
8/1
0/2
1
9/1
0/2
1
Mil
lion
bu
sh
els
(m
bu
)
Mississippi (Miss.) Gulf 3-Year avg. - Miss. Gulf
Pacific Northwest (PNW) 3-Year avg. - PNW
Texas (TX) Gulf 3-Year avg. - TX Gulf
Source: USDA, Federal Grain Inspection Service.
Last wk:
Last Year (same wk):
3-yr avg. (4-wk. mov. Avg):
MS Gulf TX Gulf U.S. Gulf PNW
up 25
up 36
up 38
down 100
down 100
down 100
up 17
up 21
up 23
down 28
down 13
down 17
Percent change from:Week ending 05/27/21 inspections (mbu):
MS Gulf:
PNW:
TX Gulf:
57.1
23.4
0.0
Figure 14
U.S. grain inspected for export (wheat, corn, and soybeans)
Note: 3-year average consists of 4-week running average.
Source: USDA, Federal Grain Inspection Service.
0
20
40
60
80
100
120
140
160
180
200
10/3
1/2
01
9
11/2
8/2
01
9
12/2
6/2
01
9
1/2
3/2
020
2/2
0/2
020
3/1
9/2
020
4/1
6/2
020
5/1
4/2
020
6/1
1/2
020
7/9
/20
20
8/6
/20
20
9/3
/20
20
10/1
/20
20
10/2
9/2
02
0
11/2
6/2
02
0
12/2
4/2
02
0
1/2
1/2
021
2/1
8/2
021
3/1
8/2
021
4/1
5/2
021
5/1
3/2
021
6/1
0/2
021
7/8
/20
21
8/5
/20
21
9/2
/20
21
9/3
0/2
021
Mil
lion
bu
sh
els
(m
bu
)
Current week 3-year average
For the week ending May. 27: 96.6 mbu of grain inspected, down 3 percent from the previous week, up 14 percent from
same week last year, and up 7 percent from the 3-year average.
June 3, 2021
Grain Transportation Report 19
Ocean Transportation
Figure 16
U.S. Gulf1 vessel loading activity
0
10
20
30
40
50
60
70
80
11/1
2/2
02
0
11/1
9/2
02
0
11/2
6/2
02
0
12/0
3/2
02
0
12/1
0/2
02
0
12/1
7/2
02
0
12/2
4/2
02
0
12/3
1/2
02
0
01/0
7/2
02
1
01/1
4/2
02
1
01/2
1/2
02
1
01/2
8/2
02
1
02/0
4/2
02
1
02/1
1/2
02
1
02/1
8/2
02
1
02/2
5/2
02
1
03/0
4/2
02
1
03/1
1/2
02
1
03/1
8/2
02
1
03/2
5/2
02
1
04/0
1/2
02
1
04/0
8/2
02
1
04/1
5/2
02
1
04/2
2/2
02
1
04/2
9/2
02
1
05/0
6/2
02
1
05/1
3/2
02
1
05/2
0/2
02
1
05/2
7/2
02
1
Nu
mb
er o
f ves
sels
Loaded last 7 days Due next 10 days Loaded 4-year average
1U.S. Gulf includes Mississippi, Texas, and East Gulf.Source:USDA, Agricultural Marketing Service.
For the week ending May 27 Loaded Due Change from last year -15.4% -9.5%
Change from 4-year average 7.3% -23.6%
Table 17
Weekly port region grain ocean vessel activity (number of vessels)
Pacific
Gulf Northwest
Loaded Due next
Date In port 7-days 10-days In port
5/27/2021 23 33 38 14
5/20/2021 30 29 42 13
2020 range (22…60) (23...46) (34...68) (7…24)
2020 average 37 33 49 15
Note: n/a = not available due to holiday.
Source: USDA, Agricultural Marketing Service.
June 3, 2021
Grain Transportation Report 20
Figure 17
Grain vessel rates, U.S. to Japan
Note: PNW = Pacific Northwest
Source: O'Neil Commodity Consulting
0
10
20
30
40
50
60
70M
ay '1
9
Jul
'19
Sep
'19
Nov
'19
Jan
'20
Mar
'20
May
'20
Jul
'20
Sep
'20
Nov
'20
Jan
'21
Mar
'21
May
'21
U.S
. $
/metr
ic t
on
Spread U.S. Gulf vs. PNW to Japan Rate U.S. Gulf to Japan Rate PNW to Japan
U.S. Gulf PNW Spread
Ocean rates May '21 $66.00 $38.63 $27.37
Change from May '20 92.4% 115.3% 67.2%
Change from 4-year average 66.3% 80.9% 49.3%
Table 18
Ocean freight rates for selected shipments, week ending 05/29/2021
Export Import Grain Loading Volume loads Freight rate
region region types date (metric tons) (US$/metric ton)
U.S. Gulf Japan Heavy grain Aug 21/Sep 9 50,000 60.90
U.S. Gulf Japan Heavy grain Jul 1/15 50,000 64.10
U.S. Gulf Japan Grain May 25/Jun 25 50,000 46.85 op 47.85
U.S. Gulf Japan Wheat May 1/15 31,877 58.33
U.S. Gulf Japan Wheat May 1/14 47,405 67.50
U.S. Gulf Japan Heavy grain Apr 15/May 15 50,000 47.00
U.S. Gulf Japan Heavy grain Apr 1/30 48,000 46.75
U.S. Gulf China Heavy grain Apr 14/29 68,000 63.50
U.S. Gulf Sudan Wheat May 20/30 48,000 112.75*
PNW Japan Wheat Jul 16/31 30,250 64.35
PNW Japan Wheat Jun 5/15 50,600 49.30
PNW Japan Grain Mar 5/14 28,000 48.10
PNW Yemen Wheat Jun 10/20 22,230 132.25*
PNW Taiwan Wheat May 29/Jun 12 45,665 48.00
PNW Taiwan Corn Feb 20/Mar 15 65,000 24.90
Brazil China Heavy grain Mar 21/31 66,000 44.00
Brazil China Heavy grain Mar 21/30 66,000 45.50
River Plate S. Korea Corn May 1/31 68,000 52.60**50 percent of food aid from the United States is required to be shipped on U.S.-flag vessels.
op = option.
Source: Maritime Research, Inc.
Note: Rates shown are per metric ton (2,204.62 lbs. = 1 metric ton), free on board (F.O.B), except where otherwise indicated;

June 3, 2021
Grain Transportation Report 21
In 2019, containers were used to transport 9 percent of total U.S. waterborne grain exports. Approximately 60 percent of U.S. wa-terborne grain exports in 2019 went to Asia, of which 14 percent were moved in containers. Approximately 94 percent of U.S. wa-terborne containerized grain exports were destined for Asia.
Figure 18
Source: USDA, Agricultural Marketing Service, Transportation Services Division analysis of PIERS data.
Note: The following Harmonized Tariff Codes are used to calculate containerized grains movements: 1001, 100190, 1002, 1003 100300, 1004,
100400, 1005, 100590, 1007, 100700, 1102, 110100, 230310, 110220, 110290, 1201, 120100, 230210, 230990, 230330, 120810, and 120190.
Top 10 destination markets for U.S. containerized grain exports, Jan-Dec 2020
Taiwan
20%
Indonesia
16%
Vietnam
13%
Korea
10%Thailand
8%
China
7%
Malaysia
6%
Japan
4%
Philippines
3%Singapore
2%
Other
11%
Figure 19
Monthly shipments of containerized grain to Asia
Source: USDA, Agricultural Marketing Service, Transportation Services Division analysis of PIERS data.
Note: The following Harmonized Tariff Codes are used to calculate containerized grains movements: 100190, 100200, 100300, 100400, 100590, 100700, 110100, 110220,
110290, 1201, 120100, 120190, 120810, 230210, 230310, 230330, and 230990.
05
1015202530354045505560657075808590
Jan
.
Feb
.
Mar.
Apr.
May
Jun
.
Jul.
Aug
.
Sep
.
Oct
.
Nov
.
Dec
.
Th
ou
san
d 2
0-f
t-eq
uiv
ale
nt
un
its
2019
2020
5-Year Average
Dec 2020: up 41% from last year and 59% higher than the 5-year average.

June 3, 2021
Grain Transportation Report 22
Coordinators Surajudeen (Deen) Olowolayemo [email protected] (202) 720 - 0119 Maria Williams [email protected] (202) 690 - 4430 Bernadette Winston [email protected] (202) 690 - 0487 Matt Chang [email protected] (202) 720 - 0299
Grain Transportation Indicators Surajudeen (Deen) Olowolayemo [email protected] (202) 720 - 0119
Rail Transportation Johnny Hill [email protected] (202) 690 - 3295 Jesse Gastelle [email protected] (202) 690 - 1144 Peter Caffarelli [email protected] (202) 690 - 3244
Barge Transportation April Taylor [email protected] (202) 720 - 7880 Bernadette Winston [email protected] (202) 690 - 0487 Matt Chang [email protected] (202) 720 - 0299 Truck Transportation April Taylor [email protected] (202) 720 - 7880 Kranti Mulik [email protected] (202) 756 - 2577 Matt Chang [email protected] (202) 720 - 0299
Grain Exports Johnny Hill [email protected] (202) 690 - 3295 Kranti Mulik [email protected] (202) 756 - 2577 Ocean Transportation Surajudeen (Deen) Olowolayemo [email protected] (202) 720 - 0119 (Freight rates and vessels) April Taylor [email protected] (202) 720 - 7880 (Container movements)
Editor Maria Williams [email protected] (202) 690-4430 Subscription Information: Please sign up to receive regular email announcements of the latest GTR issue by entering your email address here and selecting your preference to receive Transportation Research and Analysis. For any other infor-mation, you may contact us at [email protected]
Preferred citation: U.S. Department of Agriculture, Agricultural Marketing Service. Grain Transportation Report. June 3, 2021. Web: http://dx.doi.org/10.9752/TS056.06-03-2021
Contacts and Links
In accordance with Federal civil rights law and U.S. Department of Agriculture (USDA) civil rights regulations and policies, the USDA, its Agencies, offices, and employees, and institutions participating in or administering USDA programs are prohibited from discriminating based on race, color, national origin, religion, sex, gender identity (including gender expression), sexual orientation, disability, age, marital status, family/parental status, income derived from a public assistance program, political beliefs, or reprisal or retaliation for prior civil rights activity, in any program or activity conducted or funded by USDA (not all bases apply to all programs). Remedies and complaint filing deadlines vary by pro-gram or incident. Persons with disabilities who require alternative means of communication for program information (e.g., Braille, large print, audiotape, American Sign Language, etc.) should contact the responsible Agency or USDA's TARGET Center at (202) 720-2600 (voice and TTY) or contact USDA through the Federal Relay Service at (800) 877-8339. Additionally, program information may be made available in languages other than English. To file a program discrimination complaint, complete the USDA Program Discrimination Complaint Form, AD-3027, found online at How to File a Program Discrimination Complaint and at any USDA office or write a letter addressed to USDA and provide in the letter all of the infor-mation requested in the form. To request a copy of the complaint form, call (866) 632-9992. Submit your completed form or letter to USDA by: (1) mail: U.S. Department of Agriculture, Office of the Assistant Secretary for Civil Rights, 1400 Independence Avenue, SW, Washington, D.C.