Embed Size (px)
Citation preview

緯穎 (6669) 興櫃掛牌前法人說明會
Wiwynn Corporation
2017.11.02

2
Mainly owned by Wistron Corp.
Established on April 2, 2012
Cloud Service
A Value Partner for Customers
in Cloud Service Business

Workload Performance
Total Cost of Ownership=Customer
Value”Provide Best TCO, Workload Optimized
IT Solutions for Data Center”
Mission

Source: Mario Morales, IDC
The World in
Explosive Growth of
Data Center

WW Cloud IT Infrastructure Market Forecast by Deployment Type
$32B $63B2015: $99.4B
Off PremisesCloud 25%
On
Pre
mis
es
8%
On
Pre
mis
es
Clo
ud
13
%
Off PremisesCloud 40%
Source: IDC Quarterly Cloud Infrastructure Tracker, Jan 2017
2020: $119.3B

ODM Direct –New Business Model Enabled by Cloud Service
Cloud Service
Enter-priseSolution + ServiceODM ChannelBrand Product Product
Solution + Service
Value AddedPartner
Technology +Platform
Technology + Platform + ServiceCloud
SPUser
HPC e-Commerce
HostingGaming

Actively Proposing Workload Optimum Platform
Computing Intensive
I/OIntensive
StorageIntensive

Promoting Wiwynn by Devoting into OCP Community
Wiwynn is an OCP Platinum member and a qualified Solution
Provider, actively participating OCP Summit since 2010.
OCP is an organization that shares designs of data center products.
4 out of top 7 cloud service providers are OCP platinum members.
13
6 Platform Design Contributions
OCP Accepted Products

Wiwynn Footprints Shanghai, ChinaWiwynn Technology Service (China)
Taipei, Taiwan (HQ)Wiwynn Corporation
Zhongshan, China
Brno, Czech Republic
Tokyo, JapanWiwynn Technology Service (Japan)
San Francisco, USAWiwynn International Corporation
Juarez, Mexico


APAC
CZECH
America
MEXICO
Europe
CHINA
Regions

CZECH
MEXICO
Vienna
London
Cardiff
Dublin
LuleåVantaa
AmsterdamFrankfurt
Paris
Jakarta
Singapore
Ho Chi Minh
Hong Kong
Manila
TokyoSeoul
Osaka
Prineville
SterlingAshburn
Boydton
Santa Clara
Dallas
Chicago
QuincyCheyenneDes Moines
Chandler
San Antonio
San Diago
QuebecToronto
Sacramento
Aurora
Quincy
Brazil
CHINA
RegionsGlobal Locations
Cities

Manila
Vienna
London
Cardiff
Dublin
LuleåVantaa
TokyoSeoul
Prineville
Amsterdam
JakartaSingapore
Ho Chi Minh
Hong Kong
Sterling
Ashburn
Boydton
Santa Clara
Dallas
Chicago
QuincyCheyenne
Des Moines
ChandlerSan Antonio
Campinas
Fortaleza
FrankfurtLeipzig-Halle
Osaka
Paris
Phoenix
Busan
San Diago
QuebecToronto
Charlotte
Rio de Janeiro
Sacramento
Altanta
Aurora
Quincy
RegionsGlobal Locations
Data Centers in the World
Data Centers

Wiwynn Business Model Evolution
Next GenerationSoftware Defined Data Center
Software Defined Resource
Data Center Revolution
ODM Direct Rack InfrastructureDeliver to 88 Datacenters

Wiwynn Business Model Evolution
Rack InfrastructureDeliver to 88 Datacenters
Next GenerationSoftware Defined Data Center
Software Defined Resource
Power Efficiency
Resource Utilization
Computing Accelerator

Power Efficiency
System Optimization for Power Efficiency
Applications
System Design 1
Fine TuningConventional
Efficiency
Temperature
2
Power Solutions 12V / 48V
3

Flexible Computing Accelerator
High TFLOPS
Support Standard PCIe devices
Various devices to Host Ratios
Efficient Thermal Solution
A Flexible and Scalable Compute Accelerator
for Various Al Applications.

Disaggregated and Composable Rack Solution
Software Defined Resources Based on

CLOUD SERVICE
Software Defined Data Center
BIG DATAANALITYCS
AILogical
Infrastructure
Optimize for Workload
Scale Up Dynamically
Logical Infrastructure
Logical InfrastructurePhysical Infrastructure
Disaggregated and Composable Rack Solution

Finance
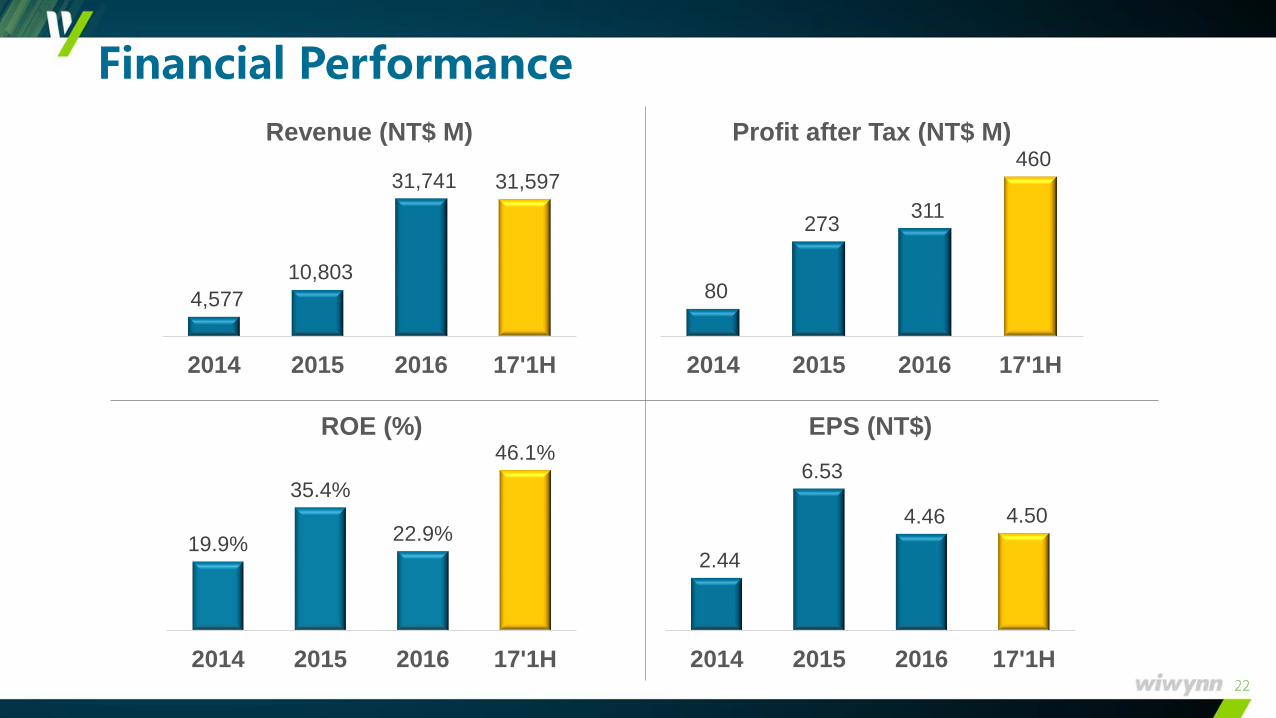
Financial Performance
4,577
10,803
31,741 31,597
2014 2015 2016 17'1H
Revenue (NT$ M)
80
273 311
460
2014 2015 2016 17'1H
Profit after Tax (NT$ M)
19.9%
35.4%
22.9%
46.1%
2014 2015 2016 17'1H
ROE (%)
2.44
6.53
4.46 4.50
2014 2015 2016 17'1H
EPS (NT$)

Shareholder Structure and Dividend
2014 2015 2016
Stock dividend (NT$) 1.50 4.00 1.49
Cash dividend (NT$) - 0.50 0.99
Diluted EPS (NT$) 2.37 6.26 4.16
Total dividend payout % 63.3% 71.9% 59.6%
Cash dividend payout % 0.0% 8.0% 23.8%
78% 77%60% 60%
-
20
40
60
80
100
120
2014 2015 2016 17'1H
Com
mon S
hare
s (
M)
Non-Wistron
Wistron