Embed Size (px)
Citation preview
WJEC LEVEL 1/2 AWARD IN SCIENCE FOR WORK
Unit Specific Teacher Guidance
Unit 3 Scientific Detection
The examples below are formative activities which can be incorporated into the delivery of this unit. The activities promote a holistic approach to unit delivery rather than addressing individual Learning Outcomes or Assessment Criteria. You can use these activities to create a scheme of work to suit your centre, your learners and the local context .
The activities below do not attempt to cover all the learning required for this unit and teachers must refer to the unit to ensure all learning outcomes and assessment criteria have been covered before learners undertake the controlled assessment for this unit. A time frame is estimated for each set of activities but centres should always check that the time suggested for learners to complete activities is appropriate for the learners in their group.
Centres are under no obligation to use the suggested activities and may develop their own approach to delivering the unit.
Health and safety
It is the responsibility of the school to undertake risk assessments on all laboratory work either undertaken by learners or carried out as demonstrations.
It is good practice to complete trial the activity before giving it to learners.
Nov 2013
A1 Introduction to the unit
Overall aimTo ensure that learners develop a sound awareness and understanding of all the learning outcomes for this unit. To introduce some of the initial concepts related to analytical investigations.
Guided Learning Hours (GLHs) to complete these activities For both activity 1, 2 and 3, a maximum of 3 hours.
Suggested Activities
The Problem of dead fishActivity 11. Show learners PowerPoint presentation ‘The problem of dead fish’(Obtainable from WJEC Pathways Applied Science website). Discuss possible causes of pollution.
2. (a) Learners produce a flame test chart for metals. Practical activity (see appendix; Activity 1.2 resources)
(b) Metals, metal ions and pollution.Learners in groups of two: Learner 1 reads article on ‘heavy metal pollution’ and summarises article to learner 2. Learner 2 reads ‘Metals and metal ions’ and summarises article to learner 1Learners complete metal ions and periodic table worksheet independently
3. Learners test water from different sampling points in the river and make evidence based conclusion. (see appendix; Activity 1.3 resources)
Activity 2A white powder has been found in a drum abandoned by the side of the road. Learners follow simple chemical tests to identify the powder.
It is advisable to carry out a number of simple scenarios of this nature to familiarise learners with a range of chemical tests.
Activity 3Chemical formulaeLearners are introduced to chemical formulae.Learners should be able to define elements and compounds from KS3, and be able to say that elements are found on the periodic table. Learners could play element bingo to familiarise them with element symbols (http://education.jlab.org/beamsactivity/6thgrade/elementbingo/index.html) Learners should also understand that compounds can also be represented by chemical formulae. Learners should be given rules on writing the formula of compounds. In most cases this can be restricted to writing the formulae from the formulae of ions making up the compound. The
1
periodic table and the sheet of important chemical formulae found in the model assessment should be given to learners to help them in this task.Learners could be given information sheets in
Learners could also ‘mix and match’ formulae of simple ions, acids etc to names (e.g. http://www.chemicalformula.org/chemistry-games/mix-and-match-chemical-formula)
Note. At this point learners could be introduced to the idea of chemical equations. They should be able to write word equations and balanced chemical equations from word equations for simple reactions.
2
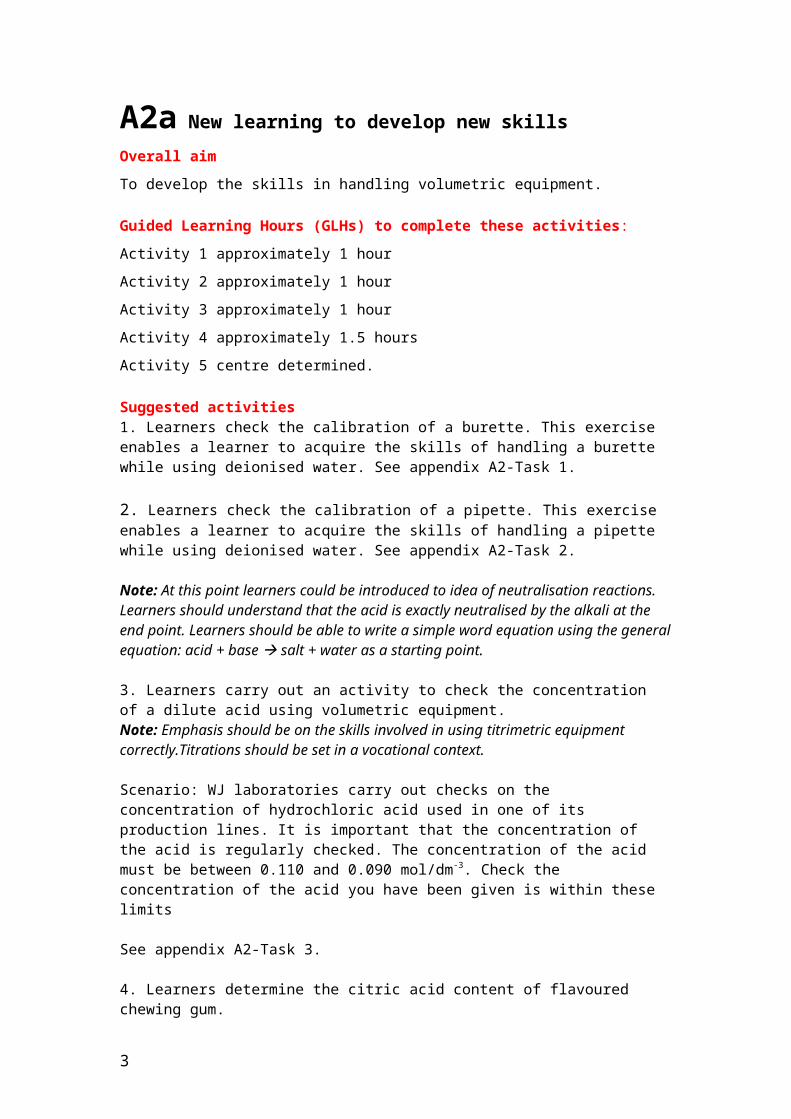
A2a New learning to develop new skillsOverall aim To develop the skills in handling volumetric equipment.
Guided Learning Hours (GLHs) to complete these activities: Activity 1 approximately 1 hour Activity 2 approximately 1 hour Activity 3 approximately 1 hourActivity 4 approximately 1.5 hoursActivity 5 centre determined.
Suggested activities1. Learners check the calibration of a burette. This exercise enables a learner to acquire the skills of handling a burette while using deionised water. See appendix A2-Task 1.
2. Learners check the calibration of a pipette. This exercise enables a learner to acquire the skills of handling a pipette while using deionised water. See appendix A2-Task 2.
Note: At this point learners could be introduced to idea of neutralisation reactions. Learners should understand that the acid is exactly neutralised by the alkali at the end point. Learners should be able to write a simple word equation using the general equation: acid + base salt + water as a starting point.
3. Learners carry out an activity to check the concentration of a dilute acid using volumetric equipment. Note: Emphasis should be on the skills involved in using titrimetric equipment correctly.Titrations should be set in a vocational context.
Scenario: WJ laboratories carry out checks on the concentration of hydrochloric acid used in one of its production lines. It is important that the concentration of the acid is regularly checked. The concentration of the acid must be between 0.110 and 0.090 mol/dm-3. Check the concentration of the acid you have been given is within these limits
See appendix A2-Task 3.
4. Learners determine the citric acid content of flavoured chewing gum.
See appendix A2 – Task 4NOTE: It is not necessary to write a balanced chemical equation for the reaction of citric acid at either level 1 or 2!
5. Further titrations set in a vocational setting could also be used.
3

A2b Activity to develop new skills
Overall aim To develop the skills for carrying out chromatography.
Guided Learning Hours (GLHs) to complete these activities:
Suggested activities
1. Learners can be introduced to how chromatography can be used to analyse the dyes used in food production e.g. of sweets. The FSA carry out analysis of foods for ‘illegal dyes’. The webpage article at http://www.food.gov.uk/news/newsarchive/2006/dec/illegaldyes could be used to introduce the need for regulators to monitor food for dyes. Another article that could be used as part of an introduction is http://www.guardian.co.uk/society/2005/may/06/food.foodanddrink Learners could then carry out investigate the dyes in coloured sweets such as M&M’S® using paper chromatography.
The experiment in appendix A3-Task 1 is based upon an experiment that can be also found at practical chemistry.org http://www.practicalchemistry.org/experiments/chromatography-of-sweets,194,EX.html
2. Learners are presented with a ‘forensic problem’. A ‘ransom’ note written in ink has been left at a crime scene. This can be analysed for evidence that can be used against the criminal. This can be used as a method to introduce the concept and procedure involved in paper chromatography. There are many scenarios that can be used or adapted from the internet. Examples of sites using paper chromatography:
http://www.google.co.uk/url?sa=t&source=web&cd=27&ved=0CEEQFjAGOBQ&url=http%3A%2F%2Facademic.ursinus.edu%2Fscienceinmotion%2FExperiments%2FExperimentWordDocs%2Fchromatog%2FTLC%2520of%2520Lipstick%2520Lab.doc&ei=u3UuTpj7LIa08QPskY1i&usg=AFQjCNErPVyt2uaBb1owOvURTXlRvc_5Vg&sig2=Df0peHqxVcsl3m_Yay5rxw
http://www.msichicago.org/fileadmin/Education/learninglabs/lab_downloads/EvidenceLab_ink_act.pdf
3. Learners should be introduced to modern methods of chromatography (gas-liquid chromatography, high performance liquid chromatography) that can detect very small amounts of chemicals.Pesticide residues in water are monitored by the Drinking Water Inspectorate (DWI). The DWI checks that the water companies in England and Wales supply safe water to drink and meet the standards set in the Water Quality Regulations, which include standards for pesticides. They also investigate complaints from consumers and incidents which affect or could affect drinking water quality. HPLC and GC could be introduced in the context of the work done by DWI
4
The appendix ‘A3- GC and HPLC background for Teachers’ gives some further information into what is relevant to learners on a level 2 course.
The appendix A3-task 3 describes work of DWI in analysing for pesticides
Learners now analyse water samples for a organochlorine pesticide using gas chromatogram traces from various water samples see appendix A3- Task 3 (lindane task)
5
A3 Consolidation of knowledge and understandingOverall aim To draw together learning for this unit by using analytical skills to solve problems in a variety of contexts
Guided Learning Hours (GLHs) to complete these activities For activities 1, 2 and 3 approximately 3 hours each. Level 1 learners will not need to carry out all parts of the activities and therefore the learning may be completed in less time
Suggested Activities
1. A scientist working in a quality control laboratory of a local industry could be invited to talk about their work and the techniques they use to monitor the quality of the chemicals they use and products they produce. For example, a scientist could speak about the monitoring of foods for ‘chemical‘ additives; a scientist from oil refinery could speak about how they monitor chemical processes. This could be followed up by simulating the quality control process by setting a scenario to the students.e.g. Learners could carry out quality control on ‘Scale-Busters’ scale removing product. This contains hydrochloric acid which should be no more than 10 % hydrochloric acid (Safety: It is suggested that samples of the acid are diluted in advance for learner use). Learners could then carry out an acid-base titration to determine whether a batch of the product is ‘within specification’.
2. A police officer or a Scene of Crime Officer could be invited to speak about how forensic evidence is collected and examined from a crime scene. They could be asked to focus on issues such as how they avoid contamination of evidence and make decisions about the methods used to test evidence. This could lead to a discussion about the limitations of forensic evidence and its suitability for purpose in a court case. This could be followed up by learners presenting forensic evidence before a mock jury. This evidence could be in the form of the analysis of samples collected from a crime scene. Each team is supplied with information about samples collected from the crime scene (e.g. analysis powders, chromatograms, DNA evidence etc). They would need to interpret the results of the analytical data. Two different teams, one for the prosecution and the other the defense, could provide ‘expert‘ opinion to a Jury in a mock case where the interpretation of forensic evidence is critical. A representative of the Forensic Service could attend the ‘trial‘ and comment on the quality of evidence presented.
6
3. Pollution incidentAn Environmental Officer from the Environmental Agency could be invited to speak about their work. They should focus on they monitor water purity and investigate pollution incidents. They could explain how they safely take representative samples from a stream/river and how they analyse it at the laboratory. They could discuss how evidence is collected to find out information about the nature of a pollution incident. The learners could then be presented with a scenario where they would need to use their analytical skills to solve a pollution incident.Possible scenario: Five drums have been found dumped by a small fish pond. One of them contains a white powder which does not appear to have leaked from the container. The other drum is nearly empty but still contains a solution, believed to be hydrochloric acid. The contents of this drum appear to have leaked into the pond. The fish in the pond have all died. You are required to carry out tests on the white powder to determine what it is. You also are required to test the solution to confirm it is hydrochloric acid. You are also required to check its concentration.Samples of the white solid and solution are provided. You also need to confirm that the pond has been polluted by the drum believed to contain hydrocloric acid.In small groups, learners work out a method to solve the problems. Learners should have access to ‘analytical information for candidates’ to help in this activity. Groups then discuss with a class as whole their ideas on solving the problems. At this point the teacher may wish to direct the learners as to the best way to tackle the problem.
Learners then carry out the investigation reporting their work in a simple report.
Further sources of supportThe unit specification gives a list of useful websites to support the delivery of this unit. A model assignment is also available for this unit.
7

Unit 3: Resources for Activities
8
Health and safety
It is the responsibility of the school to undertake risk assessments on all laboratory work either undertaken by learners or carried out as demonstrations
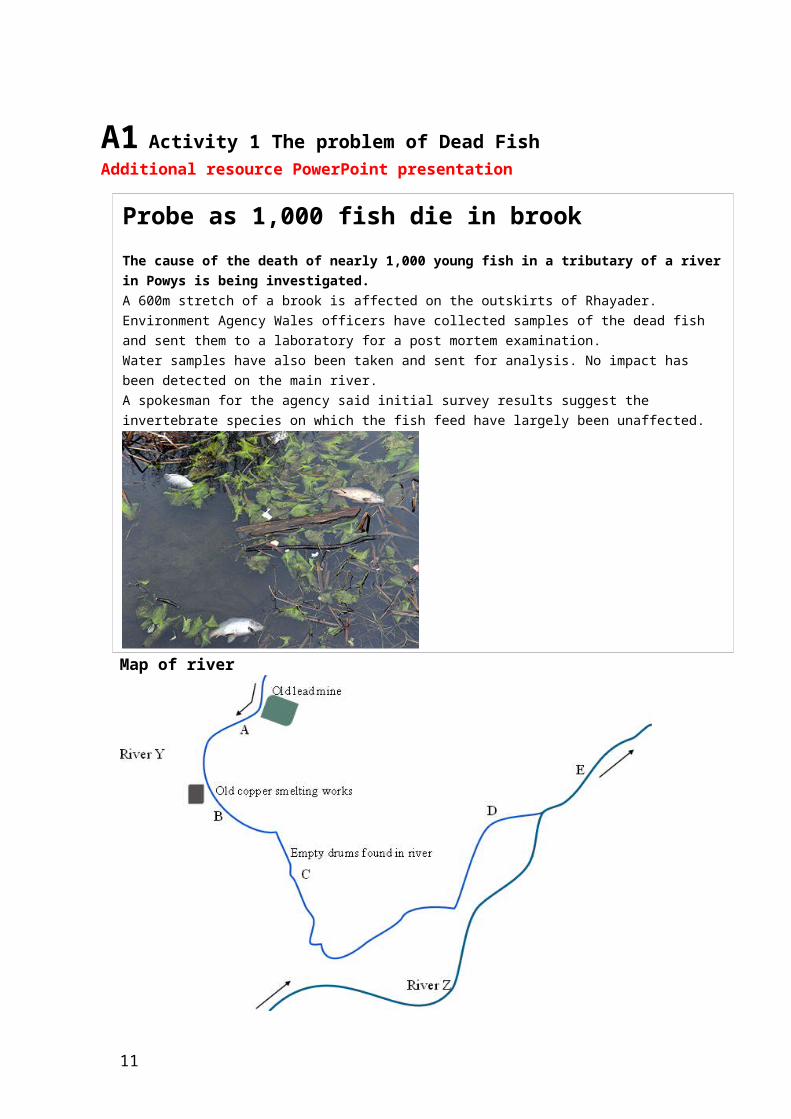
A1 Activity 1 The problem of Dead Fish Additional resource PowerPoint presentation
Probe as 1,000 fish die in brookThe cause of the death of nearly 1,000 young fish in a tributary of a river in Powys is being investigated. A 600m stretch of a brook is affected on the outskirts of Rhayader. Environment Agency Wales officers have collected samples of the dead fish and sent them to a laboratory for a post mortem examination. Water samples have also been taken and sent for analysis. No impact has been detected on the main river. A spokesman for the agency said initial survey results suggest the invertebrate species on which the fish feed have largely been unaffected.
Anyone with information is asked to call the Environment Agency hotline
Map of river
9
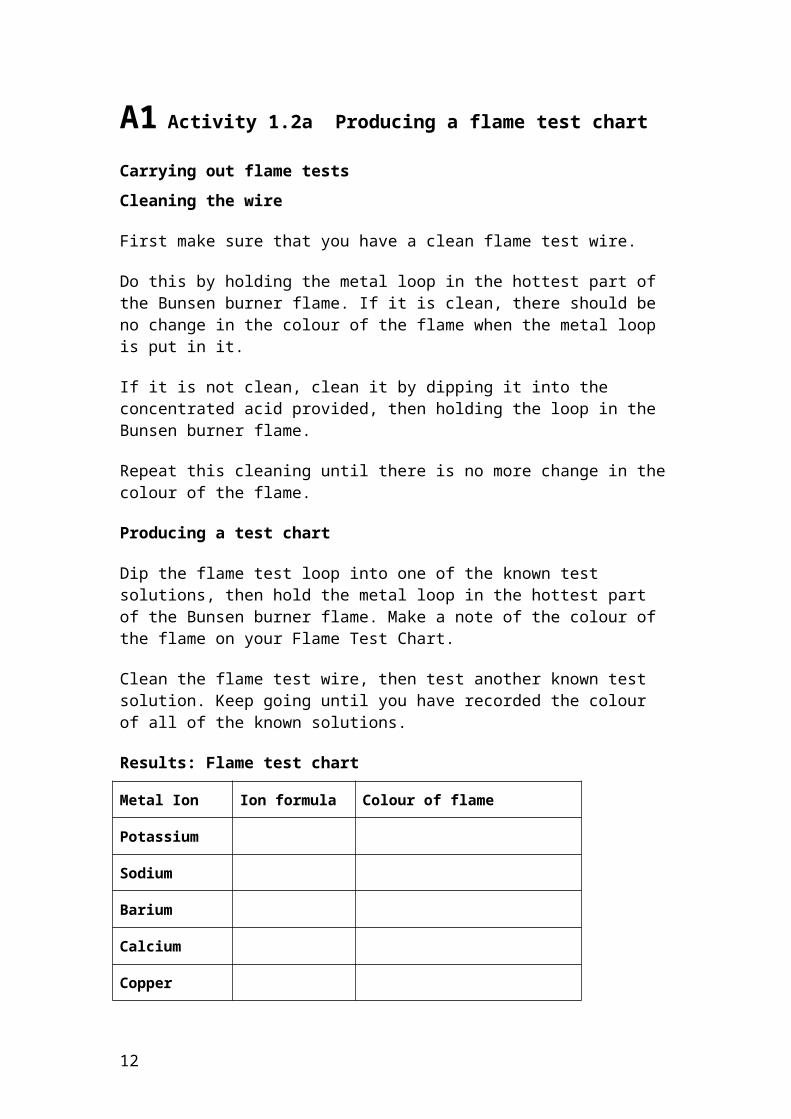
A1 Activity 1.2a Producing a flame test chart
Carrying out flame testsCleaning the wire
First make sure that you have a clean flame test wire.
Do this by holding the metal loop in the hottest part of the Bunsen burner flame. If it is clean, there should be no change in the colour of the flame when the metal loop is put in it.
If it is not clean, clean it by dipping it into the concentrated acid provided, then holding the loop in the Bunsen burner flame.
Repeat this cleaning until there is no more change in the colour of the flame.
Producing a test chart
Dip the flame test loop into one of the known test solutions, then hold the metal loop in the hottest part of the Bunsen burner flame. Make a note of the colour of the flame on your Flame Test Chart.
Clean the flame test wire, then test another known test solution. Keep going until you have recorded the colour of all of the known solutions.
Results: Flame test chart
Metal Ion Ion formula Colour of flame
Potassium
Sodium
Barium
Calcium
Copper
Lead
10
A1 Information sheet: Metals, metal ions and pollution
Heavy metal pollution
Mine closed before World War I
Heavy metals can contaminate rivers and cause serious environmental harm. Heavy metals may enter rivers in a number of different ways.
Sources of metals includes run off from old mine works. There are many examples of old metal mines that can still affect rivers today. Many of these mines are now closed but can still pollute rivers today. The River Rheidol in west Wales had a major series of lead mines in its headwaters until the end of the 19th century and its mine discharges and waste tips remain to this day. Lead is highly toxic to freshwater organisms and to humans if the water is used as drinking water. Lead pollution is not visible to the naked eye. The effects of silver and lead mining in the 17th and 18th centuries on the River Ystwyth headwaters still causes unacceptably high levels of Zinc and Lead in the river water right down to where it joins with the sea. Silver is very toxic even at very low concentrations but leaves no visible of its contamination. Copper is also acutely toxic to many freshwater organisms, especially algae, at very low concentrations and significant concentration in river water may have serious adverse effects on the local ecology. Copper mining in the Swansea valley caused much contamination of ground water up to recently.
Heavy metals can also enter rivers by other means e.g. illegal dumping of waste, the accidental discharge of industrial waste.
11
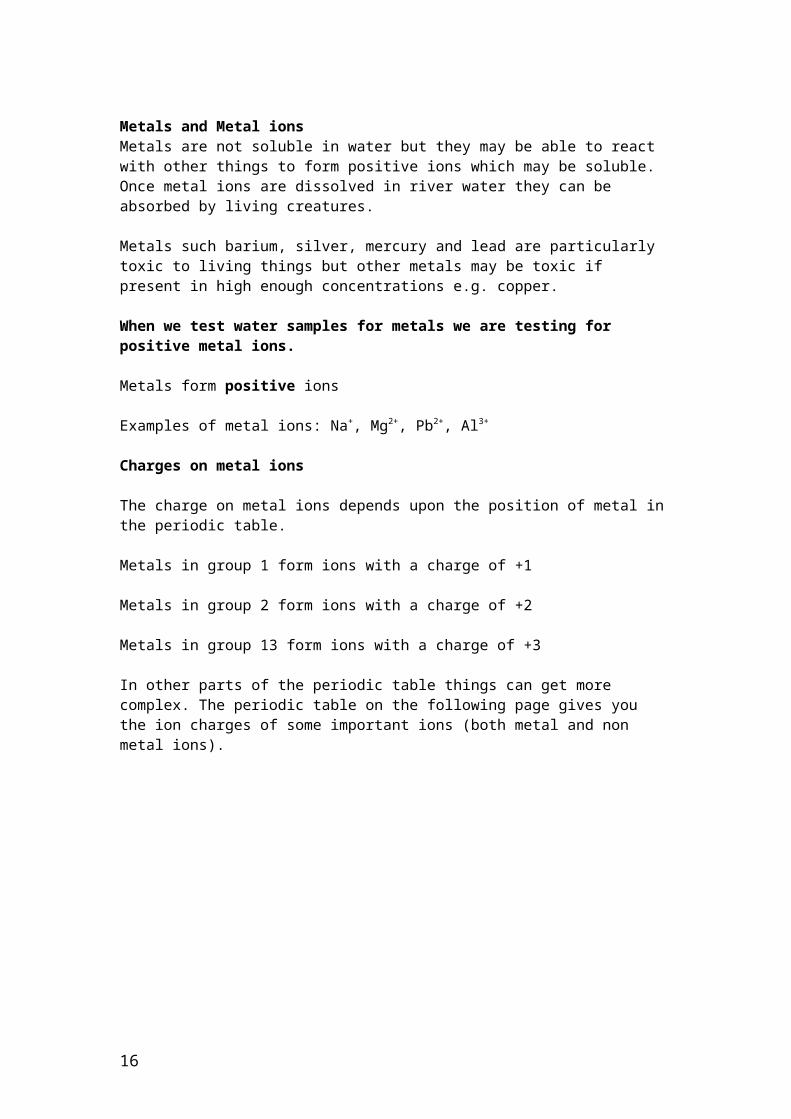
Metals and Metal ionsMetals are not soluble in water but they may be able to react with other things to form positive ions which may be soluble. Once metal ions are dissolved in river water they can be absorbed by living creatures.
Metals such barium, silver, mercury and lead are particularly toxic to living things but other metals may be toxic if present in high enough concentrations e.g. copper.
When we test water samples for metals we are testing for positive metal ions.
Metals form positive ions
Examples of metal ions: Na+, Mg2+, Pb2+, Al3+
Charges on metal ions
The charge on metal ions depends upon the position of metal in the periodic table.
Metals in group 1 form ions with a charge of +1
Metals in group 2 form ions with a charge of +2
Metals in group 13 form ions with a charge of +3
In other parts of the periodic table things can get more complex. The periodic table on the following page gives you the ion charges of some important ions (both metal and non metal ions).
12

Some important ions
1 2 3 4 5 6 7 8 9 10 11 12 13 14 15 16 17 18
hydrogen1
Hlithium
3
Liberyllium
4
Bekey element name
atomic number
symboloxygen
8
Ofluorine
9
F
sodium11
Namagnesium
12
Mgaluminium
13
Alchlorine
17
Clpotassium
19
Kcalcium
20
Cachromium
24
Cr
manganese25
Mniron26
Fecobalt
27
Conickel
28
Nicopper
29
Cuzinc30
Znbromine
35
Brrubidium
37
Rb
Strontium56
Srsilver47
AgIodine
53
ICaesium
55
Csbarium
56
Ba
lead82
Pb
15
This part of the table is more complex: Some important ions are: Mn2+, Fe2+, Fe3+, Ni2+, Cu2+, Zn2+, Ag+

16
Group 1These all form ions with a +1 chargee.g. Na+
Group 2These all form ions with a +2 chargee.g. Ca2+
Group 17These all form ions with a -1 chargee.g. Cl-
Group 16These may form ions with a -2 chargee.g. O2-
Group 13Al forms the ion Al3+
Group 14Pb forms the ion Pb2+

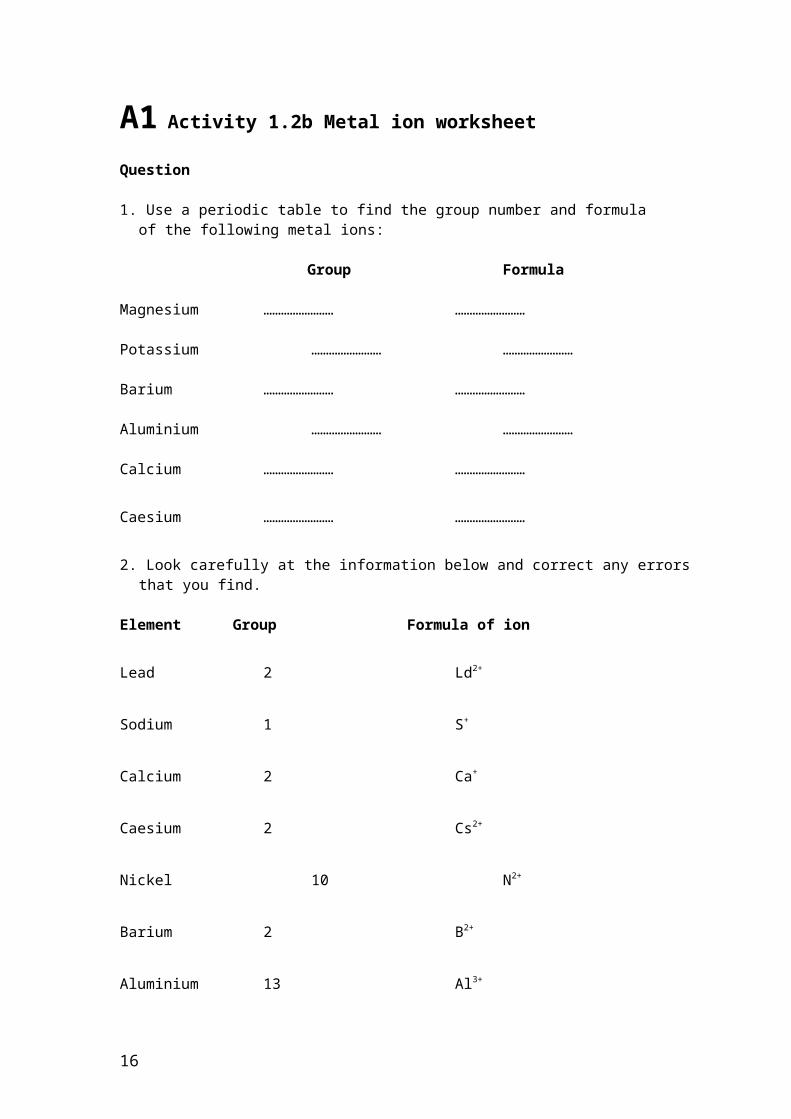
A1 Activity 1.2b Metal ion worksheet
Question
1. Use a periodic table to find the group number and formula of the following metal ions:
Group Formula
Magnesium …………………… ……………………
Potassium …………………… ……………………
Barium …………………… ……………………
Aluminium …………………… ……………………
Calcium …………………… ……………………
Caesium …………………… ……………………
2. Look carefully at the information below and correct any errors that you find.
Element Group Formula of ion
Lead 2 Ld2+
Sodium 1 S+
Calcium 2 Ca+
Caesium 2 Cs2+
Nickel 10 N2+
Barium 2 B2+
Aluminium 13 Al3+
Potassium 1 P+
Copper 11 Cu3+
16
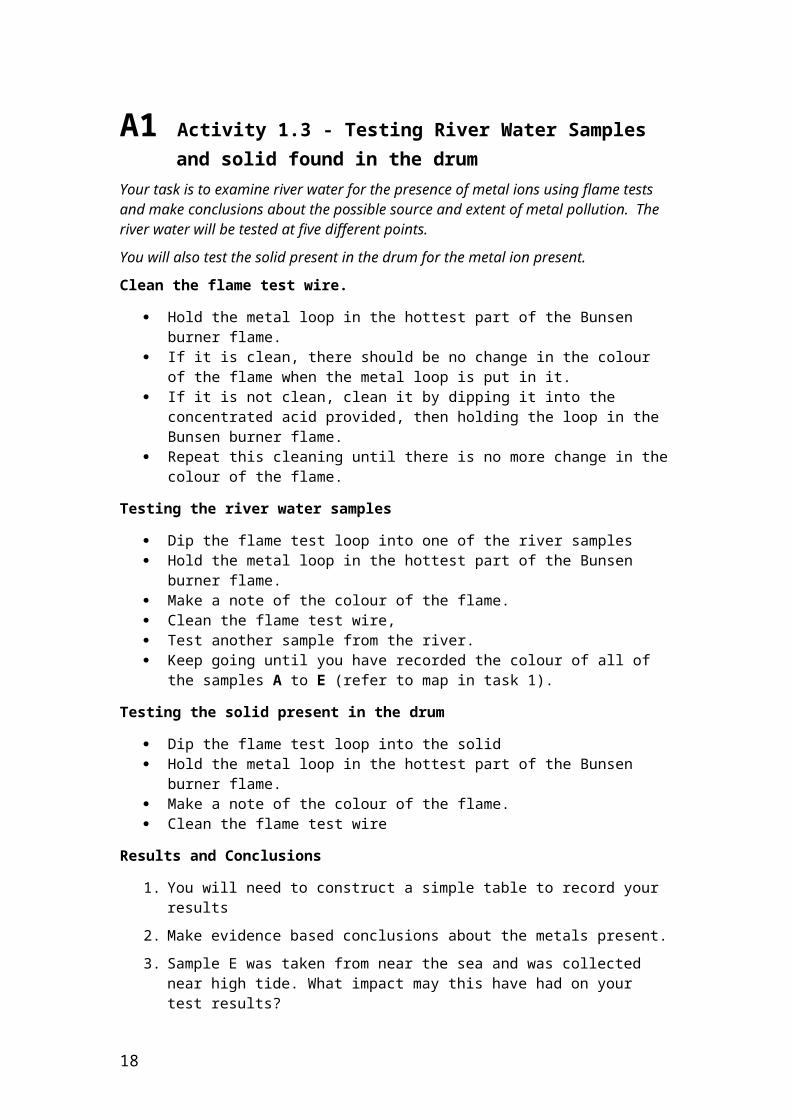
A1 Activity 1.3 - Testing River Water Samples and solid found in the drum
Your task is to examine river water for the presence of metal ions using flame tests and make conclusions about the possible source and extent of metal pollution. The river water will be tested at five different points. You will also test the solid present in the drum for the metal ion present.Clean the flame test wire.
Hold the metal loop in the hottest part of the Bunsen burner flame. If it is clean, there should be no change in the colour of the flame
when the metal loop is put in it. If it is not clean, clean it by dipping it into the concentrated acid
provided, then holding the loop in the Bunsen burner flame. Repeat this cleaning until there is no more change in the colour of
the flame.Testing the river water samples
Dip the flame test loop into one of the river samples Hold the metal loop in the hottest part of the Bunsen burner flame. Make a note of the colour of the flame. Clean the flame test wire, Test another sample from the river. Keep going until you have recorded the colour of all of the samples
A to E (refer to map in task 1).Testing the solid present in the drum
Dip the flame test loop into the solid Hold the metal loop in the hottest part of the Bunsen burner flame. Make a note of the colour of the flame. Clean the flame test wire
Results and Conclusions1. You will need to construct a simple table to record your results2. Make evidence based conclusions about the metals present.3. Sample E was taken from near the sea and was collected near high
tide. What impact may this have had on your test results?
17

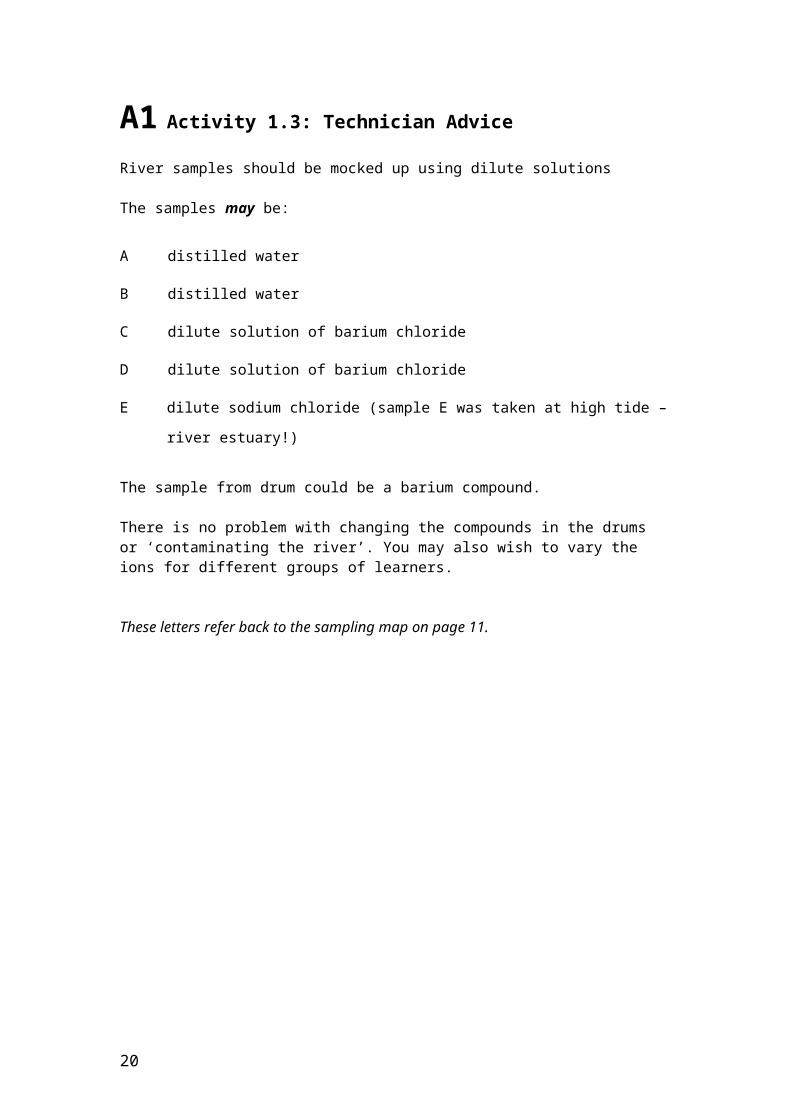
A1 Activity 1.3: Technician Advice
River samples should be mocked up using dilute solutions
The samples may be:
A distilled water
B distilled water
C dilute solution of barium chloride
D dilute solution of barium chloride
E dilute sodium chloride (sample E was taken at high tide – river estuary!)
The sample from drum could be a barium compound.
There is no problem with changing the compounds in the drums or ‘contaminating the river’. You may also wish to vary the ions for different groups of learners.
These letters refer back to the sampling map on page 11.
18

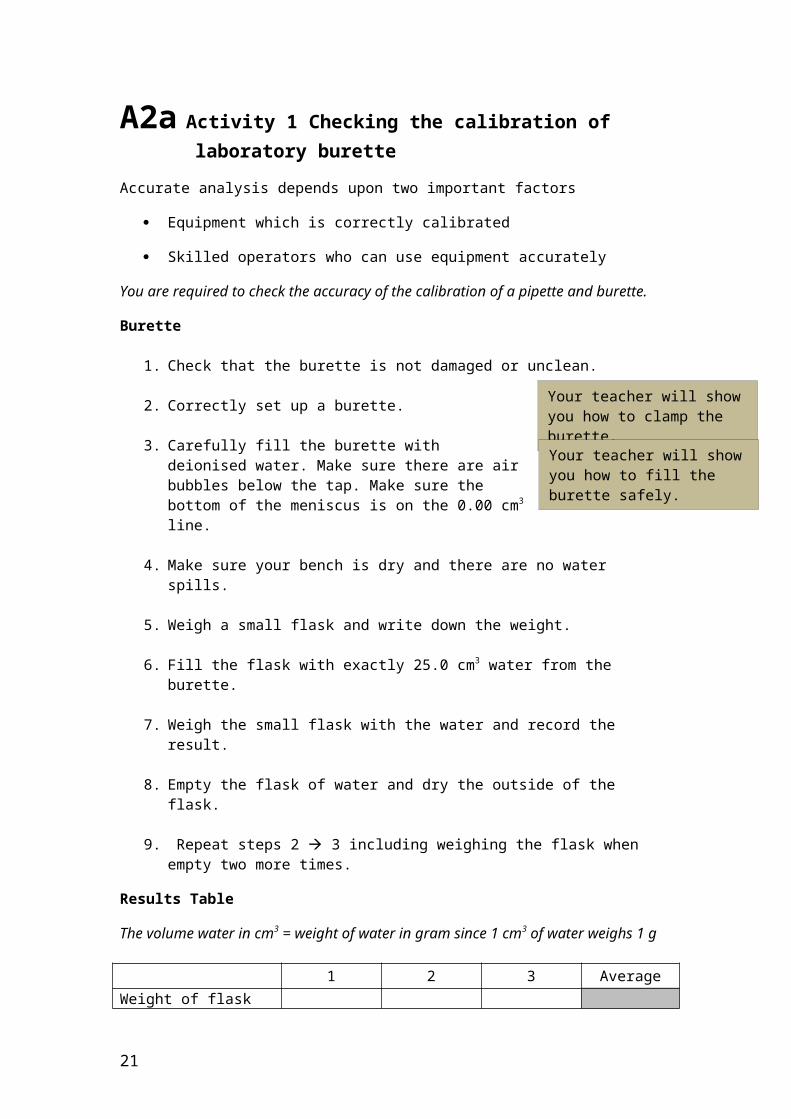
A2a Activity 1 Checking the calibration of laboratory burette
Accurate analysis depends upon two important factors Equipment which is correctly calibrated Skilled operators who can use equipment accurately
You are required to check the accuracy of the calibration of a pipette and burette.
Burette
1. Check that the burette is not damaged or unclean.
2. Correctly set up a burette.
3. Carefully fill the burette with deionised water. Make sure there are air bubbles below the tap. Make sure the bottom of the meniscus is on the 0.00 cm3 line.
4. Make sure your bench is dry and there are no water spills.
5. Weigh a small flask and write down the weight.
6. Fill the flask with exactly 25.0 cm3 water from the burette.
7. Weigh the small flask with the water and record the result.
8. Empty the flask of water and dry the outside of the flask.
9. Repeat steps 2 3 including weighing the flask when empty two more times.
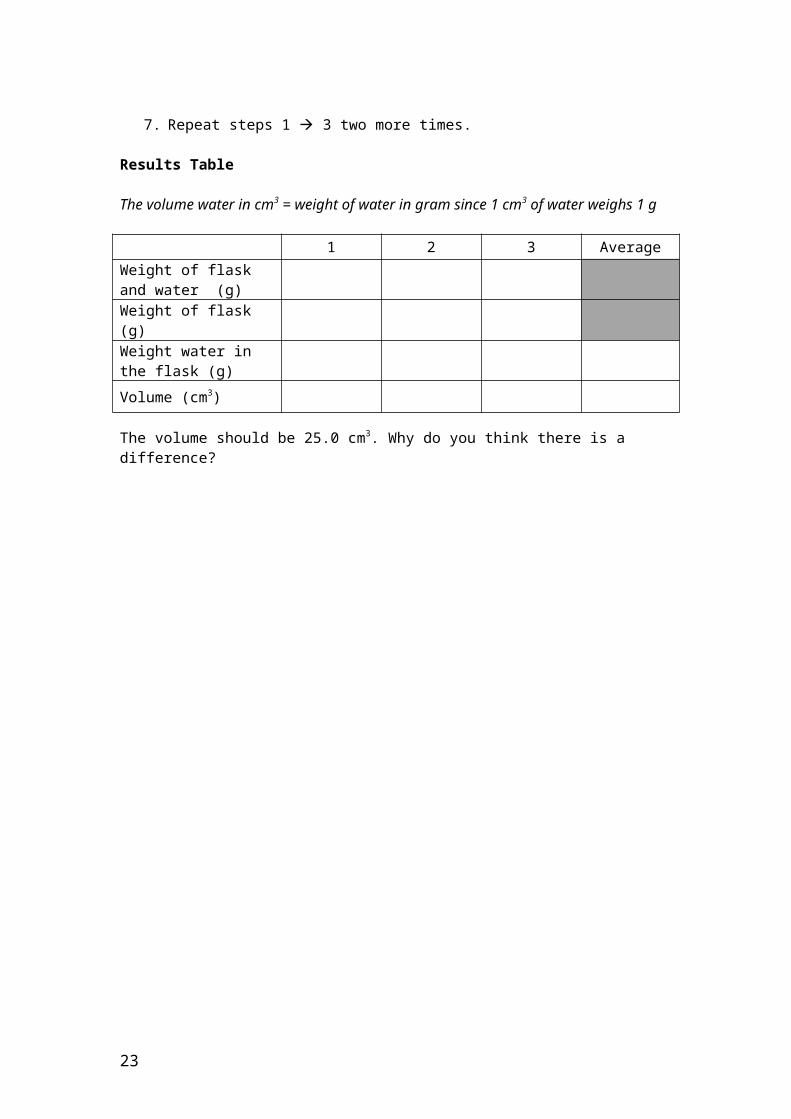
Results Table
The volume water in cm3 = weight of water in gram since 1 cm3 of water weighs 1 g
1 2 3 AverageWeight of flask and water (g)Weight of flask (g)Weight water in the flask (g)Volume (cm3)
The volume should be 25.0 cm3. Why do you think there is a difference?
19
Your teacher will show you how to clamp the burette.
Your teacher will show you how to fill the burette safely.
A2a Activity 2- Checking the calibration of laboratory pipette
Getting reliable results depends upon two important factors:
Equipment which is correctly calibrated
Skilled operators who can use equipment correctly.
You are required to check the calibration of a pipette and burette.
Pipette
1. Check the pipette is not damaged or unclean
2. Weigh a small flask and write down the weight.
3. Carefully fill the pipette with deionised water Make sure there are air bubbles in the pipette.
4. Fill the flask with exactly 25 cm3 water from the pipette. Let the water run out of the pipette into the flask. Do not use the pipette filler to ‘blow the water out’. A small drop of water remains in the pipette after it is empty.
5. Weigh the small flask with the water and record the result
6. Empty the flask of water and dry the outside of the flask.
7. Repeat steps 1 3 two more times.
Results Table
The volume water in cm3 = weight of water in gram since 1 cm3 of water weighs 1 g
1 2 3 AverageWeight of flask and water (g)Weight of flask (g)Weight water in the flask (g)Volume (cm3)
The volume should be 25.0 cm3. Why do you think there is a difference?
20
Your teacher will show you how to safely use the pipette

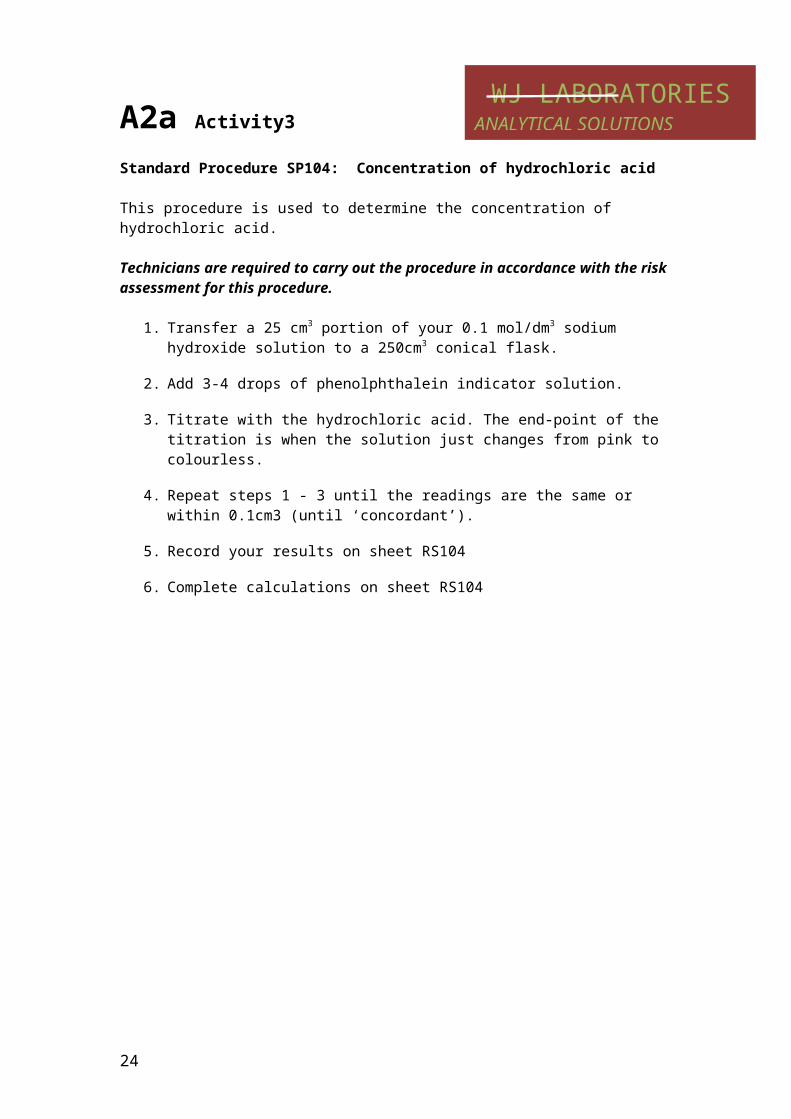
WJ LABORATORIESANALYTICAL SOLUTIONSA2a Activity3
Standard Procedure SP104: Concentration of hydrochloric acid
This procedure is used to determine the concentration of hydrochloric acid.
Technicians are required to carry out the procedure in accordance with the risk assessment for this procedure.
1. Transfer a 25 cm3 portion of your 0.1 mol/dm3 sodium hydroxide solution to a 250cm3 conical flask.
2. Add 3-4 drops of phenolphthalein indicator solution.
3. Titrate with the hydrochloric acid. The end-point of the titration is when the solution just changes from pink to colourless.
4. Repeat steps 1 - 3 until the readings are the same or within 0.1cm3 (until ‘concordant’).
5. Record your results on sheet RS104
6. Complete calculations on sheet RS104
21
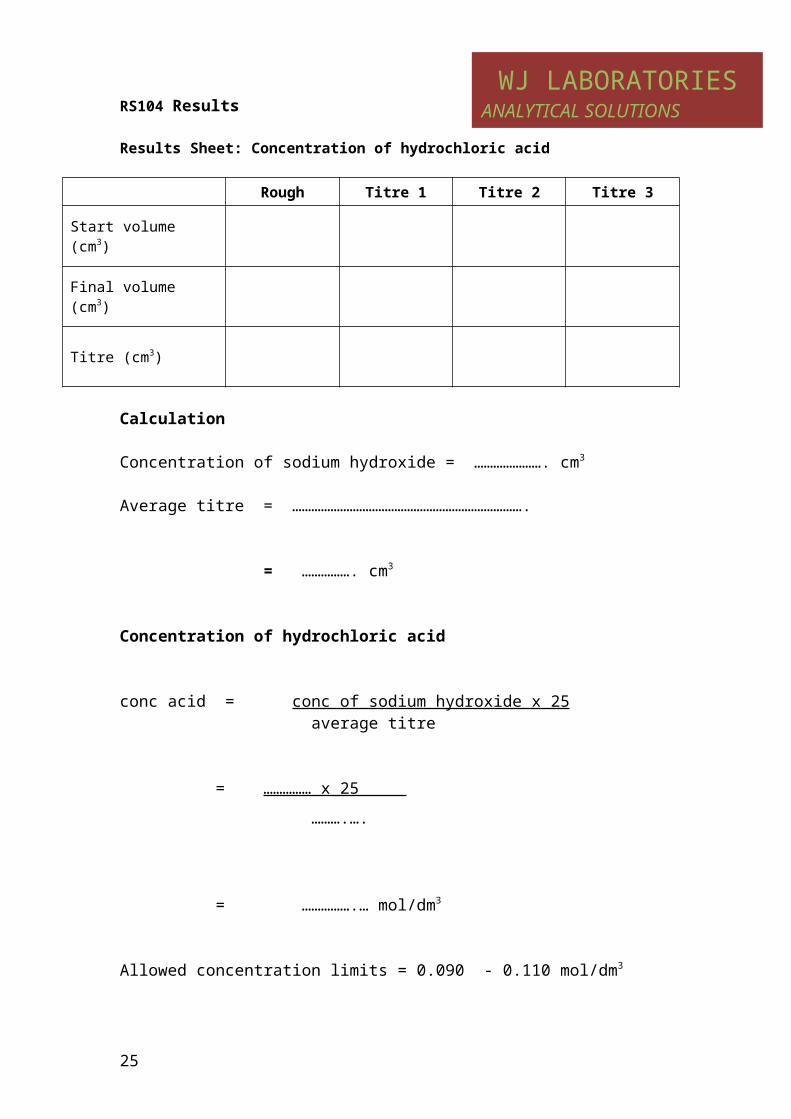
WJ LABORATORIESANALYTICAL SOLUTIONSRS104 Results
Results Sheet: Concentration of hydrochloric acid
Rough Titre 1 Titre 2 Titre 3
Start volume (cm3)
Final volume (cm3)
Titre (cm3)
Calculation
Concentration of sodium hydroxide = …………………. cm3
Average titre = ……………………………………………………………….
= ……………. cm3
Concentration of hydrochloric acid
conc acid = conc of sodium hydroxide x 25average titre
= …………… x 25 ……….….
= …………….… mol/dm3
Allowed concentration limits = 0.090 - 0.110 mol/dm3
Acid is within limits?() Yes No
22

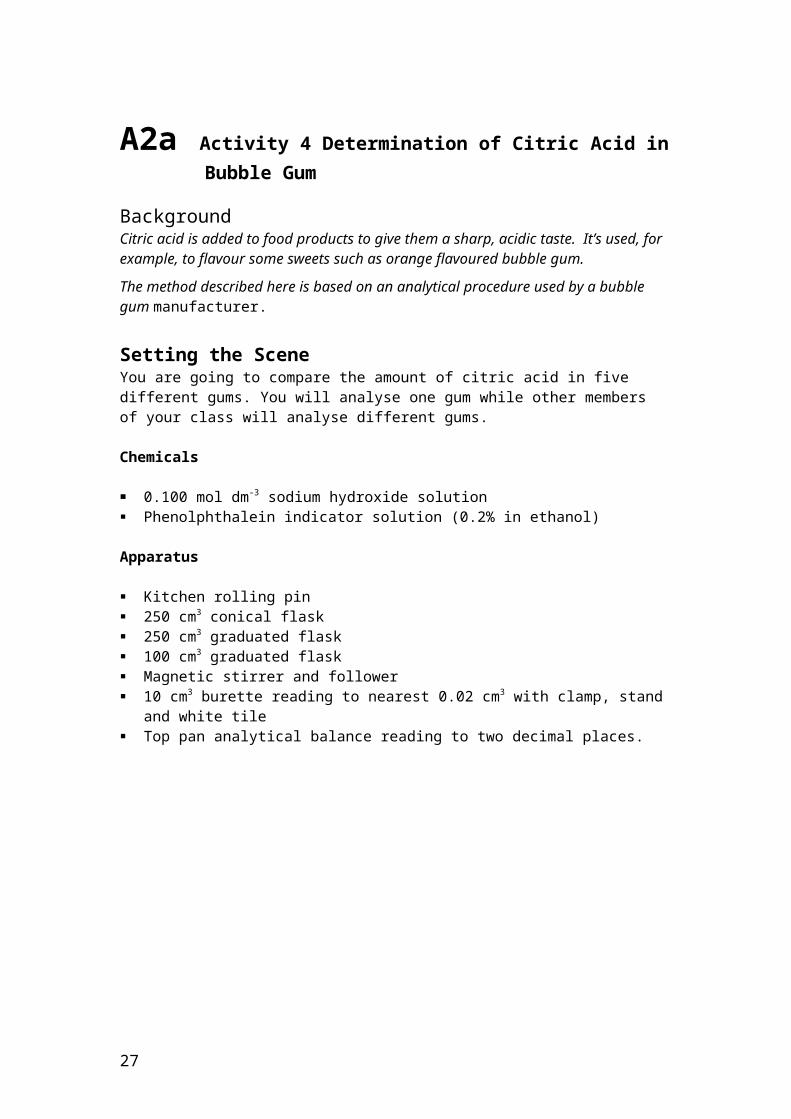
A2a Activity 4 Determination of Citric Acid in Bubble Gum
BackgroundCitric acid is added to food products to give them a sharp, acidic taste. It’s used, for example, to flavour some sweets such as orange flavoured bubble gum.The method described here is based on an analytical procedure used by a bubble gum manufacturer.
Setting the SceneYou are going to compare the amount of citric acid in five different gums. You will analyse one gum while other members of your class will analyse different gums.
Chemicals
0.100 mol dm-3 sodium hydroxide solution Phenolphthalein indicator solution (0.2% in ethanol)
Apparatus
Kitchen rolling pin 250 cm3 conical flask 250 cm3 graduated flask 100 cm3 graduated flask Magnetic stirrer and follower 10 cm3 burette reading to nearest 0.02 cm3 with clamp, stand and
white tile Top pan analytical balance reading to two decimal places.
23
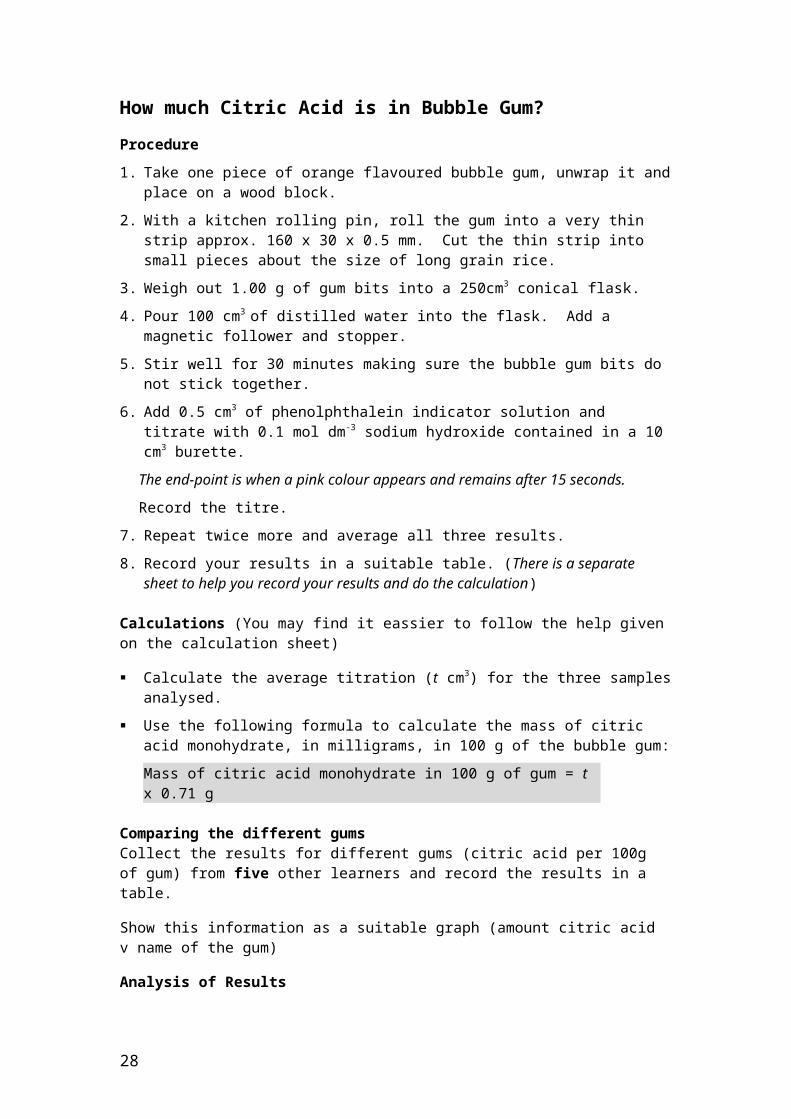
How much Citric Acid is in Bubble Gum?Procedure1. Take one piece of orange flavoured bubble gum, unwrap it and place
on a wood block.2. With a kitchen rolling pin, roll the gum into a very thin strip approx. 160
x 30 x 0.5 mm. Cut the thin strip into small pieces about the size of long grain rice.
3. Weigh out 1.00 g of gum bits into a 250cm3 conical flask.4. Pour 100 cm3 of distilled water into the flask. Add a magnetic follower
and stopper.5. Stir well for 30 minutes making sure the bubble gum bits do not stick
together.6. Add 0.5 cm3 of phenolphthalein indicator solution and titrate with 0.1
mol dm-3 sodium hydroxide contained in a 10 cm3 burette. The end-point is when a pink colour appears and remains after 15 seconds. Record the titre.
7. Repeat twice more and average all three results.8. Record your results in a suitable table. (There is a separate sheet to
help you record your results and do the calculation)
Calculations (You may find it eassier to follow the help given on the calculation sheet) Calculate the average titration (t cm3) for the three samples analysed. Use the following formula to calculate the mass of citric acid
monohydrate, in milligrams, in 100 g of the bubble gum:Mass of citric acid monohydrate in 100 g of gum = t x 0.71 g
Comparing the different gumsCollect the results for different gums (citric acid per 100g of gum) from five other learners and record the results in a table.Show this information as a suitable graph (amount citric acid v name of the gum)Analysis of ResultsWhich chewing gum as most citric acid? Which contains least? Are there any gums that do not contain citric acid?Evaluate
Evaluate your investigation. You should comment both on the procedure and your results. How can you improve your results?
24
Determination of Citric Acid in Bubble GumResults
Make a table to record your titration results. (Tip: Look at the table for the hydrochloric acid experiment you did)
Calculations
Work out the average titre (t)
……………………………………………………………………………………………….……………
Average titre (t) = ……………… (Remember to add the units)
Calulate the mass of citric acid monohydrate, in milligrams, in 100 g of the Hubba Bubba bubble gum:
Mass of citric acid monohydrate in 100 g of gum = t x 0.71 g
Mass = ……………… x 0.71
= ……………….. mg
25

Teacher Guidance (Citric acid in chewing gum)
This method has been adapted from a prrocedure by the manufacter of an orange flavoured bubble gum. Link http://standardbase.vapronet.nl/userdata/sbase_beheer/documenten/tips/uk12%20teachers%20tips.pdf The manufacturer’s allowed range is 1.9 – 2.1 percentage by mass.
You could vary the scenario of this experiment. A modication that would simplify and shorten the work would be simply to allow the learners to quality control a sample of chewing gum and find whether it is within a set limit. Learners would no longer be required to collect and display data from other members of the group.
26
A2b Activity 1 Chromatography of sweets
Coloured sweets can be analysed for the dyes they contain. This experiment will analyse the colour coat contained in M&M’S ®. A spot of each is put on to a piece of chromatography paper and water is allowed to soak up the paper separating out the component dyes. The results show which dye mixtures are used to produce particular colours for the sweets.
HEALTH & SAFETY NOTE:
The M&M’S® are NOT to be eaten under any circumstances.
Procedure
a) Place the piece of chromatography paper on a clean flat surface, with the longer side horizontal and draw a horizontal line in pencil (not biro) about 1.5 cm from the base of the paper.
b) Use the dampened paint brush to remove the colour from one of the M&M’S® and paint this colour on the line about 2 cm from one end. Small spots are best.
c) Clean the brush in fresh running water and paint the colour of another M&M® on the line about 2 cm from the first spot.
d) Repeat this until all the colours are on the paper or until you have reached the other end.
e) Use a pencil (not a biro) to write the name of the colour next to the corresponding spot.
f) Roll the paper into a cylinder and hold this in place with the paper clips. Try to avoid any overlapping of the paper when you make the cylinder.
g) Put water into the beaker up to depth of about 1 cm.
h) Lower the paper cylinder into the beaker of water thus allowing the water to rise up the paper. Ensure that the water is below the level of the spots. Try to avoid moving the paper cylinder about once it is in position.
i) When the water approaches the top of the paper cylinder remove it from the water. Mark with a pencil the level of the water at the top of the filter paper.
27
j) Allow the paper cylinder to dry, perhaps by using a hairdryer if available or by clamping it and leaving it to dry overnight.
k) Unravel the paper cylinder and examine it carefully.
Questions
1. Why do you think some dyes separate out into different colours whilst others do not?
2. Why do you think some colours move further up the paper than others?
3. Can you think of any way of improving the separation between the different spots?
4. Look on the side of a M&M’S® packet for a list of the coloured dyes used. Try to identify which dyes correspond to the spots on the chromatogram.
5. Why may food regulators wish to analyse the dyes contained in foods/ sweets etc?
28
Technician NotesApparatus and chemicals
Beaker (250 cm3)Small soft paint brushPaper clips (preferably plastic coated), 2Chromatography paper, approximately 20 cm x 10 cm (see note 1)PencilRulerA communal hairdryer (optional) (see note 2)
A supply of M&M’S® of various colours (see notes 3 and 4)
Technical notes
1 Whatman chromatography paper works best for this experiment, but, if unavailable, large sheets of ordinary filter paper can be cut up instead.
2 Ensure that the hairdyer has had an electrical safety check.
3 M&M’S® with a variety of about 6 or 7 different colours are required for each group.
4 If M&M’S® are unavailable this experiment can be carried out with liquid food colouring which is readily available from supermarkets. Chromatography of Smarties® is less successful as they use natural food colourings. Peanut M&M’S® should not be used if there are students with peanut allergies.
Teaching Notes
Encourage the learners to make small intense spots on the paper and to avoid smudging.Some dyes will be found to produce only one spot further up the paper, whilst others will have spread into two or more areas of colour.
If appropriate learners should be told that the relative distance travelled by each “spot” depends not only on its solubility in water but also on its attraction for the cellulose components of the paper.
It should be emphasised that each “spot” may well still be a mixture of dyes, and that a more effective separation might occur:
if the distance travelled by the spots is increased, e.g. by using a taller cylinder in a taller beaker.
with a different solvent, other than water with a different stationary phase (e.g. silica plates).
29

A3 GC and HPLC background for Teachers
Learners need to know that GC and HPLC are very sensitive methods of separating complex mixtures. They have the ability to detect small quantities (parts per million). Separation takes place in a column. Separation occurs because there are differences in the relative attraction of the components in a mixture for a moving mobile phase and fixed stationary phase.
In gas chromatography, gas is the mobile phase. Any samples analysed in gas chromatography therefore need to be vapourised.
In liquid chromatography, the mobile phase is a liquid.
A simple schematic diagram showing the key steps in GC or HPLC, sufficient for level2 learners, is shown below.
The work of a detector is to tell us when a compound elutes from the column. The detector does not tell us what the component is. (It is possible to combine GC with mass spectroscopy. This will enable scientists to deduce a compound. GC-MS is beyond the scope of a level 2 course).
The time it takes for a component to elute from a column is known as the retention time.
Retention times are sensitive to the conditions that are used to do the analysis.e.g. In GC retention times are very sensitive to the temperature and gas flow.In HPLC the mobile phase and flow rate are important.(Obviously the type of column used, its length etc is vital as well!)In a particular analysis we will need to keep the above parameters constant.
Analysing the resultsLearners need to be able to measure retention times from a chromatogram. Learners need to realize that the retention time for a component will always be the same for a particular component as long as conditions do not change. If we compare retention times of ‘unknowns’ with standards, it is possible to identify an unknown. However learners need to be aware that there is some uncertainty in their conclusion because it is just possible that two different compounds have the same retention time! Uses of GC and HPLC
30
ColumnSample Injection Detector
The following table details some applications of GC and HPLC
Chromatography Some examples of UsesHigh performance liquid chromatography
Analyzing air and water pollutantsMonitoring pesticide levels in the environmentSurvey food and drug productsFor identifying confiscated drugs
Gas chromatography Pollutants in airDetect bombs in airportsIdentify and quantify drugs as alcoholUsed in forensics to compare fibres found on a victim
Paper chromatography Separating dyesSeparating amino acids and anionsRNA fingerprinting
Footnote: Gas Chromatography in popular culture
Movies, books and TV shows tend to misrepresent the capabilities of gas chromatography and the work done with these instruments.
In TV crime dramas, for example, GCs are used to rapidly identify unknown samples. "This is petrol bought at a Chevron station in the past two weeks," the analyst will say fifteen minutes after receiving the sample.
In fact, a typical GC analysis takes much more time; sometimes a single sample must be run more than an hour according to the chosen program; and even more time is needed to "heat out" the column so it is free from the first sample and can be used for the next. Equally, several runs are needed to confirm the results of a study - a GC analysis of a single sample may simply yield a result per chance.
Also, GC does not positively identify most samples; and not all substances in a sample will necessarily be detected. All a GC truly tells you is at which relative time a component eluted from the column and that the detector was sensitive to it. To make results meaningful, analysts need to know which components at which concentrations are to be expected; and even then a small amount of a substance can hide itself behind a substance having both a higher concentration and the same relative elution time. Last but not least it is often needed to check the results of the sample against a GC analysis of a reference sample containing only the suspected substance.
31
A GC-MS can remove much of this ambiguity, since the mass spectrometer will identify the component's molecular weight. But this still takes time and skill to do properly.
Similarly, most GC analyses are not push-button operations. You cannot simply drop a sample vial into an auto-sampler's tray, push a button and have a computer tell you everything you need to know about the sample. According to the substances one expects to find the operating program must be carefully chosen.
A push-button operation can exist for running similar samples repeatedly, such as in a chemical production environment or for comparing 20 samples from the same experiment to calculate the mean content of the same substance. However, for the kind of investigative work portrayed in books, movies and TV shows this is clearly not the case.
32

A3 Activity 3
DRINKING WATER INSPECTORATE
Pesticides What are pesticides? Pesticides are a general term for a very wide range of substances which are used as weed killers, insecticides, fungicides and other similar purposes. Rivers and ground waters may contain traces of pesticide as a result of agricultural use (pest control on crops) and non-agricultural use (herbicide for weed control on highways and railways).
What is being done to keep pesticides out of drinking water? Over the last two decades water companies have invested in advanced water treatment using activated carbon alone or in combination with ozone to safeguard drinking water supplies until longer term wider efforts to encourage more careful use of pesticides result in improved river and ground water quality. Water companies are required by law to assess the risk to each of their water sources from pesticides and monitor the raw water for those that could be present due to use in the local water catchments. When a specific pesticide is detected the information is provided to the Environment Agency who will investigate where the pollution is coming from.
What are the standards? The European Drinking Water Directive set a standard of 0.1μg/l (microgrammes per litre) for each individual pesticide in drinking water. This corresponds to a concentration of 1 part in ten billion. This is not a health based standard; it was set by the European Commission in 1980 to reflect the limit of analytical methodology at the time and as an environmental policy to generally limit pesticides. The Directive also set a standard of 0.5μg/l Total Pesticides (the sum of all the substances detected in a sample). There are stricter separate health based standards for four named organochlorine pesticides which are no longer permitted to be used. Summary statistics on the results of pesticide testing by water companies can be found on this website. You can obtain details of the results for your local water supply by asking your water company for a free water quality report. You can find contact details for your water company on your bill or on our website.
Download from http://dwi.defra.gov.uk/consumers/advice-leaflets/pesticides.pdf
33
A3 Activity 3 A problem with Lindane
Lindane is a banned organochlorine pesticide. There are fears that a water supply has been contaminated with lindane after drums containing lindane work found illegally dumped in a river.
Your task is to use the information below to deduce whether or not contamination as occurred, and if it has occurred the extent of contamination.
Samples of river water from a number of locations have been returned to the laboratory. Your task is to determine whether lindane is present.
Chromatogram 1: Lindane
Chromatogram 2: Sample #1
Chromatogram 3: Sample #2
Chromatogram 4: Sample #3
34