Embed Size (px)
Citation preview
8/3/2019 WLC - Feb Website Version
http://slidepdf.com/reader/full/wlc-feb-website-version 1/37
Western Lithium
www.westernlithium.com
February 2011
8/3/2019 WLC - Feb Website Version
http://slidepdf.com/reader/full/wlc-feb-website-version 2/37
2
Kings Valley Lithium ProjectCautionary Statement
This presentation contains projections and forward looking informationthat involve various risks and uncertainties regarding future events.Such forward-looking information can include without limitationstatements based on current expectations involving a number of risksand uncertainties and are not guarantees of future performance of theCorporation. These risks and uncertainties could cause actual results
and the Corporation's plans and objectives to differ materially fromthose expressed in the forward-looking information. Actual results andfuture events could differ materially from those anticipated in suchinformation. These and all subsequent written and oral forward-lookingstatements are based on estimates and opinions of management on the
dates they are made and expressly qualified in their entirety by thisnotice. The Corporation assumes no obligation to update forward-looking information should circumstances or management's estimates oropinions change.
8/3/2019 WLC - Feb Website Version
http://slidepdf.com/reader/full/wlc-feb-website-version 3/37
3
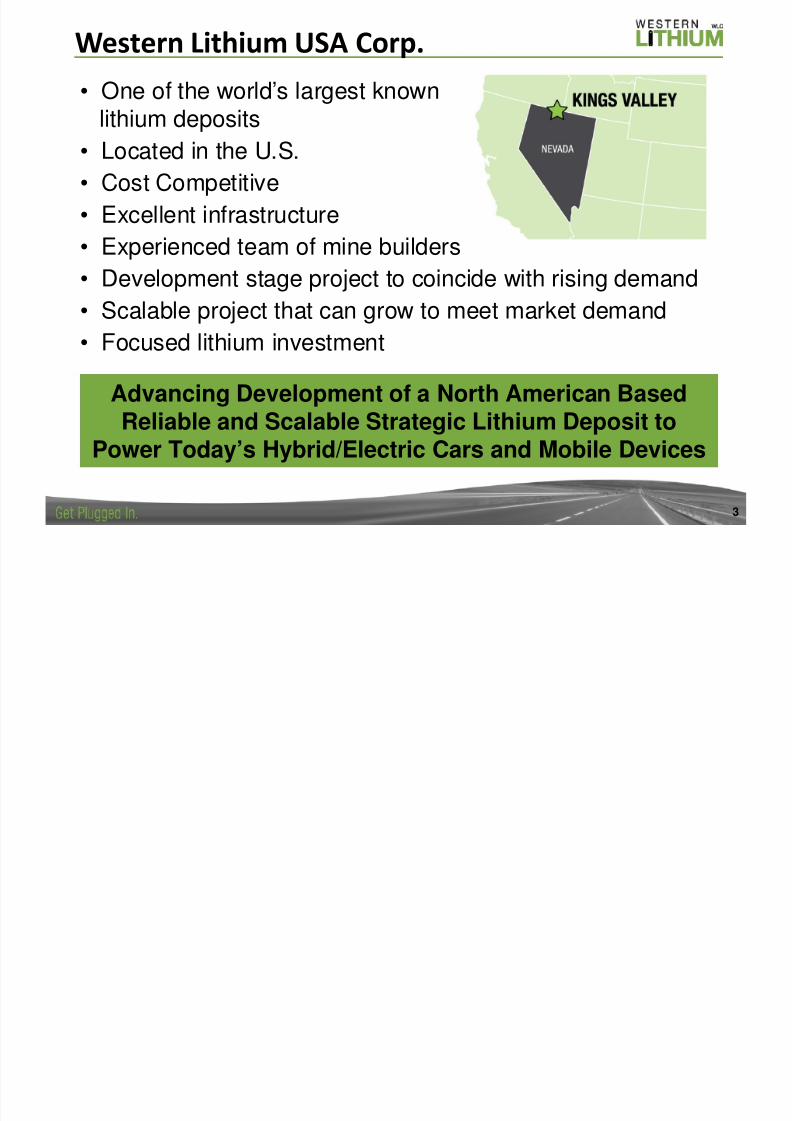
Western Lithium USA Corp.
Advancing Development of a North American BasedReliable and Scalable Strategic Lithium Deposit to
Power Today’s Hybrid/Electric Cars and Mobile Devices
• One of the world’s largest known
lithium deposits• Located in the U.S.
• Cost Competitive
• Excellent infrastructure
• Experienced team of mine builders• Development stage project to coincide with rising demand
• Scalable project that can grow to meet market demand
• Focused lithium investment
8/3/2019 WLC - Feb Website Version
http://slidepdf.com/reader/full/wlc-feb-website-version 4/37
4
0
10
20
30
4050
4
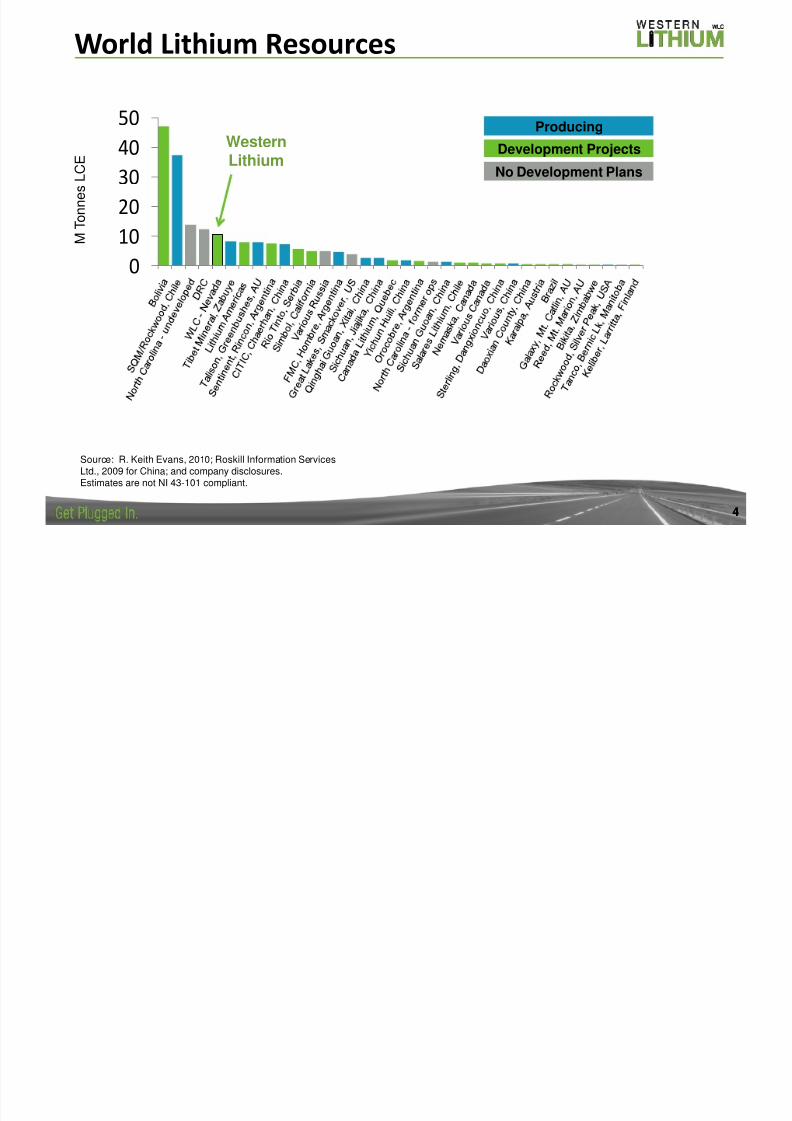
World Lithium Resources
WesternLithium
No Development Plans
Producing
Development Projects
Source: R. Keith Evans, 2010; Roskill Information ServicesLtd., 2009 for China; and company disclosures.Estimates are not NI 43-101 compliant.
M T o n n e s L C E
8/3/2019 WLC - Feb Website Version
http://slidepdf.com/reader/full/wlc-feb-website-version 5/37
5
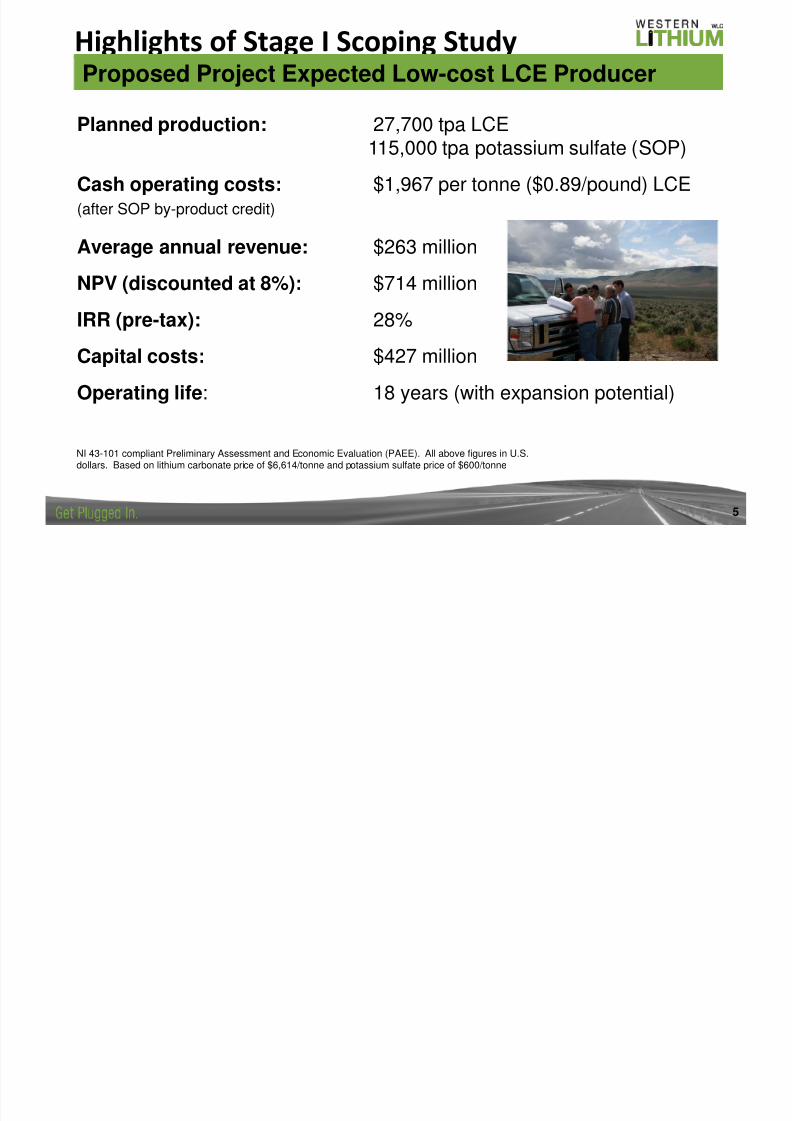
Highlights of Stage I Scoping Study
Proposed Project Expected Low-cost LCE Producer
Planned production: 27,700 tpa LCE115,000 tpa potassium sulfate (SOP)
Cash operating costs: $1,967 per tonne ($0.89/pound) LCE(after SOP by-product credit)
Average annual revenue: $263 million
NPV (discounted at 8%): $714 million
IRR (pre-tax): 28%
Capital costs: $427 million
Operating life: 18 years (with expansion potential)
NI 43-101 compliant Preliminary Assessment and Economic Evaluation (PAEE). All above figures in U.S.dollars. Based on lithium carbonate price of $6,614/tonne and potassium sulfate price of $600/tonne
8/3/2019 WLC - Feb Website Version
http://slidepdf.com/reader/full/wlc-feb-website-version 6/37
6
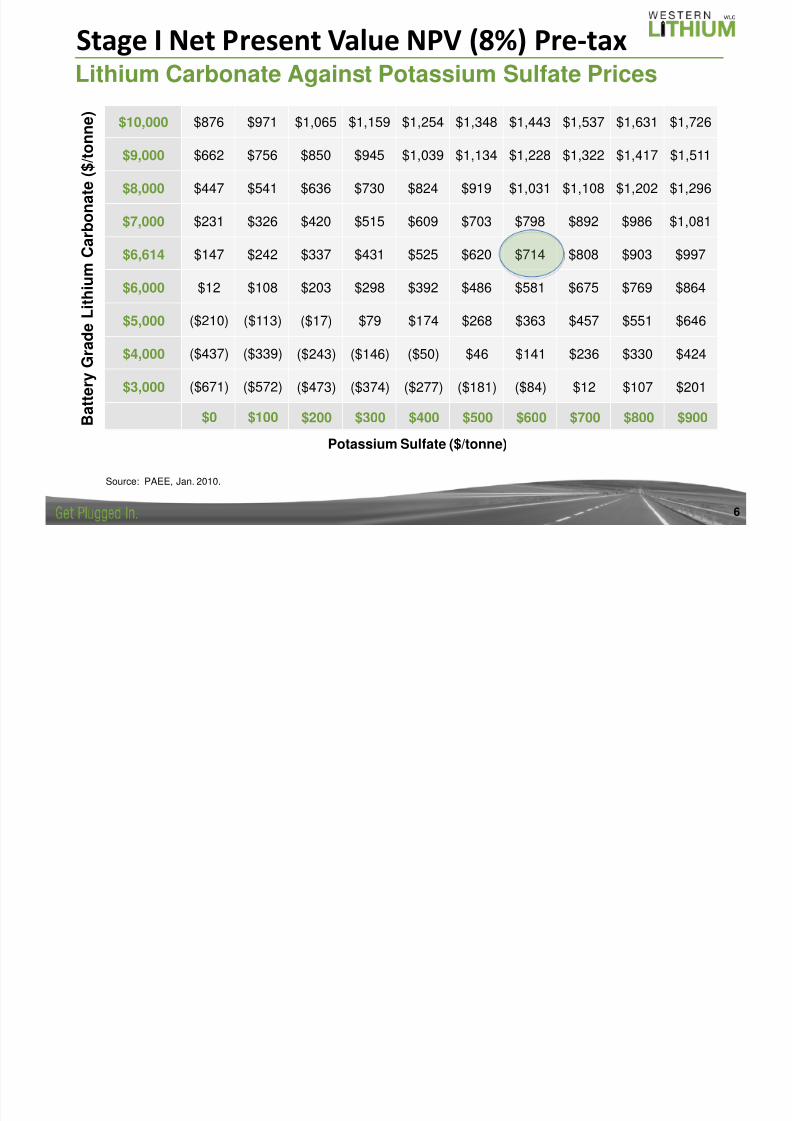
Stage I Net Present Value NPV (8%) Pre-taxLithium Carbonate Against Potassium Sulfate Prices
Source: PAEE, Jan. 2010.
$10,000 $876 $971 $1,065 $1,159 $1,254 $1,348 $1,443 $1,537 $1,631 $1,726
$9,000 $662 $756 $850 $945 $1,039 $1,134 $1,228 $1,322 $1,417 $1,511
$8,000 $447 $541 $636 $730 $824 $919 $1,031 $1,108 $1,202 $1,296
$7,000 $231 $326 $420 $515 $609 $703 $798 $892 $986 $1,081
$6,614 $147 $242 $337 $431 $525 $620 $714 $808 $903 $997
$6,000 $12 $108 $203 $298 $392 $486 $581 $675 $769 $864
$5,000 ($210) ($113) ($17) $79 $174 $268 $363 $457 $551 $646
$4,000 ($437) ($339) ($243) ($146) ($50) $46 $141 $236 $330 $424
$3,000 ($671) ($572) ($473) ($374) ($277) ($181) ($84) $12 $107 $201
$0 $100 $200 $300 $400 $500 $600 $700 $800 $900 B a t t e r y G r a d e L i t h i u m C a
r b o n a t e ( $ / t o n n e
)
Potassium Sulfate ($/tonne)
8/3/2019 WLC - Feb Website Version
http://slidepdf.com/reader/full/wlc-feb-website-version 7/37
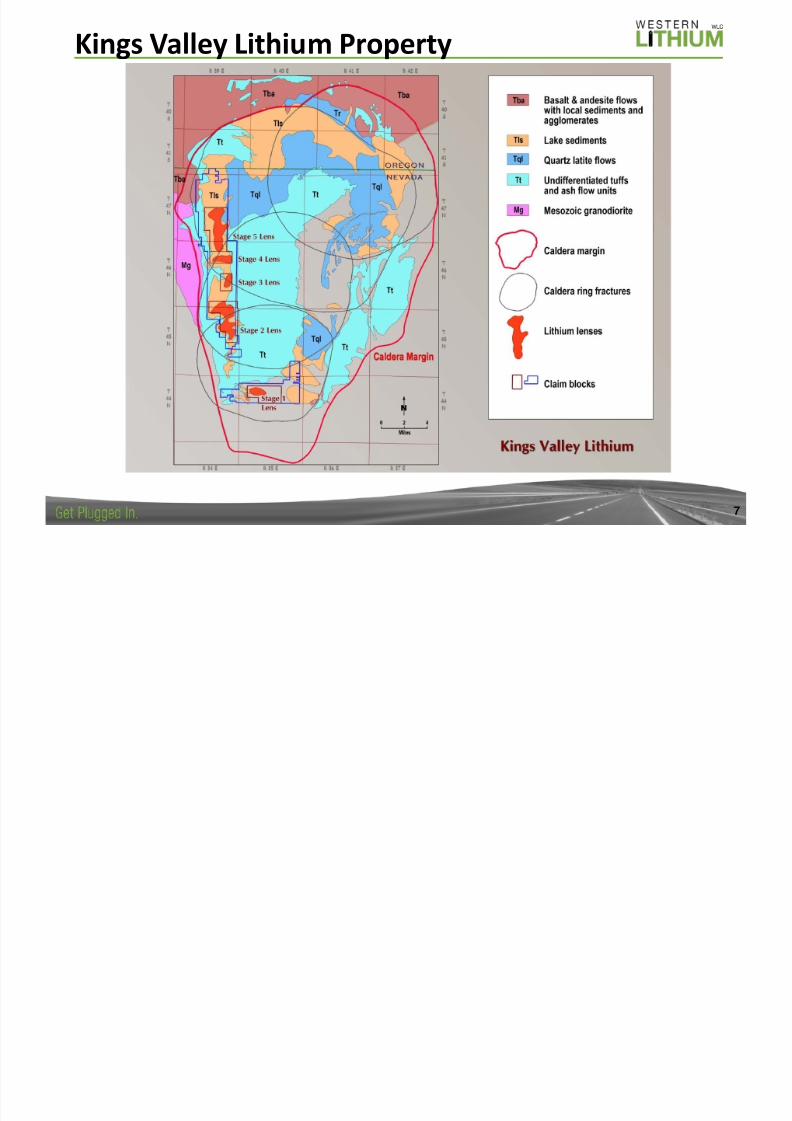
Kings Valley Lithium Property
7
8/3/2019 WLC - Feb Website Version
http://slidepdf.com/reader/full/wlc-feb-website-version 8/378
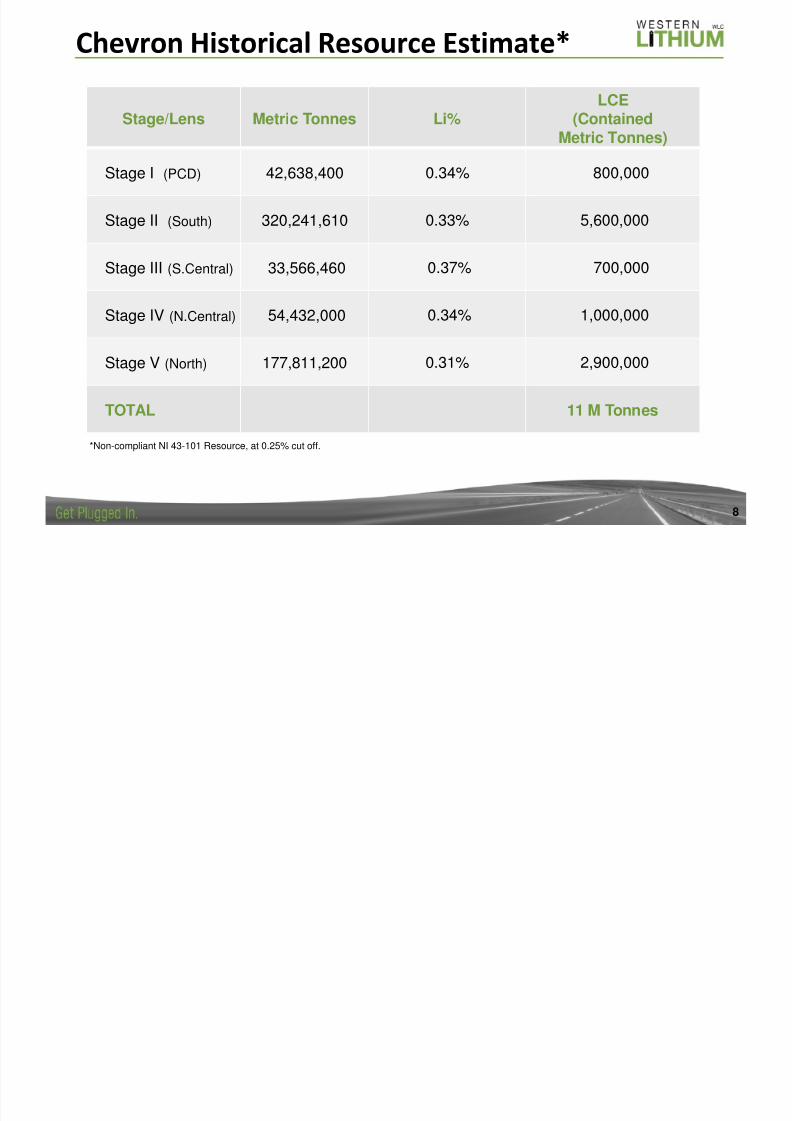
Chevron Historical Resource Estimate*
Stage/Lens Metric Tonnes Li%
LCE
(ContainedMetric Tonnes)
Stage I (PCD) 42,638,400 0.34% 800,000
Stage II (South) 320,241,610 0.33% 5,600,000
Stage III (S.Central) 33,566,460 0.37% 700,000
Stage IV (N.Central) 54,432,000 0.34% 1,000,000
Stage V (North) 177,811,200 0.31% 2,900,000
TOTAL 11 M Tonnes
*Non-compliant NI 43-101 Resource, at 0.25% cut off.
8/3/2019 WLC - Feb Website Version
http://slidepdf.com/reader/full/wlc-feb-website-version 9/379
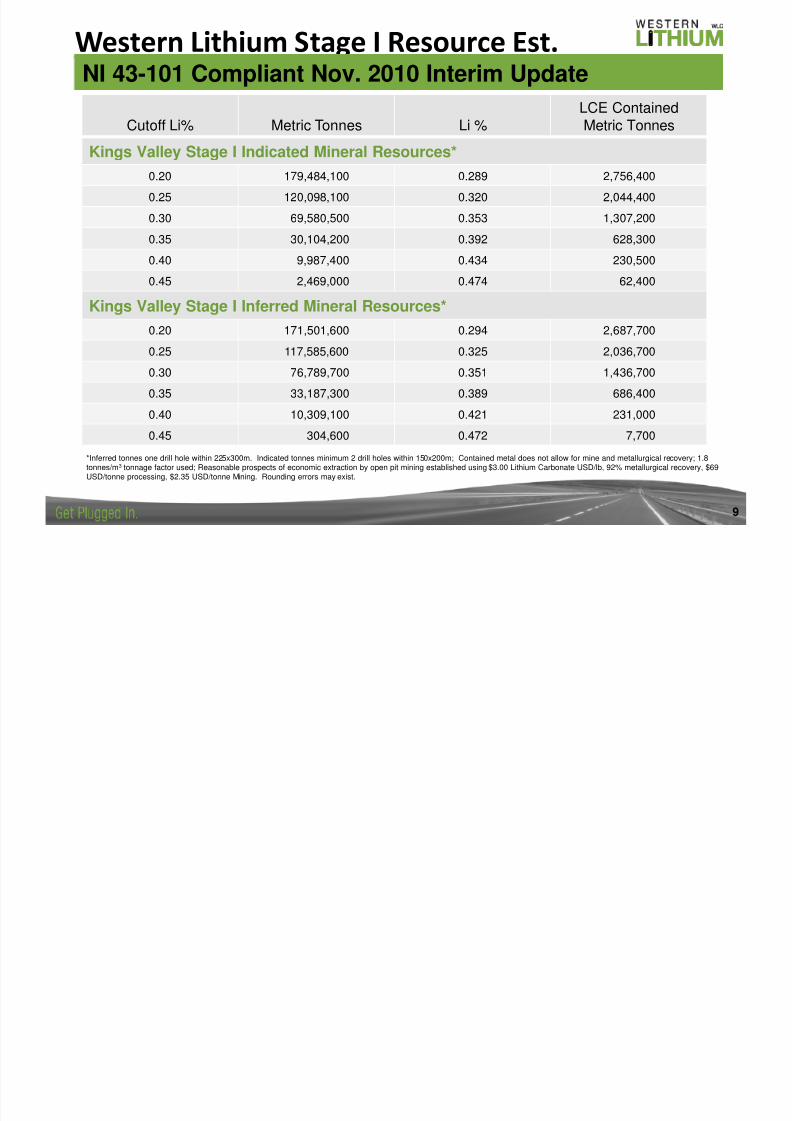
Western Lithium Stage I Resource Est.NI 43-101 Compliant Nov. 2010 Interim Update
Cutoff Li% Metric Tonnes Li %
LCE Contained
Metric Tonnes
Kings Valley Stage I Indicated Mineral Resources*
0.20 179,484,100 0.289 2,756,400
0.25 120,098,100 0.320 2,044,400
0.30 69,580,500 0.353 1,307,200
0.35 30,104,200 0.392 628,300
0.40 9,987,400 0.434 230,500
0.45 2,469,000 0.474 62,400
Kings Valley Stage I Inferred Mineral Resources*
0.20 171,501,600 0.294 2,687,700
0.25 117,585,600 0.325 2,036,700
0.30 76,789,700 0.351 1,436,700
0.35 33,187,300 0.389 686,400
0.40 10,309,100 0.421 231,000
0.45 304,600 0.472 7,700
*Inferred tonnes one drill hole within 225x300m. Indicated tonnes minimum 2 drill holes within 150x200m; Contained metal does not allow for mine and metallurgical recovery; 1.8tonnes/m3 tonnage factor used; Reasonable prospects of economic extraction by open pit mining established using $3.00 Lithium Carbonate USD/lb, 92% metallurgical recovery, $69USD/tonne processing, $2.35 USD/tonne Mining. Rounding errors may exist.
8/3/2019 WLC - Feb Website Version
http://slidepdf.com/reader/full/wlc-feb-website-version 10/3710
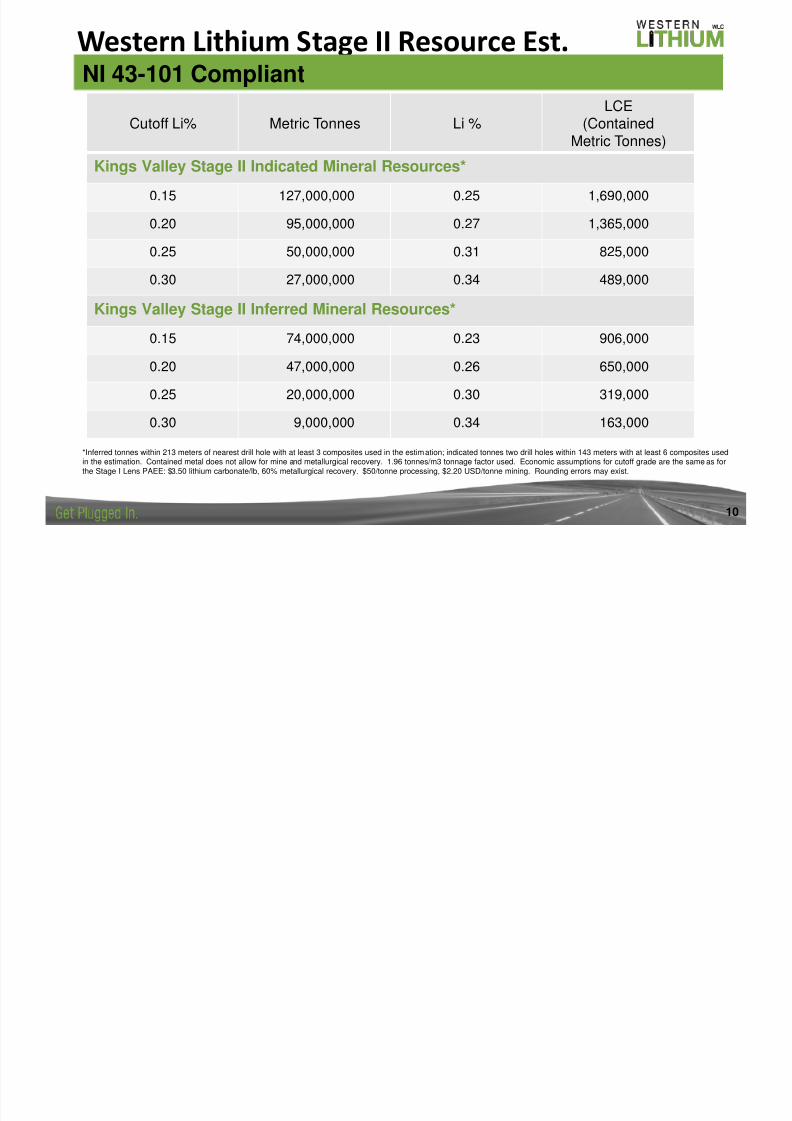
Western Lithium Stage II Resource Est.
Cutoff Li% Metric Tonnes Li %
LCE
(ContainedMetric Tonnes)
Kings Valley Stage II Indicated Mineral Resources*
0.15 127,000,000 0.25 1,690,000
0.20 95,000,000 0.27 1,365,000
0.25 50,000,000 0.31 825,000
0.30 27,000,000 0.34 489,000
Kings Valley Stage II Inferred Mineral Resources*
0.15 74,000,000 0.23 906,000
0.20 47,000,000 0.26 650,000
0.25 20,000,000 0.30 319,000
0.30 9,000,000 0.34 163,000
*Inferred tonnes within 213 meters of nearest drill hole with at least 3 composites used in the estimation; indicated tonnes two drill holes within 143 meters with at least 6 composites usedin the estimation. Contained metal does not allow for mine and metallurgical recovery. 1.96 tonnes/m3 tonnage factor used. Economic assumptions for cutoff grade are the same as forthe Stage I Lens PAEE: $3.50 lithium carbonate/lb, 60% metallurgical recovery. $50/tonne processing, $2.20 USD/tonne mining. Rounding errors may exist.
NI 43-101 Compliant
8/3/2019 WLC - Feb Website Version
http://slidepdf.com/reader/full/wlc-feb-website-version 11/3711
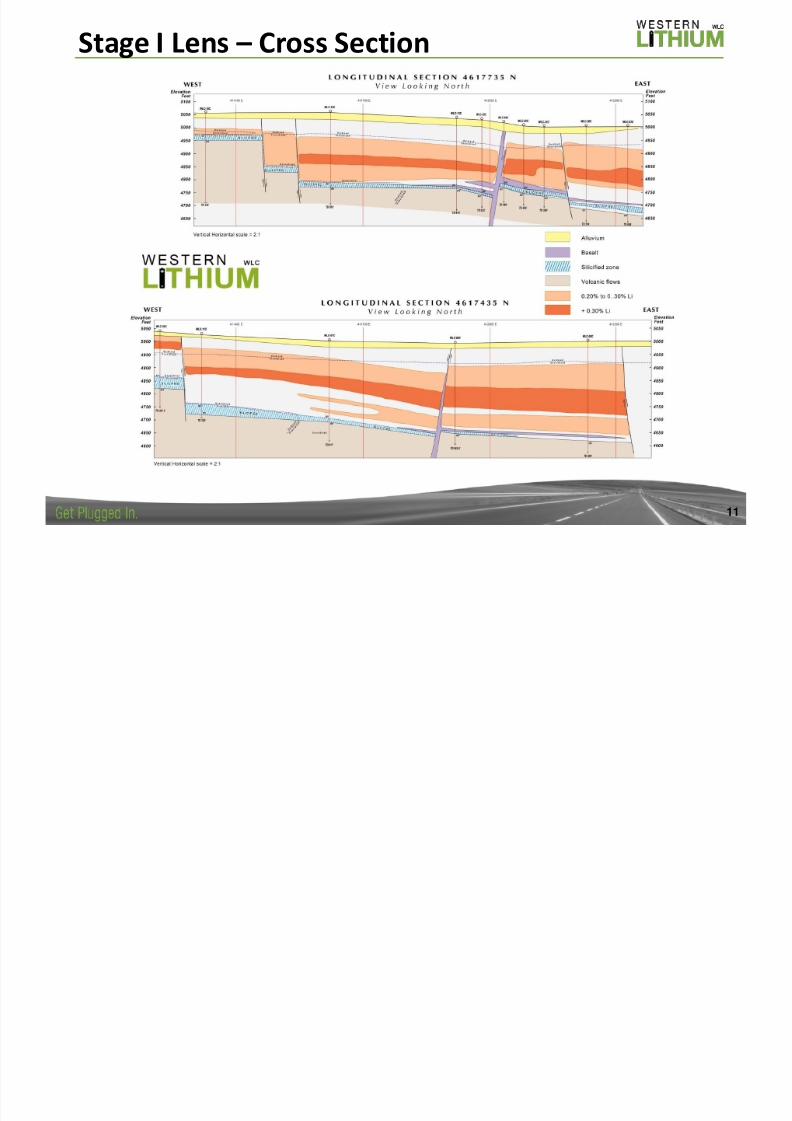
Stage I Lens – Cross Section
8/3/2019 WLC - Feb Website Version
http://slidepdf.com/reader/full/wlc-feb-website-version 12/3712
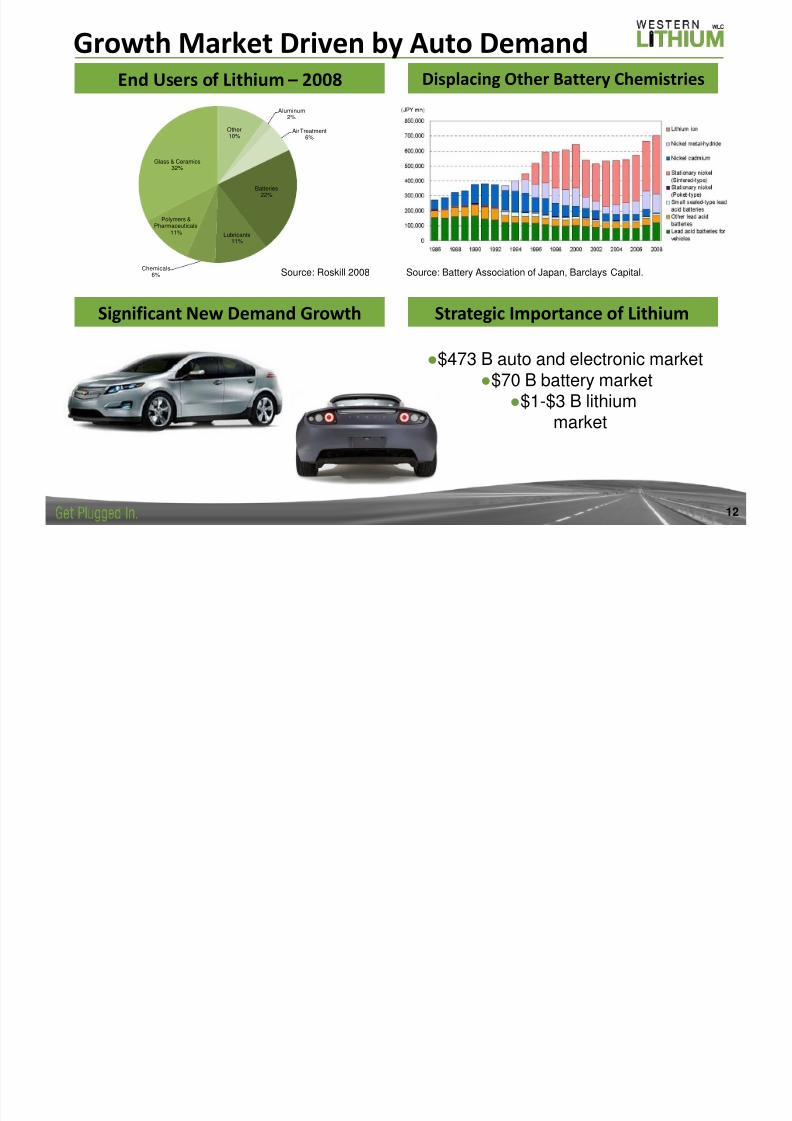
Growth Market Driven by Auto Demand
Other10%
Aluminum2%
Air Treatment6%
Batteries22%
Lubricants11%
Chemicals6%
Polymers &Pharmaceuticals
11%
Glass & Ceramics32%
Source: Roskill 2008
End Users of Lithium – 2008
Source: Battery Association of Japan, Barclays Capital.
●$473 B auto and electronic market●$70 B battery market
●$1-$3 B lithiummarket
Displacing Other Battery Chemistries
Significant New Demand Growth Strategic Importance of Lithium
8/3/2019 WLC - Feb Website Version
http://slidepdf.com/reader/full/wlc-feb-website-version 13/37
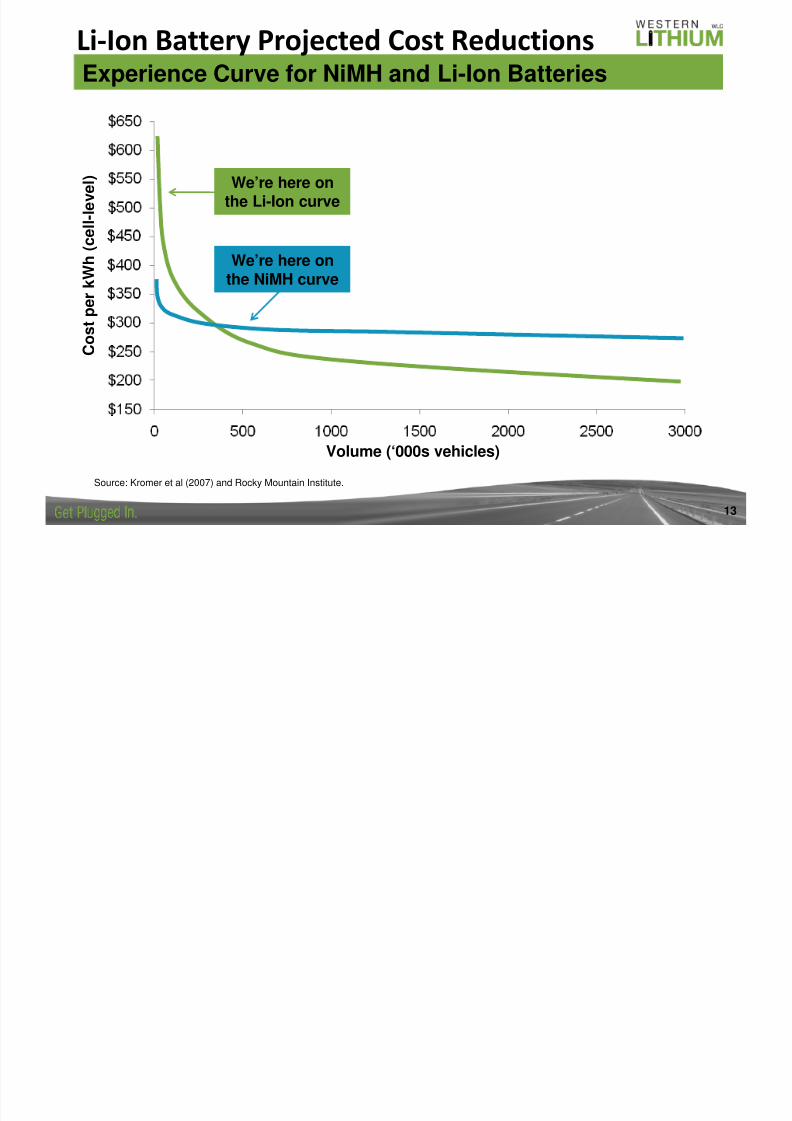
Li-Ion Battery Projected Cost Reductions
13
Experience Curve for NiMH and Li-Ion Batteries
Source: Kromer et al (2007) and Rocky Mountain Institute.
Volume (‘000s vehicles)
C o s t p e r k W h ( c e l l - l e v e l ) We’re here on
the Li-Ion curve
We’re here onthe NiMH curve
8/3/2019 WLC - Feb Website Version
http://slidepdf.com/reader/full/wlc-feb-website-version 14/3714
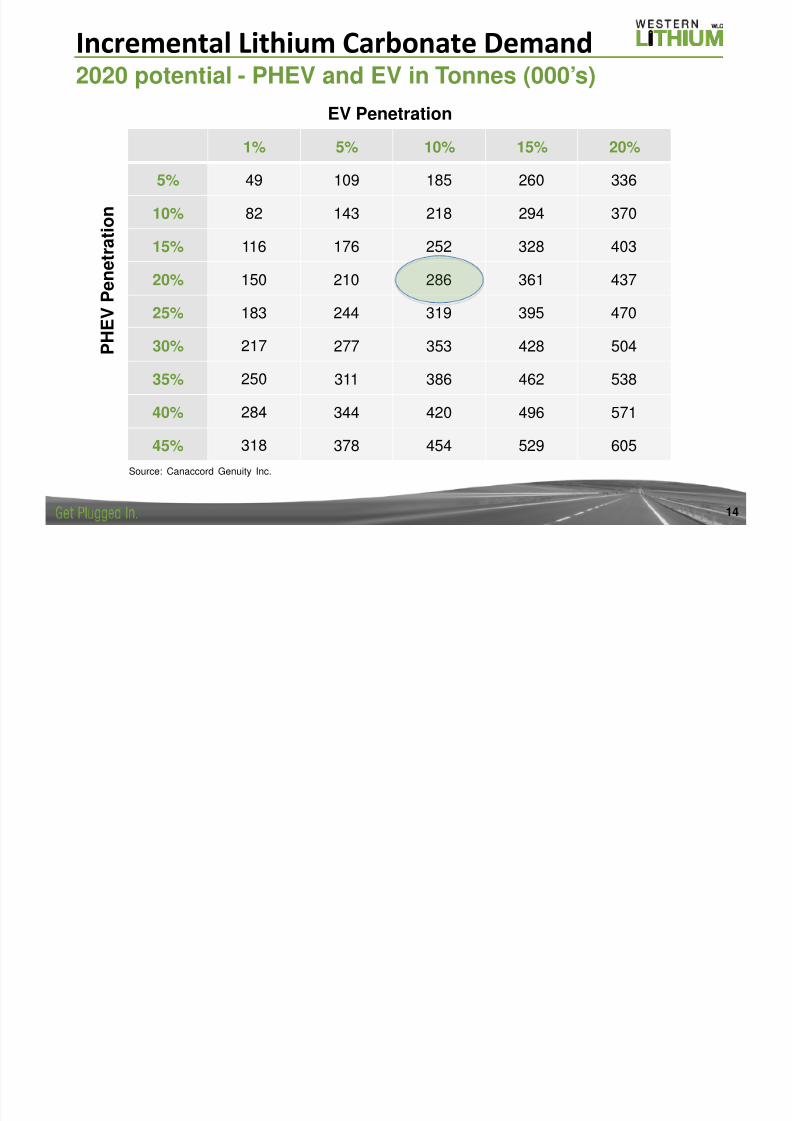
Incremental Lithium Carbonate Demand2020 potential - PHEV and EV in Tonnes (000’s)
1% 5% 10% 15% 20%
5% 49 109 185 260 336
10% 82 143 218 294 370
15% 116 176 252 328 403
20% 150 210 286 361 437
25% 183 244 319 395 470
30% 217 277 353 428 504
35% 250 311 386 462 538
40% 284 344 420 496 571
45% 318 378 454 529 605
Source: Canaccord Genuity Inc.
EV Penetration
P H E V P e n e t r a
t i o n
8/3/2019 WLC - Feb Website Version
http://slidepdf.com/reader/full/wlc-feb-website-version 15/3715
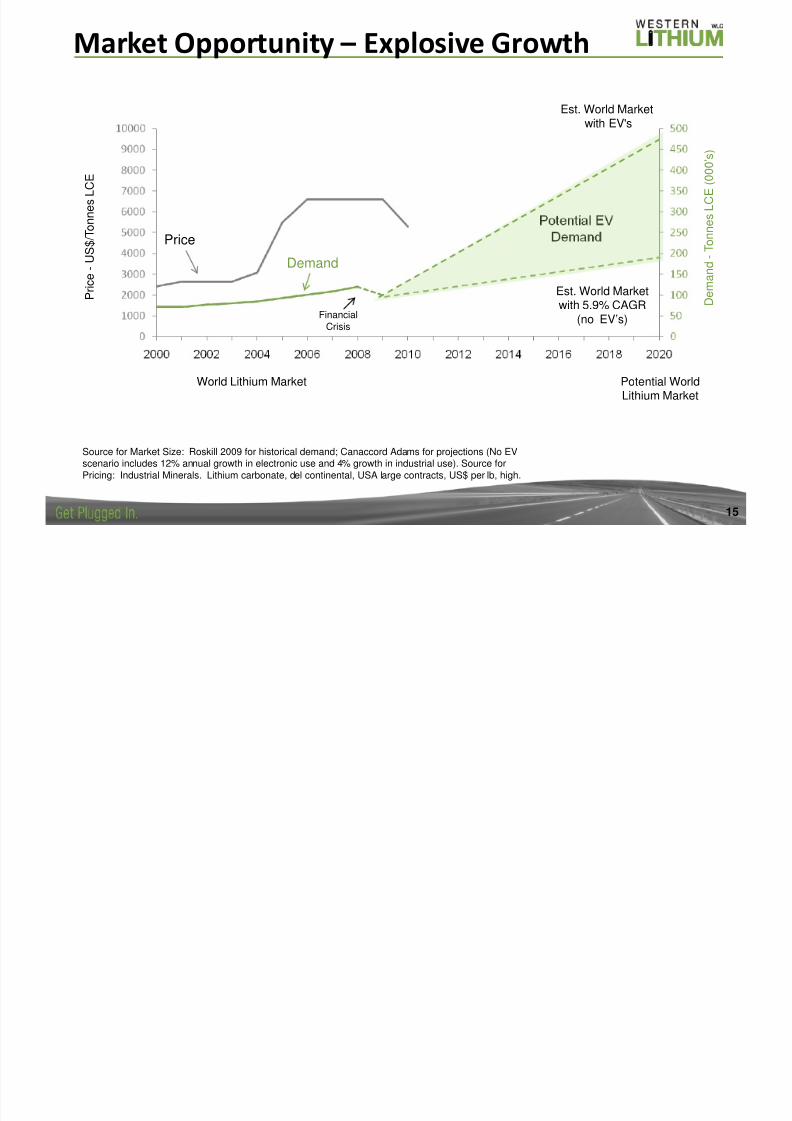
Market Opportunity – Explosive Growth
D e m a n d - T o n n e s L C E ( 0 0 0 ’ s )
World Lithium Market Potential WorldLithium Market
Source for Market Size: Roskill 2009 for historical demand; Canaccord Adams for projections (No EVscenario includes 12% annual growth in electronic use and 4% growth in industrial use). Source forPricing: Industrial Minerals. Lithium carbonate, del continental, USA large contracts, US$ per lb, high.
Est. World Market
with EV's
Est. World Marketwith 5.9% CAGR
(no EV’s)FinancialCrisis
P r i c e - U S $ / T o n n e s L C E
Price
Demand
8/3/2019 WLC - Feb Website Version
http://slidepdf.com/reader/full/wlc-feb-website-version 16/37
8/3/2019 WLC - Feb Website Version
http://slidepdf.com/reader/full/wlc-feb-website-version 17/37
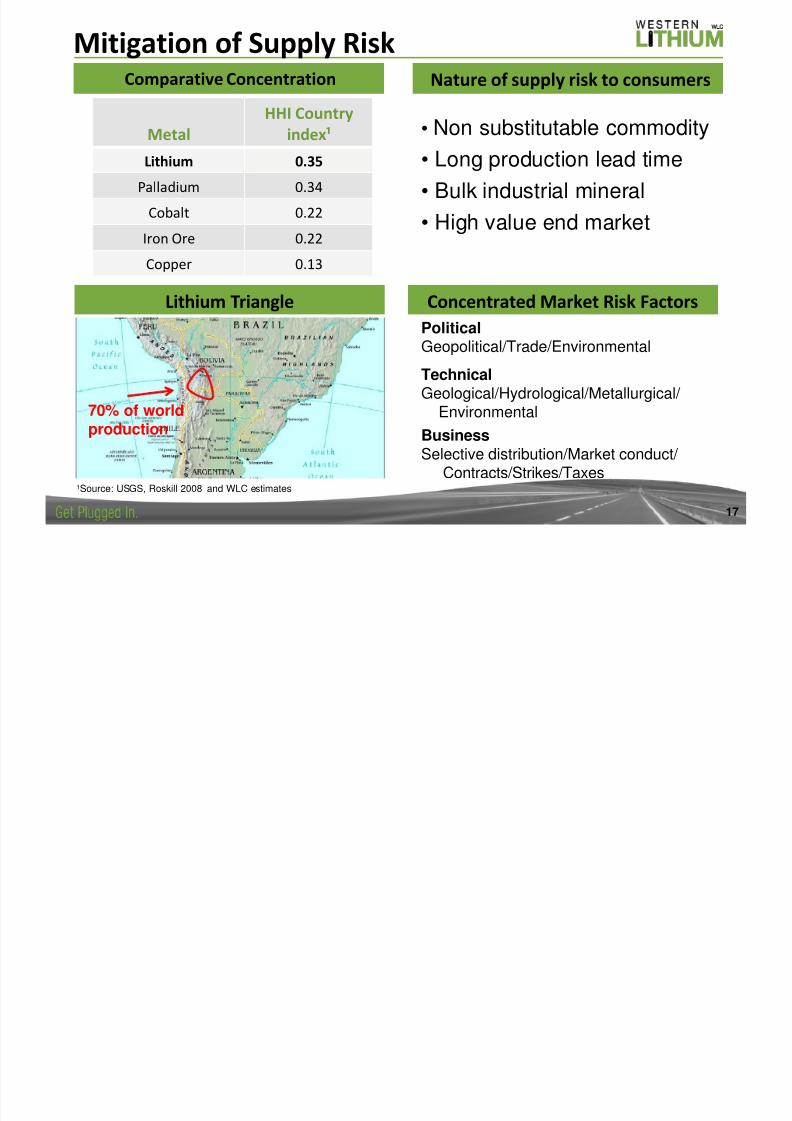
17
Mitigation of Supply RiskNature of supply risk to consumersComparative Concentration
Lithium Triangle Concentrated Market Risk Factors
PoliticalGeopolitical/Trade/Environmental
TechnicalGeological/Hydrological/Metallurgical/
Environmental
BusinessSelective distribution/Market conduct/
Contracts/Strikes/Taxes
• Non substitutable commodity• Long production lead time
• Bulk industrial mineral
• High value end market
Metal
HHI Country
index¹
Lithium 0.35
Palladium 0.34
Cobalt 0.22
Iron Ore 0.22
Copper 0.13
¹Source: USGS, Roskill 2008 and WLC estimates
70% of worldproduction
8/3/2019 WLC - Feb Website Version
http://slidepdf.com/reader/full/wlc-feb-website-version 18/37
18
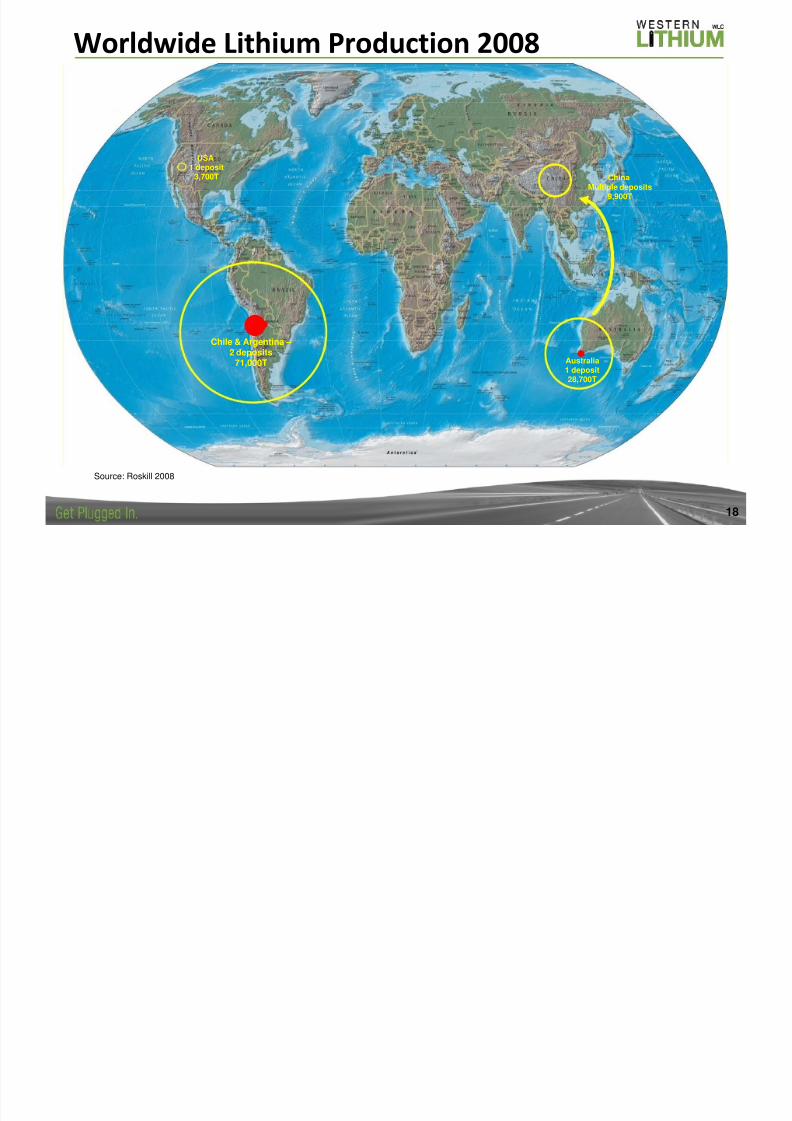
Worldwide Lithium Production 2008
Chile & Argentina –2 deposits
71,000T
USA1 deposit
3,700T
Australia
1 deposit28,700T
ChinaMultiple deposits
9,900T
Source: Roskill 2008
8/3/2019 WLC - Feb Website Version
http://slidepdf.com/reader/full/wlc-feb-website-version 19/37
19
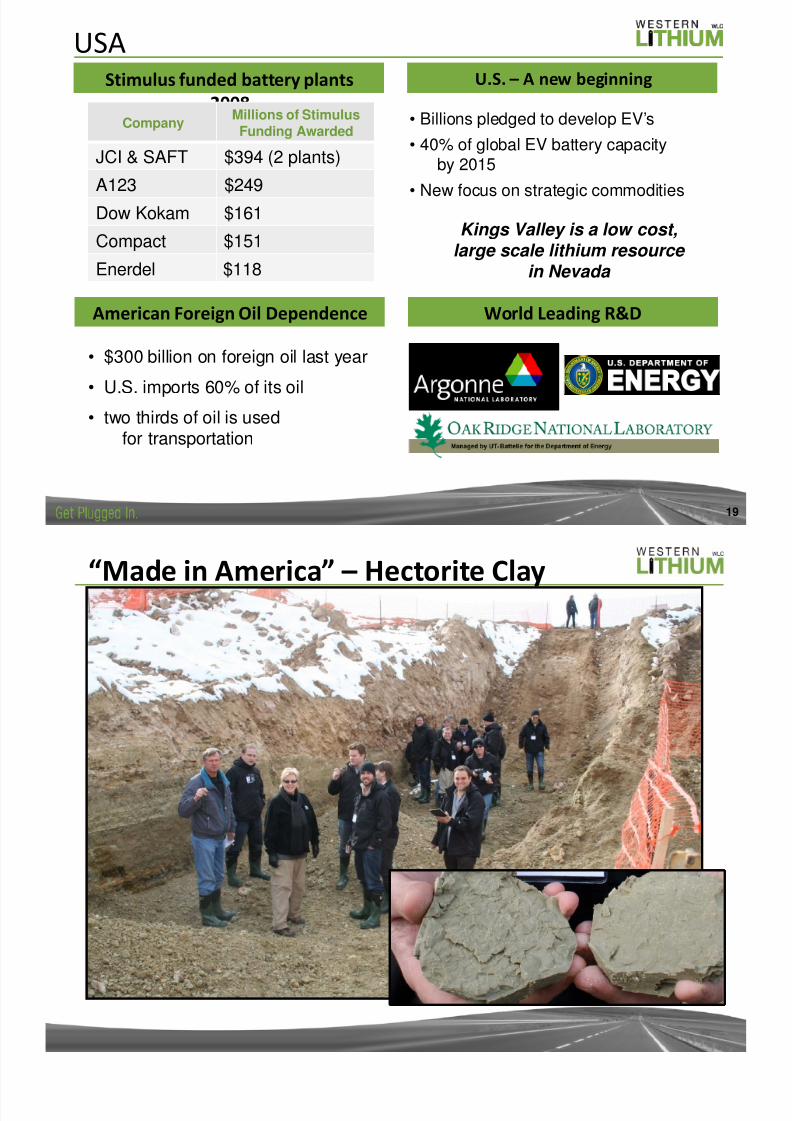
USAStimulus funded battery plants
2008
U.S. – A new beginning
American Foreign Oil Dependence World Leading R&D
• Billions pledged to develop EV’s• 40% of global EV battery capacity
by 2015
• New focus on strategic commodities
Kings Valley is a low cost,
large scale lithium resource in Nevada
CompanyMillions of StimulusFunding Awarded
JCI & SAFT $394 (2 plants)
A123 $249
Dow Kokam $161
Compact $151Enerdel $118
• $300 billion on foreign oil last year
• U.S. imports 60% of its oil
• two thirds of oil is usedfor transportation
8/3/2019 WLC - Feb Website Version
http://slidepdf.com/reader/full/wlc-feb-website-version 20/37
“Made in America” – Hectorite Clay
8/3/2019 WLC - Feb Website Version
http://slidepdf.com/reader/full/wlc-feb-website-version 21/37
21
Quotes
“Demand will be so big there will have to be new sources
of supply….”Rockwood Holdings (Chemetall) Chairman & CEO,
Seifi Ghasemi – Feb. 2010
“We have begun to look for our next source of lithium tobe ready [by the middle of the decade]”
FMC Corp. President, Pierre Brondeau - July 2010
"We are one of the largest and most responsible
companies in the world, so we are always looking atoptions….. If we don't move fast enough, we will miss ourchance,“
SQM President, Patricio de Solminihac – Aug. 2010
8/3/2019 WLC - Feb Website Version
http://slidepdf.com/reader/full/wlc-feb-website-version 22/37
22
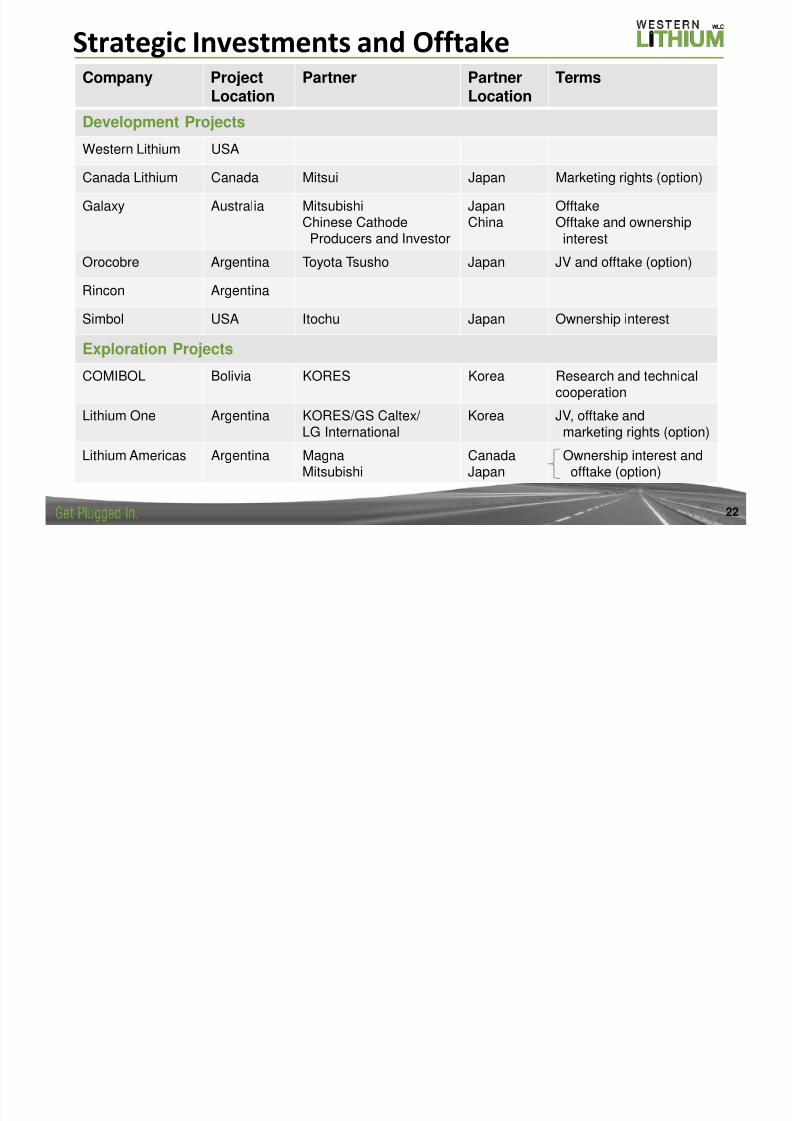
Strategic Investments and OfftakeCompany Project
LocationPartner Partner
LocationTerms
Development ProjectsWestern Lithium USA
Canada Lithium Canada Mitsui Japan Marketing rights (option)
Galaxy Australia MitsubishiChinese CathodeProducers and Investor
JapanChina
OfftakeOfftake and ownershipinterest
Orocobre Argentina Toyota Tsusho Japan JV and offtake (option)
Rincon Argentina
Simbol USA Itochu Japan Ownership interest
Exploration Projects
COMIBOL Bolivia KORES Korea Research and technicalcooperation
Lithium One Argentina KORES/GS Caltex/ LG International
Korea JV, offtake andmarketing rights (option)
Lithium Americas Argentina MagnaMitsubishi
CanadaJapan
Ownership interest andofftake (option)
8/3/2019 WLC - Feb Website Version
http://slidepdf.com/reader/full/wlc-feb-website-version 23/37
2323
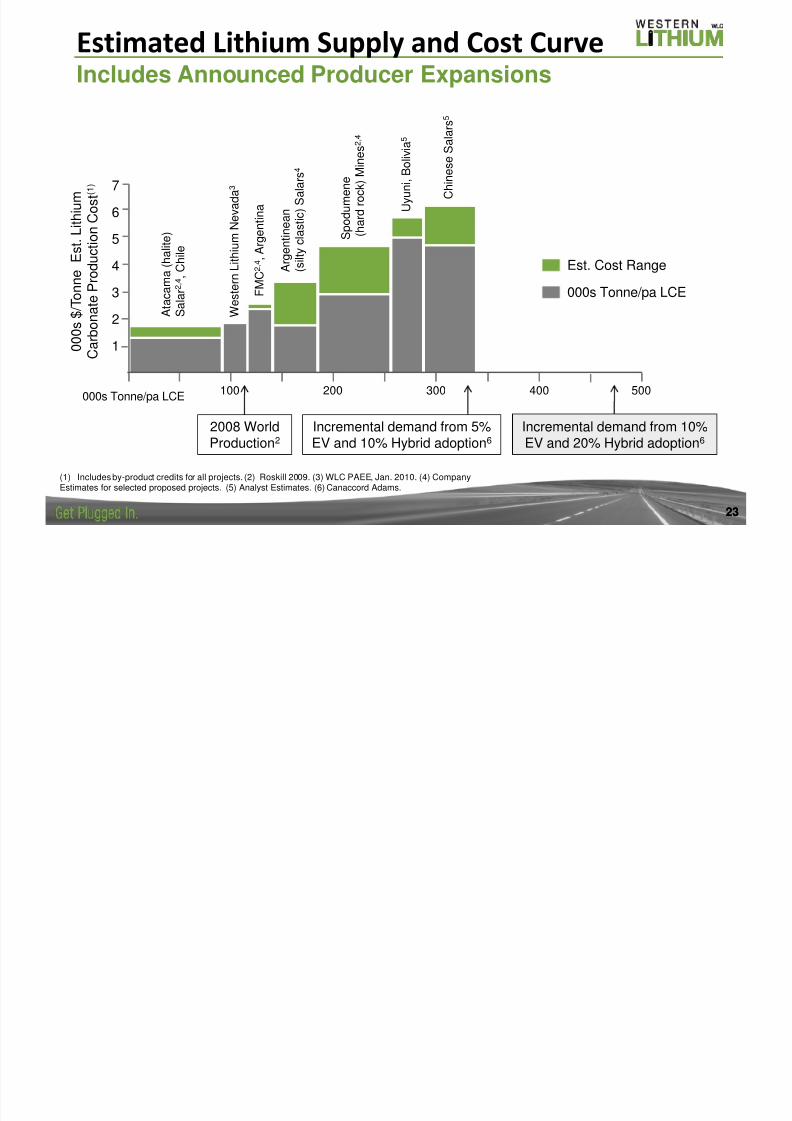
Estimated Lithium Supply and Cost CurveIncludes Announced Producer Expansions
(1) Includes by-product credits for all projects. (2) Roskill 2009. (3) WLC PAEE, Jan. 2010. (4) CompanyEstimates for selected proposed projects. (5) Analyst Estimates. (6) Canaccord Adams.
0 0 0 s $ / T o n n e E s t . L i t h i u m
C a r b o n a t e P r o d u c t i o n C o s t ( 1 )
S p o d u m e n e
( h a r d r o c k ) M i n e s 2 , 4
C h i n e s e S a l a r s
5
W e s t e r n L i t h i u
m N e v a d a 3
F M C 2 , 4 , A r g e n t i n a
A r g e n t i n e a n
( s i l t y
c l a s t i c ) S a l a r s 4
U y u n i , B o l i v i a 5
2008 WorldProduction2
Incremental demand from 5%EV and 10% Hybrid adoption6
Incremental demand from 10%EV and 20% Hybrid adoption6
Est. Cost Range
A t a c a m a ( h a l i t e )
S a l a r 2 , 4 , C h i l e
000s Tonne/pa LCE
7
6
5
4
3
2
1
400000s Tonne/pa LCE
500300200100
8/3/2019 WLC - Feb Website Version
http://slidepdf.com/reader/full/wlc-feb-website-version 24/37
24
Process Highlights
24
• Process based on a modified USBM design
• Thermal decomposition and water leach
• Estimated Recoveries: 88.5% Lithium
80.5% Potassium
• Process enhances lithium carbonate purity
• Potassium sulfate recovered separate from lithium
• Other by-product potentialSource: PAEE, Jan. 2010.
8/3/2019 WLC - Feb Website Version
http://slidepdf.com/reader/full/wlc-feb-website-version 25/37
25
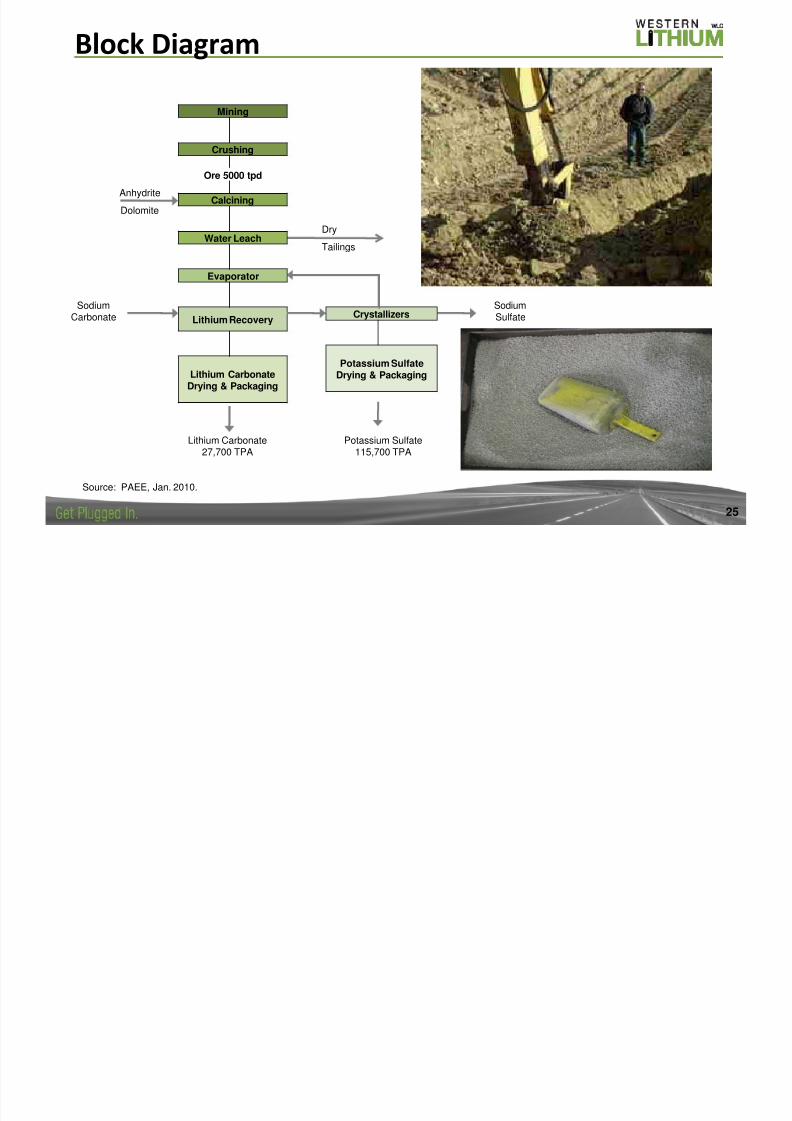
Block Diagram
Mining
Crushing
Ore 5000 tpd
Calcining
Water Leach
Evaporator
Lithium Recovery
Lithium CarbonateDrying & Packaging
Crystallizers
Potassium Sulfate
Drying & Packaging
Anhydrite
Dolomite
Dry
Tailings
SodiumCarbonate
Lithium Carbonate27,700 TPA
Potassium Sulfate115,700 TPA
SodiumSulfate
Source: PAEE, Jan. 2010.
8/3/2019 WLC - Feb Website Version
http://slidepdf.com/reader/full/wlc-feb-website-version 26/37
26
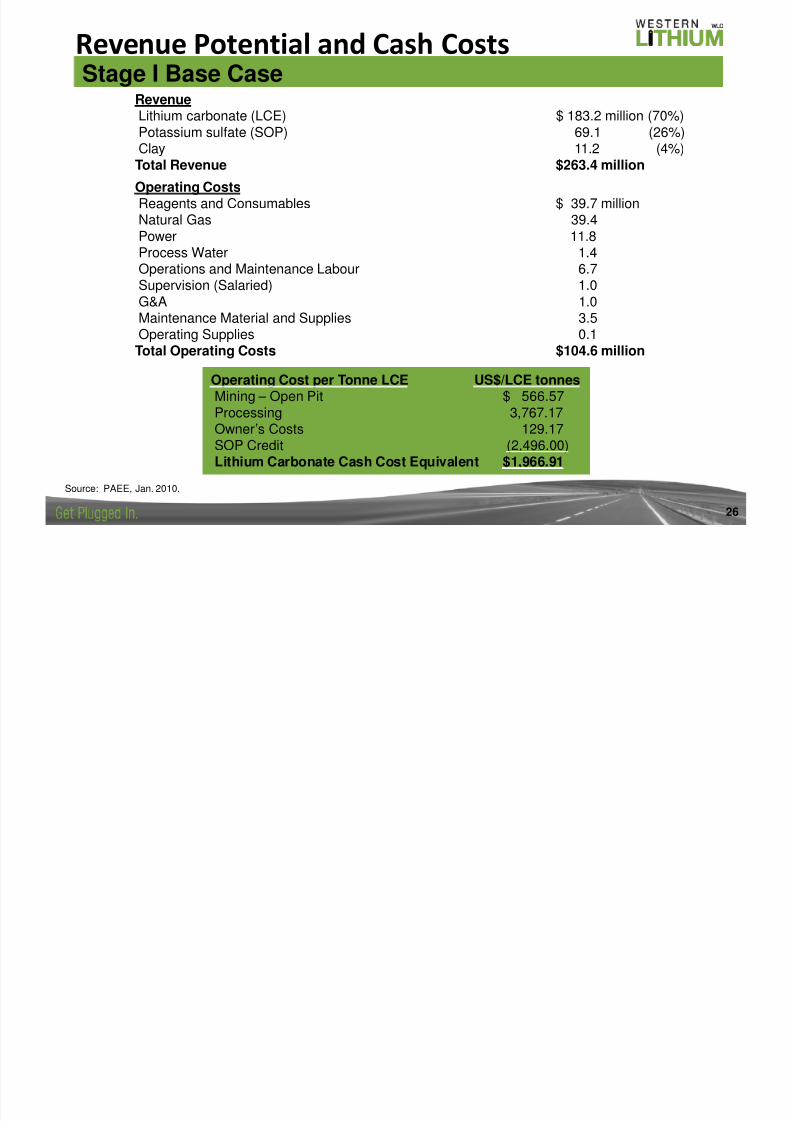
Revenue Potential and Cash CostsStage I Base Case
Source: PAEE, Jan. 2010.
RevenueLithium carbonate (LCE) $ 183.2 million (70%)Potassium sulfate (SOP) 69.1 (26%)Clay 11.2 (4%)Total Revenue $263.4 million
Operating CostsReagents and Consumables $ 39.7 millionNatural Gas 39.4Power 11.8
Process Water 1.4Operations and Maintenance Labour 6.7Supervision (Salaried) 1.0G&A 1.0Maintenance Material and Supplies 3.5Operating Supplies 0.1Total Operating Costs $104.6 million
Operating Cost per Tonne LCE US$/LCE tonnesMining – Open Pit $ 566.57Processing 3,767.17Owner’s Costs 129.17SOP Credit (2,496.00)Lithium Carbonate Cash Cost Equivalent $1,966.91
8/3/2019 WLC - Feb Website Version
http://slidepdf.com/reader/full/wlc-feb-website-version 27/37
27
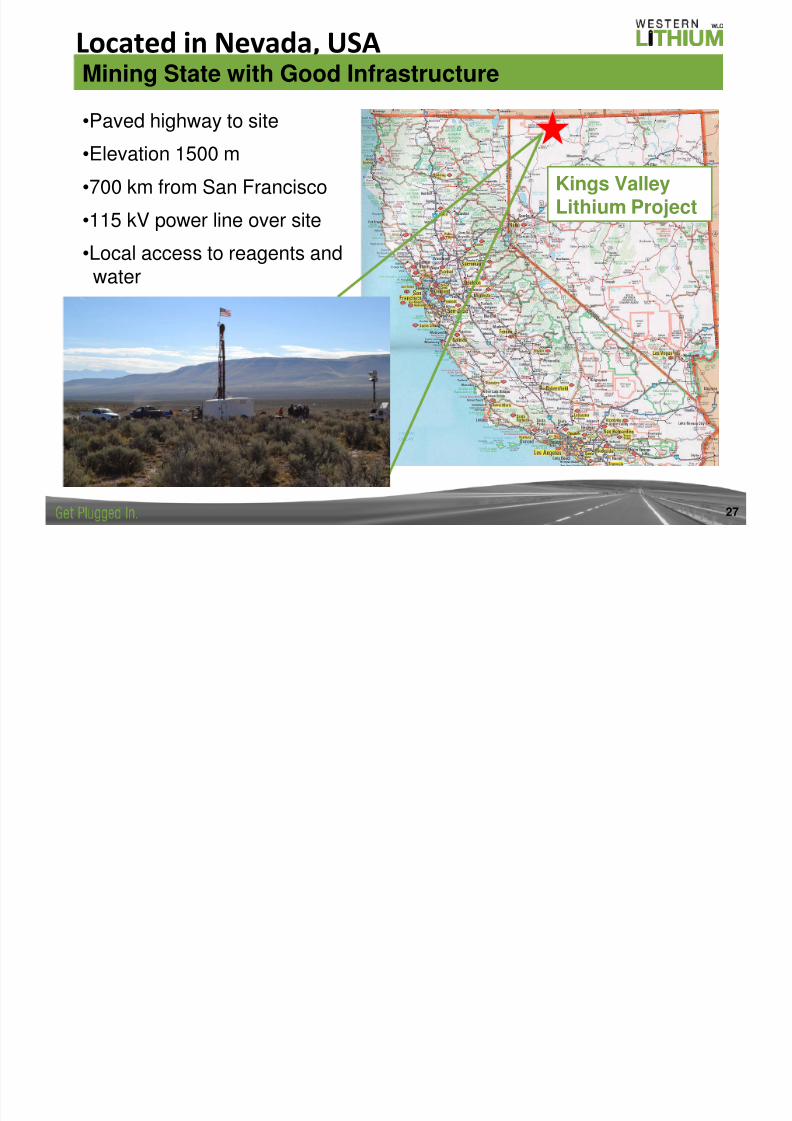
Located in Nevada, USAMining State with Good Infrastructure
Kings ValleyLithium Project
•Paved highway to site•Elevation 1500 m
•700 km from San Francisco
•115 kV power line over site
•Local access to reagents andwater
8/3/2019 WLC - Feb Website Version
http://slidepdf.com/reader/full/wlc-feb-website-version 28/37
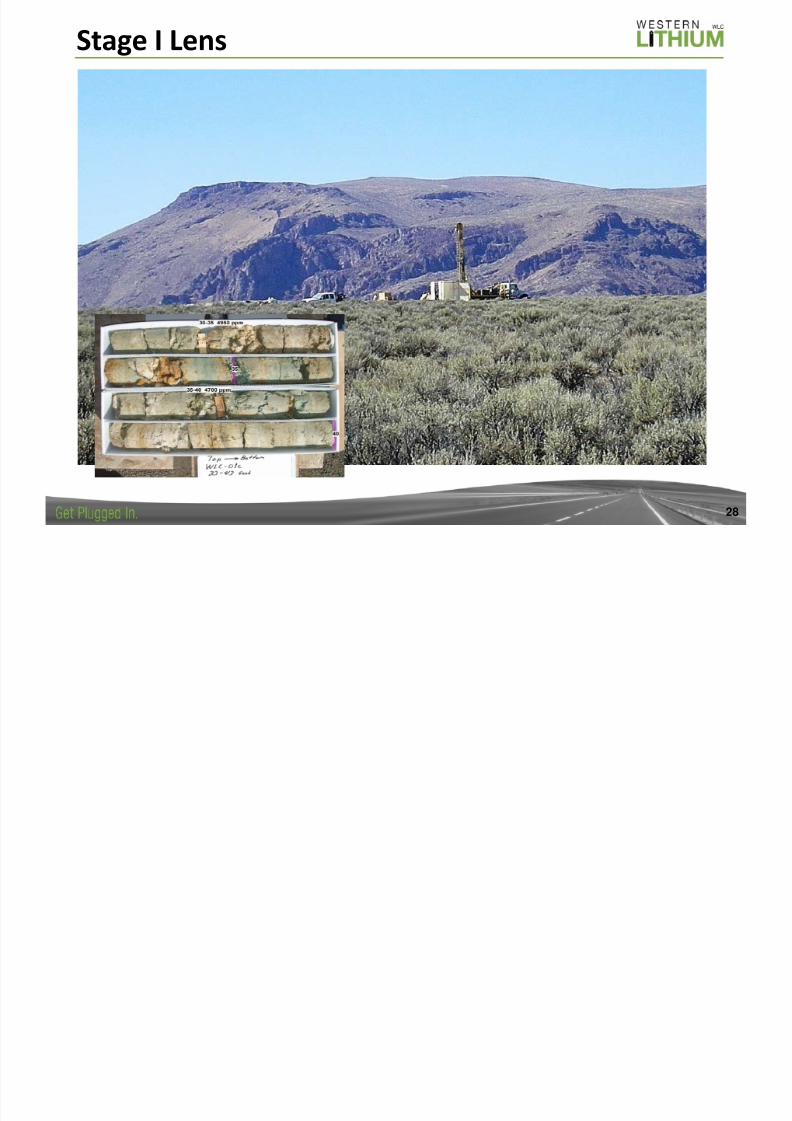
28
Stage I Lens
8/3/2019 WLC - Feb Website Version
http://slidepdf.com/reader/full/wlc-feb-website-version 29/37
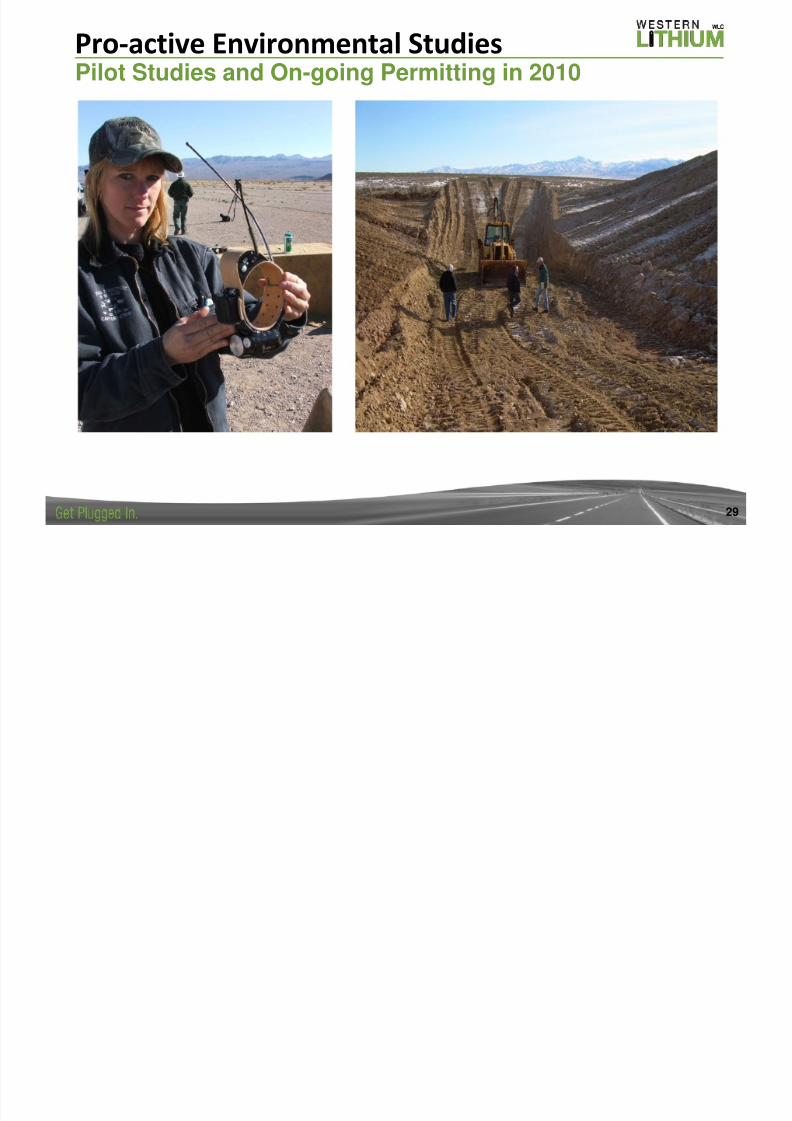
29
Pro-active Environmental StudiesPilot Studies and On-going Permitting in 2010
8/3/2019 WLC - Feb Website Version
http://slidepdf.com/reader/full/wlc-feb-website-version 30/37
30
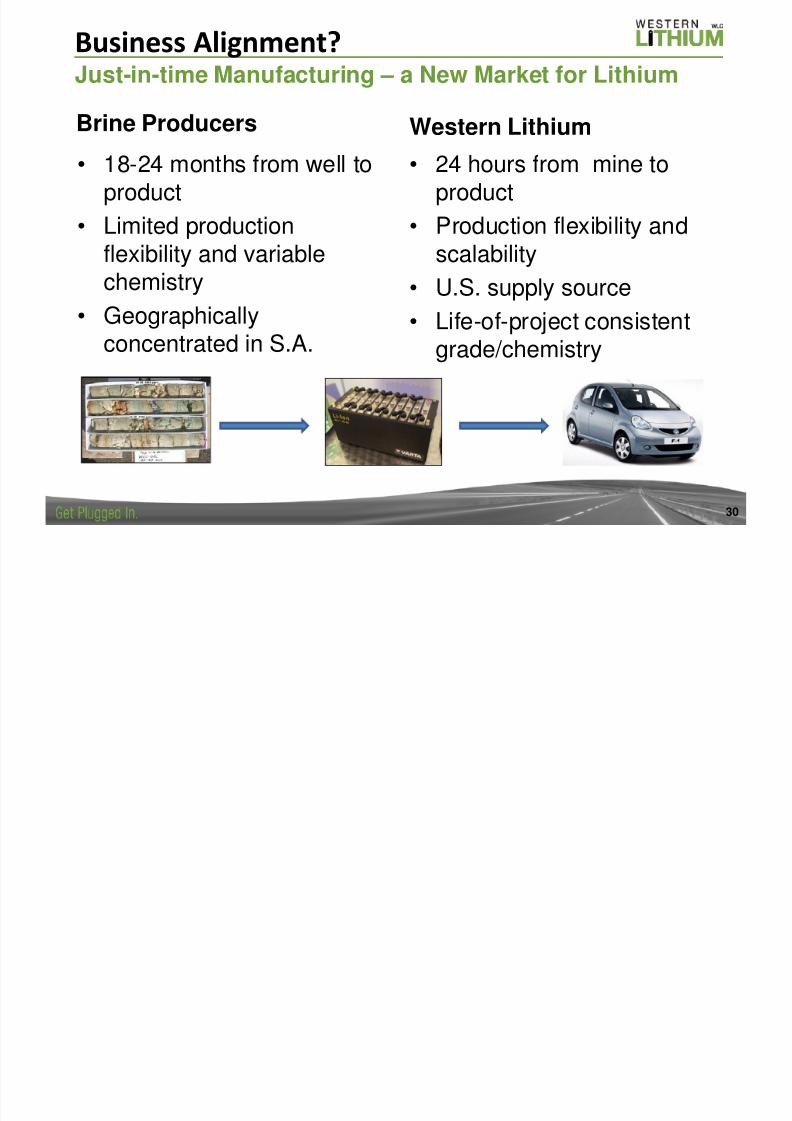
Brine Producers• 18-24 months from well to
product
• Limited production
flexibility and variablechemistry
• Geographicallyconcentrated in S.A.
Western Lithium• 24 hours from mine to
product
• Production flexibility and
scalability• U.S. supply source
• Life-of-project consistentgrade/chemistry
Business Alignment?Just-in-time Manufacturing – a New Market for Lithium
8/3/2019 WLC - Feb Website Version
http://slidepdf.com/reader/full/wlc-feb-website-version 31/37
31
Historical Process Engineering
US Geological Survey – 1970s•Identified a rare lithium occurrence at Kings Valley
Chevron Resources – 1970s and early 1980s•Geological delineation of historical lithium lenses•Flow sheet development and economic analysis
US Bureau of Mines – 1980s
•Extractive metallurgical testing, economic studies and pilot plant
Independent Laboratories for Western Lithium – 2007/2008•Confirmatory testing of Chevron studies
Western Lithium with Independent Laboratories – 2008/2009
•Laboratory for process flow sheet development and ongoing testing
Western Lithium & Independent Engineers – 2009/2010/2011•PAEE (Scoping Study) complete, pilot production of high quality lithiumcarbonate, additional pilot production and engineering studies underway
8/3/2019 WLC - Feb Website Version
http://slidepdf.com/reader/full/wlc-feb-website-version 32/37
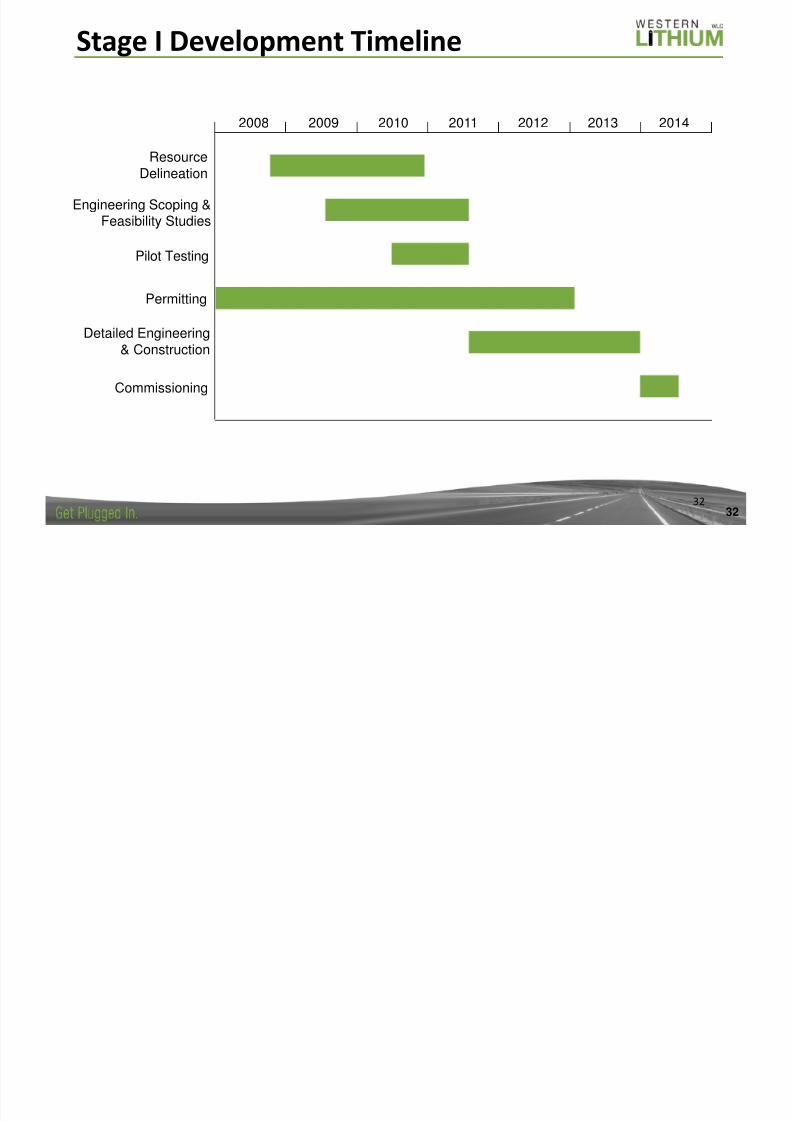
Stage I Development Timeline
32
Detailed Engineering& Construction
ResourceDelineation
Pilot Testing
Permitting
Commissioning
2008 2009 2010 2011 2012 2013 2014
Engineering Scoping &Feasibility Studies
32
8/3/2019 WLC - Feb Website Version
http://slidepdf.com/reader/full/wlc-feb-website-version 33/37
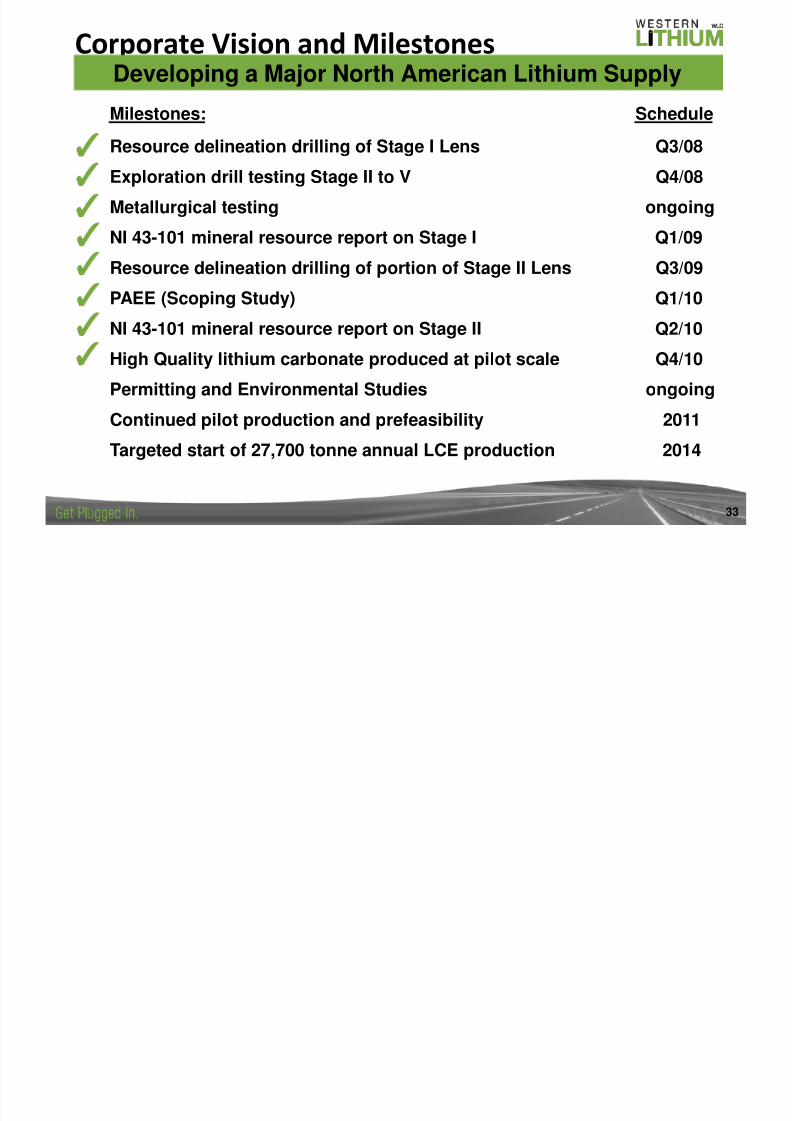
33
Corporate Vision and MilestonesDeveloping a Major North American Lithium Supply
Milestones: Schedule
Resource delineation drilling of Stage I Lens Q3/08
Exploration drill testing Stage II to V Q4/08
Metallurgical testing ongoing
NI 43-101 mineral resource report on Stage I Q1/09
Resource delineation drilling of portion of Stage II Lens Q3/09
PAEE (Scoping Study) Q1/10
NI 43-101 mineral resource report on Stage II Q2/10
High Quality lithium carbonate produced at pilot scale Q4/10
Permitting and Environmental Studies ongoing
Continued pilot production and prefeasibility 2011
Targeted start of 27,700 tonne annual LCE production 2014
✓
✓
✓
✓
✓
✓
✓
✓
8/3/2019 WLC - Feb Website Version
http://slidepdf.com/reader/full/wlc-feb-website-version 34/37
34
Directors and OfficersEdward Flood, Chairman. Co-founder and Chairman of Western Uranium Corporation and Western LithiumCorporation. Over 35 years experience in mining industry including Deputy Chairman of Ivanhoe Mines.
William Haldane, Director. Founder of Haldane Diogenes, an international executive recruiting firm specializing
in executive searches in mining, pulp and paper, pharmaceuticals, and consumer goods.
John Macken, Director. CEO & President of Ivanhoe Mines, served as Freeport McMoran Copper and Gold,Senior VP of Strategic Planning and Development and as EVP and General Manager at Freeport's Grasbergmining complex.
William M. Sheriff, Director. Chairman and CEO of Golden Predator Corp. Co-founder and Chairman of EnergyMetals Corporation, which was acquired by Uranium One. Leading prospect developer in the western U.S., with27 years experience in mineral exploration and company development.
Jay Chmelauskas, President and Director. Geological engineer with 15 years international experience in theengineering, mining and chemical industries including the exploration, development and sale of one of China’slargest gold mines.
Silvio Bertolli, Senior Vice President. Chemical engineer with 37 years experience in process design &technology development in chemicals, petrochemicals, mining and oil and gas.
Dennis Bryan, Senior Vice President. Geological engineer with 35 years experience in industrial minerals
exploration, evaluation and development.
Eduard Epshtein, CFO. CFO of WLC, WUC, Southern Arc Minerals and Canada Energy Partners.
Cindy Burnett, VP IR. Previous IR experience with Skye Resources, Ivanhoe Energy and NOVA Chemicals.
Tracy Hansen, Corp. Sec. Experience with exploration and development companies in Nevada, Canada andMexico.
8/3/2019 WLC - Feb Website Version
http://slidepdf.com/reader/full/wlc-feb-website-version 35/37
35
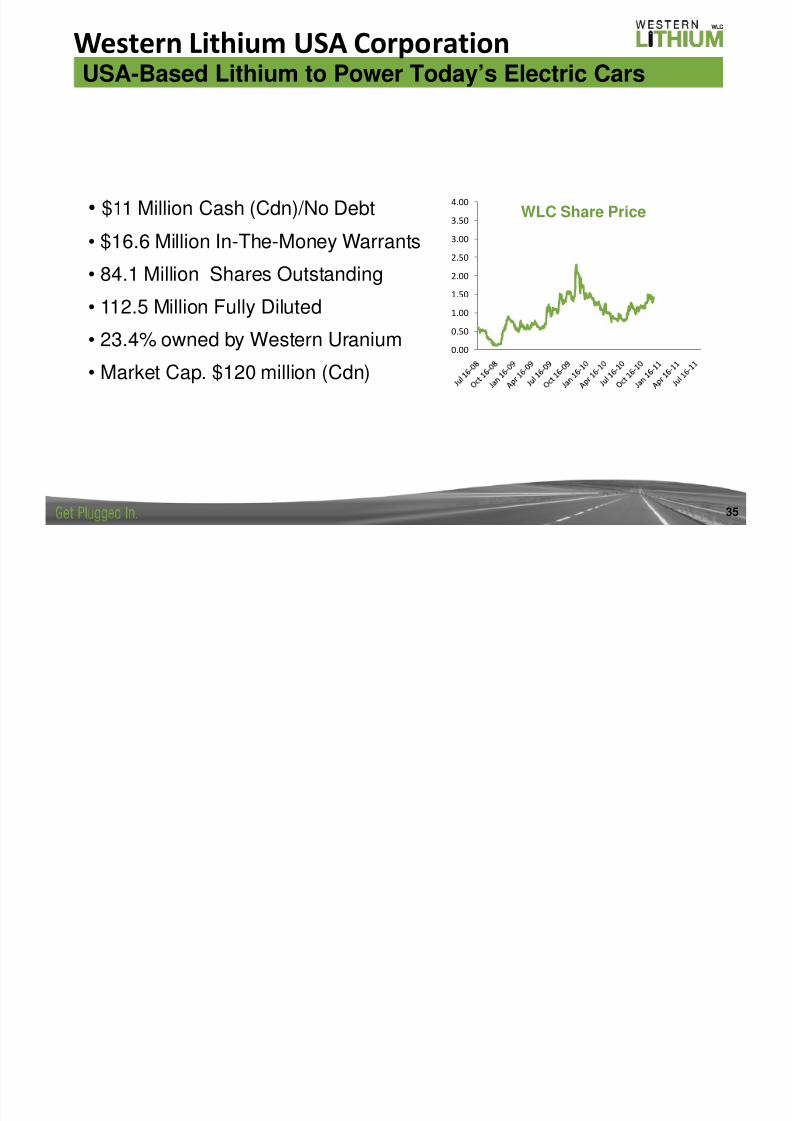
Western Lithium USA Corporation
WLC Share Price• $11 Million Cash (Cdn)/No Debt
• $16.6 Million In-The-Money Warrants• 84.1 Million Shares Outstanding
• 112.5 Million Fully Diluted
• 23.4% owned by Western Uranium
• Market Cap. $120 million (Cdn)
USA-Based Lithium to Power Today’s Electric Cars
0.00
0.50
1.00
1.50
2.00
2.50
3.00
3.50
4.00
8/3/2019 WLC - Feb Website Version
http://slidepdf.com/reader/full/wlc-feb-website-version 36/37
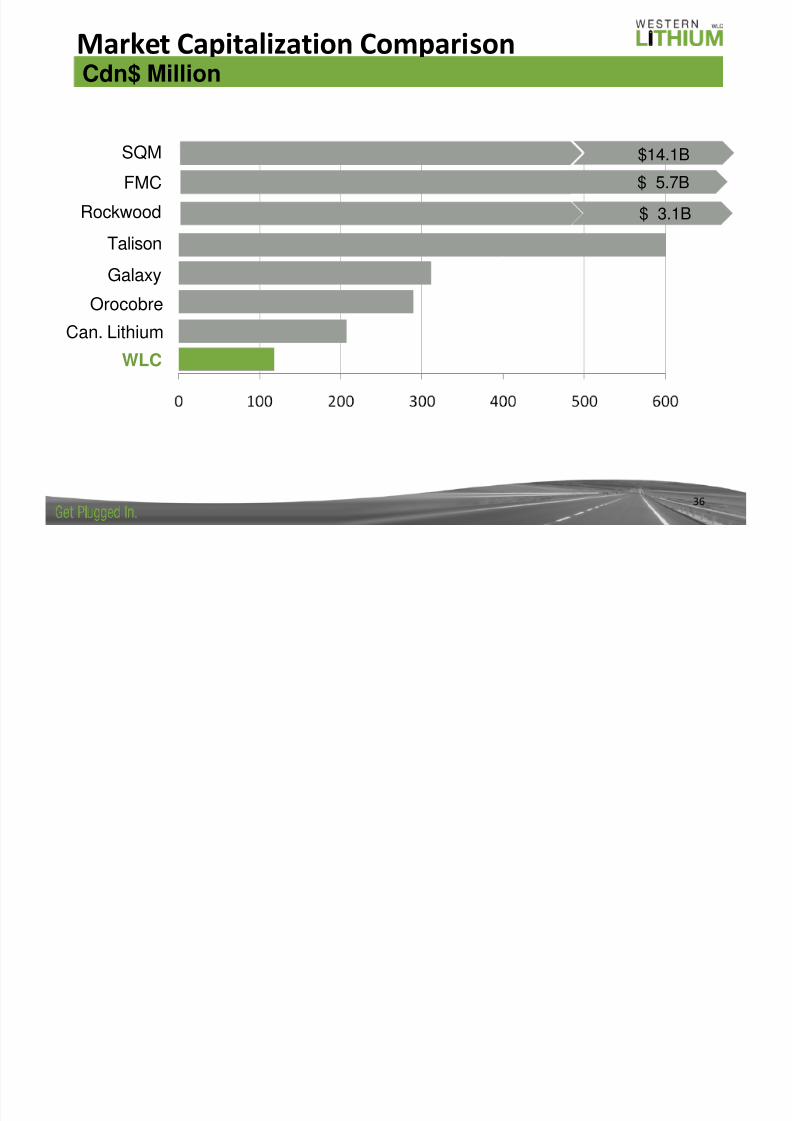
36
Market Capitalization ComparisonCdn$ Million
SQM
FMC
Rockwood
TalisonGalaxy
Orocobre
WLC
Can. Lithium
$14.1B
$ 5.7B
$ 3.1B

8/3/2019 WLC - Feb Website Version
http://slidepdf.com/reader/full/wlc-feb-website-version 37/37
www.westernlithium.comEmail: [email protected]
Western Lithium Investor Relations: 1-604-681-3071Exchange Symbols: TSX: WLC; OTCQX: WLCDF