Embed Size (px)
Citation preview

1
Wolverhampton Development Plan
Annual Monitoring Report 2013/14 ‘the Authorities Monitoring Report’
March 2015
(Republished May 2015 to include Black Country key target data)

2
Contents Page Executive Summary 5 1.0 Introduction 9 2.0 Spatial Characteristics and Contextual Indicators 2.1 Spatial Characteristics 11 2.2 Contextual Indicators 2.2.1 Demographic Profile 12 2.2.2 Economic Profile 13 2.2.3 Housing Profile 14 2.2.4 Transport Profile 16 2.2.5 Socio-Cultural Profile 16 2.2.6 Environmental (Significant Effects Indicators) 17 2.2.7 Planning Applications 19 2.2.8 Section 106 Agreements and the CIL 20 2.2.9 Wolverhampton Local Development Scheme (LDS) 21 2.2.10 Duty to Cooperate 22 3.0 Core and Local Indicators
3.1 Spatial Strategy and Delivery 24
3.2 Housing 30
3.3 Economy and Employment 38
3.4 Centres and Town Centre Uses 44
3.5 Transport 48
3.6 Environmental Infrastructure 52
3.7 Waste 66
3.8 Minerals 70
3.9 Statement of Community Involvement (SCI) 72
3.10 Access and Facilities for Disabled People (SPD) 73 Glossary 74 Appendix A – Black Country Core Strategy Monitoring Indicators 76 Appendix B – Core Output Indicators 79 Appendix C – Local Output indicators 79 Appendix D – Duty to Cooperate 81 Appendix E – Black Country Housing Trajectory 82 Appendix F – Employment Development Opportunities 83

3
List of Maps, Tables, Charts and Figures MAPS Map 1: Wolverhampton in context of the Black Country Map 2: Significant Development Sites Map 3: Readily Available Employment Land in Wolverhampton 2013/14 TABLES Table 1: Environmental (Significant Effects Indicators) Table 2: Number of Planning Applications Table 3: Section 106 Contributions Table 4: LDS Summary 2013/14 Table 5: Implementation of the Duty to Cooperate Table 6: Black Country Key Targets Table 7: Spatial Strategy for Employment Table 8: Progress on Significant Developments in Wolverhampton 2013/14 Table 9: Decisions on planning applications in the Green Belt Table 10: Plan Period and Housing Targets Table 11: Wolverhampton Total Net Completions 2000-2014 Table 12: Performance against BCCS housing targets for the Growth Network and
Freestanding Employment Sites Table 13: Previous Use of Housing Completion Sites 2001-2014 Table 14: Home Type for Gross Completions 2013/14 Table 15: Wolverhampton Affordable Housing Figures: 2006-14 Table 16: Employment Completions on Employment Land Table 17: Loss of Employment Land Table 18: Progress towards meeting high quality and low quality employment land needs Table 19: Readily Available Employment Land 2013/14 Table 20: Number of developments making provision for targeted recruitment Table 21: Town Centre Uses Permissions granted in 2013/14 in Wolverhampton Table 22: Number of Permissions Town Centre Uses 2013/14 Table 23: Progress towards Core Strategy Targets (net additional floorspace) Table 24: Number of vacant retail units in the City Centre at 1st April 2014 Table 25: Recorded usage of cycle routes Table 26: Delivery of Proposed Cycle Network since 2009/10 Table 27: Publically owned long stay parking spaces in strategic centres Table 28: Planning Applications in SINCs Table 29: Planning Applications in SLINCs Table 30: Planning Applications in Ancient Woodland Table 31: Planning Permissions Affecting Local Sites Table 32: New build housing sites granted permission during 2013-14 Table 33: Listed buildings/scheduled monument at risk/neglected or demolished Table 34: BCCS LACW Landfill Diversion Targets Table 35: LACW Landfill Division Rates Table 36: LACW Arisings 2002/3 – 2013/14 Table 37: Number of new waste management facilities proposed / implemented that meet
Policy WM4 locational requirements (Wolverhampton)

4
CHARTS Chart 1: Spatial Strategy and Delivery Indicator Summary Chart 2: Housing Indicator Summary Chart 3: Economy & Employment Indicators Summary Chart 4: Centres and Town Centre Uses Indicator Summary Chart 5: Transport Indicator Summary Chart 6: Environment Indicator Summary Chart 7: Waste Indicator Summary Chart 8: Minerals Indicator Summary Chart 9: Statement of Community Involvement Indicator Summary Chart 10: Access and Facilities for Disabled People: Creating an Inclusive Built Environment
SPD Indicator Summary FIGURES Figure 1: Total Resident Population Figure 2: Economic Activity Rate, Population Aged 16-64 Figure 3: Percentage of Resident Working Age Population Claiming Jobseeker’s Allowance Figure 4: Total Dwellings Figure 5: Percentage of Dwellings by Tenure in Wolverhampton Figure 6: Employment Development Opportunities – Portfolio 2013/14

5
Executive Summary This Annual Monitoring Report (AMR) is one component of the group of documents that comprises the Wolverhampton Local Plan. The Local Plan is seeking to implement the vision for Wolverhampton set out in the adopted Sustainable Community Strategy 2009 (SCS)1:
“By 2026, Wolverhampton will be a City where people can thrive. The economy is transformed and the gap in health, wealth and prosperity between communities and neighbourhoods in the City is substantially reduced. Wolverhampton is a place with safe, strong, diverse and popular neighbourhoods; a place where everyone has an improved quality of life and the chance to reach his or her full potential and where the benefits of the City’s growth are widely shared.”
Wolverhampton City Council adopted its Unitary Development Plan (UDP) in 2006 which contains policies and proposals for the physical development and use of land, including measures to protect and improve the environment up to 2011. The vision and objectives of the UDP are:
‘To create a more sustainable Wolverhampton by improving the economic, social and environmental wellbeing for everyone within the city; to contribute to raising the quality of life of residents and to support the development of strong, safe and inclusive communities’.
In February 2011, the Council adopted its Core Strategy, which has been prepared jointly with the other Black Country local authorities of Dudley, Sandwell and Walsall. This will update and align planning policies and proposals with the vision in the SCS. It will also supersede certain policies in the UDP. These changes are reported in this year’s AMR. This AMR is the tenth of its kind for Wolverhampton, and covers the monitoring year 1st April 2013 – 31st March 2014. Producing an AMR is a statutory requirement and it remains the main mechanism for reviewing the effectiveness of policies in the Local Plan and identifying the need for change. The findings of this monitoring year are analysed in detail in this report, with the performance against the Black Country Core Strategy monitoring indicators summarised at the end of each section. This is the third year for monitoring these indicators following the adoption of the Black Country Core Strategy in February 2011. A brief summary of the key results from this monitoring year are: Key Spatial Characteristics and Contextual Indicators
Population has risen slightly, and Wolverhampton has the greatest proportion of minority groups compared to the other Black Country Local Authorities.
Figures for 2012/13 show that the economic activity rate in Wolverhampton is 71.3%, this is lower than the national rate of 77.5%. Employment in Wolverhampton has a reliance on manufacturing; however health, retail and education are also large employers. Average earnings in Wolverhampton are £24,930; this is less than the national average of £27,376. In Wolverhampton 5.8% of the working age population were claiming JSA compared to 2.4% in England.
1 A revised SCS, known as the City Strategy was adopted in 2011/12

6
As of April 2013 there were approximately 107,040 dwellings in Wolverhampton. The large majority of dwellings are in the owner-occupied / private rented sectors (72.7%). Local authority housing accounts for 21.8% in Wolverhampton. Vacant homes in Wolverhampton accounts for 3.6% of the housing stock. The average house price in Wolverhampton was £101,117; there has been a downward trend since the last house price peak in 2007, but signs of a reversal are now showing.
Travel by train / Metro is more prominent in Wolverhampton (4.3%) compared to the other Black Country Local Authorities. Around 10% of people walk to work in Wolverhampton. Reliance on private methods of travelling to work in Wolverhampton (68.1%) is slightly higher than the national average (62.9%).
The Indices of Deprivation (2010) show that 26.6% of Wolverhampton’s LSOA’s are amongst the 10% most deprived in England. The percentage of Black Country pupils achieving 5 or more GCSE grades A*-C chowed reached highest recorded levels in 2013. In Wolverhampton 61% of pupils achieved the standard, which along with 59.7% in Dudley exceeded the national level of 59.2%. Crime levels in all four districts have seen a steady and sustained decrease over the past few years, but in a reversal of this trend there has been a small increase in crime rates in the last twelve months. In the period 1st April 2013 to 31st March 2014 the crime rates per thousand people were 64.2 in Wolverhampton; this was the highest rate out of the four districts.
Planning and Regeneration in Wolverhampton
There has been a 9.53% decrease in the amount of planning applications received by Wolverhampton City Council this year. The Council collected approximately £624,558 from developers in section 106 contributions.
A number of milestones on the 2013/16 Local Development Scheme were achieved, including the Publication and Submission of the Bilston Corridor Area Action Plan (AAP) and Stafford Road Corridor AAP. Work progressed on the City Centre AAP with its Issues and Options being published for consultation in December 2013. The Tettenhall and Heathfield Park Neighbourhood Plans were submitted in January 2014 and the statutory consultation and independent examination were undertaken in March/April 2014.
Following the implementation of the Duty to Cooperate, Wolverhampton City Council is cooperating with neighbouring local authorities and organisations on a) the impact of housing development on Cannock Chase SAC, b) regional logistic sites (RLS) study, and c) Agreement of the Strategic Policy Framework for the West Midlands Metropolitan Area.
Policy Performance
Only 3.47ha of employment land was completed in Wolverhampton during 2013/14. Despite the low level of completions in Wolverhampton, there are a number of large development projects underway or permitted this year. The i54 is now being developed and will help contribute to meeting the Black Country employment land needs.
Green Belt objectives continue to be met with very special circumstances demonstrated for significant developments.
Housing delivery in Wolverhampton has maintained a reasonable level in response to recovery from the recession. 433 gross completions were recorded during 2013/14 compared to 496 in 2012/13. The majority of these were at Great Bridge Road (Barrats), Ward Street and Goodyear (Persimmon) and Bankfield Works (Redrow). However, net completions of 431 were still 135 below the Black Country Core Strategy target of 566.
7
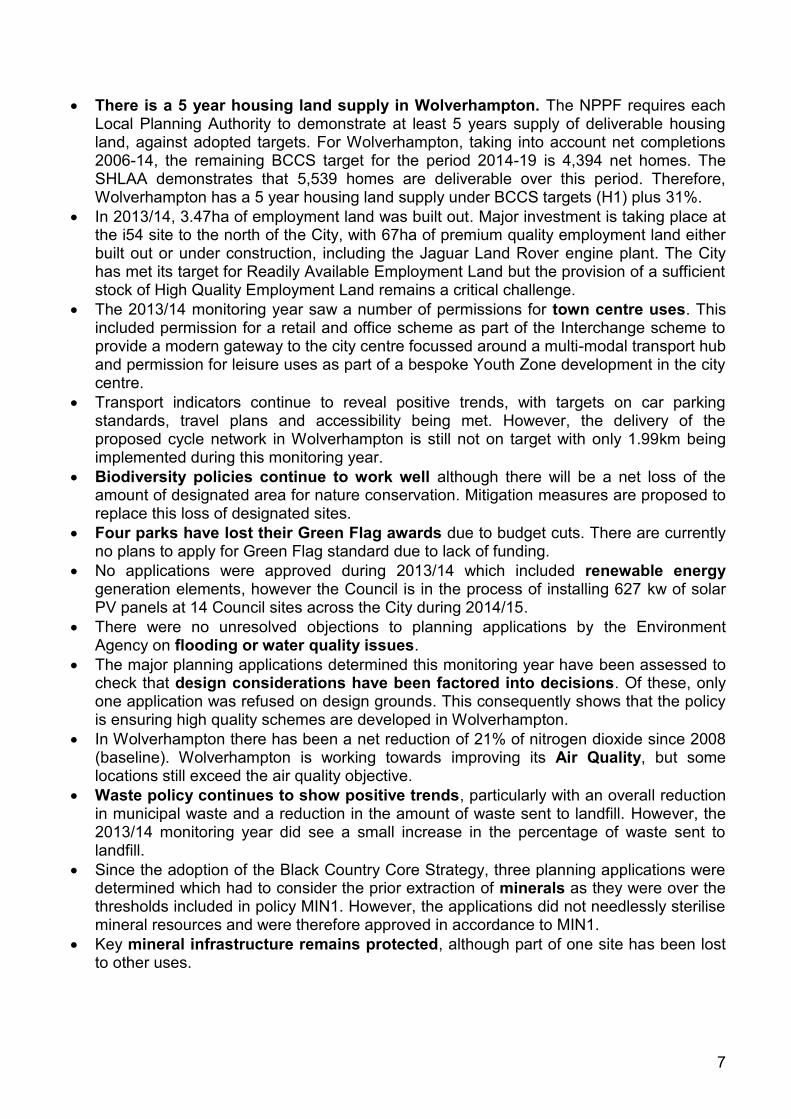
There is a 5 year housing land supply in Wolverhampton. The NPPF requires each Local Planning Authority to demonstrate at least 5 years supply of deliverable housing land, against adopted targets. For Wolverhampton, taking into account net completions 2006-14, the remaining BCCS target for the period 2014-19 is 4,394 net homes. The SHLAA demonstrates that 5,539 homes are deliverable over this period. Therefore, Wolverhampton has a 5 year housing land supply under BCCS targets (H1) plus 31%.
In 2013/14, 3.47ha of employment land was built out. Major investment is taking place at the i54 site to the north of the City, with 67ha of premium quality employment land either built out or under construction, including the Jaguar Land Rover engine plant. The City has met its target for Readily Available Employment Land but the provision of a sufficient stock of High Quality Employment Land remains a critical challenge.
The 2013/14 monitoring year saw a number of permissions for town centre uses. This included permission for a retail and office scheme as part of the Interchange scheme to provide a modern gateway to the city centre focussed around a multi-modal transport hub and permission for leisure uses as part of a bespoke Youth Zone development in the city centre.
Transport indicators continue to reveal positive trends, with targets on car parking standards, travel plans and accessibility being met. However, the delivery of the proposed cycle network in Wolverhampton is still not on target with only 1.99km being implemented during this monitoring year.
Biodiversity policies continue to work well although there will be a net loss of the amount of designated area for nature conservation. Mitigation measures are proposed to replace this loss of designated sites.
Four parks have lost their Green Flag awards due to budget cuts. There are currently no plans to apply for Green Flag standard due to lack of funding.
No applications were approved during 2013/14 which included renewable energy generation elements, however the Council is in the process of installing 627 kw of solar PV panels at 14 Council sites across the City during 2014/15.
There were no unresolved objections to planning applications by the Environment Agency on flooding or water quality issues.
The major planning applications determined this monitoring year have been assessed to check that design considerations have been factored into decisions. Of these, only one application was refused on design grounds. This consequently shows that the policy is ensuring high quality schemes are developed in Wolverhampton.
In Wolverhampton there has been a net reduction of 21% of nitrogen dioxide since 2008 (baseline). Wolverhampton is working towards improving its Air Quality, but some locations still exceed the air quality objective.
Waste policy continues to show positive trends, particularly with an overall reduction in municipal waste and a reduction in the amount of waste sent to landfill. However, the 2013/14 monitoring year did see a small increase in the percentage of waste sent to landfill.
Since the adoption of the Black Country Core Strategy, three planning applications were determined which had to consider the prior extraction of minerals as they were over the thresholds included in policy MIN1. However, the applications did not needlessly sterilise mineral resources and were therefore approved in accordance to MIN1.
Key mineral infrastructure remains protected, although part of one site has been lost to other uses.

8
Overall, the policies of the Black Country Core Strategy appear to be working. The monitoring framework continues to evolve and is the most effective way of assessing the impact of the Core Strategy. Results and trends are encouraging, although they need to be monitored carefully during periods of economic downturn. Where it has been shown that there is underperformance, in most cases there are circumstances which explain the reasons and the overall averages continue to meet long term projections and targets.

9
1.0 Introduction The Annual Monitoring Report (AMR) is required by section 35 of the 2004 Planning and Compulsory Purchase Act to assess:
The implementation of the Local Development Scheme (LDS); and
The extent to which policies in Local Development Documents (LDD’s) are being achieved.
The Localism Act 2011 removed the requirement for Annual Monitoring Reports to be submitted to the Secretary of State. However, local authorities are still required to undertake monitoring at least annually. The monitoring period for this year’s AMR is 1st April 2013 to 31st March 2014. The AMR monitors the suite of adopted LDD’s, which this year includes:
Black Country Core Strategy (BCCS) – adopted February 2011
Wolverhampton Unitary Development Plan (UDP) saved policies – adopted June 2006 Since to the adoption of the BCCS in 2011 each of the four Black Country local authorities have produced an AMR that incorporates the indicators from the BCCS but also reflects their own situation. As the Bilston Corridor Area Action Plan and Stafford Road Corridor Area Action Plan were adopted on 17th September 2014, the monitoring period for these documents will be reported in next year’s AMR. This also applies to the two neighbourhood plans that were formally ‘made’ on 17th September 2014; the Tettenhall Neighbourhood Plan and the Heathfield Park Neighbourhood Plan. 1.1 Monitoring Framework A monitoring framework was prepared for the first annual monitoring report in 2004/5 and has been used to produce all subsequent AMRs with additions as necessary. It uses measurable indicators to help assess progress towards the aims and targets set in our planning policy documents. In order to achieve a broad monitoring framework, there are three different types of indicators:
Contextual Indicators: set out the wider context within which the Local Plan operates. The indicators set out the key characteristics and the issues in the locality. These are set out in Section 2.
Output Indicators: are spilt into core and local indicators (see below for details). They measure the physical activities that are directly related to, and are a consequence of, the implementation of planning policies. These are set out in Section 3.
Significant Effects Indicators: monitor the effects of plans and policies on social, environmental and economic issues. These are linked to Strategic Environmental Assessments and Sustainability Appraisals of LDD’s.
The Core and Local indicators set out in this AMR correspond to the relevant chapter of the Core Strategy, UDP or to a Supplementary Planning Document (SPD). At the end of each

10
chapter of the AMR is a summary table which indicates the core and local indicators that are being assessed, the policies that are relevant to the indicators and a performance summary. Following the adoption of the Black Country Core Strategy (BCCS) in February 2011, planning applications have been assessed and conditioned in line with the policies contained in the BCCS. Policies in the BCCS have been monitored since 2011/12 and are included in this year’s AMR report. Core Output Indicators These indicators include the Black Country Core Strategy Core Output indicators (COI) and the core output indicators set by central Government. They are listed in Appendix A and B. The Parliamentary under Secretary of State wrote to all Local Planning Authorities (LPA) in March 2011 to advise that the Government’s Core Output Indicators guidance had been withdrawn to allow each LPA to decide what is best to include in their AMR. However these indicators are still included in this AMR as Wolverhampton Council sees them as an effective way to monitor the impact of local policies (Appendix B). Local Output Indicators These indicators are set locally and are derived from policies in the Black Country Core Strategy (LOI) and the UDP saved policies. These are listed in Appendix C. Significant Effects Indicators Monitoring of significant effects is included in this year’s AMR as the Sustainability Appraisal of the BCCS has set a framework advising what these indictors need to be. Note: This is the republished version of the AMR to inlcude the Black Country key target data in Table 6 on page 25. This information has been obtained from our neighbouring Local Authorities and was not available when the AMR was first published in March 2015.

11
2.0 SPATIAL CHARACTERISTICS AND CONTEXTUAL INDICATORS 2.1 Spatial Characteristics The Black Country is a sub-region of the West Midlands located to the west of Birmingham. In local government terms the Black Country is defined as the four local authority districts of Wolverhampton, Dudley, Sandwell, and Walsall. The four local authority districts have worked in joint partnership to produce the Black Country Core Strategy (BCCS). The BCCS was adopted in February 2011. It sets out how the Black Country should look in 2026 and establishes clear directions for change in order to achieve the transformation.
Map 1 – Wolverhampton in context of the Black Country
(Source: Black Country Observatory)
Wolverhampton is a City to the north west of the West Midlands conurbation (see Map 1) and is estimated to be home to approximately 249,900 people. The countryside of South Staffordshire is to the north and west of the city, with the urban area to the south and east. Wolverhampton is the only city in the Black Country and has an important role to play in the future direction of the conurbation. The administrative area includes the City Centre and the Town Centres of Bilston and Wednesfield Village. The City also has good transport links with the sub-region and the rest of the UK, with the M54 link to the M6 motorway and good public transport links with the Metro, cross country railway links, and strategic bus routes.

12
2.2 Contextual Indicators 2.2.1 Demographic Profile According to 2013 mid-year estimates the Black Country had a population of 1,152,500. Wolverhampton has the smallest population of the four Black Country districts at 251,600, followed by Walsall (272,200), Sandwell (314,300) and Dudley (314,400) (see figure 1). The districts have a similar proportion of their population in the 20-59 age ranges, varying from 50.8% in Dudley to 53.2% in Wolverhampton. Sandwell and Walsall have a younger population structure with 20.6% and 19.6% respectively aged 0-14, compared to 18.8% in Wolverhampton and 17.7% in Dudley. Conversely Dudley has the largest percentage of people aged 60 and over (25.3%) and Sandwell the smallest (20%).
Figure 1: Total Resident Population
Source: Mid-Year Population Estimates, Office for National Statistics (ONS)
Analysis of population relative to the size of each district shows that Sandwell and Wolverhampton have similar population densities at 36.7 and 36.2 people per square hectare respectively. Dudley has 32.1 and Walsall 26.2. The latest estimates of population by ethnicity from the 2011 Census show that Wolverhampton has the greatest proportion of minority groups (defined as non-White British) at 35.5%, with Sandwell having 34.2%, Walsall 23% and Dudley 11.5%. Asian groups are the largest minorities in each area; Indian in Wolverhampton, Walsall and Sandwell, and Pakistani in Dudley. 2012-based projections suggest that if recent demographic trends continue Sandwell will have the largest population in the Black Country by 2014 and experience a total increase of 9.1% by 2022 to reach 339,500. If the projections are realised the other Black Country districts will also grow by 2.7-5.1%, resulting in populations of 259,400 in Wolverhampton, 322,100 in Dudley, and 284,600 in Walsall. These projections do not take account of policy or development aims that have not yet had an impact on observed trends so should be treated as indicative only.

13
2.2.2 Economic Profile Vitality amongst the labour market can be measured through the proportion of working age (16-64) people who are in, or actively seeking, employment. Figures from 2013/14 show that the economic activity rate was 71.3% in Wolverhampton, 79.3% in Dudley, 74.2% in Sandwell and 70.2% in Walsall (see figure 2).
Figure 2: Economic Activity Rate, Population Aged 16-64
Source: Annual Population Survey (APS), Office for National Statistics (ONS)
In terms of employment there remains a relatively large reliance on manufacturing, which employs around 1 in 7 workers in the Black Country and is the largest of 18 industrial sectors in Sandwell and Walsall; Dudley and Wolverhampton have the largest proportion of their workforce employed in the health sector (16.1% and 14.2% respectively). Health, retail and education are the other large employers across the Black Country. Comparison with national figures demonstrates the importance of manufacturing (Black Country 15.1%; England 8.4%) but shows a relative under-representation in the information / communication, finance and professional / scientific /technical sectors. Average earnings of those working in the Black Country districts vary from £21,562 (Dudley) to £24,930 (Wolverhampton). Whilst these figures are considered reasonably precise the way they are collected makes comparisons between areas and over time difficult, but the trend over previous years shows that the Black Country districts have consistently lower earnings levels than the West Midlands (£26,187 in 2013) and England (£27,376) as a whole. As of June 2014 there were 32,888 Jobseeker’s Allowance (JSA) claimants in the Black Country. Data from the last three years shows that the number of claimants in each district remained relatively stable until February 2013, but has since decreased month on month, mirroring the pattern seen nationally but with notably higher rates. In June 2014 2.4% of the working age population in England were claiming JSA compared to 5.8% in Wolverhampton, 4.8% in Sandwell, 4.2% in Walsall and 3.7% in Dudley (see figure 3).

14
Figure 3: Percentage of Resident Working Age Population Claiming Jobseeker’s Allowance
Source: NOMIS / Office for National Statistics (ONS)
Long-term unemployment is also higher in the Black Country. Data from June 2014 shows that 38.2% of JSA claimants in Sandwell and Wolverhampton, 38.1% in Dudley and 34.6% in Walsall have been on the benefit for a year or more; the equivalent figure for England is 30.8%. Though showing signs of improvement the unemployment figures are symptomatic of the recessionary period. Business creation in the Black Country also declined under recent economic conditions, with the number of new businesses per 10,000 adult population decreasing from 2007 to 2010. However, the 2011 figures indicated an upturn with all four districts experiencing an increase in business creation rates. This has sustained through to the latest 2012 figures in Dudley and Walsall, with slight falls in the other two districts. There were 37.8 new businesses created per 10,000 adult population in both Dudley and Wolverhampton, 37.3 in Walsall and 36.1 in Sandwell. The rate in England has been consistently higher and stood at 55.3 in 2012. Developing a skills base amongst the workforce is essential to economic development. Figures from 2013 indicate that the percentage of working age people with no qualifications is greater amongst the Black County districts than for England (9.1%). Wolverhampton has 22.9% with no qualifications, Sandwell 19.3%, Walsall 17.6% and Dudley 10.7%. Conversely fewer people have higher skills of NVQ level 4 (and equivalent) and above; Sandwell has 19.7%, Wolverhampton 20%, Walsall 24.2% and Dudley 24.4%, compared to 35% for England. The figures at the district level are subject to a degree of accuracy of approximately +/- 3%, but taking this into account it is clear that a disparity in levels exists. The proportion with higher skills in the Black Country has increased over last five years, but this is also true at the national level, meaning there has been no significant narrowing in the skills gap. 2.2.3 Housing Profile As of April 2013 there were approaching half a million dwellings in the Black Country. Dudley has the largest number amongst the four districts at 135,230, followed by Sandwell with 128, 260, Walsall with 111,880 and Wolverhampton with 107,040 (see figure 4). These figures are

15
reflective of population size, but the structure of the population in terms of households (family groupings) is also an important determinant in the requirement for dwellings.
Figure 4: Total Dwellings
Source: Department for Communities and Local Government (DCLG)
The large majority of dwellings are in the private sector (Dudley 79.7%; Walsall 75.6%; Wolverhampton 72.7%; Sandwell 71.7%). Local authority housing is still a key sector in Sandwell (23.5%), Wolverhampton (21.8%) and Dudley (17%), with Walsall having transferred its stock into the social housing sector, which now accounts for 24.3% of dwellings. Figure 5 shows the percentage of dwellings by tenure in Wolverhampton at April 2013; the majority of dwellings are owner occupied / private rented.
Figure 5: Percentage of Dwellings by Tenure in Wolverhampton
Source: Department for Communities and Local Government (DCLG)

16
There is some variation in the proportion of vacant housing, with Dudley (2.8%) at a similar level to England (2.7%) and Walsall (3%), Sandwell (3.4%) and Wolverhampton (3.6%) having marginally higher rates. House prices at the national level had been on a general downward trend since the last peak in 2007, but are now showing signs of a reversal. The Black Country districts demonstrate the same pattern but have lower average prices. In the year to April 2014 average house prices increased by 2.2% in Walsall, 3% in Wolverhampton, 3.3% in Dudley and 6.9% in Sandwell. Dudley had the highest average price at £120,196, followed by Walsall at £109,877, Wolverhampton with £101,117 and Sandwell at £95,720; this compares to £171,436 for England and Wales. 2.2.4 Transport Profile 2011 Census results show that Dudley is most reliant on private methods of travelling to work compared to other areas, with 76.3% using a car / motorcycle. The equivalent for Walsall is 73.5%, and Wolverhampton (68.1%) and Sandwell (67.7%) are closer to the national figure (62.9%). The largest proportions travelling by bus are seen in Sandwell (14.2%) and by train / Metro in Wolverhampton (4.3%). 9-10% of people walk to work in Sandwell, Walsall and Wolverhampton, representative of the national picture (10.7%), but in Dudley the figure is lower at 7.9%. These differences between public / private transport are also seen in data from 2011-12 / 2012-13 analysing peak morning trips into centres across the four districts. Bus trips only account for 11.6% of journeys into Brierley Hill and 15% into Dudley town centre. For Walsall (30.9%), West Bromwich (31.6%) and Wolverhampton city centre (22.3%) the percentages are significantly higher. Walsall and Wolverhampton also have inbound trips by rail, with 2.1% and 4.6% of journeys respectively by this method. 2.8% of trips to West Bromwich and 1.3% to Wolverhampton are via Metro. 2.2.5 Socio-Cultural Profile The Indices of Deprivation provide a measure of relative deprivation levels across England. Deprivation scores are calculated for each district across a number of measures; these are then converted into a national ranking system where a rank of 1 equals the most deprived district in England. The most recent indices from 2010 show that Sandwell was ranked 12th of 326 local authority districts, followed by Wolverhampton with a ranking of 21, Walsall 30 and Dudley 104. Measures at the district level can mask pockets of significant deprivation. Each district is sub-divided into areas called Lower Layer Super Output Areas (LSOA). These are used for the presentation of statistics such as the Index of Multiple Deprivation, which is part of the national indices. Analysis shows that in 2010, 9.4% of Dudley’s LSOA were amongst the 10% most deprived in England, compared to 24.3% in Walsall, 26.6% in Wolverhampton and 30.5% in Sandwell. The percentage of Black Country pupils achieving 5 or more GCSE grades A*-C (including English and Maths) showed a continued increase over the five years to 2011, but fell slightly in three of the four districts in 2012, then increased again to reach highest recorded levels in 2013. In Wolverhampton 61% of pupils achieved the standard, which along with 59.7% in Dudley exceeded the national level of 59.2%. The figures in Walsall and Sandwell were 58.7% and 54.1% respectively.

17
Male and female life expectancies are on an upward trend in line with the pattern seen for the West Midlands and England. Data from 2010-2012 shows that male life expectancy at birth in the Black Country districts varies from 76.8 years in Sandwell to 78.9 in Dudley, with 77.4 for Wolverhampton and 77.9 in Walsall. All four districts have expectancies below those of males at the national level (79.2). Life expectancy for females in Dudley is the same as for England at 83, with the other three Black Country districts having lower expectancies of 82.3 years in Walsall, 81.7 in Wolverhampton and 81.3 in Sandwell. Childhood obesity levels can be viewed as an indicator of future health issues. Obesity amongst Black Country reception year school children is more prevalent than the 9.3% seen at the England level. Data for 2012/13 reported that 10.1% of reception children in Dudley were obese, compared to 10.9% in Sandwell, 11.5% in Walsall and 12.7% in Wolverhampton. Crime levels in all four districts have seen a steady and sustained decrease over the past few years, but in a reversal of this trend there has been a small increase in crime rates in the last twelve months. In the period 1 April 2013 to 31 March 2014 the crime rates per thousand people were 43.7 in Dudley, 55.7 in Sandwell, 55.8 in Walsall and 64.2 in Wolverhampton. 2.2.6 Environmental (Significant Effects Indicators) Significant effects indicators are a method of monitoring the effects of plans and policies on the social, environmental or economic objectives by which sustainability is defined. The Council is required to measure significant effects raised in a Strategic Environmental Assessment (SEA) in order to satisfy the requirements of European Directorate 2001/42/EC ‘on the assessment of the effects of certain plans and programmes on the environment’. An SEA was carried out as part of the evidence base for the BCCS that was adopted by all four authorities on 3rd February 2011. The significant effects indicators are set out below and will continue to be monitored jointly on an annual basis across the Black Country and included in future monitoring reports. Table 1: Environmental (Significant Effects Indicators)
Potential negative effect,
or area to be monitored
Significant Effects Indicator
Target / Trigger
Performance 2013/14*
Impact of highway improvements on air quality.
SE1: Achieve a net reduction of Nitrogen Dioxide (NO2) in those areas where the annual average NO2 values are predicted to exceed 40μgm3 between 2008 (baseline) and 2015.
Net reduction of NO2 by 2015.
Wolverhampton – For the monitoring year 2013/14 there has been an estimated reduction of 21%, compared with the base year of 2008. See indicator L4 for further details.
Potential adverse effects on brownfield biodiversity.
SE2: Percentage of development and redevelopment on previously developed land undertaking full ecological surveys.
When percentages see reductions over a five year period.
Eight of the major planning applications determined within the monitoring period 2013/14 were supported by an ecological survey. Of these, seven were approved and one was refused permission.

18
Potential effects on biodiversity from increased use of open space for leisure and recreation.
SE3: Proportion of local sites where positive conservation management is being or has been implemented.
Wolverhampton - 40% of sites in positive management by 2026.
Wolverhampton – The proportion of Local Sites where positive conservation management has been or is being implemented was 20% for the monitoring year 2012/13. There has been no change to performance on this indicator this year. See indicator COI ENV1 and L27 for further details.
Expansion of high quality sub-regional wildlife corridors forming the wider biodiversity network.
SE4: No net loss of wildlife corridor.
No net loss. No wildlife corridors have been lost within the reporting period.
Stimulation of car use by the planned road improvements and housing and employment provision increases.
SE5: Traffic flows on key routes.
When traffic flows see increases over a five year period.
Wolverhampton
2010 AM Peak
2012 AM Peak 2010 PM Peak
2012 PM Peak
58418 56860 44714 43648
Failure to tackle congestion and effectively implement proposed public transport strategy improvements, and associated effects on businesses.
SE6: Number of journeys made by public transport.
When percentages see ongoing reductions year on year over a five year period.
In March 2013 the Wolverhampton Cordon Report 2012** was produced by Mott MacDonald using Cordon Survey data from across the City. The report indicates that all public transport modes accounted for 28% of person trips into Wolverhampton; no change from the 2010 figures. The bus patronage figure for Wolverhampton (taken from the same Cordon Report) in 2012 was 6858 in the AM peak, a decrease from 7310 in 2010. This represents an overall decrease in bus patronage in Wolverhampton. However the total car trips have also decreased by approximately 8%. The Council expect bus patronage to increase in the future.
Centro’s annual monitoring report for the West Midlands showed that there has been an overall little change in bus patronage for the whole of the West Midlands area, 286.1 million trips per year.
Increasing car use in the sub-region.
Increases in carbon emissions from new housing, employment and infrastructure provision.
SE7: Carbon footprint of sub-region (by sector) (CO2 Emissions Estimates).
When sector emissions see increases over a five year period.
Year (Wolv)
Ind & Comm
Domestic Road Trsport
Total CO2 Emissions
Per Capit CO2 Emissions
2010-11 517.7 536.1 290.2 1344.1 5.4
2011-12 497.4 473.1 287.0 1257.5 5.0
2012-13 481.8 521.0 283.9 1286.7 5.1
Source of data: Spreadsheet ‘20140624_Subset_Datatables.xlsx’ titled ‘Local and regional CO2 Emissions Estimates for 2005-2012’, version ‘CO2 emissions within the scope of influence of Local Authorities (previously called National Indicator 186: Per capita CO2 emissions in the LA area)’ obtained from: https://www.gov.uk/government/statistics/local-authority-emissions-estimates
Analysis: CO2 emissions for Wolverhampton fell between 2010-11 and 2011-12 and then rose in 2012-13, while remaining below the base figure. This rise was down to a sharp increase in domestic emissions; emissions from other sectors fell. This rise in domestic emissions is likely to be due to the cool, wet summer followed by one of the coldest winters for years. The data used is provided by DECC and no data is currently available for 2013-14.
Potential deficiency in area of public open space.
SE8: Ha of Accessible open space per 1,000 Population.
Target: Dudley 5.08, Sandwell 3.44, Walsall 5.00,
The BCCS target is to increase provision of accessible open space from the 2007 level of 4.63 ha per 1,000 residents to the OSANA standard of 4.74 ha per 1,000 residents by 2016 in Wolverhampton. There has been no

19
Wolverhampton 4.74. Trigger: Review progress after five years.
change to this indicator this year. See indicator LOI ENV6a for further details.
Potential to use Historic Landscape Characterisation to inform decision making.
SE9: Proportion of planning permissions granted in accordance with Conservation/Historic Environmental Section or Advisor recommendations.
100% Wolverhampton – 100% of planning permissions where the Conservation/Historic Environmental Section or Advisor were consulted were granted in accordance with their recommendations (based on 10% sample). See indicator LOI ENV2 for further details.
Potential increases in industrial and commercial waste.
SE11: Diversion of waste from landfill - % commercial waste diversion.
When percentages see increases over a five year period.
There has been an overall increasein LACW landfill diversion although in 2013/14 there was a 0.4% decrease to 94.6%. However this still exceeds the 2010/11 target of 92.3% for Wolverhampton. No new figures are available for commercial waste.
*Since 3rd
February 2011 when the Core Strategy was adopted. ** The Wolverhampton Cordon Report is published every 2 years.
Planning and Regeneration 2.2.7 Planning Applications The numbers and types of planning applications determined by the Council can help show the levels of investor confidence and attractiveness of an area to developers. Table 2: Number of Planning Applications Year Total
Number of Planning Decisions
Major Decisions Minor Decisions Other Decisions
% Total Applications
% Granted
% Total Applications
% Granted
% Total Applications
% Granted
2013/14 426,517 3% 87% 28% 85% 69% 81%
2012/13 418,475 3% 87% 28% 84% 69% 80%
England 2011/12 434,889 3% 87% 28% 84% 69% 80%
2010/11 439,905 3% 85% 28% 82% 69% 88%
2009/10 417,606 3% 83% 28% 81% 69% 87%
2008/09 489,110 3% 77% 28% 77% 69% 86%
2013/14 864 5% 95% 28% 95% 67% 94%
2012/13 955 5% 96% 29% 94% 66% 94%
Wolverhampton 2011/12 1,065 5% 98% 27% 94% 68% 90%
2010/11 1,144 8% 93% 25% 76% 68% 81%
2009/10 1,056 6% 92% 27% 76% 68% 76%
2008/09 1,324 6% 89% 27% 72% 66% 78%
(Source: Communities and Local Government)
The total number of planning decisions for England has increased by 8,042 since last year. For Wolverhampton the total number of planning decisions has decreased by 91 since last year (9.53% decrease). However, Wolverhampton is still performing well, particularly in light of Government changes introduced to the planning system which removed the need for planning applications for certain types of development. Despite the effects of the recession,

20
Wolverhampton still appears to be attracting major planning applications which are a sign of the development opportunities available in the City. It will be important to continue to monitor this as the economic situation progresses. 2.2.8 Section 106 Agreements and the Community Infrastructure Levy Section 106 Agreements are a device to secure planning obligations which are used to make ‘unacceptable development’ acceptable in planning terms, for example by providing funds to invest in the transport infrastructure to off set the impacts of the development. Table 3 below refers to funds collected for planning obligations by the Local Authority through section 106 agreements since 2005/6. Table 3: Section 106 Contributions 2005/6 2006/7 2007/8 2008/9 2009/10 2010/11 2011/12 2012/13 2013/14
Amount agreed in S106 contributions by type of development
Residential £434,239 £435,025 £69,421 0 0 £1,323,549 £501,264 £263,010 £624,558
Retail £150,000 0 0 £30,000 0 0 0 0 0
Commercial (office)
0 0 0 0 £5,363,000 0 0 0 0
Other employment
0 0 £3,167,364 0 £85,000 0 0 0 0
Mixed Use £5,000 0 £652,700 £81,861 0 0 0 £73,977 0
Other 0 0 £149,352 £408,562 0 0 0 0 0
Planning Obligations that the S106 funds were secured for Open space (capital including maintenance)
£253,296 £216,000 £1,014,914 £487,978 0 £965,843 £481,264 £336,987 £603,939
Education (capital)
0 0 0 0 0 0 0 0 0
Transport infrastructure
£227,487 £40,000 £2,780,590 £30,000 £5,448,000 £6,228 £20,000 0 £20,619
Other capital 0 £150,000 £131,220 0 0 0 0 0 0
Public Art £68,456 0 £250,000 £19,695 0 0 0 0 0
Miscellaneous revenue support
£40,000 £29,025 £211,300 0 0 £351,478 0 0 0
Affordable housing Number of units directly delivered through S106 (on or off site)
79 16 40 24 4 0 37 40 10
Financial contribution in lieu of provision
0 0 0 0 0 0 0 0 0
(Source: Wolverhampton City Council). Note - The table includes schemes which have gained planning permission and where the Council have received the money (typically where a scheme starts to be constructed). Schemes are divided by year based on the date the section 106 agreement was signed or when the development commenced. Figures are rounded to the nearest £. This table does not indicate whether the money has yet been spent as this is difficult to monitor, other than on affordable housing where the figures relate to completions. Certain obligations may be secured in ways other than s106 and are not included in the table, such as some public art is delivered through planning conditions rather than section 106.
Since November 2009, the Council have adopted a flexible approach to planning obligations based on financial viability grounds. This is due to the difficulties developers are having in bringing schemes forward in the current economic climate. It is encouraging that this approach has still enabled the Council to collect funds for certain planning obligations whilst allowing development schemes to go ahead which help deliver the Councils regeneration objectives.

21
In 2010 the Government introduced legislation to enable Local Authorities to introduce a Community Infrastructure Levy (CIL). CIL is a standard charge which local planning authorities are empowered, but not required, to charge on most types of new development. Wolverhampton Council has resolved not to pursue the introduction of CIL at the present time. The situation will be reviewed in 2015. 2.2.9 Wolverhampton Local Development Scheme (LDS) The Wolverhampton LDS is a project plan that details documents to be included in the Local Plan (formerly known as the LDF). The LDS contains a three year programme of plan preparation and is reviewed on an annual basis. This ensures that the need for any new Plans is identified and the progress of existing documents can be monitored. It is available via www.wolverhampton.gov.uk/lds For the period 1st April 2013 to 31st March 2014, the LDS brought into effect in November 2013 provides the basis for this year’s monitoring period. Thus, progress towards key milestones in the monitoring period has been: Table 4 – LDS Summary 2013/14
LDF Document LDS Stage LDS Milestone
Area Action Plans (AAP) – for the City Centre, Stafford Road Corridor and Bilston Corridor
Production / Consultation
The Stafford Road Area Action Plan and the Bilston Corridor Area Action Plan (including the Bilston Neighbourhood Plan) undertook their Publication Consultations during Summer 2013. The Plans were submitted in November 2013 and were subjected to an independent examination. The Inspector’s Reports were published in June 2014. The Council consulted on a small number of modifications to the AAPs during May/June 2014. The Council adopted the AAPs on 17th September 2014. Further progress has been made on the City Centre Area Action Plan. Consultation on the Issues and Options Stage ran from 2nd December 2013 until 31st January 2014. Following the consultation work commenced on preparing the Draft Plan which is due for consultation in November / December 2014.
Open Space, Sport and Recreation SPD
Production/ Adoption
Progress of the SPD has been informed by the development of a City-wide Open Space Strategy and Action Plan, which was completed in 2013. The SPD was published for consultation in January 2014 and was formally adopted on 13th October 2014.
Tettenhall Neighbourhood Plan
Publication / Submission / Examination
Good progress was made on the Tettenhall Neighbourhood Plan during the monitoring period. The Plan undertook its six week pre-submission consultation in September to October 2013. The Plan was submitted to the Council on 16th January 2014. The Council undertook its statutory consultation between 24th January 2014 and 7th March 2014. An independent examination of the Neighbourhood Plan

22
was held during March to May 2014. There were no slippages in the LDS (2013) timetable for this Plan.
Heathfield Park Neighbourhood Plan
Publication / Submission / Examination
Good progress was made on the Heathfield Park Neighbourhood Plan during the monitoring period. The Plan undertook its six week pre-submission consultation in September to October 2013. The Plan was submitted to the Council on 17th January 2014. The Council undertook its statutory consultation between 24th January 2014 and 7th March 2014. An independent examination of the Neighbourhood Plan was held during March to May 2014. There were no slippages in the LDS (2013) timetable for this Plan.
The key achievement this year has been the progression of the Area Action Plans and Neighbourhood Plans. The Council worked closely with local communities to ensure the two Neighbourhood Plans for Tettenhall and Heathfield Park progressed to community referendum stage, which was held on 17th July 2014. The Council formally adopted the neighbourhood plans on 17th September 2014, following a majority ‘yes’ vote at the community referendum. A revised and updated version of the LDS was published in November 2013. It was necessary to update the previous version of the LDS to include changes to the timetable arrangements for the Area Action Plans and the Neighbourhood Plans. It also reflects the requirements of the Localism Act (2011) and the National Planning Policy Framework (2012) to prepare and maintain an up-to-date LDS. 2.2.10 Duty to Cooperate The Localism Act 2011 (brought into effect on the 15th November 2011) sets out a new ‘duty to co-operate' which applies to all Local Planning Authorities, such as Wolverhampton City Council, and other public bodies. The new duty:
relates to sustainable development or use of land that would have a significant impact on at least two local planning areas;
requires that councils set out planning policies to address such issues;
requires that councils and public bodies ‘engage constructively, actively and on an ongoing basis to develop strategic policies’;
requires councils to consider joint approaches to plan making. Table 5 below summarises the cooperation that has taken place and the actions which have been taken under this new duty from 1st April 2013 to the 31st March 2014. Table 5: Implementation of the Duty to Cooperate
Cooperation With On What Action/Outcome Date Cannock Chase SAC Partnership (Natural England, Cannock Chase AONB, Staffordshire CC, Cannock Chase DC, Stafford DC, Lichfield DC, South Staffordshire DC, East Staffordshire DC, Walsall BC,
To investigate the likely impact of housing development on Cannock Chase SAC (Special Area of Conservation), in order to inform the Habitat Regulation Assessment (HRA) process for Local Plan documents and
Completion of Visitor Survey and Visitor Impacts Mitigation Reports and agreement with Natural England on approach for
August 2010 – to date

23
Sandwell BC, Dudley BC, Birmingham CC)
planning applications. Wolverhampton AAPs and Neighbourhood Plans
Local Authorities in the Black Country and southern Staffordshire, Centro (the Integrated Transport Authority)
Regional Logistics Sites (RLS) Study
Joint study co-ordinated by Steering Group, led by Wolverhampton City Council. Stage 1 was completed in March 2013 and published on Council website in April 2013. Work on stage 2 of the study is ongoing.
Jan 2012 – to date
West Midlands Planning and Transportation sub-committee (see below)
Ongoing monitoring of the Strategic Policy Framework for the West Midlands Metropolitan Area (March 2012) - maintains the commitment to the urban renaissance as set out in the West Midlands RSS
Endorsed the approach
March 2012 to date
In addition to these specific actions, the Council meets on a regular basis with local planning authorities, public bodies and others to address specific planning issues. Appendix D summarises the Groups the Council are part of which contribute towards meeting the Duty to Cooperate.
24
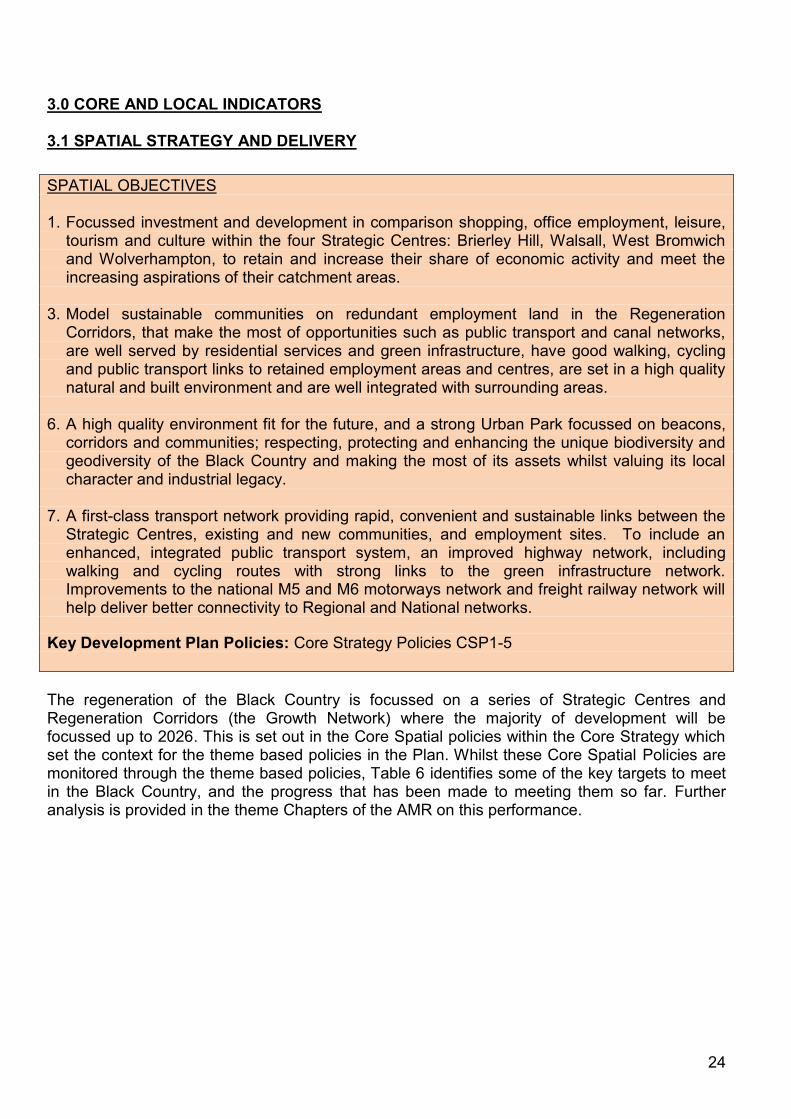
3.0 CORE AND LOCAL INDICATORS 3.1 SPATIAL STRATEGY AND DELIVERY
The regeneration of the Black Country is focussed on a series of Strategic Centres and Regeneration Corridors (the Growth Network) where the majority of development will be focussed up to 2026. This is set out in the Core Spatial policies within the Core Strategy which set the context for the theme based policies in the Plan. Whilst these Core Spatial Policies are monitored through the theme based policies, Table 6 identifies some of the key targets to meet in the Black Country, and the progress that has been made to meeting them so far. Further analysis is provided in the theme Chapters of the AMR on this performance.
SPATIAL OBJECTIVES 1. Focussed investment and development in comparison shopping, office employment, leisure,
tourism and culture within the four Strategic Centres: Brierley Hill, Walsall, West Bromwich and Wolverhampton, to retain and increase their share of economic activity and meet the increasing aspirations of their catchment areas.
3. Model sustainable communities on redundant employment land in the Regeneration
Corridors, that make the most of opportunities such as public transport and canal networks, are well served by residential services and green infrastructure, have good walking, cycling and public transport links to retained employment areas and centres, are set in a high quality natural and built environment and are well integrated with surrounding areas.
6. A high quality environment fit for the future, and a strong Urban Park focussed on beacons,
corridors and communities; respecting, protecting and enhancing the unique biodiversity and geodiversity of the Black Country and making the most of its assets whilst valuing its local character and industrial legacy.
7. A first-class transport network providing rapid, convenient and sustainable links between the
Strategic Centres, existing and new communities, and employment sites. To include an enhanced, integrated public transport system, an improved highway network, including walking and cycling routes with strong links to the green infrastructure network. Improvements to the national M5 and M6 motorways network and freight railway network will help deliver better connectivity to Regional and National networks.
Key Development Plan Policies: Core Strategy Policies CSP1-5

25
Table 6: Black Country Key Targets In the Black
Country by 2026 we will have:
Where we are now [1]
Change in 2013/14 [2]
Overall Progress [3] Scale of the challenge by 2026
Increased net new homes
(2006 – 2013)
475,000 homes
(approx stock in 2006)
Wolv = 431 Dudley = 468
Sandwell = 536 Walsall = 710
Total = 2,145
Wolv = 3,457 Dudley = 4,433
Sandwell = 5,649 Walsall = 4,465
Total = 18,004
63,000 net new homes to be provided between 2006 and 2016. Actual net completions between 2006 and 2013 mean that the residual number to be provided between 2013 and 2026 is 44,996.
5 year Supply of Housing Sites
NA There is a 5 year supply of housing
land.
The Black Country also has a 5 year supply of housing land plus 38%.
Continually maintain a 5 year supply of housing sites in line with Government guidance.
High Quality Employment Land
533ha (2009)
Wolv = 3.3ha Dudley = 0.5ha
Sandwell = 3.4ha Walsall = 12ha
Total = 19.2ha
Wolv = 165.3ha Dudley = 160ha
Sandwell = 192ha Walsall = 123ha
Total = 640.3ha
Target of 901ha by 2016. 260.7ha left to be developed by 2016.
Readily Available Employment Land
N/A
Wolv = 57.66ha Dudley = 38.27ha Sandwell = 56.21ha Walsall = 21.78ha Total = 173.92ha
Wolv = 57.66ha Dudley = 38.27ha
Sandwell = 56.21ha Walsall = 21.78ha
Total = 173.92ha
Target = 41ha Wolverhampton Target = 28ha Dudley Target = 70ha Sandwell Target = 46ha Walsall
New office floorspace in
Strategic Centres Unknown
Wolv = 0m² Dudley = 0m²
Sandwell = 0m² Walsall = 448m²
Total = 448m²
Wolv = loss of 4,842m² since 2006
Dudley = 0m² since 2011
Sandwell = 20,192m² Walsall = 8,346m² since
2006.
Total = 23,696m²
+880,000m² (220,000m² in each strategic centre).
New Comparison retail floorspace
in Strategic Centres
Approx 348,000m²
(approx stock in 2006)
Wolv = 0m² Dudley = 0m² Sandwell = 14,209m²
Walsall = 0m²
Total = 14,209m²
Wolv =0m² Dudley = 508m² since
2011 Sandwell = 15,592m² Walsall = 21m² since
2011
Total = 16,121m²
Total = 345,000m² (Brierley Hill +95,000m², West Bromwich +65,000m², Walsall +85,000m², Wolverhampton +100,000m²).
[1] Figures refer to current total Black Country stock where known and relevant. [2] This figure is based on monitoring year April 2013 to March 2014. [3] Progress relates to targets, each of which have different baseline years. For housing, retail and office it is 2006, for employment it is 2009. Progress includes the 2013/14 performance.
LOI DEL2b – Employment Land Completions by LA (ha)
LOI DEL2c – Loss of Employment Land by LA area (ha) by type
Managing the development of additional employment and housing is a key part of the Spatial Strategy of the Core Strategy. Table 7 below highlights progress made so far in achieving this long term vision. Table 7: Spatial Strategy for Employment
Wolverhampton (ha) Black Country (ha)
Overall Progress Target at 2016 Overall Progress Target at 2016
Gross Employment Land
789 750 3,691 (as of March 2012)
3,447

26
Additions to Employment Land since 2009
12.4 24 27.4 (as of March
2012) 123
Employment Land Redeveloped to Housing since 2009
10.6 (0 in 2013/14)
33 54.07 (as of March 2012)
262
Overall it is considered that the strategy is on track. In Wolverhampton, housing completions on employment land is expected to increase to reflect extant planning permissions, and developments at i54 will help contribute to meeting the Black Country employment land needs, despite the low level of completions in Wolverhampton in 2013/14. Further analysis of this information is available in the Economy and Employment Chapter. Table 8 shows progress of significant developments in Wolverhampton in 2013/14. Despite the wider economic climate, it is encouraging that there are a number of large development projects underway or permitted this year. Map 2 shows the location of these developments in the context of the Spatial Strategy, and again it is encouraging that the majority of these developments are in the Growth Network.
Table 8: Progress on Significant Developments in Wolverhampton 2013/14 Map Ref Site Name Type of Development Status Development Outputs
1 The Gateway site, close to Junction 2 of the M54
A new £5m Porsche dealership
Under construction
27,000 sqft dealership, which encompasses display and storage/preparation areas
3 Sunbeam Factory Conversion of locally listed building to Residential use
Under construction
0.85ha / 111 cluster flats
4 Goodyear, Stafford Road
Mixed use development, including: Supermarket (Aldi)
Completed
1,572sqm gross / 20 Jobs
Housing Under construction
134 of 689 homes completed
New Neighbourhood Park Outline permission granted
Approx 6ha of open space
5 I54 Employment (B1/B2/B8) Highway Improvements
Phase 1 completed. Phase 2 is under construction
235,000sqm gross / 4,100 Jobs
7 Great Bridge Road, Bilston
Housing Under construction
116 of 152 homes completed Care home Transport improvements
8 Low Level Station, City Centre
Housing Under construction
167 of 208 flats completed
9 Bankfield Works, Bilston
Mixed use development - housing, commercial, open space
Under construction
136 of 166 homes completed
10 Ward Street, Bilston Housing Under construction
Approx 500 new homes – 118 out of approx. 500 homes completed.
11 Craddock Street / Gatis Street, Whitmore Reans
Housing Under construction
50 out of 145 homes completed
12 Compton Park, Compton
New housing, education and sports facilities
Under construction
43 out of 57 homes completed. Enhanced education and sports facilities.

27
13 Raglan Street, City Centre
Mixed use development - supermarket, housing, and other town centre uses
Under construction
Sainsbury’s supermarket: 14,712sqm gross, including 1,394sqm Gym / 450 Jobs and Transport improvements.
14 Royal Hospital, City Centre
Mixed use development - supermarket, housing, offices and other town centre uses
Permission granted Preparatory works commenced
13,840sqm gross / 716 Jobs Public realm and transport improvements
15 The Peel Centre, City Centre
Supermarket Permission granted
7,249 sqm gross / 250 Jobs Transport improvements
16 Prime 10, Wednesfield Employment (B1/B2/B8) Permission granted (reserved matters)
7.14ha / 38,790sqm
16 Former IMI Site Employment (B1/B2/B8) Plot 3 completed
0.86ha / 8,600sqm
17 Portobello Care Home / Retail Permission granted
1.8ha / 66 bed care home 1,460sqm gross / 60 jobs
18 Wolverhampton Interchange
Interchange 10 – Mixed-use building with retail on ground floor and offices above
Permission granted
3,382sqm Grade A Offices / 1,533sqm retail floorspace / 2,000 jobs
19 Land at Little Brickkiln Street
Youth Zone – multi-purpose indoor and outdoor recreation areas
Permission granted
3,515sqm of community facilities
20 Wolverhampton University, Stafford Street
Science Building Permission granted
3,541sqm
21 Wolverhampton University, Molineux Street
Business School Permission granted
6,000sqm
Map 2: Significant Development Sites
28
Green Belt
L9 No of developments which compromise the open nature of the Green Belt
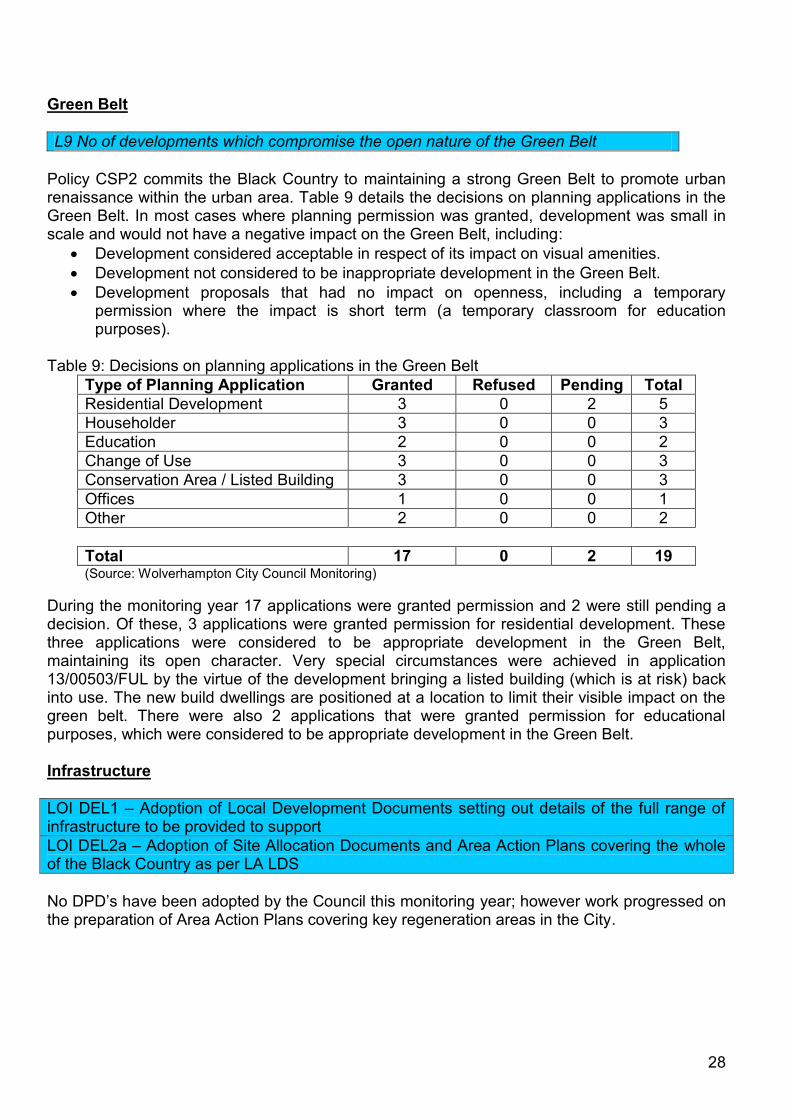
Policy CSP2 commits the Black Country to maintaining a strong Green Belt to promote urban renaissance within the urban area. Table 9 details the decisions on planning applications in the Green Belt. In most cases where planning permission was granted, development was small in scale and would not have a negative impact on the Green Belt, including:
Development considered acceptable in respect of its impact on visual amenities.
Development not considered to be inappropriate development in the Green Belt.
Development proposals that had no impact on openness, including a temporary permission where the impact is short term (a temporary classroom for education purposes).
Table 9: Decisions on planning applications in the Green Belt
Type of Planning Application Granted Refused Pending Total
Residential Development 3 0 2 5
Householder 3 0 0 3
Education 2 0 0 2
Change of Use 3 0 0 3
Conservation Area / Listed Building 3 0 0 3
Offices 1 0 0 1
Other 2 0 0 2
Total 17 0 2 19 (Source: Wolverhampton City Council Monitoring)
During the monitoring year 17 applications were granted permission and 2 were still pending a decision. Of these, 3 applications were granted permission for residential development. These three applications were considered to be appropriate development in the Green Belt, maintaining its open character. Very special circumstances were achieved in application 13/00503/FUL by the virtue of the development bringing a listed building (which is at risk) back into use. The new build dwellings are positioned at a location to limit their visible impact on the green belt. There were also 2 applications that were granted permission for educational purposes, which were considered to be appropriate development in the Green Belt. Infrastructure
LOI DEL1 – Adoption of Local Development Documents setting out details of the full range of infrastructure to be provided to support
LOI DEL2a – Adoption of Site Allocation Documents and Area Action Plans covering the whole of the Black Country as per LA LDS
No DPD’s have been adopted by the Council this monitoring year; however work progressed on the preparation of Area Action Plans covering key regeneration areas in the City.

29
Derelict Land
L36 Derelict Land Reclaimed
A comprehensive re-survey of vacant and derelict land and buildings throughout the City was undertaken during 2011 for the National Land Use Database. There were 217.6 ha of vacant and derelict land and buildings as of March 2013, of which 153.58 was vacant land, 37 ha was vacant buildings and 27 ha derelict land and buildings. During 2013/14, 2.15 ha (0.45 ha at Purcel Road; 0.68 ha at Muchall Grove; 0.33 ha at Millichip Road; 0.27 ha at 24 Showell Road; 0.21 ha at Hurstbourne Crescent; 0.21 ha at 58-70 Bunkers Hill Lane) of vacant land was brought into housing use and 0.86 ha was brought into employment use (at Fmr IMI Site, Well Lane). Therefore, the amount of vacant land has reduced by 3.01 ha to 150.57 ha, and there were a total of 214.59 ha of vacant and derelict land and buildings as of March 2014. Chart 1 – Spatial Strategy and Delivery Indicator Summary Indicator Baseline Target Progress made up
to 2012/13 Performance 2013/14
LOI DEL2b - Employment land completions by LA (ha)
N/A 24 ha by 2016 12.4 ha
Additions
No employment additions,
however i54 is now being developed.
LOI DEL2c - Loss of employment land by LA area (ha) by type
N/A 33 ha by 2016 10.6 ha lost 0 ha of employment land
redeveloped to housing. This is expected to increase in the future.
L9 No of developments which compromise the open nature of the Green Belt
N/A 0 Whilst some
large applications have been granted in the Green Belt, they have demonstrated very special circumstances.
During 2013/14 17
applications were granted permission in the Green Belt, but the majority of these did not harm the Green Belt. Of these there were 3 applications for residential development. These were considered to be appropriate in Green Belt, maintaining the character and openness.
LOI DEL1 - Adoption of Local Development Documents setting out details of the full range of infrastructure to be provided to supported
N/A 100% by 2016 No LDDs
have been adopted
No LDDs have been adopted
during 2013/14, however work continues on AAPs which are addressing infrastructure needs. The target should be achieved.
LOI DEL2a - Adoption of Site Allocation Documents and Area Action Plans covering the whole of the Black Country as per LA LDS
N/A 100% by 2016 No AAPs
have been adopted
No AAPs have been adopted
during 2013/14, however work continues on them and the target should be achieved.
L36 - Derelict Land Reclaimed 224.5 ha (March 2011)
None 4.77 ha of
vacant / derelict land was developed this year
3.01 ha of vacant / derelict
land was developed this year
Positive
Result
Neutral
Result
Negative
Result
? No Data C Core
Indicator
L Local
Indicator

30
3.2 HOUSING
SPATIAL OBJECTIVES 3. Model sustainable communities on redundant employment land in the Regeneration
Corridors, that make the most of opportunities such as public transport and canal networks, are well served by residential services and green infrastructure, have good walking, cycling and public transport links to retained employment areas and centres, are set in a high quality natural and built environment and are well integrated with surrounding areas.
4. Enhancements to the character of the Black Country’s existing housing areas by
protecting and improving high quality residential areas and pursuing a sustained and focussed programme of housing renewal in low quality residential areas requiring intervention.
Key Development Plan Policies: Core Strategy Policies HOU1-5, ENV3. Saved UDP
Policies HOU4-8, H11, H12. Affordable Housing SPD.
COI HOU1a - Housing Trajectory indicators (Net Home Completions, Housing Trajectory, Five Year Housing Land Supply)
LOI HOU1 - Net housing completions for each Regeneration Corridor and Strategic Centre and for free-standing employment sites outside the Growth Network by local authority
Net Home Completions Table 10: Plan Period and Housing Targets
Indicator Start of Plan Period
End of Plan Period
Total Housing required (net)
Source of Plan Target
COI HOU1a
2006 2026 2006-2016: 2016-2021: 2021-2026:
5,662 2,580 5,169
Black Country Core Strategy (February 2011)
Total: 13,411
One of the main aims of the BCCS is to promote urban renaissance through the creation of sustainable urban communities in which people will choose to live, work and invest. This requires large-scale new housing provision which makes maximum use of previously developed land. Taking into account 3,026 net completions over the period 2006-14, the outstanding net housing requirement for Wolverhampton up to 2026 is 10,385. Table 11 shows that the number of net completions has varied greatly over the last 10 years, due to a combination of two factors: the large number of demolitions taking place in certain years; and the housing market downturn which began in 2007. Completions reached a very low level during 2010/11, but this was the bottom of the dip and completions have increased during 2011 – 14, with many large sites now under construction.

31
Table 11: Wolverhampton Total Net Completions 2000-2014 Year New Build
Completions Conversion Completions
Total Gains
Total Losses (Demolitions)
Total Net Completions
2000/1 504 32 536 123 413
2001/2 211 57* 268 162 106
2002/3 522 32* 554 582 -28
2003/4 436 93* 529 222 307
2004/5 570 76 646 137¹ 509
2005/6 748 59 807 216¹ 591
2006/7 294 41 335 35¹ 300
2007/8 383 33 416 54¹ 362
2008/9 387 82 469 40¹ 429
2009/10 346 48 394 145¹ 249
2010/11 198 1 199 140¹ 59
2011/12 552 194 743 16* 730
2012/13 476 20 496 30 466
2013/14 358 75 433 2 431
Total 2006-14
2994 494 3488 462 3026
* Net figure ¹ Includes conversion losses (Source: Wolverhampton Planning, Building Regulations and Council Tax Data)
There were 334 homes under construction as of March 2014. 41 of these were at Low Level Station, where the second development of apartments is now nearly complete, supported by Get Britain Building funding. The first phase of development is now well underway at Goodyear (Persimmon - 314 homes), and the second phase has commenced at Bankfield Works (Redrow - 95 homes) and Ward Street (Persimmon - 163 homes). The Bellway site on Craddock Street / Gatis Street (145 homes) and the former ADAS offices off Wergs Road (62 homes) are under construction, and the Compton Park (55 homes) and Vicarage Road / Raby Street Housing Renewal (52 homes) sites are almost complete. The BCCS sets out housing targets for each Black Country authority for different parts of the Growth Network and for outside the growth network, including free-standing employment sites. During 2013/14 there were 74 completions in Wolverhampton City Centre (Strategic Centre), 98 completions in Regeneration Corridor 4 (Wolverhampton-Bilston) and 49 completions in Regeneration Corridor 2 (Stafford Road). Most of the large housing sites under construction are located in the Growth Network. Significant progress has also been made towards meeting medium and long term housing targets for the Growth Network, through achievement of adoption of the Stafford Road Corridor and Bilston Corridor Area Action Plans, which are bringing forward site specific housing allocations, and Neighbourhood Plans for Tettenhall and Heathfield Park. Consultation is also currently underway on the Draft City Centre Area Action Plan (covering the City Centre and Regeneration Corridor 3), which will complete the suite of Local Plan documents covering the City. Further details are provided in Table 12 and in the SHLAA.

32
Table 12: Performance against BCCS housing targets for the Growth Network and Free-standing Employment Sites
BCCS Target (to 2026)
Completions 2009-14
Commitments (including Adopted & Draft Local Plan)
Draft City Centre AAP Windfall Assumptions
Total achieved to date
Wolverhampton City Centre
3,230 470 1,378 460 2,308
Regeneration Corridor 2 – Stafford Road Corridor
1,643 134 1,098 0 1,232
Regeneration Corridor 3 – South of City Centre
563 0 400 0 400
Regeneration Corridor 4 – Wolverhampton to Bilston Corridor
4,310 254 2,290 0 2,544
Free-standing employment sites
306 0 70 0 70
Total 10,052 858 5,236 460 6,554
Table 12 shows that, for the Corridors where Area Action Plans are adopted or at draft stage there will be under-delivery of housing. However, since the Core Strategy was prepared, further housing capacity has emerged outside the growth network, for example on surplus public sector land. This means that Wolverhampton is currently able to meet overall Core Strategy housing targets, and the extent of under-delivery within the growth network will not undermine the overall strategy. Housing Trajectory / Housing Land Supply up to 2026 The Housing Trajectory for Wolverhampton up to 2026 is set out in the Wolverhampton Strategic Housing Land Availability Assessment (SHLAA). The SHLAA has been updated annually since 2009, and the 2015 SHLAA update report is available on the website2. Taken together with the 3,026 net completions to date (2006-14), the 2015 SHLAA provides a total capacity of 13,777 net homes over the period 2006-26. The BCCS target for Wolverhampton is 13,411 net homes over the Plan period (2006-26). Therefore, the SHLAA provides a surplus of 366 homes (3.5%) over and above the remaining net target for the Plan period. Taken together with the 17,573 net completions to date (2006-14) in the Black Country, the most recent SHLAA’s provide a total capacity of 63,493 net homes over the Plan period 2006-26, compared to the BCCS target of 63,000 net homes. Therefore, the SHLAA’s provide a surplus of 493 homes (1%) over and above the remaining net target for the Plan period. The Housing Trajectory for the Black Country up to 2026 is set out in Appendix E to this report. This trajectory is based on the figures provided in each of the Black Country authority’s SHLAA update reports.
2 http://www.wolverhampton.gov.uk/planningpolicy

33
Five Year Housing Land Supply The NPPF requires each Local Planning Authority to demonstrate at least 5 years supply of deliverable housing land, against adopted targets. Deliverable sites are those that are available, suitable for housing and achievable within the 5 year period. The SHLAA must demonstrate an immediate 5 year deliverable supply against BCCS housing targets, with a base date of April 2014 to ensure that the information is up-to-date. Therefore, the 5 year housing supply period for Wolverhampton and the Black Country runs up to 2019. For Wolverhampton, taking into account net completions 2006-14, the remaining BCCS target for the period 2014-19 is 4,394 net homes (applying a 5% buffer). The SHLAA demonstrates that 5,539 homes are deliverable over this period. Therefore, Wolverhampton has a 5 year housing land supply under BCCS targets (H1) plus 26%. For the Black Country, taking into account net completions 2006-14, the remaining BCCS target for the period 2014-19 is 16,032 net homes. The SHLAA’s demonstrate that 22,114 homes are deliverable over this period. Therefore the Black Country as a whole has a 5 year housing land supply under BCCS targets (H1) plus 38%. The NPPF requires local authorities to demonstrate at least 5 years supply of gypsy and traveller pitches and travelling showpeople plots, against adopted targets. The BCCS targets for Wolverhampton are 36 pitches and 3 plots up to 2018. 3 pitches were provided during 2011/12, and the Bushbury Reservoir site gained planning permission for 12 pitches during 2012/13, reducing the remaining permanent pitch requirement to 21. There are no other sites identified through emerging Plans which could meet this requirement. During 2012/13, land was also sold to extend the existing travelling showpeople site adjoining Phoenix Park, with capacity to provide the 3 additional plots required up to 2018.
COI HOU1b - New and converted homes on previously developed land
BCCS Policy HOU1 sets out a 95% target for the percentage of housing (gross) built on previously developed land for each authority up to 2026. Table 13 demonstrates that Wolverhampton has historically achieved high rates of previously developed land completions – 97% on average over the period 2001-14, compared to a target of 99% set in the Regional Spatial Strategy for this period. Table 13: Previous Use of Housing Completion Sites 2001-2014
Year Previously Developed
% Greenfield % Total
2001/02 252 94 17 6 269
2002/03 552 100 2 0 554
2003/04 526 99 6 1 532
2004/05 636 99 7 1 643
2005/06 796 99 11 1 802
2006/07 335 100 0 0 335
2007/08 401 96 15 4 416
2008/09 462 99 7 1 469
2009/10 386 100 0 0 386
2010/11 177 89 22 11 199

34
2011/12 697 93 49 7 746
2012/13 454 92 42 8 496
2013/14 412 96 19 4 431
Total 2001-14 6086 97 197 3 6283
Total 2006-14 3324 96 154 4 3478 (Source: Wolverhampton Planning, Building Regulations and Council Tax Data)
During 2013/14 the target rate of 95% was exceeded. Permissions were granted for 7 homes on 2 greenfield (garden land) sites during 2013/14. Homes on greenfield land now make up 9% (306) of homes with planning permission, including 36 currently under construction, and 5% (214) of other commitments.
LOI HOU2a - % of housing completions on sites meeting accessibility standards
Net housing density provides a measure of how efficiently land is used for residential development. Net density is expressed in dwellings per hectare (dph) of net housing area, which excludes necessary areas of public open space, major roads and other services. BCCS Policy HOU2 expects all housing developments to achieve a minimum of 35 dph except where higher densities would prejudice historic character and local distinctiveness. Densities of over 60 dph are considered acceptable only within Strategic or Town Centres. Three sites accommodating 23 homes were granted permission during 2013/14 on new build sites of more than 5 homes with a density of less than 35 dph. The former St Jude’s Infant School (9 homes) and land corner of Mill St / Wolverhampton St (8 homes) both have a density of 23 dph due to design constraints. One site (Railway Drive, Bilston) accommodating 47 homes was granted permission during 2013/14 on a new build site outside a Strategic or Town Centre of more than 5 homes and with a density of more than 60 dph (170 dph). This site falls on the edge of Bilston Town Centre, very close to the metro stop and bus station. Permission was refused for a higher density scheme on the site. Table 8 of the BCCS sets out accessibility standards to be applied to housing developments of 15 homes or more. These standards vary depending on the housing density of the scheme. There was only 1 such development granted permission during 2013/14 – Railway Drive, Bilston (47 homes), which met the accessibility standards.
LOI HOU2b - Proportion of 1, 2 and 3+ bedroom properties completed by type
Table 14: Home Type for Gross Completions 2013/14
1 bedroom 2 bedroom 3 bedroom 4+ bedroom Total
Flats 46 33 0 20 99
Houses 1 83 131 119 334
Total 47 116 131 139 433
% 11 27 30 32 100
BCCS Target 20 40 40 100 (Source: Wolverhampton Planning Application data)

35
Table 14 shows the home type breakdown for gross completions. The figures demonstrate a drop in the proportion of high density housing developments being built, in response to the declining market for flats. There has been a corresponding increase in the proportion of 3+ bedroom houses built across the City. It is too early to judge the effectiveness of the BCCS policies in delivering the targets for different property sizes (set out in Table 16), as the BCCS was adopted in 2011 and new housing permissions take a number of years to reach completion.
COI HOU3 - Gross affordable housing completions
The C3 (Black Country, Telford, Cannock and South Staffordshire) Strategic Housing Market Assessment 2008 identified a need for 621 extra general purpose affordable homes each year in Wolverhampton, and additional need for affordable specialist accommodation. However, it has never been possible to meet this level of need and the BCCS sets a target for the Black Country of 15% of the gross housing target. As there has been a significant reduction in housing demolition estimates since adoption of the Core Strategy, this now equates to an average of only 86 affordable homes per year for Wolverhampton. In previous years, this indicator has been defined as housing completions which are affordable when constructed, either through housing grant or developer subsidy. However, this definition is too narrow to capture the many new affordable housing products which have emerged over the past few years (for example, housing built for private sale can now be converted to affordable tenure at a later date). In addition, Government published figures include acquisitions as well as completions. There have been a significant number of acquisitions in Wolverhampton in previous years. Therefore, Government figures are used to monitor COI HOU3. Table 15: Wolverhampton Affordable Housing Figures: 2006-14
Year New Affordable Housing
Gross housing target
Proportion Target (15%)
2006-7 80 638 13% 96
2007-8 140 638 22% 96
2008-9 140 638 22% 96
2009-10 160 639 25% 96
2010-11 130 639 20% 96
2011-12 100 639 16% 96
2012-13 190 575 33% 86
2013-14 102 573 18% 86
Total 1042 4979 21% 748 (Source: Government Live Tables / Black Country Core Strategy)
Affordable housing completions stabilised in 2013/14. Given the change in gross housing targets, overall since 2006 Wolverhampton has performed well above the 15% target set in the BCCS. The majority of affordable completions in recent years have been grant funded and only 10 section 106 affordable homes were completed during 2013/14. 40 new Council homes will also be built at the Thompson Avenue site over the next few years.

36
COI HOU4 – Net additional pitches (permanent residential pitches, transit pitches and plots for travelling show people) provided up to 2018
The Gypsy and Traveller Accommodation Assessment (GTAA) for the Black Country (2008) has informed BCCS Policy HOU4 and identifies a need for 36 new pitches and 3 new plots in Wolverhampton for gypsies and travelling show people over the period 2008-18. No additional pitches were provided in 2012/13. The supply of gypsy and traveller sites is addressed under indicator COI HOU1a and LOI HOU1 (see above).
LOI HOU5 – Loss of education and health care capacity
For the purposes of monitoring Policy HOU5, education and health care capacity includes pre-school care, schools, college and university buildings, GP surgeries and hospital buildings. No education or health care capacity was lost during 2013/14. Chart 2 - Housing Indicator Summary
Indicator Baseline Target Progress made up to 2012/13
Performance 2013/14
COI HOU1a - Net home completions to date
2006 566 (2013/14) Net completions
averaged 371 pa for the period 2006-13
Completions were 135 below
the annual target.
COI HOU1a - Housing land supply up to 2026
2006 13,411 (2006-26)
A sufficient supply
of housing land has been maintained to meet adopted housing targets since 2006
The 2014 SHLAA demonstrates
that there is sufficient housing land to meet BCCS targets up to 2026, plus 366 dwellings (3.5% above the remaining target).
COI HOU1a - 5 year housing land supply
2006 5 year supply + 5%
A 5 year supply of
housing land has been maintained since 2006
Wolverhampton has a 5 year
supply of housing land plus 26%
LOI HOU1 - Net housing completions / commitments / allocations for each Regeneration Corridor and Strategic Centre and for free-standing employment sites outside the Growth Network
2009 CC = 3,230 RC2 = 1,643 RC3 = 563 RC4 = 4,310 FSES = 306
CC = 2,025 RC2 = 1,238 RC3 = 0 RC4 = 2,536 FSES = 0
There has been a
small reduction in overall capacity following progress made on Area Action Plans
CC = 2,308 RC2 = 1,232 RC3 = 400 RC4 = 2,544 FSES = 70
Wolverhampton has achieved
two thirds of the overall target of 10,052 homes.
COI HOU1b New /converted homes on previously developed land
2006 95% 96% over the
period 2006-13
96% over the period 2006-14
LOI HOU2a - % of housing completions on sites meeting accessibility standards
2011 100% 84% of new homes
gaining permission on eligible sites 2012/13 met accessibility standards. The 16% which did not were on two sites where it was not possible to improve access
100% of new homes gaining
permission on eligible sites 2013/14 met accessibility standards.

37
LOI HOU2b – Proportion of 1, 2 and 3+ bedroom properties completed
2011 20% 1 bedroom 40% 2 bedroom 40% 3+ bedroom
12% 1 bedroom
26% 2 bedroom 61% 3+ bedroom
11% 1 bedroom
27% 2 bedroom 62% 3+ bedroom
COI HOU3 Gross affordable housing completions
2006 15% of target gross completions since 2006
21% 18%
COI HOU4 Gypsy and Traveller Accommodation
2008 2008 -18: 36 pitches and 3 plots
3 pitches were
completed during 2011/12, 12 pitches gained planning permission during 2012/13, and a site was made available to meet the plot target. Therefore there is a 5 year supply of plots, but not of pitches.
3 pitches were completed
during 2011/12, 12 pitches gained planning permission during 2012/13, and a site was made available to meet the plot target. Therefore there is a 5 year supply of plots, but not of pitches.
LOI HOU5 Loss of education and health care capacity
2011 None No capacity lost No capacity lost
Positive
Result
Neutral
Result
Negative
Result
No Data C Core
Indicator
L Local
Indicator

38
3.3 ECONOMY AND EMPLOYMENT
SPATIAL OBJECTIVES 8. A restructured sub-regional economy which provides sufficient strategic high quality
employment land in the best locations within Regeneration Corridors to attract new high technology and logistics businesses and also recognises the value of local employment land. This will have resulted in sustained economic growth and an increase in the choice of jobs available in the Black Country’s economy.
9. Model sustainable communities on redundant employment land in the Regeneration
Corridors, that make the most of opportunities such as public transport and canal networks, are well served by residential services and green infrastructure, have good walking, cycling and public transport links to retained employment areas and centres, are set in a high quality natural and built environment and are well integrated with surrounding areas.
Key Development Plan Policies: Core Strategy EMP1-6, Saved UDP Policies B5, B11
BD1 Total amount of additional employment floorspace – by type
LOI EMP1a - Employment land completions by LA (ha)
To measure the performance of these policies, significant (over 0.4 ha) and small (below 0.4ha) new employment developments completed are monitored.
Table 16: Employment Completions on Employment Land Type Completions Jobs
Floorspace Completions High Quality Local Quality
Addit’s to Emp Land
Recycl’g of High Quality Emp Land
Recycl’g of Local Quality Emp Land
Other3
Additions to Emp Land
Recycl’g of Local Quality Emp Land
Other4
Gross
Net
2009/10 B8 (Storage and Distribution)
6.6 0 0 0 0 0 0 Unk’n 38500 Unk’n
Other Emp Uses5 0 0 0 0 0.8 0 0 Unk’n 198 Unk’n
Small Sites 0 0 0 0.3 0 0.1 0.2 Unk’n 2713 Unk’n
2010/11 Other Emp Uses
6 3.8 0 0 0 0 0 135 5330 Unk’n
Small Sites 0 0 0 0 0 0 0.9 58 5987 Unk’n
2011/12 B8 (Storage and Distribution)
0 0 0 0 0 1.1 0 6 6400 6400
Other Emp Uses7 1.2 0 0 0 0 0 0 Unk’n 781 781
Small Sites 0 0 0 0.6 0 0 0.9 35.5 6762 392
2012/13 B8 (Storage and Distribution)
0 0 0 0 0 3.72 0 140 secured (40 new)
2325 2240
Small Sites 0 0 0 0 0 0.01 0 14 140 140
2013/14
3 & 6
Other includes extensions to existing buildings, or change of use applications. 5, 8 & 9
Other Employment uses include waste management uses. Does not include other uses found on Employment Land, such as car washes, etc unless they are on RELS sites.

39
B1/B2 combined 0 2.44 0.86 0 0 0 0 Unk’n Unk’n Unk’n
B8 (Storage and Distribution)
0 0 0 0 0 0.16 0 Unk’n 1580 1580
Small Sites 0 0 0 0 0 0.01 0 Unk’n Unk’n Unk’n
Total 11.6 2.44 0.86 0.9 0.8 5.10 2 388.5 70716 11533
(Source: RELS 2013/14) Only completed developments are reported.
The table above shows employment completions within Wolverhampton between 2009 and 2014, with the total completions for 2013/14 being 3.47ha. This level of completions is less than in previous years and included employment completions on small sites (0.17ha). These new developments are not net additions to the existing employment stock as they involve the recycling of existing employment land. The economic climate has had an impact upon this sector and is reflected by the lack of new industrial development taking place within the City. However, of greater significance to Wolverhampton and the Black Country is the scale of activity at i54, the nationally important Regional Investment Site, immediately to the north of the City. The site provides 90ha of high quality employment land on 10 plots contributing to meeting the Black Country employment land needs. The principal internal infrastructure on site has already been delivered, and during the monitoring year a new Jaguar Land Rover engine plant was completed on the western part of the site, providing 1,400 new jobs. The Core Strategy establishes a target of 24ha of additional occupied employment land in Wolverhampton to be built out by 2016, and a further 34ha in South Staffordshire. Since 2009, 12.4ha of additional land (ie not involving the recycling of existing employment land) has been developed in the City for employment uses to contribute towards this target which has delivered over 230 additional jobs. The success of the i54 site in attracting development interest means that it is likely that South Staffordshire will provide more additional employment land by 2016 than was envisaged in the Core Strategy. Some 67ha of land at i54 has been built out, principally at the Jaguar Land Rover part of the site.
BD2 Total Amount of employment floorspace on previously developed land – by type
100% of employment floorspace has been built on previously developed land during this monitoring year. This is above the target of 90%.
LOI EMP1b - Loss of employment land by LA area (ha)
The loss of employment land to housing development is monitored to ensure that sufficient high quality sites are retained for employment uses, and to provide a sufficient amount of surplus poor quality employment land to come forward for housing development as detailed in Table 17. Table 17: Loss of Employment Land
Year Loss of High Quality Employment Land
Loss of poor quality Local Quality Employment Land
2009/10 0ha 0*
2010/11 0ha 2.9ha*
2011/12 0ha 2.7ha
2012/13 0ha 5ha
2013/14 0ha 0 ha

40
Total 0ha 10.6ha
Target at 2016 0ha 33ha Note, other employment has been developed out during this period, but this does not count as a loss as these sites were not included in the 2009 baseline (for example, because it may already have been a commitment for housing development). The amount lost relates to the completion of housing developed on these sites that monitoring. For large sites, this is recorded in phases. *These figures are different to the figure reported in 2009/10 to match the Core Strategy targets.
It is encouraging to see that there has been no loss of high quality employment land. The loss of local quality employment land reflects the low level of housing completions. However the presence of a number of extant planning permissions for residential development on local quality employment land will provide for this figure to increase in the future. During this monitoring year (2013/14) an application was submitted for the Sunbeam Factory. The Sunbeam Factory is a local quality employment site located on the corner of the Penn Road (A449) and the Wolverhampton Ring Road (A4150). It is a locally listed building due to the historical importance of the Sunbeam Motor Company which manufactured motor vehicles. The application is for a change of use from B1/B2 (office/industrial) to residential on the 0.9ha site. The proposed development will involve the conversion and part new build of the Sunbeam Factory building to create a mixture of residential uses to include HMOs, single occupancy flats, all integrated with an element of learning disability housing. The application was submitted on 19th December 2013 and assessed during the monitoring year. Permission was granted on 18th June 2014 and construction works have since commenced on site (13/01262/FUL). As the permission was granted in next year’s monitoring year it will be recorded in table 17 in the AMR 2014/15.
LOI EMP2a - Employment land completions by LA by High Quality and Potential High Quality Employment Area as defined in Policy EMP2 and broad locations shown in Appendix 3 (ha)
LOI EMP2b - Additions made to High Quality Employment Land stock as defined in Policy EMP2 through improvement programmes
LOI EMP3a - Employment land completions by LA by Local Quality Employment Area as defined in Policy EMP3 and broad locations in Appendix 3(ha)
LOI EMP2c - Loss of employment land by LA area (ha) by High Quality and Potential High Quality Employment Area as defined in Policy EMP2 and broad locations shown in Appendix 3 (ha)
LOI EMP3b - Loss of employment land by LA area (ha) by Local Quality as defined in Policy EMP3 and broad locations in Appendix 3 (ha)
Table 18: Progress towards meeting High Quality and Local Quality employment land needs
Quality of Employment Land
Baseline (2009)
Employment Completions 2013/14
Employment Completions 2009/14
Losses to Emp Land 2013/14
Emp Land 2013/14
Target at 2016
High Quality 123ha 3.30ha 42.3ha* 0ha 165.3ha 224ha
Local Quality 629ha 0.17ha** 5.9ha 10.6ha*** 624ha 526ha
Total Stock 752ha 3.47ha 48.2ha 10.6ha 789.3ha 750ha

41
* From additions to stock and recycling of local quality employment land which improves quality and other additions to high quality employment land. **This figure includes sites of less than 0.4ha from RELS 2013/14 monitoring returns. ***From development to residential and recycling of local quality employment land to high quality employment land.
Table 18 shows progress towards meeting the overall employment land needs for Wolverhampton as set out in the Core Strategy. This shows that while the City contains a sufficient total stock of land to meet its target, the provision of a sufficient supply of high quality land is much more challenging with a current deficit of 58.7ha against the 2016 target. It should also be noted that i54 in South Staffordshire is being built out at a quicker pace than envisaged and it is critical that initiatives which bring forward additional high quality land to support ongoing regeneration, (particularly to accommodate the growth of the high value manufacturing sector) are supported. In terms of local quality employment land, the amount of residential development completed is expected to increase in the coming years as planning permissions are built out.
LOI EMP4 - Readily available employment land
For employment development sites to be considered readily available, they need to meet the following definition:
Has planning permission, is allocated in the development plan for employment uses or is subject to any other Council resolution promoting or safeguarding it for employment uses;
There are no major problems of physical condition;
There are no major infrastructure problems in relation to the scale of development / activity proposed; and
It is actively marketed for employment uses, there is evidence that there is a willing seller, or
Evidence that the owner wishes to retain the whole or part of the site for employment uses.
The Core Strategy establishes an annual target of 41ha for Wolverhampton of readily available employment land being required to meet the employment investment needs of the City. Table 19 shows the total amount of readily available employment land, and it is encouraging that the target is being met and exceeded (this is mainly explained by the 18 additional sites added to the RELS database during the monitoring year 2011/12). The sites considered to be readily available are shown in a table and map in Appendix F. Table 19: Readily Available Employment Land 2013/14
Hectares of Employment Development Opportunities
Hectares of Readily Available Employment Development
Opportunities
Annual Target
85.63 Ha 57.66 Ha 41 Ha Source: RELS 2013/14. Sites over 0.4 hectares only
In terms of the quality of sites, Figure 6 shows that the City contains a broad portfolio of sites, particularly to meet sub-regional and local investment needs. Approximately 69.05ha of employment development opportunities belong to the ‘Premium (Regional Investment)’, ‘Sub-regional’ and ‘Good Local’ portfolio of sites, as shown in Figure 6. Wolverhampton Business Park makes up the 3.54ha of ‘Premium (Regional Investment)’ site.

42
Figure 6 - Employment Development Opportunities – Portfolio 2013/14
(Source: RELS 2013/14)
There is however a gap in provision to meet large scale high quality requirements, with only two sites over 5ha. I54 and other employment sites to the north of the City in South Staffordshire currently provide for such requirements but the speed of take-up of land in these locations is diminishing their ability to maintain this role in the medium term. It is critical to keep this situation under regular review so that the City is able to accommodate a variety of development proposals in the future.
LOI EMP5 – Proportion of major planning permissions making provision for targeted recruitment or training through s106 Agreements / conditions
Table 20: Number of developments making provision for targeted recruitment
Number of Permitted Major Applications
Number of Permissions Making Provision for Targeted
Recruitment
Proportion of Permissions Making Provision for
Targeted Recruitment
42 19 45%
Table 20 shows the number of developments where targeted recruitment / training has been secured through the granting of planning permission. In most cases this was secured via condition rather than s106. The above figures indicate that the target of 50% has not been met since the adoption of the Core Strategy, however it should be noted that of the 42 permitted major applications, 14 were not considered relevant to apply the policy to as they were for reserved matters, retrospective and variation of condition applications. This increases the performance to 68% and in the remainder of applications, targeted recruitment / training was not considered relevant as developments were not major job creators, or were made by developers who were likely to use local labour force.
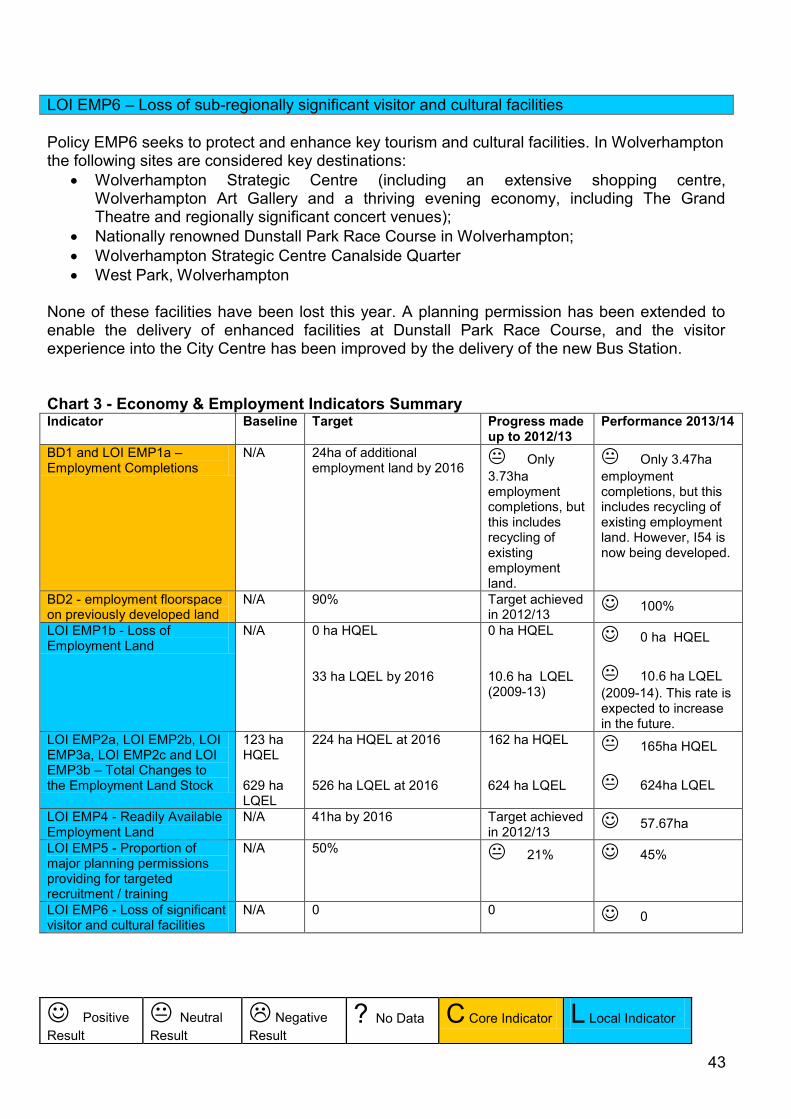
43
LOI EMP6 – Loss of sub-regionally significant visitor and cultural facilities
Policy EMP6 seeks to protect and enhance key tourism and cultural facilities. In Wolverhampton the following sites are considered key destinations:
Wolverhampton Strategic Centre (including an extensive shopping centre, Wolverhampton Art Gallery and a thriving evening economy, including The Grand Theatre and regionally significant concert venues);
Nationally renowned Dunstall Park Race Course in Wolverhampton;
Wolverhampton Strategic Centre Canalside Quarter
West Park, Wolverhampton None of these facilities have been lost this year. A planning permission has been extended to enable the delivery of enhanced facilities at Dunstall Park Race Course, and the visitor experience into the City Centre has been improved by the delivery of the new Bus Station.
Chart 3 - Economy & Employment Indicators Summary Indicator Baseline Target Progress made
up to 2012/13 Performance 2013/14
BD1 and LOI EMP1a – Employment Completions
N/A 24ha of additional employment land by 2016
Only
3.73ha employment completions, but this includes recycling of existing employment land.
Only 3.47ha
employment completions, but this includes recycling of existing employment land. However, I54 is now being developed.
BD2 - employment floorspace on previously developed land
N/A 90% Target achieved in 2012/13
100%
LOI EMP1b - Loss of Employment Land
N/A 0 ha HQEL 33 ha LQEL by 2016
0 ha HQEL 10.6 ha LQEL (2009-13)
0 ha HQEL
10.6 ha LQEL
(2009-14). This rate is expected to increase in the future.
LOI EMP2a, LOI EMP2b, LOI EMP3a, LOI EMP2c and LOI EMP3b – Total Changes to the Employment Land Stock
123 ha HQEL 629 ha LQEL
224 ha HQEL at 2016 526 ha LQEL at 2016
162 ha HQEL 624 ha LQEL
165ha HQEL
624ha LQEL
LOI EMP4 - Readily Available Employment Land
N/A 41ha by 2016 Target achieved in 2012/13
57.67ha
LOI EMP5 - Proportion of major planning permissions providing for targeted recruitment / training
N/A 50% 21%
45%
LOI EMP6 - Loss of significant visitor and cultural facilities
N/A 0 0 0
Positive
Result
Neutral
Result
Negative
Result
? No Data C Core Indicator L Local Indicator

44
3.4 CENTRES AND TOWN CENTRE USES
SPATIAL OBJECTIVES 1. Focussed investment and development in comparison shopping, office employment, leisure, tourism and culture within the Strategic Centres, to retain and increase their share of economic activity and meet the increasing aspirations of their catchment areas. 5. A network of vibrant and attractive town, district and local centres across Wolverhampton, each offering an appropriate choice of facilities. The historic character of these centres will be protected and enhanced through sensitive development of local facilities, housing led development and environmental improvements to create safe, attractive streets and spaces. Key Development Plan Policies: Core Strategy Policies CEN1-7, Saved UDP Policies SH4, SH10, SH14,-17, CC1, CC6
LOI CEN1, 3-5 – Amount of floorspace for town centre uses completed and amount permitted within an appropriate centre, as a proportion of all completions and planning permissions for such uses and in accordance with policies CEN3, CEN4 and CEN5.
LOI CEN6 – Number of developments of up to 200 square metres gross floorspace for town centre uses permitted outside of centres that meet the requirements of Policy CEN6, as a proportion of all such permissions.
LOI CEN7 – Number and floorspace of new developments for town centre uses permitted outside of strategic, town, district or local centres that do not accord with Policy CEN7 requirements.
Significant retail, office and leisure developments (known as town centre uses) in Wolverhampton are monitored to provide an indication of the strength of the commercial market, the amount of growth / investment and the location of development. Policy CEN2 of the Core Strategy establishes a three tier hierarchy of centres in the Black Country, from Wolverhampton Strategic Centre being the main focus, followed by the Town Centres of Bilston and Wednesfield, and then a network of 28 District & Local Centres. Table 21: Town Centre Uses Permissions granted in 2013/14 in Wolverhampton Centre Comparison Retail
(sqm gross) Convenience Retail (sqm net)
Office (sqm gross)
Leisure (sqm gross)
Wolverhampton Strategic Centre 604 0 4,446 4,909 Town Centres 372 0 0 220 District & Local Centres 0 0 0 0 Out of Centre 909 640 1,133 1,762 Total 1,885 640 5,579 6,891 Note, only developments providing net additions to floorspace over 100sqm are monitored. Edge of Centre proposals are classed as serving those Centres within the guidance given in CEN policies.
The 2013/14 monitoring year saw a number of permissions for town centre uses. This included permission for a retail and office scheme as aprt of the Interchange scheme to provide a modern gateway to the city centre focussed around a multi-modal transport hub and permission for leisure uses as part of a bespoke Youth Zone development in the city centre. All proposals

45
are considered in terms of their appropriateness in accordance with the requirements of the NPPF and Core Strategy policies CEN1-7. Table 22: Number of Permissions Town Centre Uses 2013/14
Number of Permissions Town Centre Uses 2012/13
Total In-centre Edge-of-centre Out-of-centre
16 4 3 9
Note, only new permissions for Town Centre Uses over 100 sqm are monitored.
There have been no significant completions for new developments of town-centre uses during the monitoring year. However, a number of major schemes are now on site and will contribute towards future completions. Table 23 - Progress towards Core Strategy Targets (net additional floorspace)
Comparison Retail (Since 2006)
Office (Since 2006)
Target (by 2021)
Completed Target (maximum by 2026)
Completed
Wolverhampton Strategic Centre
70,000
0
220,000
- 4,842
Source: Wolverhampton City Council
Whilst the Core Strategy has no targets for convenience retail or leisure provision, there are targets for net additional floorspace for comparison retail provision and a maximum for office provision to serve Wolverhampton Strategic Centre. Although currently progress has not been made to date towards the targets, a number of planning permissions are in place and some major schemes are now on site which will contribute towards future completions and delivering the targets.
LOI TRAN5a – Number of publically available long stay parking places in strategic centres
LOI TRAN5b – All new publically owned long stay parking spaces in Strategic Centres to be located in peripheral locations
These indicators are monitored in the Transport Chapter.
L13 Percentage of vacant units in Wolverhampton City Centre
The number of vacant units gives an indication of the vitality and viability of the City Centre. Table 24 identifies the number of shop units in the City Centre and the number of vacant units. The area contains the frontages of the Shopping Quarter (Primary Shopping Area), as identified in the UDP. Table 24: Number of vacant retail units in the City Centre at 1st April 2014
Number of units
Total number of units 702
Total number of vacant units 149
Percentage of vacant units 21.1
(Source: Wolverhampton City Council)

46
The target vacancy rate is to be below the national average for the year, which was 12.2% (source: Local Data Company). The current level of vacant units in Wolverhampton is 21.1%, which is 8.9% above the national average. The overall percentage level of vacancy has decreased from the previous monitoring year. The current level of vacant units is influenced by the continued fragile retail climate, concentrations of vacant units in certain parts of the city centre and the changing nature of retailing.

47
Chart 4 – Centres and Town Centre Uses Indicator Summary
Indicator Baseline Target Progress made up to 2012/13
Performance 2013/14
LOI CEN1, 3-5 - Amount of floorspace for town centre uses completed and amount permitted within an appropriate centre, as a proportion of all completions and planning permissions for such uses
N/A 100% of Town Centre Uses in an appropriate Centre City Centre - 70,000 sqm Comparison Retail - Up to 220,000 sqm Office Uses
Since 2004/5,
10% of completions have been in / edge of centre, although policy requirements have been met
Comparison
Retail - No progress
Office – No
progress
44% of permitted
developments were in / edge of centre.
Retail – no
developments completed
Office – no
completions in the City Centre
LOI CEN6 - Number of developments of up to 200 square metres gross floorspace for town centre uses permitted outside of centres that meet the requirements of Policy CEN6
N/A 100% All proposals for
Town Centre Uses under 200 sqm met the policy requirements
All proposals for
Town Centre Uses under 200 sqm met the policy requirements
LOI CEN7 - Number and floorspace of new developments for town centre uses permitted outside of strategic, town, district or local centres that do not accord with Policy CEN7 requirements.
N/A 100% Since 2004/5,
90% of completions have been out of centre, although policy requirements have been met
56% of permitted
developments were out of centre, although all proposals met the policy requirements
L13 Percentage of vacant units in Wolverhampton City Centre
16.1% (2010)
% of City Centre shop unit vacancies to be at or below the national average (2014 - 12.2%)
At1st April 2013
there was a vacancy rate of 21.4% in the City Centre.
There has been a
decrease in the vacancy rate this year to 21.1%.
Positive
Result
Neutral
Result
Negative
Result
? No Data C Core Indicator L Local Indicator

48
3.5 TRANSPORT
SPATIAL OBJECTIVES 7. A first-class transport network providing rapid, convenient and sustainable links between the Strategic Centres, existing and new communities, and employment sites. To include an enhanced, integrated public transport system, an improved highway network, including walking and cycling routes with strong links to the green infrastructure network. Improvements to the national M5 and M6 motorways network and freight railway network will help deliver better connectivity to Regional and National networks. 8. A sustainable network of community services, particularly high quality lifelong learning, health care and sport and recreation facilities, which are easily accessible to all residents at a neighbourhood level, resulting in an increase in levels of qualifications, skills, health and well-being, a decrease in deprivation indicators and improved perception of residential neighbourhoods across the Black Country. Graduates will be retained and attracted to the Black Country as a key element of the knowledge economy. This will be supported by continued enhancement of the Higher and Further Education sector and improved linkages with the wider economy. Key Development Plan Policies: Core Strategy policies TRAN1-5, Saved UDP policies AM4, AM5, AM8, AM12, AM15, AM16
LOI TRAN1 - % of DPDs identifying and safeguarding land to meet transport requirements
No DPD’s have been adopted by the Council this monitoring year; however work has progressed on the preparation of Area Action Plans covering key regeneration areas in the City which are being supported by Transport Studies.
LOI TRAN2 – Appropriate provision or contribution towards transport works and Travel Plan measures by all relevant permissions based on best practice
L26 – Proportion of Wolverhampton Employees working for companies with a travel plan
All relevant planning applications are supported by the appropriate transportation evidence, and mitigation in the form of highways works or financial contributions are secured where appropriate. In the monitoring period, the following locations have benefitted from transport improvements delivered directly by the development8:
All Saints (Phase 2) S38/278
Codsall Road Claregate S278
Bushbury Lane (KFC) S278
Cannock Road (former Waggon and Horses Public House) S278
Ettingshall Road (Phase 2) S38
Goodyear (former Promise House) S38
Goodyear Residential (Phase 2)
8 Delivered through section 38 and section 278 of the Highways Act 1980.

49
There have been no additional transportation works secured through section 106 contributions from developers within the monitoring period. In March 2014, over 44% of employees in Wolverhampton worked for companies participating in Travel Plans or who were members of Company Travelwise.
LOI TRAN3a – The safeguarding of key existing and disused railway lines identified on the Transport Key Diagram
LOI TRAN 3b – Protection of sites with existing or potential rail access identified in TRAN3
All existing railway lines have been safeguarded. There are no disused railway lines in Wolverhampton identified on the Transport Key Diagram for safeguarding. The existing Corus Rail Freight terminal in Wolverhampton is currently operational. There are no new planning applications or extant permissions relating to the redevelopment of this site which might result in its loss.
LOI TRAN4a – Increase in cycle use of monitored routes
LOI TRAN4b – Implementation of Proposed Local Cycle Network identified in the cycle network map
There are two cycle routes continuously monitored within Wolverhampton, Tettenhall Road and Newhampton Road as part of National Cycle Route 81 (NCR81). Table 25 shows the recorded usage of these sites: Table 25: Recorded usage of cycle routes
Tett Rd (2 Way) Nhton Rd (2 Way) Total
09/10 Baseline 37,019 14,586 51,605
Mar 2010 – Feb 2011 53,828 (38,219) 16,469 70,297 (54,688)
Mar 2011 – Feb 2012 37,229 18,314 55,543
Mar 2012 – Feb 2013 52,263 21,982 74,245
Mar 2013 – Feb 2014 39,939* 21,291 61,230*
In the period March 2013 to Feb 2014 the available figures are showing a total reduction compared to the previous year of 13,015 cyclists using the monitored routes. Discerning a trend in usage based on this data is difficult given the substantial fluctuations year on year. However the totals in all cases have shown consistent increases over the 09/10 baseline, and indicate an increase of approximately 20% in cycle route usage over the four years since. (* denotes missing data where a counter in one direction was out of action for 17 days. It is estimated this may have failed to record around 1,000 additional activations). In April 2013 an additional cycle monitoring site was added at Horseley Fields on the canal network. This has provided a cyclist usage of 14,834 for the period 1st April 2013 – 31st March 2014. Table 26 below shows the delivery of the proposed cycle network since 2009/10.

50
Table 26: Delivery of Proposed Cycle Network since 2009/10
Area Length Implemented (km)
2009/10 2010/11 2011/12 2012/13 2013/14
Wolverhampton 1.82 1.72 2.69 0.16 1.99
Target 12.25 12.25 12.25 12.25 12.25
The target for this indicator is to implement 208km of cycle network by 2026 in the Black Country, which equates to the need to deliver 12.25km per year. Wolverhampton implemented 1.99km during this monitoring year, so delivery is broadly off track for the Wolverhampton area.
LOI TRAN5a – Number of publically available long stay parking places in strategic centres
LOI TRAN5b – All new publically owned long stay parking spaces in Strategic Centres to be located in peripheral locations
Table 27: Publically owned long stay parking spaces in strategic centres
Year Total amount of publicly available Long Stay Car parking spaces
2009/10 Baseline 1740
2010/11 1700
2011/12 1638
2012/13 1638
2013/14 1632
The total amount of available Long Stay car parking spaces in the City Centre has slightly reduced. This is mainly due to there being no new developments in the monitoring period which have affected the Short or Long Stay provision. There have also been no new Long Stay parking spaces in the City Centre. The amount of publicly available parking spaces in Wolverhampton has remained relatively unchanged, and any further changes will need to be monitored to ensure that it does not have a negative impact in sustainability terms (e.g. other UDP policies aimed at reducing the reliance on cars) on the way people travel to the City Centre. Future development impacts upon car parking availability and issues for car parking will be addressed in the City Centre AAP.
L22 Percentage of developments meeting car park standards
L32 Amount of completed non-residential development complying with car parking standards
Although overall aims in Wolverhampton are to reduce car dependency, parking provision plays an important role in enabling enough capacity to meet demand and to ensure Wolverhampton City Centre remains a competitive centre, yet not prejudicing the use of more sustainable modes of transport. Policy AM12 allows for flexibility for parking standards in certain applications which results in all applications meeting agreed parking standards. 100% of non-residential applications that were approved in the monitoring period complied with UDP policy AM12 car parking standards.

51
Chart 5 - Transport Indicator Summary Indicator Baseline Target Progress made up
to 2012/13 Performance 2013/14
LOI TRAN1 - % of DPDs identifying and safeguarding land to meet transport requirements
N/A 100% of DPDs No DPD’s have been adopted
No DPD’s have been adopted this year, although work on the emerging AAP’s has been supported by Transport Studies.
LOI TRAN2 - Appropriate provision / contribution towards transport works and Travel Plans measures by all relevant permissions.
N/A 100% of relevant planning applications
N/A All applications were
supported by appropriate transport evidence and mitigation. This has included on site and off site works.
L26 Proportion of Wolverhampton Employees working for companies with a Travel Plan.
31.5% (2010/11)
30% of all employees to work in organisations with a Travel Plans by 2011
Over 30% Over 30% of
employees continue to work for organisations with a Travel Plan or who are members of Company Travelwise. There has been increased engagement with organisations signed up to the Local Sustainable Transport Fund (LSTF).
LOI TRAN3a - Safeguarding of key existing / disused railway lines identified on the Transport Key Diagram
N/A No loss of safeguarded lines
Lines are
safeguarded
There have been no
development proposals this year which have led to the loss of existing railway lines.
LOI TRAN3b - Protection of sites with existing / potential rail access identified in TRAN3
1 Site in Wlv with rail access
No loss of protected sites
Site remains
in operation Site remains in
operation and protected from development.
LOI TRAN4a - Increase in cycle use of monitored routes
51,605 (2009/10)
1% increase in cycling (Black Country)
There has
been an increase in cycling
There has not been a further increase in cycling this year based upon permanent site counts.
LOI TRAN4b - Implementation of Proposed Local Cycle Network identified in the Cycle Network Diagram
N/A Implement 208km of cycle network in the Black Country
The delivery of
the proposed cycle network in Wolverhampton is still not on target.
Wolverhampton implemented 1.99km during this monitoring year, so delivery is broadly off track for the Wolverhampton area.
LOI TRAN5a - Number of publically available long stay parking places in strategic centres
1,740 (2009/10)
Decrease the number of long stay spaces by the year 2026
The number of
long stay spaces in the City Centre had reduced to 1,638
The number of long stay
spaces had reduced to 1632.
LOI TRAN5b - All new publically owned long stay parking spaces in Strategic Centres to be located in peripheral locations
N/A 100% No car park developments
There have been no car park developments this year.
L22 Percentage of developments meeting car park standards
N/A 100% 100% All developments have
met the car park standards
L32 Amount of completed non-residential development complying with car parking standards

52
3.6 ENVIRONMENTAL INFRASTRUCTURE SPATIAL OBJECTIVES 6. A high quality environment fit for the future, and a strong Urban Park focussed on
beacons, corridors and communities; respecting, protecting and enhancing the unique biodiversity and geodiversity of the Black Country and making the most of its assets whilst valuing its local character and industrial legacy.
8. A sustainable network of community services, particularly high quality lifelong learning, health care and sport and recreation facilities, which are easily accessible to all residents at a neighbourhood level, resulting in an increase in levels of qualifications, skills, health and well-being, a decrease in deprivation indicators and improved perception of residential neighbourhoods across the Black Country. Graduates will be retained and attracted to the Black Country as a key element of the knowledge economy. This will be supported by continued enhancement of the Higher and Further Education sector and improved linkages with the wider economy.
Key Development Plan Policies:
Core Strategy Policy Saved UDP Policies Biodiversity ENV1 N1, N4, N6, N7, N8, N9 Open Space, Sport and Recreation
ENV6 R3 – 10
Renewable Energy ENV7 None Flood Protection and Protection of Natural Water
ENV5 EP6
Design ENV3 Design Chapter Historic Environment ENV2 Historic Environment Chapter Air Quality ENV8 EP1
Biodiversity
COI ENV1 - Change in areas of biodiversity importance
L27 Change in priority habitats and species by type
A relatively small proportion of Wolverhampton is designated as a SINC or SLINC (collectively known as Local Sites) compared with other West Midlands local authorities, and these sites are subject to constant development pressure. A full list of the Local Sites in Wolverhampton is provided in the UDP (June 2006) and shown on the Development Plan Policies Map (formerly known as the Proposals Map). No formal changes to these records have taken place since the adoption of the UDP, with around 50% of the sites surveyed in 2000/01. However it is clear from planning applications determined since 2006 that some of the Local Site boundaries need updating to reflect physical changes. Boundaries also need to be reviewed to address errors, to reflect physical features and to provide defensible boundaries. Around 50% of the sites have had surveys commissioned on them over the last few years and some surveys have been completed. These will be reported in future AMRs once formal changes to the designations have taken place.

53
Change in Areas of Biodiversity Importance A number of planning applications have been submitted this year that have the potential to impact on nature conservation designations (either being within or adjacent to the sites). Tables are provided below that highlight the number, type and decision on planning applications which have the potential to affect SINC’s, SLINC’s and Ancient Woodland sites/areas. SINC’s Table 28: Planning Applications in SINCs
Type of Application Granted Refused Total
Householder 0 0 0
Residential 0 1 1
Commercial 1 0 1
Mixed Use 0 0 0
Education 0 0 0
Change of Use 2 0 2
Conservation Area / Listed Building 0 0 0
Other 0 0 0
Total 3 1 4 (Source: Wolverhampton City Council Monitoring)
Of those that were approved, the majority related to development which did not directly impact on the SINC, or impact could be mitigated without any loss of the site or features of value. All impacts this year are minor, with no consequential changes needed to the boundaries of SINCs as a result of development. SLINC’s Table 29: Planning Applications in SLINCs
Type of Application Granted Refused Total
Householder 0 0 0
Residential 0 0 3
Commercial 0 0 0
Other 2 0 2
Total 2 0 2 (Source: Wolverhampton City Council Monitoring)
One application granted permission this year will lead to a reduction of designated SLINC when the development is implemented. This is a proposed gypsy & traveller site located to the north of Showell Road on a site that was a former reservoir (13/00068/FUL). The site will consist of 14 pitches on a site of 1.8ha in size. Mitigation measures are in place to enhance and improve the environmental landscape to attract wildlife to the site.

54
Ancient Woodland Table 30: Planning Applications in Ancient Woodland
Type of Application Granted Refused Total
Householder 4 0 4
Residential 0 2 2
Commercial 0 0 0
Conservation Area / Listed Building 1 0 1
Other 0 0 0
Total 5 2 7 (Source: Wolverhampton City Council Monitoring)
There were 7 applications that were in areas of Ancient Woodland this monitoring year. Most of the applications related to development that did not directly affect the woodland area/trees. Of the ones that did, decisions were made in accordance with saved UDP policies N7 and N8 with applications being conditioned to minimise / compensate for the impact on trees from the proposed development. Two applications were received for residential development; these applications were both refused permission with one being dismissed at appeal (13/00624/FUL and 13/00675/FUL). Monitoring of Planning Permissions Affecting Designated Sites Table 31 summarises the current position of planning permissions which will lead to the alteration of the formal record of Local Sites. Table 31: Planning Permissions Affecting Local Sites
Year Repo rted
Development Name
Local Site Ref
Loss of Designation
Mitigation Proposed Has it been physically lost?
Mitigation Implemented
2007
/8
Goodyears (Residential led mixed use)
Loss of 1.1ha Yes – Replacement SLINC (1.1ha) within neighbourhood park, subject to detailed management proposals.
Yes No – Revised scheme for Neighbourhood Park expected.
Ward Street (Residential led mixed use)
Potential to loose part of SLINC. To be confirmed at Reserved Matters stage.
Yes - submission of a scheme to mitigate the impact of the works (amount to be provided presently unknown).
No No – revised planning application submitted in 2012
Citadel Junction (Employment)
Loss of 1.2ha Yes – new area of SLINC provided adjacent to existing site (1.4ha).
Yes Yes – site survey results due to see if SLINC standard achieved.
2010
/11
North of Neachells Public House (Residential)
Proposed to lose 0.3ha.
Yes – improve 0.6ha of neighbouring SLINC site in line with mitigation scheme.
No No
Great Bridge Road (Residential)
Proposed to lose 0.7ha.
Yes – improvement of approximately 1.7ha of neighbouring SLINC site in line with mitigation scheme.
Yes Development currently on site
Humphries Proposed to lose No No N/A

55
Crescent (Residential)
0.02ha.
2012
/13
Land To The Rear Of 38 To 60, Humphries Crescent
Application 12/00589/FUL granted 01/08/2012. Proposed to lose 0.0156ha of SLINC.
No No N/A
Former Goodyear Tyre Factory, Stafford Road
Application 12/00646/REM granted 04/10/2012. Proposed to lose 1.6ha of SLINC.
No Yes N/A
Muchall Grove
Application 12/00237/FUL granted 04/05/2012. Proposed to lose 0.07ha of SLINC.
No No N/A
Penn Hall Special School, Vicarage Road
Application 12/00421/FUL granted 19/07/2012. Proposed to lose 0.0172ha of SINC.
Yes - landscape proposals will accommodate and enhance the SINC.
No Yes
2013
/14
Fishing Pool, Showell Road
Application 13/00068/FUL granted 10/04/2013. Proposed to lose 1.8ha of SLINC.
Yes - Habitat and Landscape Plan in place and conditions on planning decision notice.
Yes No, development not started.
Other Issues Affecting Local Sites The Councils 2012/13 return on Single Data List Indicator No 160-00 (formerly National Indicator 197) on the proportion of Local Sites where positive conservation management has been or is being implemented was 20%. Not all sites are Council managed and this score also reflects on privately owned Local Sites in Wolverhampton. There has been no change to performance on this indicator this year. The Councils target is for 40% of Local Sites to be in positive management by 20269. No additional habitat data is available this year from EcoRecord (the Local Records Centre). As part of the development of the Core Strategy’s Environmental Infrastructure Guidance, a habitat mapping exercise was undertaken (based on near infrared aerial imagery) to provide an inventory of habitats across the Black Country. The intention is to make use of this data in the AMR and planning decisions in future years.
9 From the Wolverhampton Environment Plan update September 2010.

56
L7 Hectares of Local Nature Reservation per 1000 population
The UDP identifies a baseline figure of 0.2 hectares of LNR per 1000 population, with a target to increase this figure to 0.5 hectares by 2011. However Smestow Valley remains the City’s only LNR, with no progress made this monitoring year. Open Space, Sport and Recreation
L30 Amount of eligible open spaces managed to green flag award standard
Four open spaces lost their Green Flag Standard during 2012/13 due to budget cuts: West Park and Bantock Park (first awarded 2007/8, awarded Green Heritage status during 2011/12), St Peter’s Gardens in the City Centre (first awarded 2008/9) and Phoenix Park (first awarded 2009/10). The target of at least 5 Green Flag sites in the City by 2011 has not been met, and there are no current plans to apply for Green Flag standards due to lack of funding.
LOI ENV6a - Ha's accessible open space per 1,000 population
The NPPF requires Local Authorities to set robust local standards for open space, sports and recreational facilities in their areas, based on assessments of need and audits of existing facilities. An Open Space Audit and Needs Assessment (OSANA) incorporating quantity, quality and access standards for different types of open space, was published by the Council in 2008. An update of this has been produced in 2013, incorporating revisions to quantity, quality and access standards, and an Open Space Strategy and Action Plan was adopted in 2014. An up-to-date Playing Pitch Study and Sports Development and Investment Strategy were produced during 2012. The Open Space SPD was also revised and adopted during 2014 to take account of these studies. The BCCS target is to increase provision of accessible open space from the 2007 level of 4.63 ha per 1,000 residents to the OSANA standard of 4.74 ha per 1,000 residents by 2016. There has been no change to this indicator this year.
L14 Number of Neighbourhood Park Areas meeting current recreational open space standard (ha’s per 1000 residents).
L15 Number of Neighbourhood Parks
Open space is unevenly distributed between Neighbourhood Park Areas (NPA’s) and varies in terms of quality, accessibility and function from area to area. For this reason the UDP designated Priority Neighbourhood Park Areas which fall below the recreational open space (ROS) standard or have no Neighbourhood Park. Currently 22 of the 38 NPA’s meet or exceed the ROS standard. The target set out in the UDP is to maintain this figure and increase it by 2011. There are currently three parts of the City which have no open space of sufficient quality and size to designate as a Neighbourhood Park. The target set out in the UDP is to ensure that each of these NPA’s have a Neighbourhood Park quality open space by 2011. There has been no change to this indicator this year, although work has progressed to help address this requirement. The developments now underway at the former Goodyear site (off Stafford Road), the Ward Street Masterplan site (Ettingshall),

57
and the development planned for Bilston Urban Village, will help meet some of this deficiency.
LOI ENV6b - Delivery through LDD's of broad open space, sport and recreation proposals for each Regeneration Corridor and Strategic Centre set out in Appendix 2
Stafford Road Corridor and Bilston Corridor AAPs and Heathfield Park and Tettenhall Neighbourhood Plans were adopted during 2014, and the City Centre AAP has reached draft Plan stage. These plans provide detailed proposals taking forward the broad open space, sport and recreation proposals within the Core Strategy. The proposals within AAP areas will be monitored through the Delivery Plans for each AAP. Renewable Energy
COI ENV7 - Renewable Energy Generation
LOI ENV7 - Proportion of eligible developments delivering measures sufficient to off-set at least 10% of estimated residual energy demand
No applications were approved during 2013/14 which included renewable energy generation elements. However, the Council is in the process of installing 627 kw of solar PV panels at 14 Council sites across the City during 2014/15. During 2013/14, 13 planning permissions were granted for ENV7 eligible developments. Of these, 10 (Storage building behind Keyline Builders, Neachells Lane; Rebuild of Carvers, Littles Lane; Housing at Fmr Linthouse Inn, Linthouse Lane; Rebuild of Deansfield Community School; Rebuild of Heath Park High School; Business School at Wolverhampton University; Car Showroom at Junction M54 and Stafford Road; Industrial building at Middleton Food, Willenhall Road; Workshop/ offices at Wednesfield Way / Well Lane; Housing at Fmr Warstones Inn, Warstones Road) were conditioned to provide 10% renewable / low carbon energy. One development (Youth Zone at School Street, City Centre) was allowed flexibility to reduce energy consumption by 10% in lieu of the renewable energy requirement, due to viability issues. One development (251 Parkfield Road) had no requirement due to viability reasons. One development (Block 10 Offices, City Centre) is being constructed to BREEAM Excellent standard and was therefore considered exempt from the requirement. These exceptions are allowed for in the Policy, and a new Renewable and Low Carbon Energy SPD adopted by the Council in September 2012 to assist implementation of the Policy. Therefore the target of 100% achievement for eligible developments has been reached during 2013/14. Of the 29 remaining eligible developments which were conditioned in 2011/14, 3 were completed in 2013/14 – Fmr Dan O’Connell PH, Hurstbourne Crescent (11kwp / 80 sqm solar PV panels); Land at Purcel Road (reduction of energy consumption accepted in lieu of renewable energy requirement); Land rear of 34-47 Barnfield Road (). Progress regarding discharge of conditions and completions of these developments, including details of the type and kwh of energy generation, will be monitored in future

58
AMR’s. This will provide the renewable energy generation capacity created which will contribute towards COI ENV7. Flood Protection and Protection of Natural Water
E1 Number of planning permissions granted contrary to Environment Agency advice on flooding and water quality grounds
The Environment Agency (EA) recorded 3 objections to planning applications submitted this year. Of these, 2 have been granted with the remainder relating to a planning application yet to be determined (to be reported on in future AMR’s). In addition, one planning application objected to by the EA in last year’s monitoring has been granted planning permission this year. Objections mainly related to lack of/unsatisfactory Flood Risk Assessment, mainly relating to surface water issues. In all cases, these issues were consequently addressed by the applicants and the objections withdrawn, or conditioned as part of the granting of permission. For one planning application, the EA objected as it considered the proposed surface water flow rates would not be reduced to Greenfield rates, in accordance with BCCS policy ENV5 (12/00385/FUL). However, the proposed site is not within a designated flood risk area and the drainage strategy submitted by the applicant would significantly improve the drainage of the site. It was considered that further improvements would be prohibitively expensive. The application was therefore granted permission with conditions to ensure the development is satisfactorily drained. One objection to a planning application on water quality grounds was recorded this year (13/01201/FUL). The EA objected to a non-mains drainage proposed in a sewered area. An amended scheme which took account of EA comments was submitted and approved by Severn Trent Water. This involved connecting to the main sewer and addressed the concerns relating to previous uses of the site and the impact on controlled waters. A condition was added to the Decision Notice relating to Sustainable Drainage. This information indicates that the national and local policies that seek to prevent inappropriate development from taking place in the flood risk areas and to ensure water quality is protected are being implemented appropriately.
LOI ENV5 – Proportion of major planning permissions including appropriate SUDS
All relevant planning applications complied with policy ENV5 to incorporate appropriate Sustainable Urban Drainage Systems (SUDS). None of these schemes were completed in the monitoring year. Design
LOI ENV3a – Proportion of major planning permissions adequately addressing By Design and Manual for Streets as appropriate
The major planning applications determined during the monitoring year have been assessed to check that design considerations have been factored into decisions. Of the

59
42 major applications granted planning permission this year, all addressed By Design, Manual for Streets, or other relevant design considerations. Two major applications were refused planning permission; application 13/00588OUT was refused on design grounds due to the car parking provision being insufficient to meet the level of parking demand likely to be generated by the development. This consequently shows that the policy is ensuring high quality schemes are developed in Wolverhampton.
COI ENV3 - Housing Quality Building for Life assessment (H5)
The Building for Life criteria10 is a Government endorsed assessment benchmark developed by CABE (the Commission for Architecture and the Built Environment), Design for Homes and the Home Builders Federation. Before 2012, each housing development was awarded a score out of 20, based on the proportion of Building for Life questions that are answered positively, to show the level of quality in completed new housing development. The indicator used in previous AMRs related to the number and proportion of total new build completions on housing sites reaching very good, good, average and poor ratings against the Building for Life criteria. Only new build housing sites of 10 or more homes were assessed, including phases of large developments. During 2012 new guidance was issued on how to carry out Building for Life assessments. There are now 12 criteria and the assessment is based on a traffic light system. A well designed scheme will perform well against all 12 criteria. ‘Red’ criteria will identify aspects of the proposal which need to be changed. ‘Amber’ will mean either that the characteristics of the scheme make full compliance with the criteria impossible or that further consideration is needed to improve the design. ‘Green’ means that the criteria have been fully met. The assessment process is now carried out on sites at pre-application / planning application stage, rather than on completion. There were 3 relevant new build housing sites granted permission during 2013-14, and the scores for each of these sites are provided in table 32. Table 32: New build housing sites granted detailed permission during 2013-14
Site Green Amber Red
Linthouse Lane, Wednesfield 9 3 0
251 Parkfield Road 5 6 1
Warstones Inn, 145 Warstones Road 7 3 2
% of total homes (out of 92) 58% 33% 9%
Target >50% <50% 0% (Source: Wolverhampton City Council)
As the assessment process changed significantly in 2011/12, a new target was set: to achieve no reds and majority greens on sites granted planning permission in future years. The proportion of greens has decreased slightly since 2012/13 and two of the three sites granted permission had red criteria.
10
Details of the Building for Life assessment criteria can be found at www.designcouncil.org.uk/our-work/cabe/sectors/housing/building-for-life/

60
LOI ENV3b – Proportion of major planning permissions meeting at least Code for Sustainable homes Level 3 or BREEAM very good standard
As the policy requires developments to meet the national standards, all developments will have achieved this.
L1 No of new developments recognised for design quality and excellence
The Wolverhampton Environmental Awards give recognition and reward to outstanding projects that have made a positive contribution to the City and improved the quality of life for residents and those who work and visit Wolverhampton. The awards are bi-annual and were not made in 2013/14, therefore there is no target to meet for this year.
L2 Percentage of planning permissions granted contrary to Police advice on crime considerations
Monitoring information for this indicator is no longer recorded. Historic Environment
LOI ENV2 – Proportion of planning permissions granted in accordance with Conservation/Historic Environment Section or Advisor recommendations
A sample of 10% of major planning applications has been checked to establish the influence of policy ENV2 over decisions on planning applications. Of the 10%, the Historic Environment Section had no objections to the proposed developments, showing that policy ENV2 is ensuring character and distinctiveness if being considered by development.
LOI ENV4a – Proportion of planning permissions granted in accordance with Conservation Section’s recommendation
LOI ENV4b – Proportion of planning permissions granted in accordance with British Waterways planning related advice
British Waterways is now known as the Canals and Rivers Trust (CRT). During this monitoring year, the CRT was consulted on 10 planning applications. Of these, one application was refused and another is still pending a decision (this pending application will be reported on in next year’s AMR). The other 8 applications were granted planning permission having no objections from CRT. Application 13/01225/FUL was granted permission with a condition for landscape treatment to the site. There was one application pending a decision from last year’s AMR (2012/13). This application has now been granted planning permission (12/00385/FUL) with a requirement for canalside enhancement if the scheme is found viable.
L20 Percentage of Conservation Areas with up to date Appraisals and Management Proposals
Local Authorities are strongly encouraged to publish up to date character area appraisals for Conservation Areas. There are a total of 31 Conservation Areas in Wolverhampton. A phased programme of appraisals was initiated in 2007.

61
In this monitoring year three new Conservation Area Appraisal and Management Proposals were published. These appraisals are as follows:-
Wolverhampton Locks – published 22nd May 2013
Bilston Town Centre – published 20th September 2013
Bilston Corridor Canals – published 23rd October 2013 During the monitoring year one new conservation area was being appraised for designation. This was the Bilston Corridor Canals Conservation Area and was designated in October 2013 (this has been included in the total above). Whilst progress has been made, the Council has missed its target to have all Conservation Areas appraised by 2014.
L38 Number / Percentage of Listed Buildings and Ancient Monuments at risk of neglect or decay
L39 Number / Percentage of Listed Buildings Demolished
These indicators help monitor the implementation of Core Strategy and saved UDP policies on the historic environment. The figures are shown in table 33. Table 33 – Listed Buildings/Scheduled Monument at Risk/Neglected or Demolished
Number of records
Number / Percentage at Risk of Neglect / Decay*
Number / Percentage Demolished
Listed Buildings / Ancient Monuments
28* 3 (10.7%) 1 (3.6%)
*Only includes Grade I and Grade II* Buildings / Sites / Scheduled Monuments and collected on a calendar year basis
English Heritage monitors listed buildings and scheduled monuments at risk of neglect or decay. In 2013/14, three buildings were included on the ‘At Risk’ register. These included The Greyhound and Punchbowl Inn, Church of St Leonard, and the Church of St Luke. The Greyhound and Punchbowl Inn is a grade II* listed building. Its condition is classed as poor, as it suffers from complex structural problems. A detailed structural survey is required to investigate and establish the most appropriate method of repair. The Church of St Leonard is a Listed Place of Worship grade II. Its condition is classed as poor with leaking parapet gutters affecting the render externally and the plaster internally. During this monitoring year there has been a new entry on the ‘At Risk’ register. This is the Church of St Luke, Upper Villiers Street. This Gothic Revival church was built in 1860 and its decorated spire is a local landmark in the Blakenhall area. There are many issues with this very large church. Dry rot was addressed some years ago, but many other issues remain. The Graiseley Old Hall (grade II* listed building) has been removed from the risk register this year. One listed building was demolished during the monitoring year. This was Newhall Buildings in Wednesfield and consent was granted on 14th October 2013.

62
Air Quality
L4 achieve a net reduction of Nitrogen Dioxide (NO2) in those areas where the annual average NO2 values are predicted to exceed 40μgm3 between 2008 (baseline) and 2015
The Council routinely monitors11 the concentration of nitrogen dioxide (NO2), sulphur dioxide (SO2) and fine particles (PM10) across the City to determine the quality of the air and assess compliance with the Governments Air Quality Strategy. There are several areas in Wolverhampton where air quality has been shown to be exceeding Government standards in terms of NO2 and PM10, although recent monitoring data has shown that the levels of PM10 are now below the Government standards for this pollutant. Wolverhampton is an Air Quality Management Area for both these pollutants. As a result, monitoring was set up in designated ‘hot spots’ as well as the creation of an Air Quality Action Plan to enable Wolverhampton to analyse the progression towards these standards. The previous LTP2 indicator has now been replaced by LTP3 which contains a new performance aim to achieve a net reduction of Nitrogen Dioxide (NO2) in those areas where the annual average NO2 values are predicted to exceed 40μgm3 between 2008 (baseline) and 2015 (this has replaced former indicator L4 in the AMR). Compared with the base year of 2008 there has been a reduction in NO2 levels of 21% in 2013 as an average across the City. This is an increased reduction in NO2 concentration than previously reported in last year’s AMR. The drop in NO2 concentration last year was largely due to favourable weather conditions which aided the dispersion of pollutants. Exhaust emissions from buses remain a major source of NO2 in the city centre. Overall in 2010 at the sites within the ring road there has been a significant reduction in NO2
levels which coincided with the start of Phase 1 of the Interchange project. The new Bus Station which has been built as part of this project (opened in summer 2011) has led to a reduced number of buses within the ring road, resulting in improvements in air quality along Lichfield Street, Princess Square, Princess Street, Queen Street and Pipers Row. There were no recorded exceedences of SO2 or PM10 objectives during 2013/14.
LOI ENV8 - Proportion of planning permissions granted in accordance with Air Quality / Environmental Protection Sections recommendations
During the monitoring year 2013/14 the Air Quality team recommended refusal for three planning applications. Of these, one application was refused permission (13/00608/FUL) and one application was withdrawn (13/00555/FUL). Planning application (13/00984/FUL) is still pending a decision, but the Air Quality / Environmental Protection Services Section has provided advise on the issues of incompatible uses as there are residential premises close by. We will report on the decision of this application in next year’s AMR.
11
Air quality data is collected on a calendar year basis.

63
Chart 6 – Environment Indicator Summary
Indicator Baseline Target Progress made up to 2012/13
Performance 2013/14
COI ENV1 Change in areas of biodiversity importance
SINC = 148ha (2006) SLINC = 129.3ha (2006)
No net reduction in area of designated nature conservation sites through development
Proposals
affecting sites have complied with policy, although this will lead to a reduction in the amount of designated sites.
One proposal this year that
has been granted permission will lead to a reduction in the amount of designated SLINC. However, mitigation plans have been put in place.
L27 Change in priority habitats and species by type
Unknown N/A ? No definitive
record of changes to habitats and species is available.
? No new data is available this
year. The Council continues to work in partnership with the Birmingham and Black Country Wildlife Trust and EcoRecord to continue to collect and monitor data.
L7 Hectares of Local Nature Reservation per 1000 population
0.2ha (2006)
0.5ha per 1000 population by 2011
Target not met No new LNRs have been
designated. The target for 2011 has not been met.
L30 Amount of eligible open spaces managed to green flag award standard
0 (2006/7)
Increase by one site each year and then retain at least 5 sites by 2011
Four parks
lost their Green Flag award in 2012/13.
No sites now have Green
Flag awards due to budget cuts.
LOI ENV6a - Ha's accessible open space per 1,000 population
4.63ha per 1,000 residents (2007)
4.74ha per 1,000 residents
No change to
the amount of open space in the area this year
No change to the amount of
open space in the area this year
L14 Number of Neighbourhood Park Areas meeting current recreational open space standard (ha’s per 1000 residents).
22 (2006/7)
Increase year on year
No changes to
this figure. No changes to this figure.
L15 Number of Neighbourhood parks
35 (2006/7)
Increase year on year
No changes to
this figure. No changes to this figure,
although developments are underway which will provide new Parks.
L16 Hectares of accessible playing fields and outdoor playing space per 1000 residents
0.6ha (2006/7)
Increase year on year to 0.8ha
No changes to
this figure.
There has been no change
to the baseline position since 2006/7.
COI ENV7 - Renewable Energy Generation
Unknown To be developed through future monitoring
? No data currently
available, although monitoring will improve as schemes involving renewable energy are delivered.
? No data currently available,
although monitoring will improve as schemes involving renewable energy are delivered.
LOI ENV7 - Proportion of eligible developments delivering measures sufficient to off-set at least 10% of estimated residual energy demand
N/A 100% 3
developments (100% of those eligible) were conditioned to provide at least 10% renewable energy as a result of policy ENV7.
10 developments (77% of
those eligible) were conditioned to provide at least 10% renewable energy, 2 developments to provide additional energy efficiency measures and 1 exempted on viability grounds.

64
E1 Number of planning permissions granted contrary to EA advice on flooding and water quality grounds
N/A 0 Target has been met year on year
Policy ENV5 is ensuring
flooding is considered and influencing the design of new development.
LOI ENV5 - Proportion of major planning permissions including appropriate SUDs
N/A 100 % All relevant
developments complied with policy ENV5, although none of these schemes have yet been completed.
All relevant developments
complied with policy ENV5, although none of these schemes have yet been completed.
LOI ENV3a - Proportion of major planning permissions adequately addressing By Design and Manual for Streets as appropriate
N/A 100% Based on the
sample, development in Wolverhampton is following relevant design guidelines.
Development in
Wolverhampton is following relevant design guidelines.
COI ENV3 Housing Quality – Building for Life Assessment (H5)
2011 Move towards no Reds and majority Greens by 2026
Six out of
fourteen sites scored one Red, but 66% of criteria were scored Green overall.
Two out of three sites had
Red criteria, but 58% of criteria were scored Green overall.
LOI ENV3b - Proportion of major planning permissions meeting at least Code for Sustainable homes Level 3 or BREEAM very good standard
N/A 100% All
developments have to meet national standards so all schemes have met the policy requirements.
All developments have to
meet national standards so all schemes have met the policy requirements.
L1 No of new developments recognised for design quality and excellence
N/A 4 bi-annually No
developments were recognised this year at the Wolverhampton Environmental Awards
There were no awards this
year.
L2 Percentage of planning permissions granted contrary to Police advice on crime considerations
N/A 0% In 2012/13 0%
of planning applications were granted contrary to Police advice.
Monitoring information for
this indicator is no longer recorded.
LOI ENV2 - Proportion of planning permissions granted in accordance with Historic Environment Section recommendations
N/A 100% In 2012/13 the
10% sample showed planning applications were being granted in accordance with recommendations.
10% sample shows planning
applications are being granted in accordance with recommendations.
LOI ENV4a - Proportion of planning permissions granted in accordance with Conservation Section recommendations
N/A 100% In 2012/13 the
10% sample showed planning applications were being granted in accordance with recommendations.
10% sample shows planning
applications are being granted in accordance with recommendations.

65
LOI ENV4b - Proportion of planning permissions granted in accordance with the Canal and Rivers Trust planning related advice
N/A 100% In 2012/13 all
applications were granted in accordance with recommendations.
In 2014/13 all applications
have been granted in accordance with recommendations.
L20 Percentage of Conservation Areas with up to date Appraisals and Management Proposals
2007 30 by 2012 11 Conservation Areas had up to date appraisals in 2012/13
Three new appraisals have
been completed this year. Whilst others are underway, the target has not been met.
L38 Number / Percentage of Listed Buildings and Scheduled Monuments at risk of neglect or decay
N/A No target 3 / 10.3% buildings / sites / Scheduled Monuments at risk
Three buildings are on the
English Heritage ‘At Risk’ register for 2013/14.
L39 Number / Percentage of Listed Buildings Demolished
N/A 0 No consents granted in 2012/13
One consent was granted
this year.
L4 Achieve a net reduction of Nitrogen Dioxide (NO2) between 2008 and 2015
2008 Net reduction of NO2 by 2015
Reduction in NO2
levels of 10% in 2012/13 as an average across the City
Compared with the base
year of 2008 there has been a reduction in NO2 levels of 21% in 2013/14 as an average across the City.
LOI ENV8 - Proportion of planning permissions granted in accordance with Air Quality / Environmental Protection Sections recommendations
N/A 100% Only one
planning application was granted contrary to Environmental Services advice; however controls and restrictions will be imposed by licensing arrangements for the facility.
No applications have been
granted permission contrary to Environmental Services advice.
Positive
Result
Neutral
Result
Negative
Result
? No Data C Core Indicator L Local Indicator
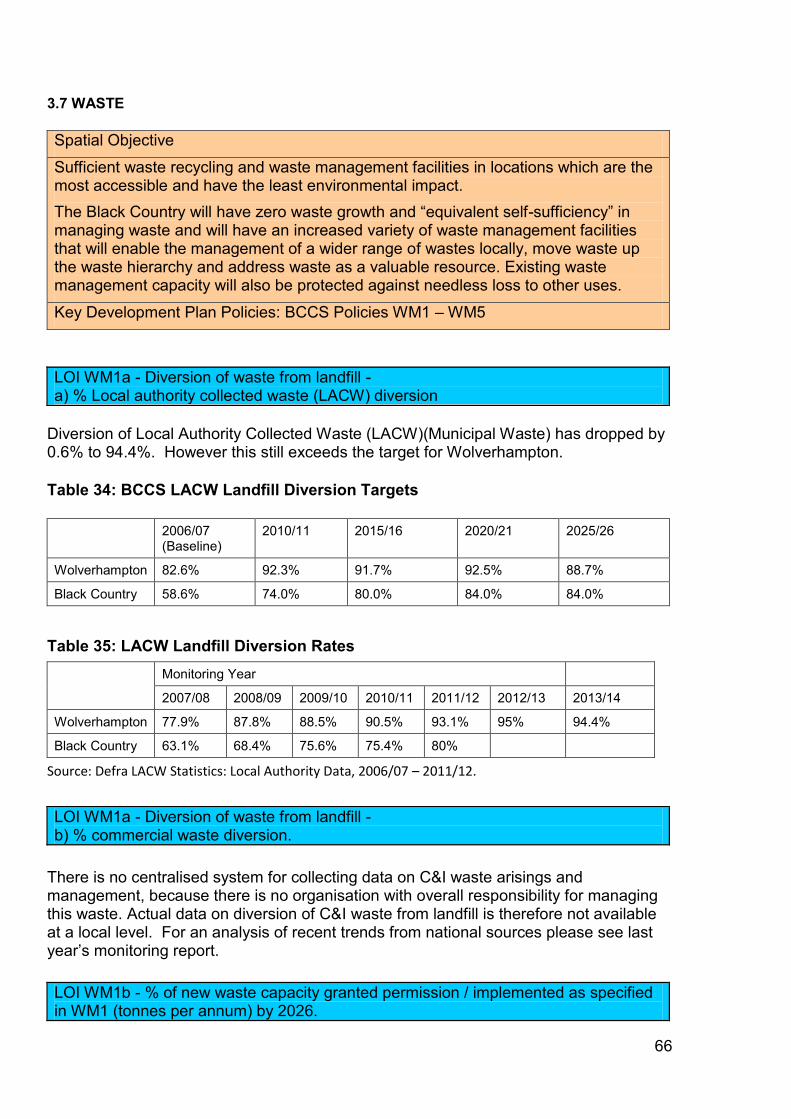
66
3.7 WASTE
Spatial Objective
Sufficient waste recycling and waste management facilities in locations which are the most accessible and have the least environmental impact.
The Black Country will have zero waste growth and “equivalent self-sufficiency” in managing waste and will have an increased variety of waste management facilities that will enable the management of a wider range of wastes locally, move waste up the waste hierarchy and address waste as a valuable resource. Existing waste management capacity will also be protected against needless loss to other uses.
Key Development Plan Policies: BCCS Policies WM1 – WM5
LOI WM1a - Diversion of waste from landfill - a) % Local authority collected waste (LACW) diversion
Diversion of Local Authority Collected Waste (LACW)(Municipal Waste) has dropped by 0.6% to 94.4%. However this still exceeds the target for Wolverhampton.
Table 34: BCCS LACW Landfill Diversion Targets
2006/07 (Baseline)
2010/11 2015/16 2020/21 2025/26
Wolverhampton 82.6% 92.3% 91.7% 92.5% 88.7%
Black Country 58.6% 74.0% 80.0% 84.0% 84.0%
Table 35: LACW Landfill Diversion Rates
Monitoring Year
2007/08 2008/09 2009/10 2010/11 2011/12 2012/13 2013/14
Wolverhampton 77.9% 87.8% 88.5% 90.5% 93.1% 95% 94.4%
Black Country 63.1% 68.4% 75.6% 75.4% 80%
Source: Defra LACW Statistics: Local Authority Data, 2006/07 – 2011/12.
LOI WM1a - Diversion of waste from landfill - b) % commercial waste diversion.
There is no centralised system for collecting data on C&I waste arisings and management, because there is no organisation with overall responsibility for managing this waste. Actual data on diversion of C&I waste from landfill is therefore not available at a local level. For an analysis of recent trends from national sources please see last year’s monitoring report.
LOI WM1b - % of new waste capacity granted permission / implemented as specified in WM1 (tonnes per annum) by 2026.

67
Summary of Waste Management Capacity Changes, 2012/13 – Permitted Sites Reference Address Waste Capacity
(tpa)
13/00068/FUL Fishing Pool, Showell Road Mixed 35,000m3
13/00355/FUL Unit 9 Dunstall Hill Industrial Estate Hazardious Waste - Asbestos 25,000
Planning permission (13/00459/FUL) was granted involving the loss of an existing scrap metal site although the capacity of the existing site was unknown. Source: Black Country Authorities waste management development application monitoring.
LOI WM1c - % of growth in tonnage of waste arising.
There has been a steady decline in the overall amount of LACW arisings since 2006/07 altghough 2013/14 did see an increase to 129,119 tonnes. Only national surveys and estimates are available for Commercial & Industrial Waste, Construction & Demolition and Excavation Waste arisings.
Table 36: LACW Arisings 2002/03 - 2013/14
LACW Hazardous Waste
Wolverhampton Black Country Total Wolverhampton Black Country
2002/03 160,093 606,910
2003/04 156,422 604,541
2004/05 155,800 612,973
2005/06 152,021 592,585
2006/07 146,807 575,445 49,929 191,576
2007/08 142,417 570,032 41,770 171,522
2008/09 136,790 552,641 43,491 221,188
2009/10 134,470 541,935 32,355 160,530
2010/11 129,578 525,711 21,607 135,709
2011/12 126,692 512,815 32,371 145,484
2012/13 124,763
2013/14 129,119
Source: Defra Local Authority Collected Waste Statistics
No new data on commercial waste is available since last year’s monitoring report.
LOI WM2 - % protection of capacity at existing / proposed strategic waste management sites, by waste planning authority
There has been a 70,000 tonnes per annum increase in capacity in Wolverhampton since 2009 but no additional capacity in 2013/14.
LOI WM3a - % and capacity of strategic waste management infrastructure proposals in Table 17 implemented by 2026, by authority.

68
For Wolverhampton, only one infrastructure proposal is identified in the BCCS Table 17. This relates to the SITA Transfer Station at Neachalls Lane in Willenhall. Although the project has not been implemented, this fits with the anticipated timescale of post 2016.
LOI WM3b - % and capacity of new waste management facilities contributing towards the residual requirements in Table 18 implemented by 2026, by waste stream and by authority.
There has been no additional commercial transfer capacity granted permission in 2013/14.
LOI WM4 - % of new waste management facilities proposed/ implemented that meet Policy WM4 locational requirements by waste planning authority.
In 2012/13 all applications met the locational requirements of BCCS Policy WM4 meaning the 100% was achieved. Table 37: Number of new waste management facilities proposed/ implemented that meet Policy WM4 locational requirements (Wolverhampton)
Permissions
Granted - Total
At Existing Waste
Site
BCCS Growth Network
BCCS Freestanding Employment
Area
Other Location
Compliant with Policy WM4 Locational
Guidance
09/10 2 1 1 0 1 2
10/11 7 5 7 0 0 7
11/12 5 3 4 0 1 4
12/13 6 1 6 0 0 6
13/14 2 1 2 0 0 2
Source: Black Country Authorities waste management development application monitoring
LOI WM5 - % of major planning applications granted to include supporting information on waste management to address WM5 requirements.
There is currently no information available for the monitoring of this indicator.

69
Chart 7 – Waste Indicator Summary
Indicator Baseline Target Progress
to 2012/13
Performance 2013/14
LOI WM1a – Diversion of waste from landfill – a) % municipal waste diversion
82.6% 88.7%
by 2026
There was a slight decrease in landfill diversion down 0.6% to 94.4% but this is still better than the target.
LOI WM1a – Diversion of waste from landfill – b) % commercial waste diversion
61% 75% by
2026
?
No new data is available since the 2011/12 monitoring report when the trend was positive.
LOI WM1b - % of new waste capacity granted permission / implemented as specified in WM1 (tonnes per annum) by 2026
BCCS Table 16
100%
There has been an increase in landfill capacity of 35,000m
3.
LOI WM1c - % of growth in tonnage of waste arising
147,000 (LACW)
0% by 2026
Waste arisings increased in 2013/14 although the overall trend is positive
LOI WM2 - % protection of capacity at existing / proposed strategic waste management sites, by waste planning authority
- 100%
by 2026
No new capacity in 2013/14.
LOI WM3a - % and capacity of strategic waste management infrastructure proposals in Table 17 implemented by 2026, by authority.
1 proposed
site
100% by
2026
Only one infrastructure proposal is identified (SITA Transfer Station at Neachalls Lane in Willenhall). Anticipated timescale of post 2016.
LOI WM3b - % and capacity of new waste management facilities contributing towards the residual requirements in Table 18 implemented by 2026, by waste stream and by authority.
BCCS Table 18
100% by
2026
No change from 2012/13
LOI WM4 - % of new waste management facilities proposed / implemented that meet Policy WM4 locational requirements by waste planning authority.
n/a 100%
In 2012/13 all applications met the locational requirements of BCCS Policy WM4.
LOI WM5 - % of major planning applications granted to include supporting information on waste management to address WM5 requirements.
n/a 100% ? ?
There is currently no information available for the monitoring of this indicator.
Positive
Result
Neutral
Result
Negative
Result
? No Data C Core Indicator L Local Indicator

70
3.8 MINERALS
Spatial Objective
Safeguard and make the most sustainable use of the Black Country’s mineral resources including primary, secondary and recycled materials, without compromising environmental quality. Potentially valuable mineral resources and mineral-related infrastructure will be safeguarded against needless sterilisation or loss. The Black Country will also minimise waste of mineral resources, maximise use of alternatives, and continue to produce a steady supply of minerals and mineral products to support the local economy and provide the raw materials needed to support regeneration within the growth network.
Key Development Plan Policies: Core Strategy MIN1-5
LOI MIN1a - % of non-mineral development proposals approved within the MSA (falling within the policy threshold) which do not needlessly sterilise mineral resources
In 2013/14 no applications have been determined that had to consider the prior extraction of minerals. Although a number of applications had a site area over 5ha, these related to reserved matters, variations of condition, changes of use or small development within the larger site area that would not trigger the policy requirement.
LOI MIN1b – Protection of Key Mineral Infrastructure
COI MIN2b – Production of Secondary / Recycled Aggregates
Three key Mineral Infrastructure sites are identified in Wolverhampton in the Core Strategy. These sites relate to the production of secondary/recycled aggregates and are:
Ettingshall Asphalt Plant (Tarmac), Ettingshall
McAuliffe's, Bilston
Dismantling & Engineering Services Ltd, Portobello
Since the adoption of the Core Strategy no facilities have been lost, however Dismantling & Engineering Services Ltd site has reduced in size following the granting and implementation of planning permissions for other uses on part of the site. It is unclear what impact this may have on the capacity of mineral infrastructure in the City as little information is known about this site.
COI MIN2a – Production of Primary Land Won Aggregates
LOI MIN2 - % Permissions for non-mineral related development in Sand and Gravel areas of search
LOI MIN3a - % of Black Country brick and tile work with maintained supply of Etruria Marl and Fireclay to 2026
LOI MIN3b - % permissions for non-mineral related development in Eturia Marl and Fireclay areas of search
LOI MIN4 - % of applications for opencast coal and fireclay, coal bed methane or natural building stone which satisfy the requirements for the policy
LOI MIN5 - % of applications for mineral related development satisfying the criteria in the policy

71
Wolverhampton does not have any active or proposed mineral schemes in operation and no such applications have been received this year to monitor against these indicators. Chart 8 – Minerals Indicator Summary
Indicator Baseline Target Progress made up to
2012/13 Performance 2013/14
LOI MIN1a - % of non-mineral development proposals approved within the MSA which do not needlessly sterilise mineral resources
N/A 100%
All applications have been justified where they would
sterilise the minerals
No new permissions
granted.
LOI MIN1b - Protection of Key Mineral Infrastructure
N/A 100%
Key mineral infrastructure remains protected, although part of one site has been lost
to other uses
No proposals affecting
minerals sites
COI MIN2b - Production of Secondary/ Recycled Aggregates
N/A N/A ? Unknown
?No new data is available
this year
Positive
Result
Neutral
Result
Negative
Result
? No Data C Core Indicator L Local Indicator

72
3.9 STATEMENT OF COMMUNITY INVOLVEMENT (SCI)
L5 Conformity and Effectiveness of the SCI
Involvement in the Preparation of Local and Neighbourhood Plans The ongoing work on the Area Action Plans has continued to involve the range of stakeholders and communities in the preparation of these Plans. The Bilston Corridor Area Action Plan (including the Bilston Neighbourhood Plan) was published in August 2013, and examination in public occurred in February 2014. The dates for the Stafford Road Corridor AAP were similar, with its publication being held in June 2013 and examination in public in February 2014. The City Centre Area Action Plan commenced preparation work to progress to Issues & Options Stage consultation in December 2013 to January 2014. Ongoing work on the Neighbourhood Plans also continued to involve the stakeholders and communities in the preparation of these Plans. The Tettenhall and Heathfield Park Neighbourhood Plans held a 6 week pre-submission consultation in Sept - Oct 2013, and a statutory 6 week consultation in Jan - March 2014. An independent examination of the two neighbourhood plans commenced in March 2014, following the statutory consultation. Involvement in Planning Applications New planning regulations that were introduced on 25th June 2013 have lessened the requirement for Design and Access Statements. Design and Access Statements will now only be required for major developments, or for certain development in conservation areas or world heritage sites, and listed building consents. Future AMR’s will continue to report on Design and Access Statements, but in accordance with the new regulations. A pre-application advice service is available at Wolverhampton City Council and this service is offered free of charge. Applicants are encouraged to use this service before submitting full planning applications to the planning department. Chart 9 - Statement of Community Involvement Indicator Summary
Indicator Baseline Target Progress made up to 2012/13
Performance 2013/14
L5 Conformity and Effectiveness of the SCI
N/A Continuous monitoring and evaluation.
Target met
year on year
Engagement work on LDDs
and planning applications is being carried out in accordance with the SCI
SCI OBJECTIVE To provide real opportunities for communities to shape decisions about the future of the built and natural environment in which they live. To ensure that LDD’s and planning applications are consulted on in effective and efficient ways to achieve this. Key Development Plan Policies: Statement of Community Involvement

73
3.10 ACCESS AND FACILITIES FOR DISABLED PEOPLE: CREATING AN INCLUSIVE BUILT ENVIRONMENT SPD
SPD OBJECTIVE This SPD is aimed at assisting and informing those individuals and organisations involved in the design and creation of the built environment to consider the needs of disabled people as an integral part of the development and to enable disabled people to participate / contribute to the life of the City. Key Development Plan Policies: Access and Facilities for Disabled People: Creating an Inclusive Built Environment SPD, D11, H11 and CSP5.
L3 Percentage of planning applications considering SPD requirements
In June 2009 the Council adopted the Access and Facilities for Disabled People: Creating an Inclusive Built Environment SPD. The types of developments that need to incorporate the requirements of the SPD include new buildings, particularly those with public access. Planning Officers contact the Access Officer for advice on planning applications when necessary. The Access Team receives emails of relevant planning applications through Planning on-line and will speak to Planning Officers if there is the possibility of access issues. The relationship with Building Control is continuing to strengthen. The Access Team view all relevant applications and either speak to a Building Control Officer regarding issues that fall within the Approved Documents or contact the applicant direct if they are Equality or other issues. Whilst there is no target, ideally all relevant planning application decisions should be showing how the SPD has been considered. Chart 10 – Access and Facilities for Disabled People: Creating an Inclusive Built Environment SPD Indicator Summary
Indicator Baseline Target Progress made up to 2012/13
Performance 2013/14
L3 Percentage of planning applications considering SPD requirements
N/A 100% of all relevant planning applications
47% of
planning application decisions monitored had access issues considered.
Largely positive results. We
no longer keep a record of the number of planning applications commented on by the Access Officer.
Positive
Result
Neutral
Result
Negative
Result
? No Data C Core Indicator L Local Indicator

74
Glossary
Area Action Plans (AAPs): A Development Plan Document that focuses on specific areas of the District. An AAP enables the Council to set a planning framework for areas in need of significant change or where conservation is required. Annual Monitoring Report (AMR): The AMR reports the progress on the timetable and milestones for the preparation of documents set out in the local development scheme, including reasons why if the milestones are not being met. It also reports on progress on the policies and targets in local development documents. Where policies and targets are not being met or are not on track, reasons are provided and appropriate actions to address the matter. Black Country Core Strategy (BCCS): The core strategy is one of the development plan documents forming part of a local authority's Local Plan. It sets out the vision, spatial strategy and core policies for the spatial development of the area, along with spatial objectives and strategic policies to deliver that vision. Derelict Land: Land which has been damaged by industrial or other development, and which is incapable of beneficial use without treatment. Development Plan: This includes adopted Local Plans and neighbourhood plans, as is defined in section 38 of the Planning and Compulsory Purchase Act 2004. Development Plan Documents (DPDs): The collective term given to all statutory documents that forms the Development Plan for the Local Authority, which includes the Core Strategy, Area Action Plans and a Proposals Map. Green Belt: A Green Belt aims to stop urban sprawl and the merging of settlements, preserve the character of historic towns and encourage development to locate within existing built-up areas. It is land which has been specifically designated for long-term protection from development. It is a nationally important designation. Local Development Documents (LDDs): The collective term for Development Plan Documents, Supplementary Planning Documents and the Statement of Community Involvement. Local Development Scheme (LDS): Sets out the programme for the preparation of Local Development Documents. Local Plan: The plan for the future development of the local area, drawn up by the local planning authority in consultation with the community. In law this is described as the development plan documents adopted under the Planning and Compulsory Purchase Act 2004. Current core strategies or other planning policies, which under the regulations would be considered to be development plan documents, form part of the Local Plan. The term includes old policies which have been saved under the 2004 Act. Localism Act: The Localism Act was published on 15
th November 2011 and contains
provisions to make the planning system clearer, more democratic, and more effective. The legislation aims to shift power from central Government back into the hands of individuals, communities and councils. The Act proposes planning reforms some of which include the abolition of regional spatial strategies, duty to cooperate, neighbourhood planning, community right to build, and reform of the way local plans are made.

75
National Planning Policy Framework (NPPF): The NPPF was published on 27th March
2012. It represents a massive overhaul of the planning system to make it less complex and more accessible. The NPPF sets out the Government’s planning policies for England and how these are expected to be applied. It sets out the Government’s requirements for the planning system and provides a framework for the production of local and neighbourhood plans. The NPPF must be taken into account in the preparation of local and neighbourhood plans, and is a material consideration in planning decisions. Neighbourhood Plans: A plan prepared by a Parish Council or Neighbourhood Forum for a particular neighbourhood area. It must be prepared in general conformity with the Core Strategy. When adopted by the Council it will form part of the development plan. Regional Spatial Strategy (RSS): A document that was prepared by the regional planning body, setting out the planning policies in respect of the development and use of land across the region. Regional Spatial Strategies no longer form part of the development plan as they have been abolished by Order using powers taken in the Localism Act. Saved policies: Since the adoption of the Black Country Core Strategy (adopted Feb 2011), some of the policies within the UDP have been replaced by Core Strategy policies, whilst other UDP policies have been saved and remain effective when determining planning applications. Supplementary Planning Documents (SPDs): Provides additional information to guide and support Development Plan Documents.
Unitary Development Plan (UDP): A statutory development plan setting out the Council’s policies for the development and use of land in the local authority area. Since the adoption of the Black Country Core Strategy (adopted Feb 2011), some of the policies within the UDP have been replaced by Core Strategy policies, whilst other UDP policies have been saved and remain effective when determining planning applications (see ‘Saved policies’ above).

76
Appendix A – Black Country Core Strategy Monitoring Indicators - Core Output Indicators (COI) and Local Output Indicators (LOI)
TOPIC (AMR Chapter)
REF NO.
INDICATOR
SPATIAL STRATEGY AND DELIVERY
LOI DEL1
Adoption of Local Development Documents setting out details of the full range of infrastructure to be provided to supported
LOI DEL2a
Adoption of Site Allocation Documents and Area Action Plans covering the whole of the Black Country as per LA LDS
LOI DEL2b
Employment Land Completions by LA (ha)
LOI DEL2c
Loss of Employment Land by LA area (ha) by type
HOUSING COI HOU1a
Housing Trajectory Indicators (Net Home Completions, Housing Trajectory, Five Year Housing Land Supply)
LOI HOU1
Net housing completions for each Regeneration Corridor and Strategic Centre and for free-standing employment sites outside the Growth Network by local authority
COI HOU1b
New and converted homes on previously developed land
LOI HOU2a
% of housing completions on sites meeting accessibility standards
LOI HOU2b
Proportion of 1, 2 and 3+ bedroom properties completed by type
COI HOU3
Gross affordable housing completions
COI HOU4
Net additional pitches (permanent residential pitches, transit pitches and plots for travelling show people) provided up to 2018
LOI HOU5
Loss of education and health care capacity
ECONOMY AND EMPLOYMENT
LOI EMP1a
Employment land completions by LA (ha)
LOI EMP1b
Loss of employment land by LA area (ha)
LOI EMP2a
Employment land completions by LA by High Quality Employment Area as defined in Policy EMP2 and broad locations shown in BCCS Appendix 3 (ha)
LOI EMP2b
Additions made to High Quality Employment Land stock as defined in Policy EMP2 through improvement programmes
LOI EMP3a
Employment land completions by LA by Local Quality Employment Area as defined in Policy EMP3 and broad locations in BCCS Appendix

77
3(ha)
LOI EMP2c
Loss of employment land by LA area (ha) by High Quality and Potential High Quality Employment Area as defined in Policy EMP2 and bread locations shown in BCCS Appendix 3 (ha)
LOI EMP3b
Loss of employment land by LA area (ha) by Local Quality as defined in Policy EMP3 and broad locations in BCCS Appendix 3 (ha)
LOI EMP4
Readily available employment land
LOI EMP5
Proportion of major planning permissions making provision for targeted recruitment or training through s106 Agreements / conditions
LOI EMP6
Loss of sub-regionally significant visitor and cultural facilities
CENTRES AND TOWN CENTRE USES
LOI CEN1, 3-5
Amount of floorspace for town centre uses completed and amount permitted within an appropriate centre, as a proportion of all completions and planning permissions for such uses and in accordance with policies CEN3, CEN4 and CEN5.
LOI CEN6
Number of developments of up to 200 square metres gross floorspace for town centre uses permitted outside of centres that meet the requirements of Policy CEN6, as a proportion of all such permissions.
LOI CEN7
Number and floorspace of new developments for town centre uses permitted outside of strategic, town, district or local centres that do not accord with Policy CEN7 requirements.
LOI TRAN5a
Number of publically available long stay parking places in strategic centres
LOI TRAN5b
All new publically owned long stay parking spaces in Strategic Centres to be located in peripheral locations
TRANSPORT LOI TRAN1
% of DPDs identifying and safeguarding land to meet transport requirements
LOI TRAN2
Appropriate provision or contribution towards transport works and Travel Plans measures by all relevant permissions based on best practice.
LOI TRAN3a
The safeguarding of key existing and disused railway lines identified on the Transport Key Diagram.
LOI TRAN3b
Protection of sites with existing or potential rail access identified in TRAN3.
LOI Increase in cycle use of monitored routes

78
TRAN4a
LOI TRAN4b
Implementation of Proposed Local Cycle Network identified in the cycle network map
LOI TRAN5a
Number of publically available long stay parking places in strategic centres
LOI TRAN5b
All new publically owned long stay parking spaces in Strategic Centres to be located in peripheral locations
ENVIRONMENTAL INFRASTRUCTURE
COI ENV1
Change in areas of biodiversity importance
LOI ENV6a
Ha’s accessible open space per 1,000 population
LOI ENV6b
Delivery through LDD’s of broad open space, sport and recreation proposals for each Regeneration Corridor and Strategic Centre set out in BCCS Appendix 2
COI ENV7
Renewable Energy Generation
LOI ENV7
Proportion of eligible developments delivering measures sufficient to off-set at least 10% of estimated residual energy demand
LOI ENV5
Proportion of major planning permissions including appropriate SUDS
LOI ENV3a
Proportion of major planning permissions adequately addressing By Design and Manual for Streets as appropriate
COI ENV3
Housing Quality Building for Life Assessment (H5)
LOI ENV3b
Proportion of major planning permissions meeting at least Code for Sustainable homes Level 3 or BREEAM very good standard
LOI ENV2
Proportion of planning permissions granted in accordance with Conservation/Historic Environment Section or Advisor recommendations
LOI ENV4a
Proportion of planning permissions granted in accordance with Conservation Section’s recommendation
LOI ENV4b
Proportion of planning permissions granted in accordance with British Waterways planning related advice
LOI ENV8
Proportion of planning permissions granted in accordance with Air Quality / Environmental Protection Sections recommendations
MINERALS LOI MIN1a
% of non-mineral development proposals approved within the MSA (falling within the policy threshold) which do not needlessly sterilise mineral resources
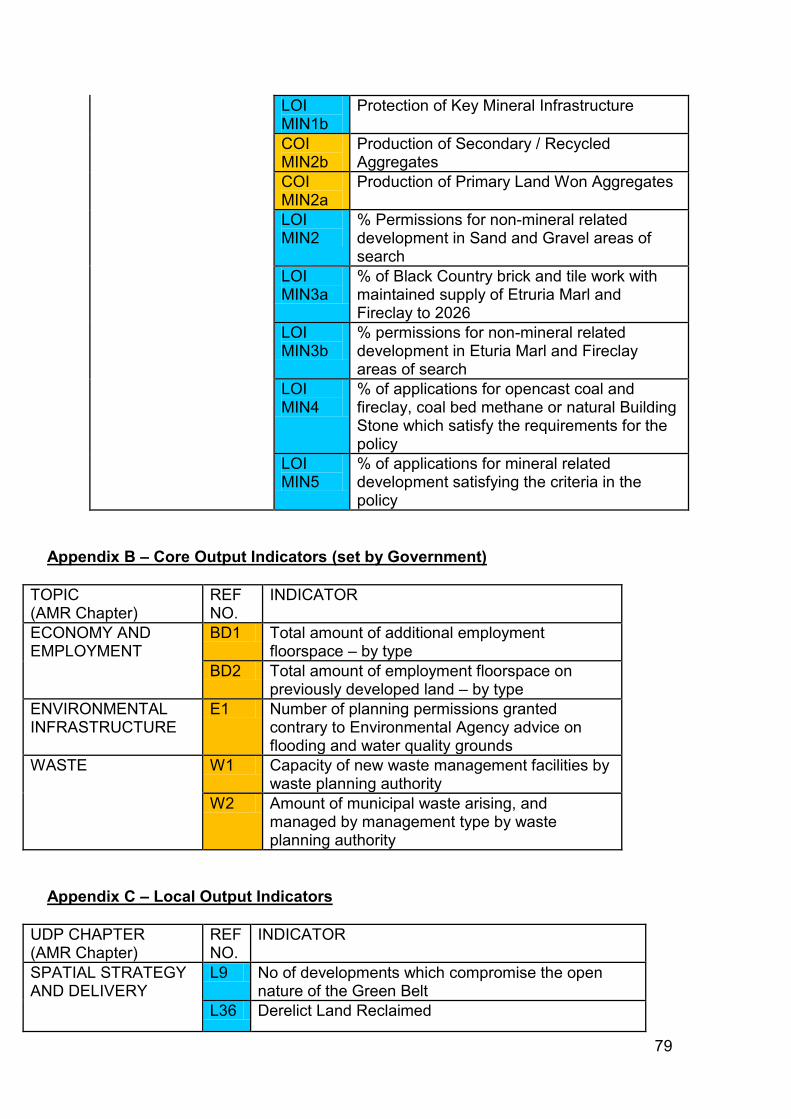
79
LOI MIN1b
Protection of Key Mineral Infrastructure
COI MIN2b
Production of Secondary / Recycled Aggregates
COI MIN2a
Production of Primary Land Won Aggregates
LOI MIN2
% Permissions for non-mineral related development in Sand and Gravel areas of search
LOI MIN3a
% of Black Country brick and tile work with maintained supply of Etruria Marl and Fireclay to 2026
LOI MIN3b
% permissions for non-mineral related development in Eturia Marl and Fireclay areas of search
LOI MIN4
% of applications for opencast coal and fireclay, coal bed methane or natural Building Stone which satisfy the requirements for the policy
LOI MIN5
% of applications for mineral related development satisfying the criteria in the policy
Appendix B – Core Output Indicators (set by Government)
TOPIC (AMR Chapter)
REF NO.
INDICATOR
ECONOMY AND EMPLOYMENT
BD1 Total amount of additional employment floorspace – by type
BD2 Total amount of employment floorspace on previously developed land – by type
ENVIRONMENTAL INFRASTRUCTURE
E1 Number of planning permissions granted contrary to Environmental Agency advice on flooding and water quality grounds
WASTE W1 Capacity of new waste management facilities by waste planning authority
W2 Amount of municipal waste arising, and managed by management type by waste planning authority
Appendix C – Local Output Indicators
UDP CHAPTER (AMR Chapter)
REF NO.
INDICATOR
SPATIAL STRATEGY AND DELIVERY
L9 No of developments which compromise the open nature of the Green Belt
L36 Derelict Land Reclaimed

80
CENTRES AND TOWN CENTRE USES
L13 Percentage of vacant units in Wolverhampton City Centre
TRANSPORT L26 Proportion of Wolverhampton Employees working for companies with a travel plan
L22 Percentage of developments meeting car park standards
L32 Amount of completed non-residential development complying with car parking standards
ENVIRONMENTAL INFRASTRUCTURE
L27 Change in priority habitats and species by type
L7 Hectares of Local Nature Reservation per 1000 population
L30 Amount of eligible open spaces managed to green flag award standard
L14 Number of Neighbourhood Park Areas meeting current recreational open space standard (ha’s per 1000 residents)
L15 Number of Neighbourhood Parks
L1 No of new developments recognised for design quality and excellence
L2 Percentage of planning permissions granted contrary to Policy advice
L20 Percentage of Conservation Areas with up to date Appraisals and Management Proposals
L38 Number / Percentage of Listed buildings and Ancient monuments at risk of neglect or decay
L39 Number / Percentage of Listed Buildings Demolished
L4 Achieve a net reduction of Nitrogen Dioxide (NO2) in those areas where the annual average NO2 values are predicted to exceed 40ugm3 between 2008 (baseline) and 2015
WASTE L6 Percentage of household waste recycled or composted
STATEMENT OF COMMUNITY INVOLVEMENT (SCI)
L5 Conformity and Effectiveness of the SCI
PLANNING FOR SUSTAINABLE COMMUNITIES SPD
L37 Percentage of major planning applications achieving SPD targets
ACCESS AND FACILITIES FOR DISABLED PEOPLE: CREATING AN INCLUSIVE BUILT ENVIRONMENT SPD
L3 Percentage of planning applications considering SPD requirements

81
Appendix D - Membership of Groups Contributing towards the Duty to Cooperate
Group Who Remit
West Midlands Planning and Transportation sub-committee
The seven West Midlands Metropolitan Districts
Strategic Planning - Coordinates and, where appropriate, presents the mutual views of its members on strategic planning and transportation issues affecting the West Midlands in the preparation, monitoring, implementation and review of spatial strategies and related sub-regional strategies for the Metropolitan Area and the region as a whole. The sub-committee make representations to development plans within the metropolitan area on behalf of the districts and provide strategic intelligence to inform plan preparation.
West Midlands Resource Technical Advisory Body (RTAB)
Waste Planning Authorities, public bodies, waste industry representatives in the West Midlands
Waste - The RTAB supports co-operation between local authorities and others by providing objective and authoritative technical advice concerning the sustainable management of material resources and strategic waste management data, issues, and development policies and proposals
West Midlands Aggregates Working Party (WMAWP)
Mineral Planning Authorities (MPA), public bodies, mineral industry representatives in the West Midlands
Minerals - The WMAWP plays a major role in data collection, collation and monitoring and provides advice on future regional trends, together with the environmental and other implications of meeting Government aggregate demand forecasts. As well as enabling MPAs within the region to formulate plans and polices which reflect national and regional needs, the WMAWP provides an input in to regional planning and Central Government guidelines for aggregate provision.
Biodiversity Partnership, Geodiversity Partnership, Local Sites Partnerhsip and EcoRecord for Birmingham and the Black Country
Local Authorities, public bodies, user groups in Birmingham and the Black Country
Nature Conservation – These groups provide help and support on biodiversity and geodiversity development (and site management) related issues. This includes the production of Action Plans, amendments to Local Sites, and the collection and monitoring of habitat and species related data.

82
Appendix E – Black Country Housing Trajectory: 2006-26
Year Past Net Completions
Projected Net Completions
PLAN: Strategic Allocation annualised
(Black Country Core Strategy)
MONITOR: Variation from Cumulative Net
Requirement
MANAGE: Annual
requirement taking account
of past completions
Cumulative net allocation
(Black Country Core Strategy)
Cumulative net
completions
2006/7 2838 2625 213
2625 2838
2007/8 1829 2625 -583
5250 4667
2008/9 1415 2625 -1793
7875 6082
2009/10 2642 2625 -1776
10500 8724
2010/11 1951 2626 -2451
13126 10675
2011/12 2457 2625 -2619
15751 13132
2012/13 2296
2625 -2948
18376 15428
2013/14 2145
2625 -3428
21001 17573
2014/15 3479 2625 -2574 3786 23626 21052
2015/16 4550 2635 -659 3813 26261 25602
2016/17 4683 2448 1576 3740 28709 30285
2017/18 4783 2448 3911 3635 31157 35068
2018/19 4619 2448 6082 3492 33605 39687
2019/20 3615 2448 7249 3330 36053 43302
2020/21 3501 2448 8302 3283 38501 46803
2021/22 3916 4899 7319 3239 43400 50719
2022/23 3579 4900 5998 3070 48300 54298
2023/24 3486 4900 4584 2901 53200 57784
2024/25 2857 4900 2541 2608 58100 60641
2025/26 2852 4901 492 2359 63001 63493

83
Appendix F – Employment Development Opportunities
Site Name Plan Reference
Site Size (Hectares)
Readily Available
Map Label
Citygate Park (FMR Goodyear Depot) 391300, 304135
4.07 Yes 1
Antar (PH4) (Former IMI Sports Grnd) 391229, 303625
4.57 Yes 2
Former IMI Site 394341, 299802
2.46 Yes 3
Former Rolls Royce Sports Ground (including former sports ground adjacent to Sunnyside Taylor Road)
392999, 296223
1.86 Yes 4
Wolverhampton Business Park 391928, 304270
3.54 Yes 5
Land at Brookpoint 395173, 299573
1.66 Yes 6
Wolverhampton Science Park 391522, 300674
4.53 Yes 7
Land at Vulcan Road 396143, 296170
1.45 Yes 8
Bentley Bridge Business Park 394605, 299893
1.24 Yes 9
Land at Hickman Avenue 393002, 298149
0.70 Yes 10
The Gateway 391526, 304352
1.37 Yes 11
Land at Pheonix Road 394939, 299555
1.57 Yes 12
Glynweds 394339, 299576
7.14 Yes 13
Battery Rolled Metals Factory 392517, 297625
0.66 Yes 14
Bankfield Works 395354, 295682
0.68 Yes 15
Hilton Trading Estate 392759, 296151
0.52 Yes 16
Land adj Hilton Trading Estate 392802, 296046
1.44 Yes 17
Springvale Avenue 393823, 295809
0.71 Yes 19
South of Citadel Junction 396281, 296469
2.94 Yes 20
Rear IMI Marston 391054, 303789
7.24 Yes 21
Crown Works 391713, 299751
2.82 Yes 22
655 Willenhall Road 395129, 298495
1.92 Yes 23
Land at Neachells Lane 394940, 298562
1.17 Yes 24
Land at Seamless Drive 394902, 299826
0.49 Yes 25
Purbrook Road Industrial Estate 393139, 297871
0.91 Yes 26
TOTAL: 57.66ha

84
Map 3: Readily Available Employment Land in Wolverhampton 2013/14
Source: RELS 2013/14