Embed Size (px)
Citation preview

Sara E. Rix, Ph.D. John Turner, Ph.D. Project Managers
The Public Policy Institute, formed in 1985, is part of Policy and Strategy at AARP. One of the missions of the Institute is to foster research and analysis on public policy issues of importance to older Americans. This paper represents part of that effort.
The views expressed herein are for information, debate and discussion, and do not necessarily represent formal policies of AARP
2003, AARP Reprinting with permission only. AARP, 601 E Street, N.W., Washington, DC 20049 www.aarp.org/ppi
#2003-09 July 2003
WOMEN AND INDIVIDUAL SOCIAL SECURITY ACCOUNTS IN CHILE,
AUSTRALIA, AND THE UNITED KINGDOM
by
Sophie M. Korczyk, Ph.D. Analytical Services

i
CONTENTS
Foreword ........................................................................................................................................ iii
Executive Summary ........................................................................................................................ v
Introduction..................................................................................................................................... 1
Country Profiles .............................................................................................................................. 4
Chile................................................................................................................................................ 8
Australia........................................................................................................................................ 17
United Kingdom............................................................................................................................ 24
Conclusions................................................................................................................................... 32
References..................................................................................................................................... 36
Tables............................................................................................................................................ 42

ii
THIS PAGE INTENTIONALLY LEFT BLANK

iii
FOREWORD Over 24 million women receive monthly benefits from the U.S. Social Security system. Women are
• nearly half of the recipients of retired worker benefits, • over two-fifths of the recipients of disabled worker benefits, • 99 percent of the spouses receiving Social Security benefits, • 99 percent of the surviving beneficiaries, and • 98 percent of the dually entitled, that is, persons entitled to benefits as retired workers
and as spouses. Social Security is the main source of income for America’s older population, especially the low-income population, among whom women predominate. It accounts, for example, for at least half of the income of the more than 10 million nonmarried women aged 65 and older who receive Social Security. For about a fourth of these women, it is the only source of income. While the proportion of women with private pension benefits and other retirement savings is rising, millions of women well into the future will reach retirement age with little or nothing in the way of supplements to Social Security. Social Security reform is thus very much a women’s issue. Many of the proposals to reform Social Security in the United States, including those of the President’s Commission to Strengthen Social Security, would establish voluntary or mandatory individual accounts. Though the details of the proposals vary widely, individual accounts are designed to give workers greater control of their payroll tax investments. Investment opportunity and risk would rest more squarely on the shoulders of workers than is the case with the current Social Security program that promises an inflation-protected, life-time benefit to workers and their spouses. A key question is what such accounts portend for the financial well-being of women in old age. In her examination of the design and operation of the social security systems of Chile, Australia, and the United Kingdom, Sophie M. Korczyk pays particular attention to how women have fared or are likely to fare under three systems that have individual accounts. Her report to AARP, Women and Individual Social Security Accounts in Chile, Australia, and the United Kingdom, concludes that although the individual account programs in the three countries are too new for a clear picture of benefits equity and adequacy to have emerged, women in such programs “face some predictable dangers” that may make it more difficult for them to finance a secure retirement than would be the case in a traditional, defined benefit social insurance program. Sara E. Rix, Ph.D. John Turner, Ph.D. Senior Policy Advisor Senior Policy Advisor

iv
THIS PAGE INTENTIONALLY LEFT BLANK

v
EXECUTIVE SUMMARY Background Individual accounts have caught the interest of many reformers of social security retirement programs, both in the United States and around the world. Women’s interests and needs are not easy to handle in an old-age security program based on individual accounts rather than social insurance principles. Women have lower rates of labor force participation than men, are more likely to work part-time, and, even when working full-time, tend to earn less. These factors reduce the amounts women can expect to accumulate in individual account plans. Purpose and Methodology of the Report Proponents of individual accounts extol the “success” of plans in such countries as Chile, Australia, and the United Kingdom. This report reviews the design and operation of these three systems to explore their impact on women, especially with respect to implementation and behavioral issues. Empirical Results The experiences of Chile, Australia, and the United Kingdom suggest that several retirement plan features particularly matter in determining the value of these plans for women. These features center around four major themes: eligibility and participation, contributions, administrative costs, and benefits. Eligibility and Participation. The three systems have achieved broad enrollment. But some workers—typically the self-employed, those with low earnings, or nonstandard workers who work for more than one employer—may be excluded from participation entirely, or may participate on a voluntary basis, depending on the country. Those who change jobs frequently, in turn, may face difficulties in keeping track of multiple small accounts. To the extent that women fall disproportionately into these groups, they may face special difficulties in accumulating adequate retirement income. Contributions. Low required contributions can preclude the accumulation of adequate retirement funds. High contributions, in turn, can discourage participation or encourage evasion. These considerations would seem to be unisex in their impact, but could disproportionately affect women because of their lower earnings. Both social insurance programs and individual account programs can be designed to offer pension credits for time spent out of the workforce. The British individual account system offers workers the option to pay for credits for time they spend out of the workforce, and the Australian system allows workers to contribute for spouses with low or no earnings. This option can be used to increase benefits to people with interrupted work careers. But credits earned in this way are low. Participant contributions can also be difficult for people with little or no earnings to make.

vi
Administrative Costs. Some systems studied in this report have high administrative costs, particularly those associated with small and inactive accounts or those associated with changing plan providers. In these systems, retirement benefits depend on the amount contributed and the investment earnings that accrue. Administrative costs are deducted from these amounts and thus reduce benefits. When plan choice is voluntary, it can be difficult to ensure that people have the information to make the right choices for their needs. Regulation may fill the gap, but while the three countries considered in this report have taken steps in this direction, the results are not yet clear. The inherent complexity of these systems may make them difficult to navigate or unattractive for younger workers and those with low earnings. Benefits. Some people in all three countries—typically those with low or fluctuating incomes or interrupted work careers—will get little for their contributions. Small accumulations may be physically lost, may be effectively lost to administrative fees, or may survive to retirement only to leave their holders in a “pension poverty” trap. In individual account plans, benefits depend significantly on work patterns over the life cycle. Early-career contributions can accrue investment earnings over a longer period, but do not reflect the wage growth many participants would experience over the course of their career. Later contributions may reflect wage and productivity growth, but have less time to accrue substantial investment earnings. All three countries studied in this report permit the withdrawal of at least some retirement benefits in lump-sum form. To the extent that women live longer than men, taking benefits as a lump sum rather than an annuity can hurt them more than it hurts men. Both Australia and the United Kingdom provide for the splitting of pension assets in divorce proceedings, though splitting of assets, including those accumulated in individual account plans, is not mandatory. Divorce does not exist in Chile. Marriages must be ended by annulment, which implies that a valid marriage never existed. The rights of former spouses are thus not protected. Social insurance benefits are indexed in the United States and in all three countries studied in this report. This indexation is financed by taxpayers. Indexation helps women more than men to the extent that they live longer than men. Individual account benefits can also be indexed for inflation. But unlike the case in a social insurance system, where society insures the participant against inflation, in an individual account system, only the participant’s own account balance is available for paying benefits. Consequently, the participant must self-insure against inflation. This can only be accomplished by accepting lower initial retirement benefits so that more of the account balance is available to compensate for inflation as time goes on. While labor market opportunities develop and change relatively slowly, conditions in investment and annuity markets can change quickly. Many workers may be able to postpone retirement when the market is down, but that is not an option for everyone. Thus, participants in individual account plans cannot eliminate the risk of retiring at the “wrong” time, thereby reducing their benefits.
vii
All three countries offer at least some retirees a guaranteed minimum pension benefit. Australia offers an age-based, means-tested old-age pension that is independent of work or earnings history. Both the Chilean and U.K. systems require substantial periods of participation and contributions to qualify for the minimum benefit. The longer the contribution period required, the more likely the typical participant is to accumulate a substantial account balance. But long required contribution periods may mean that even people with substantial covered work histories fail to qualify for the guaranteed minimum benefit or qualify for only part of the minimum. Conclusions The individual account plans considered in this report were established for varied reasons, and against varied historical and economic backdrops. None of the three systems is old enough for a clear picture of benefits equity and adequacy to have emerged. Because of the lack of long-term experience, no one knows how enrollment will translate into effective, long-term coverage, and from coverage into benefits. However, the evidence to date offers some suggestions for how women may expect to fare. The report concludes that women in individual account programs can face some predictable dangers. Many women may combine child-rearing and work in ways that will reduce the buildup of investment returns in individual account plans. Some may get little for career-long contributions and may not even qualify for “back-up” minimum pensions. The inherent complexity of these systems may also make them difficult to navigate or unattractive for both women and men, especially if they feel they have relatively little at stake. In particular, the early work years can be a particularly important time to make retirement planning decisions in individual account plans, as money set aside early in life earns returns over a longer period. Yet the time when earnings are at their lifetime low and retirement is the most distant may not be the best time to expect people to think about their old age. Optimistic projections for improvements in women’s retirement incomes tend to depend on changes in both social attitudes and women’s behavior not yet pervasive anywhere in the world. Absent such changes, the experiences of Chile, Australia, and the United Kingdom provide little reason to believe that women will fare better relying on individual account systems for a major share of their retirement incomes than they would under traditional social insurance programs with some degree of redistribution built in to protect workers with low-wage or interrupted work careers. Some of these behavioral changes—including increased human capital investment and higher rates of labor force participation on the part of women—are happening to some degree throughout much of the world. But both women’s behavior and their treatment in the workforce may not change enough to allow most—or even many—to accumulate adequate retirement incomes under individual account plans without other income sources. And plan participants, policymakers, and researchers all have to understand that individual account retirement incomes for all participants, not just women, may be both more variable and more difficult to predict than under programs based on social insurance principles.

INTRODUCTION The history of the U.S. Social Security program can be roughly divided into two phases.1 The first phase began in 1939, before the program (enacted in 1935) had even paid any monthly benefits. This phase was expansionary. In that year, legislation added spousal and retirement benefits; the original program had been aimed only at workers. Later expansions included the addition of the Disability Insurance program in 1956, and automatic cost-of-living adjustments in 1972. These and other changes expanded the program’s reach and made its benefits more generous. The program’s second phase began in the mid-1970s and continues to the present day. This phase has been characterized by efforts to contain the program’s growth and ensure that it can continue to pay benefits over the long term. Indexing was made more restrictive in 1977. Various benefits were cut in 1980 and 1981. The most important event to date in this second phase was the enactment of the Social Security Amendments of 1983. This law gradually raised the age at which workers could receive full benefits from age 65 for those born in 1937 and earlier to age 67 for those born after 1959; moved up scheduled payroll tax increases; included some benefits in the income tax base; and required all new federal workers and employees of nonprofit organizations to enroll. In recent years, some observers have suggested that it is time for a third phase: adding funded individual accounts to the Social Security program. Advocates argue that adding individual accounts can improve the Social Security system by yielding more income for retirees, increasing national savings, and reducing overall budgetary and economic pressures (see, for example, Mitchell and O’Quinn 1997, President’s Commission 2001). Under some proposals, these accounts would be funded by reductions in Social Security payroll taxes. The 1997 Social Security Administration Advisory Council report’s reform menu included two ways that the Social Security program could include individual accounts (Wiatrowski 1998). More recently, the President’s Commission to Strengthen Social Security set forth three reform models based on voluntary individual accounts (President’s Commission 2001):
• Model 1 would allow workers to invest 2 percent of their taxable wages2 in a personal account. In exchange, traditional Social Security benefits would be offset by the worker’s personal account contributions compounded at an interest rate of 3.5 percent above inflation.
• Model 2 would allow workers to redirect 4 percentage points of their payroll taxes (up to
an indexed limit) yearly to a personal account. In exchange, traditional Social Security benefits would be offset by the worker’s personal account contributions compounded at an interest rate of 2 percent above inflation.
• Model 3 would allow workers to contribute an additional 1 percent of wages subject to
Social Security payroll taxes. This contribution would be matched by 2.5 percentage points of the payroll tax (up to an indexed limit). The voluntary contribution would be
1 See Congressional Budget Office (2001) for a synopsis of the program’s legislative history. 2 No dollar limit on allowable contributions is specified.

2
partly subsidized by a refundable tax credit. In exchange for the added contribution, traditional Social Security benefits would be offset by the worker’s personal account contributions compounded at an interest rate of 2.5 percent above inflation.
The U.S. public has frequently been exhorted to examine the “success” of individual account plans in several countries, including Chile, Australia, and the United Kingdom:
“About two dozen countries around the world have privatized their retirement systems, either fully or partially, and the results have been universally successful. … Chile set up a very successful system nearly 20 years ago…” (Mitchell 2000) “By every possible measure, the Australian move to privatization thus far must be considered a success.” (Mitchell and O’Quinn 1997) “Britain's experiment in social security reform has accomplished several major goals. It has helped control entitlement spending; it has raised the standard of living for elderly persons; and it has given young people broad personal choice in deciding how best to invest their own money and control their own futures.” (Enoff and Moffitt 1997)
This report attempts to take up that challenge. One important issue in evaluating these plans is their potential effect on the retirement incomes of women. Women constitute about 60 percent of current Social Security recipients.3 Older women are more likely than older men to depend on Social Security for all or most of their retirement income.4 Social Security benefits are available for life, while inadequate investment, poor planning, or both can mean that money accumulated in an individual account may not be. Women’s longer average life span can make outliving their assets a real danger. It can be more difficult to provide adequate retirement income to women in a retirement income system based on individual accounts than in one based on social insurance principles. Many women have lower rates of labor force participation than men, work fewer of their potential working years, are more likely to work part-time, and, even when working full-time, tend to earn less. In an individual account system, women’s pensions do not benefit from the redistributive features common in social insurance systems. Social Security’s benefit formula provides proportionately higher benefits for low earners (mostly women) than for high earners (mostly men).5 The formula also benefits people who spend less than a full career in the workforce.6 At the same time, however, it is important to note that the question of adding individual accounts to the Social Security system would not arise if pay-as-you-go systems such as Social Security were trouble-free. The President’s Commission (2001) argues that Social Security retirement 3 Women are 58 percent of all older recipients and 71 percent of those age 85 and older (U.S. Social Security Administration 2002a). 4 In 2000, women living alone depended on Social Security for an average of 71 percent of their retirement income, compared with 64 percent for men living alone and 55 percent for married couples. 5 For example, while women made up 50 percent of workers paid hourly rates in 2000, they accounted for 63 percent of those paid at or below the federal minimum wage of $5.15 (U.S. Census Bureau 2001). 6 Among workers first receiving Social Security retirement benefits in 1999, women had worked a median 32 years, compared with 44 years for men (U.S. Social Security Administration 2002a).
3
benefits are “… no longer the bargain they once were,”7 and that “the system is not sustainable as currently structured.” Unaddressed, low rates of return on contributions and the system’s looming fiscal problems can threaten the social consensus on which the system is founded. The report examines the Chilean system because it is the oldest individual account plan currently in operation. The Australian and U.K. systems are of interest because those countries share many political, economic, and social characteristics with the United States. This report begins with a brief review of key economic and demographic features of the United States and the three countries whose retirement systems are being examined. It then reviews the design and operation of the three systems with special attention to meeting women’s needs in such programs. The analysis is built around four major features of individual account plans: eligibility and participation, contributions, administrative costs, and benefits. The report attempts to go beyond the well-known concerns for women outlined above—lack of progressivity, shorter, interrupted and lower-paying work careers, and longer lifespans—to explore issues related to program implementation and how program design affects and responds to participants’ behavior. The report focuses on the structure of the programs, and how this structure affects women, rather than on the programs’ performance. The focus on structure partly reflects limited data on these programs’ performance for women. Many important issues about individual account systems are largely outside the scope of the present report. The report generally does not address the quality of information provided to employees in their retirement planning or the consumer protection and supervisory procedures that might be needed to protect people from poor retirement planning and investment decisions. The quality of information and regulation has to be judged in the context of each country’s entire labor and consumer protection systems, and assessing those systems in their cultural, political, and economic context is beyond the scope of this report. The report does not address the important question of transition costs from a social insurance system to one based on individual accounts since it is not clear how these costs would differ between men and women. The report also does not go into detail about pending reform proposals in each country. Since proposals can be debated for many years before enactment, each country’s program is studied primarily as it currently exists. Finally, the report does not attempt to evaluate proposals for including individual accounts in the U.S. Social Security system on the basis of foreign experience. One obstacle to such an evaluation is that there is no detailed legislative proposal currently pending in the United States that could be compared with the foreign plans. Another obstacle is that these systems differ from each other, and from the proposals outlined by the President’s Commission, in important ways. The Australian and Chilean systems are mandatory, for example, while participation in the privatized components of the U.K. system is voluntary. The Australian and Chilean systems have a small guaranteed minimum pension as back-up, while the U.K. system offers many people not
7 A male worker born in 2000 with average earnings is projected to earn a real return of 0.86 percent on his contributions, while a worker earning the maximum amount subject to payroll taxes earns a real return of –0.72 percent per year (President’s Commission 2001).

4
one, but two state pensions and complex paths between the private and public sectors. These differences complicate the task of drawing lessons for a possible U.S. system. The report concludes that women in individual account programs can face some predictable problems. The systems studied in this report have achieved broad enrollment. While the programs are not necessarily hostile to workers wishing to combine market work with child rearing, many women may do so in ways that will reduce the buildup of investment returns in individual account plans. Many women may get little for career-long contributions; and some may not even qualify for “back-up” minimum pensions. The inherent complexity of these systems appears to make them difficult to navigate or unattractive for both women and men. People with low earnings in particular may feel they have relatively little at stake in learning a complex system since they have little money to put into it. In particular, the early work years can be an important time to make retirement planning decisions in individual account plans, as money set aside early in life earns returns over a longer period. Yet the time of life when earnings are at their lifetime low and retirement is the most distant may not be the best time to expect people to think about their old age. And plan participants, policymakers, and researchers all have to understand that individual account retirement incomes for all participants, not just women, may be both more variable and more difficult to predict than in plans based on social insurance principles. While contributions may be a fixed percentage of payroll just as in social insurance plans, the value of benefits realized from these contributions will depend in part on the performance of financial markets, the participant’s investment decisions, and the timing of the participant’s retirement, all factors that are irrelevant in retirement plans based on social insurance principles. But any conclusions about how women might fare in individual account plans are necessarily tentative. At this point, no one knows how enrollment will translate into effective long-term coverage, and from coverage into benefits. COUNTRY PROFILES8 The individual account plans considered in this report were established for varied reasons, and against varied historical9 and economic backdrops. This section examines and compares key economic and demographic features of the United States and the three countries considered in this report.10 These features are not the only influences on retirement policy, but rather are presented to provide background for later discussion.11
8 Certain program parameters discussed in this report are presented in the relevant country’s currency. As of November 19, 2002, the exchange rates were as follows: U.S. $1 = 1.79 Australian dollars (AU$) U.S. $1 = 698.50 Chilean pesos (CLP) U.S. $1 = 0.633 U.K. pounds (£). 9 See Williamson (2000) for a discussion of the importance of path dependence to the process of changing social security programs. 10 For detailed information on the history and operation of the Chilean system, see Wiatrowski (1998), Kritzer (2000), and Acuna and Iglesias (2001); on the Australian system, see Schulz et al. (1990), Schulz (2000a), and Olsberg (1997); and on the U.K. system, see Blake (2003), Schulz (2000b) and Liu (1999). 11 The section uses standardized data across countries to the extent possible, but some differences of form and definition remain and are noted.

5
Size The United States is by far the largest of the four countries considered in this report, with a population of 283 million in 2000 (Table 1). Chile is the smallest, with 15 million people; Australia, with 19 million, is of comparable size. Even the United Kingdom, which at 59 million is the next largest in population after the United States, has less than one-quarter of the U.S. population. The Older Population For convenience, this report uses age 60 to define a country’s older population. This dividing line is arbitrary and dictated by data availability. It is not intended to be a proxy for employment status. Rather, the use of age avoids some of the difficult problems involved in deciding who is retired. For example, a worker may retire from his or her career job, claim a pension, and embark on a new career or take a part-time position. The United Kingdom has the oldest population of the four countries, with more than one in five persons age 60 or older (Table 2). In the United States, 18 percent of the population falls into this age group. The Australian share, at 17 percent, is comparable. Only 11 percent of the Chilean population falls into this age group. Labor Force Participation The labor force definition used here includes all employed and unemployed persons and corresponds essentially to labor force participation. For symmetry with the definition of the older population used in the previous section and in Table 2, the potential working age population is defined as those ages 15 (16 in the United Kingdom and the United States) to 59. Not all persons of potential working age are in the labor force. Many in this age group may be unavailable for work (because of full-time schooling, family responsibilities, or disability, for example), while many not in this age group may work full-time. Overall economic activity rates differed among the countries studied, but some gender-based differences were more substantial. Australia and the United States have similar labor force participation or economic activity rates, both overall and by gender. Among Australians, 77 percent were economically active in 2001; in the United States this total was 79 percent (Table 3). In both countries, 85 percent of men fell into this category. The difference among women was somewhat larger; 69 percent of Australian women and 72 percent of American women were economically active. The overall economic activity rate in the United Kingdom, at 63 percent, was similar to that in Chile, at 60 percent, but there were more substantial differences between men and women. Among men, 71 percent in the United Kingdom and 79 percent in Chile were economically active; among women, these totals were 55 percent and 41 percent, respectively.

6
Hours worked. Patterns of part-time employment are of interest because part-time workers tend to earn less than full-time workers, and because women are more likely to work part-time than men. Both the prevalence of part-time work and women’s share of part-time work differ considerably among the four countries. Among men, 14 percent of Australians work part-time, compared with only 8 percent in the other three countries (Table 4). Among women, the United Kingdom has the highest proportion of part-time workers (42 percent), and Chile the lowest (14 percent). Women’s share of part-time employment can influence the degree to which issues affecting part-time employees are considered women’s issues. This share is highest in the United Kingdom (80 percent) and lowest in Chile (47 percent).
Years worked. Data on years worked at retirement are presented differently in each country, but they do suggest some consistent differences between men and women. In Australia, the average woman has worked just over two years for every four worked by the average man. At retirement, the median U.S. woman has worked almost three years for every four worked by the median man (Table 5). American women’s edge in years worked reflects at least in part the fact that both government-sponsored and private retirement plans offer retirement benefits at the same ages for men and women. U.K. women must work almost nine years for every 10 worked by men to claim the full basic state pension. Most men and women meet this standard (see further discussion in United Kingdom, below). Data for Chile cover urban workers who are enrolled in the social security system at some point in their lives (James et al. 2002). Since workers with a strong attachment to the formal workforce are more likely to enroll in the social security system than those without such an attachment, women in this category will probably tend to have longer work careers than women as a whole. In contrast, rural workers are both less likely to enroll in the social security system and, especially among women, more likely to work in the informal sector (James et al. 2002). Among workers with a secondary education, the average woman has worked almost 27 years at age 65, while the average man has worked 38 years (Table 5).12 Regardless of education, the average man has worked at least 36 years, however, while the average woman’s work years range from a low of 23 with an incomplete primary education to a high of 36 years with five or more years of postsecondary education. Wages. The ratio of women’s earnings to those of men is often used as an index of women’s relative position in the labor market. This index reflects human capital investment and career choices as well as the availability of economic opportunities. This index also measures women’s relative ability to accumulate retirement incomes through their own work. American women earn 74 percent of what men do (Table 6). Australian women earn 85 percent of what men earn—the highest ratio of the four countries studied. Earnings of women in Chile and in the United Kingdom are somewhat lower in relation to those of men than in the United States or Australia, but differences in how data are reported complicate comparisons. 12 Not all years worked are necessarily contributory years.
7
Poverty High poverty rates can both complicate retirement policy and make it more urgent. High poverty among the elderly, in turn, can serve as a measure of the retirement income system’s performance. Higher poverty among the elderly than in the overall population can suggest that living standards drop after retirement. The poverty measures considered below take only disposable income (including both cash and certain noncash items such as food stamps) into account. This is the broadest definition of income that allows comparability across nations (Smeeding et al. 2002). This definition ignores many transfers, subsidies, and in-kind income sources. Such comparisons are therefore incomplete to the extent that such transfers help determine living standards. But, as Mollie Orshansky, the economist who developed the U.S. poverty measure, has noted, “While money may not be everything, it is way ahead of whatever might be in second place” (Ireland and Bond 1976). Overall poverty rates. Poverty can be measured in absolute or relative terms. An absolute poverty level is one that estimates families' minimum consumption needs without reference to the income or consumption levels of the general population (Fisher 1995). One absolute measure is the U.S. poverty level.13 Using this measure, Smeeding et al. (2002) calculated poverty rates for 11 of the 19 countries participating in the Luxembourg Income Study (LIS).14 Australia, the United Kingdom, and the United States ranked first (17.6 percent), second (15.7 percent), and third (13.6 percent) in poverty, respectively (Table 7). While this poverty measure was not available for Chile, its poverty rate based on another absolute standard was 17.0 percent of the population as of 1998 (World Bank 2001).15 Absolute poverty rates do not reflect each country’s living standard. Living standards vary significantly, even among wealthy countries. An absolute living standard that represents poverty in one country could therefore represent a relative level of comfort in another. Relative poverty rates are not distorted by such differences. One relative measure of poverty considers the proportion of each country’s population living on less than some proportion of each country’s own national median income.
13 This index is based on money income and reflects the U.S. Department of Agriculture 1961 Economy Food Plan. The U.S. poverty level is currently about 42 percent of U.S. median household income (Smeeding et al. 2002). 14 The Luxembourg Income Study (LIS) is a not-for-profit international cooperative research project. The project’s main objective is to construct a harmonized database for international comparative studies. The absolute poverty measure includes only those LIS countries for which adequate household survey data used to measure poverty were available (Smeeding et al. 2002). 15 This statistic is based on the lower-bound poverty level, the standard poverty level used in Chile. This is an absolute poverty level based on a national average caloric requirement derived from the Food and Agriculture Organization/World Health Organization recommended caloric intakes for various age and gender groups.

8
One measure of relative poverty is the proportion of a nation’s population with less than 40 percent16 of that nation’s median adjusted disposable income for individuals, adjusted for household size. Based on this standard, the United States is first in poverty (10.7 percent) among 19 LIS countries, while Australia (7.0 percent) and the United Kingdom (5.7) are third and sixth, respectively (Table 7). Australia, the United Kingdom, and the United States thus all have relatively high poverty rates among comparable industrialized countries. Poverty among the elderly. Poverty among the elderly follows somewhat different patterns. Again using relative poverty rates, Smeeding et al. (2002) found that the elderly in both Australia and the United States had substantially higher poverty rates in the mid-1990s (12.2 percent and 12.0 percent,17 respectively) than the overall population (Table 7). The United Kingdom had the lowest elderly poverty rate of the three countries for which data on elderly poverty were available and was the only country with less poverty among the elderly than in the overall population. Elderly poverty in Chile is not easily compared with that in the other three countries. Poverty among the urban elderly appears to be lower than among the urban nonelderly population. Poverty rates are highest among children (about 20 to 44 percent in urban areas and 44 to 71 percent in rural areas), about one-third lower among adults ages 18 to 59, and generally about one-third lower again among the urban elderly. In contrast, the rural elderly, especially women, are as likely or more likely to be poor as adults of working age (Cox-Edwards 1999). Conclusions The United States shares certain economic features with Chile, Australia, and the United Kingdom, including high rates of poverty relative to comparable countries and lower labor force participation and earnings among women than among men. The United States also differs from these countries. Per capita income is higher. American women are also the most likely to work of those in the four countries considered in this report. This pattern gives U.S. women a potentially greater stake in changes to earnings-based pension systems. CHILE The Chilean system of individual accounts was established in 1981. It is the centerpiece of a multi-pillar system that also includes a guaranteed minimum benefit financed by general government revenues and voluntary tax-deductible retirement savings.
16 International comparisons are commonly based on 50 percent of national median adjusted income; the European Statistical Office has recommended 60 percent as a standard (Smeeding et al. 2002). 17 The LIS income definition differs from that used by the U.S. Census Bureau. Consequently, poverty rates reported using the LIS methods differ from those reported in Census publications (Smeeding et al. 2002).

9
The new system replaced a pay-as-you-go defined benefit18 system that was the oldest social insurance system in the Americas, dating to the 1920s. The old system was fragmented, consisting of over 150 separate systems (Wiatrowski 1998). It was badly managed and subject to political manipulation (Acuna and Iglesias 2001). Some 93 percent of retirees received only the minimum pension benefit (Century Foundation 1998). Several factors—including lack of confidence in the old system, an aggressive communications campaign promoting the new system, and lower contribution rates than under the old system—made transfer to the new defined contribution19 system attractive. A separate law made employees responsible for their contributions. A wage increase in proportion to the contributions in force under the old system further encouraged transfers, since employees transferring to the new system kept the difference between the payroll taxes imposed in the old and new systems (Acuna and Iglesias 2001). The system continues to evolve. Between 1981, when the original law was enacted, and 1996, 33 laws introduced 412 modifications to the pension system (Acuna and Iglesias 2001). Most of these modifications have concerned investment regulation and benefit rules. Eligibility and Participation Workers who began employment after January 1, 1983, were required to join the system, but those already working were not. Participation in the system is mandatory for employed workers and discretionary for the self-employed. Not all participants in the old systems are included in the new system; the military continue to be covered under the old system, for example. By the end of 1983, 77 percent of workers covered by social security had transferred to the Administradoras de Fondos de Pensiones20 (AFP) system (Acuna and Iglesias 2001). Measuring coverage under the Chilean system is a complex task. One measure of coverage often used has been enrollment in the system, called “affiliation.” But affiliation has consistently exceeded employment since the mid-1990s. For example, the system reported 5.3 million affiliates as of December 1995, even though total employment in that month was less than 5.2 million (Superintendencia de AFP 2002a and Central Bank of Chile 2002). By the end of 2001, the excess of affiliates over those employed (including both employees and independent or self-employed workers) had widened to almost 1 million people, with 6.4 million affiliates, but less than 5.5 million total employment. This problem may arise in part because inactive affiliates, or
18 In a defined benefit plan, benefits awarded at retirement are based on a formula that incorporates pre-retirement wages and years of service. Benefits may be fully advance-funded, financed on a pay-as-you-go basis with no advance contributions, or by a combination of these approaches. 19 In a “pure” defined contribution plan, benefits at retirement depend solely on contributions and investment earnings on those contributions accumulated in each participant’s individual account. The Chilean system represents a modified version of a defined contribution plan, since lifetime retirement benefits for some participants will exceed the value of their accounts at the point of retirement due to the operation of various guarantees (see Benefits, below). 20 Pension Fund Administrators.

10
even those who leave the labor force, are not removed from the affiliation records (Bravo 2001).21 Since benefits depend on contributions, any year of employment for which a contribution is not made is a year without effective coverage. A more meaningful measure of coverage in any given year is therefore the ratio of contributors to the employed workforce (see, for example, Bravo 2001). Fewer than 52 percent of the active workforce contributed to a retirement plan in 2001 (author’s calculation based on Superintendencia de AFP 2002a and Central Bank of Chile 2002). This ratio implies an effective pension coverage rate of almost 56 percent for women and almost 50 percent for men in 2001 (author’s calculations based on ILO 2003, Superintendencia de AFP 2002a, and Central Bank of Chile 2002). Contributions The system requires contributions of 10 percent of pay22 plus 2 to 3 percent for group insurance benefits and administrative costs. The old system’s contribution rates were about 30 percent higher (Acuna and Iglesias 2001). An estimated 68 percent of employees contribute to their pension plans on a regular basis (Bravo 2001). In contrast, among the self-employed or independent workers, who account for 27 percent of the labor force, only 4 percent make regular contributions. Employees make their contributions not directly, but through their employer. Some employers have in the past failed to pass on employees’ contributions to their designated pension funds. As of 1996, over 150,000 court cases were pending in Chile over this problem (Century Foundation 1998). Law No. 19,720, which took effect on May 7, 2001, provided a limited one-time amnesty aimed at encouraging employers to make good on their arrears (Superintendencia de AFP 2002b). Administrative Costs Pension funds may charge fees on new accounts, mandatory contributions, voluntary contributions, transfers from one pension fund to another in excess of two transfers per year, and scheduled withdrawals. Fees may be stated as fixed amounts, as a percentage of the contribution, or both. Fees are charged only on contributions and not on the basis of account assets. Accounts with no current contributions are thus not assessed fees (Kritzer 2000). Some observers argue that the fee structure is high (see, for example, Bravo 2001, Kay and Kritzer 2001). The Chilean government has taken steps to increase competition among pension funds, protect consumers, and discourage frequent transfers among funds that tend to increase 21 Australia and the U.K. have programs reuniting participants with lost accounts. These programs are discussed in each country’s section later in this report. No information about any such program in Chile was available. 22 In Chile, many financial values—such as tax brackets, interest on investments, and various statutory wage and benefit limits—are expressed in “units” rather than in currency terms, as a way to index for inflation. The government issues new values for these units on a monthly basis to reflect changes in the price level. The number of units represented by each transaction—a wage payment, for example—remains unchanged, but its current value rises. Wages are stated in development units (Unidad de Fomento, or UF). Contributions are payable on monthly wages from a minimum of just under 9 UF (as of November 2002) to a maximum of 60 UF.
11
the funds’ sales and marketing expenses (Kay and Kritzer 2001). The agency responsible for supervising the pension funds also promulgated regulations limiting these costs in July 2002 (Superintendencia de AFP 2002c). Administrative costs have been assessed in terms of their impact on investment earnings, high and low earners, and retirement incomes, and have also been compared with international standards. Some implications for women can be drawn from these assessments. Impact on investment returns. Pension funds are required to maintain a minimum rate of return.23 As a result of this requirement, pension funds tend to invest their assets to match their competitors’ performance (Kritzer 2000, Acuna and Iglesias 2001). Since its inception, the pension fund system as a whole has earned an average annual real rate of return of 10.7 percent, with individual funds ranging from 10.4 percent to 11.0 percent (Superintendencia de AFP 2002a). After considering administrative costs, average annual net returns ranged from 7.2 percent at the lowest monthly earnings level subject to contributions to 7.5 percent at the highest level. Administrative costs thus reduce net investment returns by about 300 to 400 basis points (the difference between 10.4 percent to 11.0 percent and 7.2 percent to 7.5 percent). Impact on high and low earners. Average returns conceal considerable differences among pension participants; low earners can pay significantly more in administrative costs as a share of their contributions than high earners. Both the structure and the level of fees influence their impact on various workers. Five funds charge both a fixed and a variable fee on monthly contributions, one only a variable fee, and one only a fixed fee (Table 8). At the lowest monthly income subject to contributions, administrative costs ranged from 8.99 percent to 29.70 percent of contributions as of September 2002 (Table 9). At the highest income, in contrast, administrative costs ranged from 1.02 percent to 24.20 percent of contributions. Both the lowest and the highest earners would pay the lowest commissions as a percentage of contributions to Planvital, a fund that charges the highest fixed fee but no variable fee (Table 9). Commissions are low in Planvital because the fixed fee in that plan is low relative to the variable fees charged by other funds. On the other hand, Cuprum, the only fund with no fixed fee and only a variable fee, is in the middle of the cost range for both high and low earners. Impact on retirement incomes. Another approach to understanding administrative costs is through their impact on lifetime retirement income. Bateman (2001) calculated that administrative fees in Chilean plans reduce lifetime retirement income of participants by about 16 percent. This reduction is lower than in some foreign retirement savings systems but higher than in others. 23 This return has been calculated annually to reflect the performance of all the funds over the past year; the base period for this calculation is being gradually expanded to 36 months (Turner and Rajnes 2001). This guarantee is funded by AFPs, which are required to set aside prescribed amounts in a profitability reserve whenever their investment returns exceed the AFP industry average by a prescribed percentage. Should the profitability reserve be inadequate to fund the investment return guarantee, account holders are then compensated from the AFP’s investment reserves. If these reserves prove inadequate, the AFP is forced to liquidate and the state makes up the shortfall (Gillion et al. 2000).

12
But even the reduction calculated by Bateman may be optimistic for many female participants. Many women have shorter contribution histories than is typical for men. Administrative fees may be especially burdensome for workers with short contribution histories, even yielding negative rates of return for workers contributing for fewer than 20 years (Bravo 2001). International comparisons. It is difficult to decide whether the fee structure is too high without deciding on a standard of comparison. The Chilean system’s administrative costs are comparable to administrative costs in U.S. mutual funds and private employer-sponsored plans (Congressional Budget Office (CBO) 1999). International comparisons can be flawed, however. It is difficult to take account of all relevant factors, including institutional differences. The Chilean system is mandatory, for example, unlike investing in mutual funds or participating in many U.S. employer-sponsored pension plans. Consequently, the U.S. Social Security system might be a better comparison. In 2001, administrative expenses for the Old-Age, Survivors, and Disability Insurance Trust Funds totaled 0.8 percent of total fund expenditures and 0.7 percent of contributions (author’s calculations based on U.S. Social Security Administration 2002b). International comparisons may not be relevant; for example, Chilean workers cannot participate in the U.S. Social Security program or in U.S. private pension plans. Even in relation to Chilean options, however, the pension funds may be costly; one study has concluded that pension fund contributors would have fared better investing their pension funds in regular 90-day passbook accounts than in the pension system (CB Capitales S.A. 2003). Benefits Benefits may be based on one’s own work history, on survivor benefits, and on the guaranteed minimum pension. Own pension. The normal retirement age is 65 for men and 60 for women, with at least 20 years of contributions in any retirement system. Retirement at an earlier age is permitted if the participant’s accumulated assets are sufficient to purchase an annuity of at least 50 percent of the average of the employee’s indexed covered wages for the past 10 years and at least 110 percent of the minimum old age pension. Benefit options. At retirement, the participant may choose among three benefit options: a monthly pension for life, scheduled withdrawals, or a combination of the two. A monthly pension must be indexed for inflation and must provide at least a 60 percent continued pension to the family or disabled husband upon the death of the insured. Scheduled withdrawals are recalculated annually based on the life expectancy of the participant as of the recalculation date. Under the combination option, a single premium life annuity is purchased, and the remainder of the account is paid out as scheduled withdrawals. The first option results in a fixed real benefit, while the benefit payable under the second and third options generally will increase with age.

13
At year-end 2001, 64.0 percent of pensioners had selected an annuity, 33.5 percent had selected scheduled withdrawals, and 2.5 percent had selected the mixed option (calculation based on data in Table 10).24 The proportion of pensioners selecting an annuity has increased over time. Under any option, the participant may withdraw excess assets from the account, providing that one of two conditions is met: (1) an annuity at least equal to 120 percent of the minimum guaranteed pension is purchased, or (2) there are sufficient assets left in the account to make scheduled withdrawals of at least 70 percent of the participant’s prior indexed covered wages. Issues in projecting women’s benefits. Many critics of the Chilean system argue that it is not likely to produce adequate benefits for many workers, particularly women. Arenas de Mesa (1999), for example, has projected that women will account for more than 70 percent of the workers receiving guaranteed minimum pensions, the pensions that go to insured workers who have contributed to the system for at least 20 years but whose individual account pensions fall below a certain level. It is too soon to tell whether these criticisms are valid because there are few retirees with at least 20 years of contributions solely under the individual account system, and even many of these retirees retain partial benefit rights under the old system. Consequently, much analysis of the system’s likely outcomes for women is based on projections. Benefit projections have to be interpreted with care, as much depends on the assumptions used. Two studies have used men’s work careers as a proxy for cohort effects, on the assumption that, as a limit, women’s work patterns could approach those of men. Arenas de Mesa and Montecinos (1999) projected pensions for men and for women under identical wages and contribution years, and found that a woman retiring at age 65 and purchasing an annuity would receive approximately 90 percent of what a man would receive, the difference due to her greater assumed longevity. But women and men have neither the same earnings nor work careers. Economic activity rates among all women age 15 and older ranged from 33 percent to 37 percent between the end of 1992 and 2001, compared with 54 percent to 55 percent for men (ILO 2003). James et al. (2002) explore the effects of differences in earnings, work careers, and retirement ages on men’s and women’s pensions. They find that on average, women in Chile work and contribute to the pension system 70 percent as many years as men. They project that the average woman (that is, with an average-length working career that is shorter than that of the typical man) can expect a monthly annuity of about 30 to 45 percent that of the average man, with the lower ratios occurring at lower educational levels. The average woman’s lifetime—as opposed to monthly—benefit would be slightly higher in relation to that of the average man, because she collects her (lower) annuity for a longer period of time due to both earlier retirement and greater longevity.
24 These data include pensions payable from both Fund 1 and Fund 2. These designations (replaced by Funds A through E as of August 2000) were designed to meet the needs of various workers according to their age and length of time to retirement. Fund 1 was the general fund which could be invested in both stocks and fixed income instruments; Fund 2 was a more conservative fund intended, among others, for disabled participants and for workers within five years of pension age.

14
Raising the annuitization age from 60 to 65 for women could raise women’s annuities by almost 50 percent—even if they do not work the added five years—because interest on the account balance would accumulate for five more years while the annuity would be paid for five fewer years (James et al. 2002). But raising the annuitization age could also make it easier for older women to find employment. If two equally qualified employees, both age 55, one a man and one a woman, are competing for the same job, a rational employer would currently prefer the man, even in the absence of gender discrimination, because he can be expected to stay on the job longer. But even full-career women who work as much as men can expect annuities worth only 65 to 75 percent of those men can expect. Under the estimates reported by James et al., differences in men’s and women’s projected pension benefits primarily represent wage disparities between men and women.25 Using unisex rather than gender-specific annuity tables would raise the ratio of women’s annuities to those of men by 10 to 14 percent, depending on the worker’s level of education (James et al. 2002). The incentives the system provides for women to work—and for those who work, to work longer—are important to any benefit projections. According to one author, “…The fact that the [Chilean] social security reform improved women’s incentives to work for pay offers hopes for changes in behavior that would reduce women’s risk of poverty in old age” (Cox-Edwards 2001). In Chile, as in many other countries, women’s labor force participation is strongly correlated with education, and education levels have been rising over time (James et al. 2002). More Chilean women are, indeed, entering the labor force. Between the end of 1992 and the end of 2001, for example, economic activity rates increased in all five-year age groups between 25 and 59. The largest increases occurred among women ages 30 to 34—over 6 percentage points, for a total of 48.6 percent—and those ages 45 to 49—over 8 percentage points, for a total of 47.9 percent (author’s calculations based on ILO 2003). Overall labor force participation among women still remains low, however. Spousal and survivor benefits. Under the Chilean system, a married man who chooses to receive his benefits in annuity form must purchase a joint annuity that covers his wife’s life as well as his own. A married woman must also do so if her husband is disabled. The spouse may receive the spousal benefit in addition to any benefit available on the spouse’s own account. Spousal benefits are important to women participating in the Chilean system. Spousal benefits are projected to raise women’s lifetime benefits to 70 to 90 percent of those of married men, and for full-career women (those who work as much of their lives as men) to over 100 percent (James et al. 2002). However, women’s rights to spousal retirement benefits are limited compared with those in many other countries. Under a marriage law first enacted in 1884, divorce is illegal in Chile. Couples wishing to end their marriage must instead seek an annulment. Since an annulment implies a legal marriage never existed, former spouses are left with little recourse for legal 25 Sex discrimination is not against the law in Chile (Williamson 1999).

15
support (U.S. Department of State 2001). Ex-spouses therefore have little or no property rights in pension assets accumulated during the marriage. Contribution lapses can erode survivor benefits. Survivor pensions are payable (to widows, disabled widowers, eligible orphans, and dependent parents of active workers) only if the deceased contributed in at least two of the five years before death (Kritzer 2000). Guaranteed minimum pension. The guaranteed minimum pension is available to workers with at least 20 years of coverage (coverage in the old and new systems may be combined for this purpose) but whose accounts do not support the minimum pension required by law, and to those who have chosen scheduled withdrawals but have exhausted their funds by living beyond their actuarial life expectancy. By statute, the minimum pension is linked to prices, but in fact it has been effectively linked to wages through ad hoc adjustments (James et al. 2002). It has been approximately 125 percent of the poverty level, 27 percent of the average male wage, and 37 percent of the average female wage. Any erosion in de facto wage indexing and reversion to statutory price indexing would reduce the protective value of this pension for older women since the minimum pension would replace a lower share of wages. The guaranteed minimum pension is a controversial and important element of the Chilean system. Some observers believe that a majority of future beneficiaries will qualify for no more than the minimum pension, though others dispute this prediction (see, for example, Erlich 2002). While there is disagreement about how many pensioners overall are likely to receive the minimum pension, there is more consensus on its relative importance for women. Many women, especially those with low educational attainment, are likely to receive no more than the minimum benefit (James et al. 2002). Women are also projected to account for the overwhelming majority of minimum pension recipients (Arenas de Mesa 1999). The minimum pension could affect the labor force participation decisions of women and other lower-income workers in several ways. Its availability could draw some long-term workers out of the informal sector into the formal sector for at least the 20 years necessary to qualify for the pension. Women who work are more likely to work in the informal sector than men and tend to accumulate fewer years of work by retirement age (Table 5). Many of the workers entering the formal sector only long enough to earn a minimum pension would thus probably be women. On the other hand, women with low lifetime earnings who might otherwise have worked longer than 20 years might leave the formal workforce and claim pension benefits as soon as their 20 years are complete, since their pension benefit would not increase further for additional years of work. Who Won in the Pension Reform? A thorough assessment of winners and losers in the Chilean pension reform would have to take into account the likelihood that the prior system might never have paid out promised benefits if it had not been replaced.26 Such an assessment would also have to assess the likely fiscal impacts 26 James et al. (2002) provide an overview of the old system’s problems and some of the difficulties in making comparisons between the two systems.

16
of the current system, including what might happen if claimants of the guaranteed minimum pension are more numerous than expected. James et al. (2002) compare the relative positions of various groups of men and women within each system. Comparing men’s and women’s relative positions within each system avoids the need to assess each system’s viability. They assume that all workers contribute to the system consistently and that pensioners annuitize all benefits. Even under these restrictive assumptions, they conclude that the current system provides mixed results for women compared with the prior system:
• Single workers no longer subsidize the spousal benefit for married women. The cost of this benefit is borne fully by husbands.
• The ratio of women’s own annuities to those of men generally worsens in the new
system. • Low earners are projected to benefit more compared with the old system than those with
higher earnings. In the old plan, benefits depended on earnings during the last years of work, when wages tend to be highest for high earners. In the new plan, benefits depend on lifetime earnings. This feature tends to benefit women, whose lifetime age-earnings profiles tend to be flatter.
• Women with the lowest educational attainment do better than under the old system, but
only when the guaranteed minimum pension is added. The guaranteed minimum pension, if indexed to prices as provided by statute, raises the ratio of the average woman’s pension to that of the average man by 7 percentage points in the lowest educational category (incomplete primary education).
• For women with careers equal to those of men, the present value of lifetime benefits
equals or exceeds that of men in the new system when the spousal annuity is included. • Women with lower educational levels are expected to work just enough—20 years—to
qualify for the guaranteed minimum pension. Such behavior would tend to trap them in poverty-level incomes.
• When the benefits from one’s own annuity, the minimum pension, and the spousal
benefit are combined, all groups of women gain compared with their relative position considering only their own annuity and the minimum pension guarantee. But women with completed secondary education still do worse under the new system, relative to men, than under the old system.
In short, the greatest benefits for women in the Chilean system are that married men must select the joint annuity option if they elect to receive their benefits in annuity form, and that widows receive the resulting spousal benefit in addition to their own annuity, if any. Yet single women,

17
who are likely to spend the longest time in the workforce, are becoming more numerous over time and they receive no benefit from either feature (James et al. 2002). Nitsch and Schwarzer (1996) are somewhat more pessimistic, believing that women are among the main losers of the Chilean pension reform. They argue that economic reversals hit women the hardest, resulting in more contribution gaps and increased family responsibilities, while women’s taxable monetary incomes, even when employed, are around 25 percent lower than those of men. They also point out that the reform lengthened the vesting period required to receive full benefits and qualify for the guaranteed minimum pension without allowing for periods spent bearing and raising children. AUSTRALIA Unlike most other developed countries, Australia has never had a national earnings-related pension system based on social insurance principles. Rather, the main component of the system for many years was the age pension, a means-tested benefit financed through general revenues that has been in force since 1909. Benefits under this pension do not depend on earnings. The Australian individual account program was built on a system of private pensions originally provided voluntarily through employers, called superannuation. By the early 1980s, this system covered fewer than 40 percent of workers, primarily at higher earnings levels.27 Superannuation was expanded into the current system in two stages. Disappointed with low coverage in the voluntary system, labor unions negotiated a 3 percent of pay employer pension contribution—for all workers—during central wage bargaining in 1985 and 1986. This system, called Award Superannuation, covered 75 percent of employees by 1991. While Award Superannuation improved coverage compared with the voluntary system, problems remained. Not all employees were covered because not all wages were set by central bargaining, employer compliance among those covered was not universal, and the 3 percent contribution was seen as providing inadequate retirement income (CBO 1999). The Superannuation Guarantee, known widely as “super,” succeeded Award Superannuation starting in July 1992. Eligibility and Participation Age pension. The age of eligibility for the age pension is currently 61 for women and 65 for men, with the age for women scheduled to rise to 65 by July 2013. Means testing for the age pension includes both income and assets. The means-testing standard is liberal; some 84 percent of the elderly qualify for the age pension (CBO 1999). Superannuation guarantee. Coverage applies to all employers and most employees, including those who work part-time, casual or occasional employees, and some who may be considered
27 Some occupational or employer-sponsored superannuation schemes still remain, primarily in the public sector, not-for-profit organizations, and large employers. Since many of these plans have minimum requirements governing hours or contract duration, workers employed part-time or intermittently may not be eligible to participate.
18
contractors for other legal purposes. Self-employed workers are not covered under super but may contribute voluntarily. As of December 1998, 89.7 percent of women workers and 92.5 percent of men workers were covered (Government of Australia undated). But significant differences in coverage between full-time and part-time workers remain. In 1995, the most recent year for which coverage data by hours worked were available for this report, 88.8 percent of full-time women and 85.5 percent of full-time men workers were covered, but only 47.8 percent of men and 66.1 percent of women working part-time were covered (Table 11). Employers do not have to contribute for certain employees, including those paid less than AU$450 in a month (as of September 2002); those age 70 or over; and those under age 18 and working for not more than 30 hours a week. An estimated 10 percent of employees are excluded by virtue of low earnings, most of them women (Olsberg 1997). Also, since the earnings minimum is calculated on a per-employer basis, employees who work for more than one employer in the course of a month may not be covered even if their total earnings meet or exceed the coverage limit. To the extent that women are more likely than men to work at low wages for several employers at once, this provision imposes a particular disadvantage on women in the accumulation of retirement assets. Contributions The required contribution has increased from 3 percent of pay in fiscal year 1992–1993 to 9 percent for the 2002–2003 fiscal year. These contributions also carry eligibility for death and disability coverage. Contributions to any occupational pension fund or contributions required under an award (negotiated agreement) or other employment agreement count toward the required contribution so long as they meet certain standards, including immediate vesting. Contributions exceeding the statutory amount may be subject to more restrictive conditions, such as deferred vesting. Employer deductions for contributions are limited not just as a percentage of pay, but also in nominal terms by age. For 2002–2003, the deduction limit for participants under age 35 is AU$12,651, for those ages 35 to 49 is AU$35,138, and for those age 50 and over is AU$87,141 (Australian Taxation Office (ATO) 2002). These amounts are indexed. Earnings exceeding an indexed quarterly maximum (AU$29,220 for the 2002–2003 fiscal year) are not subject to contributions. Unlike in Chile, the employer selects the super fund for its employees.28 Super is available through over 200,000 funds, ranging from small family-run funds to large industry funds run jointly by unions and employers (ATO 2002). Most of these funds are the so-called “excluded funds,” however, each of which must have fewer than five members, and which together cover only 5 percent of the workforce (CBO 1999). Employers must either remit the full required amount on a timely basis or pay a charge that includes interest and administrative costs. The charge is then redistributed to employees for rollover into their superannuation guarantee account or other retirement plan. Unlike retirement 28 Allowing employees to choose their own fund has been discussed by policymakers, but has not been implemented.

19
plan contributions, payments made under this provision are not tax-deductible to the employer. This requirement is considered to have contributed to high super coverage rates (Mitchell and Piggott 2000). The ATO administers a collection system, called the Superannuation Holding Accounts Reserve (SHAR), to receive small superannuation amounts from employers who are unable to fund a superannuation fund or contribute to a retirement savings account (RSA).29 These accounts are not super accounts and therefore do not provide the death and disability coverage available with those accounts. SHAR is not available to employers covered by central wage bargaining. Administrative Costs Super accounts are subject to administrative and investment fees and charges that are imposed on the basis of account asset values. The administrative costs of the super funds have been widely criticized as excessive (Clare 2001a). These costs have been analyzed from several perspectives. International comparisons. Ross Clare, a researcher employed by the trade association representing super funds, compared the cost of major categories of Australian super funds with some foreign funds (Clare 2001a). He found different results depending on the type of super fund considered; many, though not all, Australian funds were more expensive than large U.S. index mutual funds, defined contribution pension plans, and retail managed investments distributed on an individual basis. However, these comparisons were complicated by intercountry differences in regulation (and associated costs), distribution costs, and account sizes. Impact on retirement income. An alternative approach is to assess the impact of various fees and charges on retirement income. This approach puts all charges on the same footing. An analysis of the Australian system found that participants in some super funds could lose from 10 percent to nearly 30 percent of their retirement savings to fees and charges over the course of their working career (Bateman 2001).30 Given the substantial variation in costs by type of fund, even after controlling for asset size and other features, super participants who chose carefully could preserve more of their assets for retirement. Even the lowest-cost funds cost more to administer than a social insurance system like U.S. Social Security, however. This approach to assessing the impact of fees and charges also has drawbacks. An analytical approach that measures the impact of costs incurred during the working career on income received in retirement has a long time horizon. It assumes that a retirement fund cost structure that works today will continue to do so for the next 40 years (Clare 2001a). But some costs could rise as individual account systems mature, while others could decline if growth promotes scale economies. Small and lost accounts. As in Chile, the number of super accounts has been growing more rapidly than the number of persons participating in the super system (Clare 2001b). Many people must therefore manage several accounts. To the extent that women work part-time or change
29 An RSA is an account offered by banks, building societies, credit unions, life insurance companies, and certain financial institutions. It is used for retirement savings and is similar to a superannuation fund but has lower limits. 30 Since the analysis was by super fund, it was not possible to estimate the number of participants affected.

20
jobs frequently, women in particular could lose track of their super accounts. Small accounts can be particularly affected by administrative costs, since these fees are levied on the basis of account balances. Small and lost accounts were a particular problem in the early days of mandatory super, when relatively small contributions were being made on behalf of a large number of people new to the system (Clare 2001b). Both legislation and regulations now address this problem. Accounts with a balance of less than AU$1,000 must either be protected from administrative costs or transferred to an eligible rollover fund that does provide such protection. The result has been that most funds have “vigorously” transferred out low-balance, inactive accounts (Clare 2001b). The Lost Members Register (LMR) is a central, government-run, register of lost superannuation fund members and RSA holders. The register is designed to reunite participants with their lost accounts. A participant places a query with the ATO, which then conducts a search. If a match is found, the participant is given the information and is responsible for contacting the fund. During 1999–2000, the ATO handled 116,000 participant requests (Clare 2001b). According to the ATO, the “lost benefits” of about 3.8 million super fund members—more than 1 in 3 working-age-Australians—on the LMR add up to nearly AU$7 billion.31 The costs of complexity. In a 1998 survey, 44 percent of Australian women who said they were not planning for their financial future cited the complexity of the decisions needed (Schulz 2000a). While a similar survey for men is not available, it is likely that complexity is not a matter of gender but rather of payoff for the time invested—it may not be worth learning the tax and administrative complexities of super if one is managing only a small account. Women’s super account holdings are smaller than men’s; in the mid-1990s, the average woman’s super account was worth AU$17,000, while the average man’s account was worth AU$42,000 (Rothman 1996). Olsberg (2002) cites survey data supporting the argument that people with low income and few assets see little payoff to retirement planning. But she also cites studies showing that when women have more income and assets they plan at least as well as men—if not better. Benefits Age pension. By law, the starting age pension—the amount payable upon retirement—is set at 25 percent of total male average weekly earnings for a single pensioner and 42 percent for a couple. The pension is then adjusted each March and September for movements in the Consumer Price Index. Compared to most other countries, Australia has a very compressed income distribution for retirees, with most incomes clustered at just above the poverty level (Clare 2001c, Schulz 2000a). This compression reflects broad eligibility for the full age-pension and extensive dependence on it. About two-thirds of all recipients receive the full pension, and the remainder
31 Funds are required to report to the register accounts that have not received contributions in the past two years. As a result, many accounts—possibly up to half—are inactive, rather than lost (Clare 2001a).
21
an amount reduced by the means tests (CBO 1999). In 1995–1996, nearly 77 percent of those age 65 or older depended on the age-pension for their principal source of income (King et al. 1999). Superannuation guarantee. By law, super participants may not access their benefits until age 55, called the pension preservation age. Once the participant reaches age 55, the benefits become available upon retirement. For persons ages 55 to 60, retirement is defined by law as permanent withdrawal from the workforce.32 The access age is scheduled to rise gradually to age 60, with the phase-in beginning in 2015. By 2025, all persons born after June 1964 will have to wait until age 60 to gain access to their superannuation benefits. The super system has been evaluated on several standards of adequacy. Since the age pension is means tested, one standard is the income retirees would need to be independent of the age pension. A report to the Australian government found that superannuation contributions of about 18 percent of earnings would be needed to meet this standard (Fitzgerald 1993).33 Another standard of adequacy is based on whether after-tax retirement income allows retirees to maintain their pre-retirement living standard, after taking account of such factors as the elimination of work expenses. Taking into account a partial age pension, a worker with a final salary equal to the national average weekly earnings would need contributions of 12 percent of pay per year over a 40-year career to achieve a replacement rate of 75 to 80 percent of pre-retirement after-tax income, a widely used adequacy standard (Australian Bankers’ Association (ABA) 2002). However, even among men, only a minority spends even 35 years in the workforce, and women’s careers are often shorter. In 1997, for example, 55 percent of those retired from full-time work were age 54 or younger (author’s calculation based on Australian Institute of Health and Welfare 1999). An average earner with a 35-year career would need annual contributions at 14 percent of pay to achieve the same replacement rate; one with a 30-year career would need 17 percent. A private report suggests that only under the most favorable economic assumptions will the 9 percent of pay contribution rate protect workers from a substantial post-retirement drop in living standards. These assumptions include a 40-year work career; a minimum 5.5 percent annual real rate of return in the pension fund after administrative expenses; and a benefit equally divided between a lump sum and a pension benefit (King 2001). Benefit options. In the past, many casual or temporary workers took their super benefits in a lump sum upon changing jobs or completing a temporary assignment (Clare 2001b). As the super contribution rate has risen and the pension preservation threshold34 has dropped from AU$500 to AU$200, fewer employees are eligible for this option.
32 Some hardship provisions are also available. 33 See also adequacy studies surveyed in Olsberg (2002). 34 The pension preservation threshold is the level of pension savings at which employees are prohibited from cashing out their accumulation upon changing jobs and must roll over their accumulation to another plan.

22
Upon reaching retirement age, participants can take their benefits in either lump-sum or annuity form. Tax laws are intended to provide substantial incentives for retirees to take super benefits at least partially in annuity form. Nevertheless, most super benefits are still taken in lump-sum form (Schulz 2000a, Mitchell and Piggott 2000). One reason may be that the tax treatment of lump-sum benefits is generous enough to cover most workers. 35 This behavior may also reflect a sense of entitlement to the age pension and a willingness to do whatever is needed—even losing money, if necessary—to qualify for it (Olsberg 1997). It is widely believed that super and the age pension represent conflicting values; the former encourages saving, while the latter, through means testing, discourages it (see, for example, Schulz 2000a). The availability of lump sums may also encourage earlier retirement (Edey and Simon 1996). Many participants reportedly use lump sums to finance their living expenses until the age of eligibility for the age pension or to pay down their mortgages, since home equity is not counted in the age pension means test.36 This behavior could reflect super accumulations that are not enough to live on in retirement but are enough to reduce the age pension (Edey and Simon 1996). Any incentives—whether economic or social—to take super benefits in lump-sum form would generally work to the detriment of women due to their longer expected life span. Issues in projecting women’s benefits. The Australian system is more than a decade newer than the Chilean system. Long-term predictions are therefore more tenuous than in Chile. One source of uncertainty, as in Chile, is women’s future labor force participation. Australian women’s labor force participation has been increasing. Between 1994–1995 and 1999–2000, for example, employment among women ages 45 to 54 increased by 5 percentage points to 67.2 percent, and that among women ages 55 to 59 increased by 8 percentage points to 44.5 percent (Clare 2001b). These changes can mean that some women will have improved opportunities to accumulate super balances. As women’s labor force participation increased, however, the female/male hourly earnings ratio declined by 2 percentage points to 89 percent (Clare 2001b).37 This decline could reflect a number of influences—some temporary, others permanent. Women reentering the labor force could have had lower earnings than those already working due to lack of recent work experience.
35 Reasonable benefit limits (RBLs) restrict the lifetime retirement and eligible termination benefits, including lump-sum distributions, that an individual can receive at concessional (reduced) tax rates. Benefits meeting the RBL requirement are subject to tax at 15 percent, while those exceeding this limit are taxed at the maximum rate of 47 percent. For fiscal year 2002–2003, the RBL for lump-sum benefits is AU$562,195. But if at least 50 percent of the super benefit is taken as a pension or annuity that satisfies standards prescribed in the tax code, the much more favorable pension RBL of AU$1,124,384 applies. Of the lump-sum payments received between 1993 and 1996, about 50 percent were under AU$60,000 (Bateman and Piggott 2000). 36 Of balances received at retirement from full-time work in 1997, 26 percent were rolled over, 0.8 percent were used to purchase an annuity, 42 percent were invested, and 12 percent were used to pay off the family home (Bateman and Piggott 2000). The remaining amounts were used for miscellaneous purposes such as buying a car or assisting family. 37 This ratio includes both part-time and full-time workers and thus differs from the ratio presented in Table 5. While the data presented in Table 5 are selected to allow comparisons among similar groups of workers in the four countries considered in this report, the hourly earnings ratio is presented here because it allows the discussion of trends.

23
Work experience could restore or increase their earnings potential. The female/male earnings ratio is also likely to drop if expanded labor force participation brings women into the market whose lifetime wages are likely to be lower than those of women already working. This type of result is less likely to be eliminated by work experience. Ongoing changes in retirement ages present another source of uncertainty in projecting women’s benefits in Australia. At least through the 1990s, early retirement was growing in popularity in Australia. In 1994, for example, 74 percent of men and 87 percent of women had already retired from full-time work during the five-year period preceding their eligibility for the age pension (Australian Institute of Health and Welfare 1999). Scheduled changes in the age at which super can be claimed could discourage early retirement. Even though these changes take full effect far in the future, they could affect women sooner. Women who know they will work longer before claiming their pensions may make different decisions about schooling and on-the-job training throughout their careers, as well as about their hours, the jobs they choose, and how long they stay at their jobs. While such effects are likely, their magnitude is difficult to predict, and they could be influenced by other concurrent long-term trends such as economic growth and changes in social values. Finally, projecting how women will fare under the super program also involves projecting attitudes toward retirement planning in society as a whole. The proper role of the age pension compared with that of super is an important element of such attitudes. To the extent that Australians continue to build their retirement income around the age pension, the role of super in retirement income will be smaller than it otherwise could be. Spousal and survivor benefits. Super has been largely limited to workers. Spousal contributions and a related tax rebate (refund) were introduced in 1997–1998. Taxpayers can claim an 18 percent tax rebate on super contributions of up to AU$3,000 made on behalf of a low-income or nonworking spouse.38 There is no limit on spousal contributions, but contributions above the dollar limit do not benefit from the rebate. Utilization of this opportunity is growing, but accounted for only about 6 percent of taxpayers with dependent spouses in 1998–1999 (author’s calculation based on Clare 2001b). Under the Family Law Legislation Amendment (Superannuation) Act 2001, divorce settlements must now take superannuation assets into consideration. The legislation came into effect on December 29, 2002 and allows separating couples to divide either party’s superannuation assets on marriage breakdown, either through an agreement or by obtaining a court order. There is no provision requiring that an annuity cover the life of a spouse, whether dependent or otherwise. Benefits received as lump sums are fully inheritable by survivors.
38 To be eligible for the full rebate the spouse must be earning AU$10,800 or less in annual taxable income, with a reduced rebate for spouses earning up to AU$13,800.

24
Who Won in the Pension Reform? Winners and losers are more difficult to evaluate in the Australian reform than in the Chilean reform. Australia did not have a baseline defined benefit system with redistributive features, while Chile did. To the extent that the super becomes a broad-based retirement savings system, women are likely to gain by comparison with the prior Award Superannuation system, which was less widespread. Australian women also have the advantage over Chilean women of higher formal labor force participation (though not as high as in the United States) and higher wages relative to men. Finally, unlike the case in Chile, super assets are divisible in divorce under Australian law. On the debit side, however, the current system is not considered likely to provide an adequate retirement income independently of the means-tested age pension—for men or for women—other than under favorable economic and actuarial assumptions. To the extent that women have shorter working careers than men, and earn less during those careers, any shortfall in retirement income will fall heaviest on them. UNITED KINGDOM The U.K. retirement income system consists of the following major components:
• the basic state pension; • the state second pension, an addition to the basic pension, which replaced the state
earnings-related pension (SERPS) in April 2002; • occupational pensions offered by employers; • personal pensions initiated individually or through an employer; and • stakeholder pensions, which can also be initiated individually or through an employer.
The U.K. reform was added to a system that was already complex. The reform was part of a larger set of policies, introduced by the Conservative government headed by Margaret Thatcher, aimed at reducing the government’s role in the economy. Some authors consider only the personal pensions to be “individual accounts” in the same sense as the Chilean system (see, for example, Williamson 2000). Some also consider stakeholder pensions to be prototypical “individual accounts.” To avoid having to make such judgments, the discussion below embraces all the system’s elements, as they can be interchangeable for many participants. Workers can rely entirely on public sector retirement benefits or hold a mixed portfolio of public and private benefits. Those who are offered private benefits, or who choose a personal pension, also have a range of choices. Workers may opt out (contract out) of the state system—and then reverse their decision if their circumstances change. Joining an employer’s pension plan is no longer mandatory. Finally, to understand how the system can work for women, it is necessary to

25
understand both the choices offered to participants and the system’s trajectory over time. As in Chile and Australia, the U.K. system continues to evolve. It has changed several times even before prior changes were fully phased in, and is slated to change further as enacted changes take full effect. Eligibility and Participation The basic state pension. The basic state pension is a flat amount that depends on the number of years for which contributions were credited. A full pension is awarded to workers with contributions for at least 90 percent of their working lives, or ages 16 to 65 for men and 16 to 60 for women. Between 2010 and 2020, the retirement age for women will rise to 65 as well. Persons receiving certain social security benefits, including unemployment or disability benefits, are credited with National Insurance (NI) contributions. Persons who are caring for children under age 6 or for a person with a long-term illness or disability can be credited for such time if it amounts to a full tax year. This time is called Home Responsibilities Protection (HRP). It can reduce the number of qualifying years needed to earn a full basic state pension. The full basic state pension requires 20 years (22 starting in 2020) in addition to any years covered by HRP. Of the total U.K. population over state pension age, 97 percent receive the basic state pension, apparently reflecting the increasing proportion of women qualifying for the basic state pension on their own contributions (Department for Work and Pensions 2002c). This broad eligibility suggests that the long vesting period is not a barrier to earning benefits. SERPS/S2P. SERPS, enacted in 1975 and implemented in 1978, provided an earnings-related supplement to the basic pension. In 1996, 7.5 million workers, or 26 percent of the workforce, were covered by SERPS, with no other pension (Table 12). SERPS has been replaced by the state second pension plan (S2P) for benefit accruals on or after April 6, 2002. SERPS/S2P is available at the same age as the basic state pension. Self-employed persons are not covered by SERPS/S2P. Occupational pensions. Occupational pensions are employer-sponsored plans. Occupational pensions may be defined benefit or defined contribution plans or mixed pensions. Enrolling in an occupational pension is voluntary. An estimated 50 percent of employees eligible to participate in such a pension do so (Blake 2002). Since the establishment of SERPS, employees covered by an occupational pension that provides substantially equivalent benefits have been permitted to contract out of SERPS. In 1996, 9.3 million workers, or almost one in three workers, were covered by contracted-out occupational pensions. Not all occupational pension participants are contracted out, however. In 1996, an additional 1.2 million workers, or 11 percent of participants in occupational plans, were in contracted-in occupational pensions (calculation based on data in Table 12). Some of these workers are contracted-in because their occupational plans do not meet the requirements for a contracted-out pension.

26
Personal pensions. Personal pensions may be established by self-employed persons as well as by employees. Almost one-quarter of all British workers have contracted-out personal pension plans (Table 12). Most of these workers are employees; just over one-fifth are self-employed. Since April 2001, members of an occupational pension who earn less than £30,000 per year (or have additional earnings that are not covered by the occupational scheme) have had the option of contributing up to £3,600 yearly into a personal pension. Stakeholder pensions. These pensions, inaugurated in October 2001, are intended for about 4 to 5 million workers with earnings between 50 percent and 100 percent of the national median and no private pension:
• Employers without occupational pensions are required to offer nominated, or designated, stakeholder pensions unless they have fewer than five employees or offer to contribute at least 3 percent of the employee’s earnings into another nonstate pension.
• Some participants in occupational pensions may be able to contribute to stakeholder
pensions if the contributions to their occupational plan are below Inland Revenue limits.
• Self-employed and unemployed persons are eligible to contribute to a stakeholder pension, as are those not working because they are caring for a child under age 6 or a disabled person, or have a long-term disability themselves.
All stakeholder pensions must be contracted out, but the individual can choose whether to be a contracted-in or contracted-out member of the scheme. Industry sources report that about 2 percent of the target group enrolled in stakeholder pensions in the first year the plans were available (Institute for Payroll and Pensions Management 2002). No coverage. Despite the variety of plans available to British workers, in 1996 over 12 percent had no pension coverage apart from the basic state pension (Table 12). Slightly more than half of these workers were self-employed, and over half of the self-employed have no pension coverage other than the basic pension. Data are not available on how many of these workers are not covered because their earnings are below the coverage threshold (see Contributions, below). Contributions Basic state pensions and SERPS/S2P. Contributions are required of both employees and self-employed workers. Contributions vary by the employee’s earnings (Table 13). Occupational pensions. Employees who contract out of SERPS/S2P into an occupational, personal, or stakeholder pension receive an NI rebate that varies by age and earnings The rebate is intended to reflect the savings to SERPS/S2P from not having the pay the pension to that participant (Heholt 2001).39 The rebate is updated periodically based on economic, demographic, and other assumptions as set by the Government Actuary’s Department (GAD 2000). Tax relief 39 For an employee contracted out into an occupational pension, the employer pays the rebate into the pension rather than to the NI Fund.

27
is also available on employee contributions to occupational pensions, but, unlike the case in personal and stakeholder pensions, is based on the participant’s marginal tax bracket. Over 80 percent of private-sector employees with occupational plans are in contributory plans (CBO 1999). Average combined contribution rates in active plans (those open to new participants) were 16.1 percent of covered earnings in defined benefit plans and 8.5 percent in defined contribution plans in 2000 (GAD 2002). Information on the employer-employee breakdown for defined benefit plan contributions is not available, but in defined contribution plans, employees have typically paid one-third of the total contributions (GAD 2002). Personal pensions. Personal pension contributions also benefit from a payroll tax rebate. Both employers and employees pay the normal amount of payroll tax. The Inland Revenue (tax authority) then pays a rebate on the contributions, together with tax relief on the minimum employee contributions needed for contracting out of SERPS/S2P directly into the employee’s pension fund. The tax relief is available whether or not the participant faces tax liability. The employee contributions needed for contracting out, along with accrued investment earnings, constitute the participant’s “protected rights.” A worker enrolled in an occupational pension plan who has received the rebate for opting out of SERPS/S2P may enroll in a personal pension plan as well if s/he has not reached the Inland Revenue contribution limit (adjusted annually) or if the occupational plan does not offer certain benefits such as a survivor pension. Workers who do not contract out of SERPS/S2P may open personal pension plans, on a tax-deferred basis, but without the payroll tax rebate available to contracted-out workers. Stakeholder pensions. As with personal pensions, stakeholder pensions benefit from a payroll tax rebate that is deposited by the Inland Revenue directly into the pension fund. The tax relief is available whether or not the participant faces tax liability. Administrative Costs Other than in stakeholder pensions, administrative costs in British privatized retirement plans are not regulated (Bateman 2001). SERPS/S2P. SERPS/S2P costs an estimated 1 percent of annual contributions to administer (Crawford 1997). This cost is comparable to that in the U.S. Social Security system. Occupational pensions. Administrative costs in occupational pensions vary with the pension selected by the employer. Personal pensions. Bateman (2001) evaluated three types of pension systems in 11 countries according to the reduction in lifetime accumulations that resulted from administrative fees and charges. Personal pensions were among the plans with the highest administrative charges calculated on this basis, with the typical participant losing about 22 percent of lifetime accumulations to these charges.

28
Stakeholder pensions. Stakeholder pensions were developed in part due to the very large administrative costs associated with personal pensions. Administrative fees in stakeholder pensions are limited to 1 percent of assets. Pension funds may also pass on to participants certain other fees as specified by law and may impose other charges if they are contractually agreed and disclosed, but may not charge participants for stopping or restarting contributions or transferring to another plan. Yet even with the statutory limit imposed on administrative charges in these plans, participants can expect to lose an estimated 19 percent of their retirement income accumulations to administrative costs (Bateman 2001). Some observers expect stakeholder pensions to exert downward pressure on administrative costs in all types of plans by providing an attractive, low-cost product (see, for example, Blake 2002). However, pension providers change their fee structures frequently (Blake 2002). Providers can also impose many different types of charges—for transferring into or out of the fund, for fund management, and for purchasing an annuity, just to cite a few examples—in many different ways. Frequent changes and lack of transparency in fee structure could weaken the competitive impetus that stakeholder pensions might otherwise exert. Independent financial advisors also appear to be recommending personal pensions over stakeholder pensions precisely because the former offer higher commissions, further weakening the competitive impact of stakeholder pensions.40 Small and lost accounts. An estimated 65 to 70 percent of personal pension accounts are active (Liu 1999). Administrative costs can erode inactive accounts, especially smaller ones. The U.K. government’s pension Web site (Department for Work and Pensions 2002b) advises users: “Almost a third of all people who buy personal pensions stop paying into them within three years. Dropping out like this can mean that you lose much of the money you've already paid in.” For job changers and others who may have lost track of pension accounts, the Pension Schemes Registry, operated by the Occupational Pensions Regulatory Authority (OPRA), is available to trace pensions.41 The registry has handled a steadily increasing number of requests—21,000 in 2000/2001—and boasts a 92 percent success rate in matching pensioners with pensions (Blake and Turner 2002). The costs of complexity. The U.K. system is multifaceted enough to allow many different choices for people in different circumstances. This feature is an asset to the extent that people have good information on which to act. The personal pension mis-selling scandal that came to light in the 1990s shows that this criterion may not always be met. Many occupational pension participants were pressured and misinformed into abandoning generous occupational pensions in favor of high-cost personal pensions (for an explanation of the scandal and its consequences, see Gillion et al. 2000). Of course, eliminating individual choice is not always the right answer when choices become complex. If it were, everyone would drive the same make of car, for example. While buying a car is also complex, good information and some degree of reversibility (cars can be traded in)
40 An anonymous reviewer supplied this information. 41 OPRA was established by the Pensions Act of 1995 and supervises a range of legal requirements to protect occupational, personal, and stakeholder pensions.

29
have made the complexity tolerable for most people. In contrast, the U.K. system has yet to develop good information about personal pension costs, and the wrong decision is reversible only by means of paying the cost of transferring balances to yet another pension provider. And the very essence of retirement planning poses a barrier to good decision making in a complex system. Retirement planning requires decades of consistent decision making in support of a distant goal. Olsberg (2002) found in Australia that people with small amounts of money may not see a reason to exert great effort to gather complex information about managing it. They may see even less reason to do so if, as in the U.K. system, that information may change again the next time they need to make a decision. And young workers, who have the most to gain from formulating a good retirement savings plan and sticking to it, are likely to have the twin disadvantages of a distant goal and little disposable income with which to pursue it. In contrast, buying a car is usually an immediate pressure, and dealing with it brings rewards right away. Benefits No projections of income replacement rates in the system are currently available. Both the many paths available to each participant and the system’s ongoing changes complicate such projections. This section outlines projected benefit levels in the system’s major components. Basic state pension. For 2002—2003, the basic state pension pays £75.50 per week—£3,926 per year—for a single person (£120.50 for a couple). In 2002, this amount is roughly the same as the level of earnings below which no payroll taxes are levied. Men with fewer than 44 covered years and women with fewer than 39 years (scheduled to rise to 44 years between 2010 and 2020) receive a pension that is proportionally reduced, but no pension is awarded to workers not qualifying for at least 25 percent of the full pension. A special pension of 60 percent of the basic state pension is payable to persons age 80 and older who are not entitled to the basic state pension or whose earnings history entitles them to less than this amount. Since 1980, the basic state pension has been indexed to prices. Prior to that, the adjustment was the greater of the change in wages or prices. As a result of the change, the maximum pension is expected to decline from 16 percent of average wages in 1998 to 10 percent in 2030—2031 (Schulz 2000b). SERPS/S2P. SERPS was originally designed to replace 25 percent of the worker’s pre-retirement earnings, calculated on the basis of the 20 highest-earning years. Legislation enacted in 1986 reduced the replacement rate to 20 percent between 1999 and 2009 and based the pension on the worker’s average lifetime earnings. Changing the calculation basis to lifetime benefits will lower benefits for workers with irregular work histories (Williamson 2000). While the S2P is currently earnings-based, it will become a flat-rate benefit in 2007. Contracted-out workers could earn only a reduced SERPS benefit between April 1978 and April 1997, and no benefit at all from April 1997 to April 2002. In contrast, some S2P benefits may now be available even if the participant is contracted-out. The S2P gives employees earning up to £24,600 a better pension than SERPS, whether or not they are contracted out, with most help going to those with the lowest earnings (up to £10,800).

30
The S2P is thus directed at workers with low earnings and irregular earnings histories, since its effect is to “top up” low earnings and smooth out irregularities in earnings for the purpose of calculating S2P benefits.42 This feature should be helpful to women, many of whom would fall into these categories. Indexation provisions for the basic state pension and the S2P may outweigh this “woman-friendly” feature of the S2P, however (Ginn 2000). Price indexation will, over time, narrow the gap between pension benefits and the Minimum Income Guarantee (MIG), a means-tested benefit entitlement for the elderly poor. Yet those with some pension income may have too much income to qualify for the MIG and associated benefits (including housing benefits, council (property) tax benefits, interest-free loans, and certain disability-related benefits), yet not enough to keep them out of poverty. Occupational pensions. There are three categories of contracted-out pension plans: contracted-out salary-related (defined benefit) schemes, contracted-out money purchase schemes, and contracted-out mixed-benefit schemes that offer a combination of defined benefit and defined contribution benefits. Each type of pension must meet a standard to be able to accept contracted-out participants. As of mid-2000, 81 percent of participants in active43 occupational pensions were in salary-related (defined benefit) pensions, 16 percent were in defined contribution pensions, and 2 percent were in mixed-benefit types of plans offering the better of the benefits calculated on the two bases (author’s calculations based on GAD 2002). However, as in the United States, the mix of pension types is changing. Over the last three years, for example, around 60 percent of the private sector occupational pensions contracted out on a salary-related basis have closed to new participants and have been replaced by money purchase pensions.44 There were no new salary-related (defined benefit) pensions created over this period. Personal pensions and stakeholder pensions. Personal pensions and stakeholder pensions are subject to the same rules concerning benefits. The rules differ according to whether the benefits are based on the participant’s protected rights (see Contributions, above) or on other contributions, but in all cases a portion of benefits must be annuitized. Annuitization requirements will generally tend to benefit women due to their greater expected longevity if unisex mortality rates are used, as they are for some, but not all, purposes in the U.K. system. Spousal and survivor benefits. Both widows and widowers may claim a basic state pension based on the earnings record of a deceased spouse. A married woman without enough NI contributory years to earn a basic state pension in her own right may qualify for a pension of up to 60 percent of the full basic state pension based on her husband’s earnings record. The couple does not need to cohabit for the wife to qualify.
42 Persons earning less than £10,800 but more than £3,900 in 2002-2003 are treated for S2P purposes as if they had earned £10,800. 43 Active pensions are those open to new participants. A pension may continue to function on behalf of its existing participants without accepting new participants. 44 Personal communication from David Blake.

31
Like the other components of the U.K. system, the structure of spousal and survivor benefits is changing as well. A married man cannot currently qualify for a basic state pension based on his wife’s NI contributions record. However, this will change starting in 2010 when the state pension age for women begins to change. Between 2002 and 2010, the maximum SERPS/S2P pension that can be inherited from a late spouse will be reduced from 100 percent to 50 percent. Occupational pensions may also provide survivor benefits. Since December 1, 2000, couples whose marriage ends in divorce or annulment may share the rights to second pensions, including the additional state pension (SERPS or S2P) and private pensions. A basic state pension is not divisible in divorce, but a divorced spouse can replace his/her earnings record with that of the spouse for the period of the marriage. Issues in projecting women’s benefits. Many of the same issues that arise in Chile and Australia complicate the projection of women’s benefits under the U.K. system. Women may make different decisions about education, childbearing, and the timing and duration of employment when faced with the opportunity to join an individual account system that pays benefits on the basis of earnings. Such changes are occurring throughout the developed world, however, and probably reflect retirement planning only to a small degree. As in Australia and Chile, women’s behavior in the United Kingdom changed during the 1990s. The overall economic activity rate among women ages 16 and older stayed unchanged at about 42 to 44 percent between 1993 and 2001 (ILO 2003). However, the rate among women ages 25 to 34 rose over 4 percentage points to 75.1 percent, while that among women ages 50 and older rose over 4 percentage points to 29.5 percent (author’s calculations based on ILO 2003). These changes, particularly at younger ages, could expand women’s retirement income opportunities. Who Won in the Pension Reform? Much as in Chile and Australia, it is too soon to see all the winners and losers in the U.K. pension reform clearly. While the individual account component of the U.K. system predates those of Chile and Australia, frequent and ongoing statutory changes, along with significant participant mobility within the system, make outcomes difficult to predict. Some preliminary information is encouraging. Between 1979 and 1993, average income among all pensioners increased, though more at higher than at lower incomes (Budd and Campbell 1998). The same pattern continued between 1979 and 1996–1997 (Department for Work and Pensions 2002d). However, most persons receiving pensions over this period did not spend their entire working careers—or even a substantial portion—under the retirement system as it has evolved over the past two decades. The first cohort to opt out of the second-tier pension in large numbers will not begin to retire until around 2020 (Liu 1999). Finally, it is not yet clear whether workers will be able to navigate the relatively complex system to their advantage. For example, workers should consider both their age and their earnings levels in deciding whether and when to contract out of the state second pension—or contract back in.

32
But such decisions could take financial sophistication many people do not have. Schulz (2000b) reports the results of a survey asking women with personal pensions about the benefits—lump sums, survivor benefits, periodic benefits—provided by those plans. From one-quarter to almost one-third of respondents did not know if their plans provided specific benefits. There is also some evidence that mis-selling of personal pensions to workers who have the option to be covered by more generous occupational pensions continues (Schulz 2000b). CONCLUSIONS Absent behavioral changes, the experiences of Chile, Australia, and the United Kingdom provide little reason to believe that women will fare better in individual account retirement systems than they would under traditional social insurance programs with some degree of redistribution built in to protect workers with low-wage or interrupted work careers. Some of these behavioral changes—including increased human capital investment and higher female labor force participation—are happening to some degree throughout much of the world. But both women’s work patterns and their treatment in the workforce have a long way to go to equal those of men. The three systems are not old enough to provide a clear picture of benefits equity and adequacy. The Chilean system is the oldest, but due to the long transition period from the pre-1981 system, there are few full-career retirees dependent only on benefits from the individual accounts system. The U.K. system likewise has a substantial history, but recent major changes complicate predictions. Because these systems are still evolving, any policy conclusions that can be drawn from their current operation are relatively weak. But the experiences of these three countries suggest that several retirement plan features particularly matter in determining outcomes for women. Eligibility and Participation Coverage. Some coverage questions that are important to women concern the presence of an informal sector in the economy, the inclusion of the self-employed, and whether the system imposes participation thresholds based on earnings or hours worked. The presence of a substantial informal sector will tend to reduce the retirement income women can earn since women often work in the informal sector. Exclusion of the self-employed, or their inclusion on a voluntary basis, can have the same effect. More women will also tend to be excluded as an earnings or hours threshold for participation increases. In a social insurance program, broad coverage and enrollment are better from the standpoint of income distribution because periods of coverage are the entry price into the system’s income redistribution. In an individual account plan, in contrast, broad coverage means some people—typically those with low or fluctuating incomes or interrupted work careers—will get little for their contributions. Small accumulations may be physically lost if the participant loses track of them, or lost to administrative fees, or may survive to retirement only to leave their holders in a “pension poverty” trap.

33
Vesting. All three systems studied in this report are “backed up,” though in different ways, by a guaranteed minimum pension benefit. Both the Chilean and U.K. systems require substantial periods of participation and contributions to qualify for the benefit. The longer the contribution period required, the more likely the typical participant is to accumulate a substantial account balance. Long required contribution periods may also mean that even people with substantial covered work histories fail to qualify for the guaranteed minimum benefit at all, or qualify for only part of the minimum. Social insurance programs, in contrast, will tend to have shorter vesting periods. Both social insurance programs and individual account plans can be designed to offer pension credits for time spent out of the workforce. Of the countries considered in this report, only the U.K. system includes this option. The option is available in the basic state pension, the state second pension, and the stakeholder pension. This option mitigates some of the difficulties facing people with interrupted work careers. But credits earned in this way may be low, as in the U.K. basic state and state second pensions (£1 per week per year credited), or may require employee contributions, as in the U.K. stakeholder pension. Public Information. The U.K. experience with mis-selling of personal pensions suggests that when choices are offered, it can be difficult to ensure that people will have the chance to make the right choices for their needs. All three countries are struggling with this issue. While evaluating the quality of public education efforts is outside the scope of this report, the Australian experience can serve as a measure of how difficult this task may be. With the stock market declines of the past few years, many Australian super account holders saw the value of their plans decline in 2001, often by more than the amount of the contributions they had made for the year. But because the program is called the Superannuation Guarantee, and because accumulations must be preserved until retirement age, many irate and confused account holders thought the government had undertaken to protect them from any decline in account value.45 Contributions Contribution rates that are too low can preclude the accumulation of adequate retirement funds. Contribution rates that are too high can discourage participation when it is discretionary, and encourage evasion when it is not. These considerations would seem to be unisex in their impact, but to the extent that women have casual attachments to the labor force, or expect to rely on their husbands’ benefits in retirement, they could disproportionately affect women. Administrative Costs Administrative costs reduce benefits in individual account plans, but not in social insurance programs, where benefits depend on a formula rather than on the account balance. Administrative costs are higher in individual account plans than in the typical social insurance program, though the United Kingdom is attempting to introduce competition on the basis of administrative costs with the statutory limit on administrative costs in stakeholder pensions. 45 I owe this account to an anonymous reviewer.

34
Individual accounts are not centrally held, but are invested in pension funds chosen by the employer or the participant (depending on the country). Problems with multiple small and/or lost accounts have emerged in all three countries. Benefits Work patterns over the life cycle. Whether social insurance plans or individual account plans are better for women can depend on their lifetime labor force participation patterns. Defined contribution systems such as the Chilean system, the Australian super, and the U.K. personal pension and stakeholder pensions, tend to reward work early in life over that later since deposits made early in life earn investment returns over a longer period. In Chile, many women work early in life and do not return to the labor force in later years. In contrast, American women often work early in life, leave the labor force for a period of time when their children are young, then return again when their children are in school. Australia has likewise experienced substantial increases in labor force participation among older women. Women who work later in life would have less time to accumulate substantial balances in an individual account plan system, while a social insurance system can be neutral with respect to the timing of credited work. Form of benefit. All three countries studied in this report permit the withdrawal of at least some retirement benefits in lump-sum form. To the extent that women live longer than men, taking benefits as a lump sum rather than an annuity can hurt them by encouraging early dissipation of retirement balances. On the other hand, women may be deterred from annuitizing their benefits if their annuities are based on gender-segregated actuarial tables. All three countries use gender-segregated actuarial tables for at least some purposes, as do private annuity markets in the United States. Marriage and divorce. Treatment of benefits in marriage, divorce, separation, and widowhood can be complex and no one model applies. Both Australia and the United Kingdom require that pension assets be considered in divorce, though splitting is not mandatory. Indexation. Social insurance benefits are typically indexed, as are the minimum benefits offered in the three countries studied in this report. Indexation helps women to the extent that they live longer than men. Annuities based on individual account balances are sometimes sold with an indexation feature (mandatory in Chile). But this enhancement comes at the expense of a lower initial benefit, discouraging their purchase (Schulz 2000b). Economic opportunities. Economic opportunities constitute one of the most significant unknowns in evaluating individual account plans, especially for women. These opportunities include those in the labor market and those in investment and annuity markets. Even in the United States, where women’s labor force participation is among the highest in the world, living standards are high, and women can call on a number of statutory protections against employment discrimination, women face many economic barriers, including difficulties

35
in combining work and family responsibilities. Many countries offer even more limited opportunities for women, making it less likely that women will be able to earn and save enough for a reasonable retirement income on their own. While labor market opportunities develop and change relatively slowly, conditions in investment and annuity markets tend to change less predictably. Contributors to individual account plans can face the risk of retiring when securities markets are down, interest rates are low, or both. British account holders faced with such circumstances can defer annuity purchase until age 75, but even this window of time may require sophisticated financial planning and a measure of luck. Summary While the three systems considered in this report have not yet produced substantial cohorts of full-career retirees, the evidence to date offers some suggestions for how women may expect to fare. Optimistic projections for improvements in women’s retirement incomes under individual account systems tend to depend on changes in both social attitudes and women’s behavior not yet pervasive anywhere in the world. Unless such changes occur, many women will find it harder to accumulate an adequate retirement income in a system based on individual accounts than they would in a system based on a traditional social insurance program with redistributive features.

36
REFERENCES Acuna, Rodrigo, and Iglesias, Augusto. “Chile’s Pension Reform After 20 Years.” World Bank
Pension Primer 2001. Arenas de Mesa, Alberto. “El Sistema de Pensiones in Chile: Resultados y Desafios Pendientes.”
Encuentro Latinoamericano y Caribeno Sobre las Personas de Edad. Seminario Tecnico, Santiago, Chile, September 1999.
Arenas de Mesa, Alberto, and Montecinos, Veronica. “The Privatization of Social Security and
Women’s Welfare: Gender Effects of the Chilean Reform.” Latin American Research Review 34 (1999): 7–37.
Australian Bankers Association. “Reforming Superannuation: Adequacy and Simplicity.”
Submission to the Senate Select Committee on Superannuation Inquiry into Superannuation and Standards of Living in Retirement. Sydney, Australia, May 2002.
Australian Institute of Health and Welfare (AIHW). “Older Australia at a Glance.” Canberra,
Australia: AIHW, 1999. www.aihw.gov.au. Australian Taxation Office. “Age Based Contribution Limits.” 2002. www.ato.gov.au. Bateman, Hazel. “Disclosure of Superannuation Fees and Charges.” Prepared for the Australian
Institute of Superannuation Trustees. Sydney, Australia, August 2001. Bateman, Hazel, and Piggott, John. “Australia’s Mandatory Retirement Saving Policy: A View
from the New Millennium.” New South Wales: University of New South Wales, 2000. Blake, David. “The United Kingdom: Examining the Switch from Low Public Pensions to High-
Cost Private Pensions.” In Martin Feldstein and Horst Siebert (eds.). Social Security Pension Reform in Europe. Chicago: University of Chicago Press, 2002.
_____. Pension Schemes and Pension Funds in the United Kingdom. (2nd ed.) Oxford: Oxford
University Press, 2003. Blake, David, and Turner, John. “Retirees ISO Their Lost Pensions.” Contingencies
(March/April 2002): 72–74. Bravo, Jorge H. “The Chilean Pension System: A Review of Some Remaining Difficulties After
20 Years of Reform.” Presented at the International Seminar on Pensions, Hitotsubashi University, Tokyo, Japan, March 2001.
Budd, Alan, and Campbell, Nigel. “The Roles of the Public and Private Sectors in the U.K.
Pension System.” In Martin Feldstein (ed.), Privatizing Social Security. Chicago: University of Chicago Press, 1998.

37
CB Capitales S.A. “Comentario Macroeconomico: Rentabilidad real de las AFP’s: algunos comentarios adicionales.” 2003. www.cb.cl.
Central Bank of Chile. “Economic Database: Statistical Tables.” 2002. www.bcentral.cl. Century Foundation, The. “Chile’s Experience with Social Security Privatization: A Model for
the United States or a Danger Sign?” The Century Foundation Issue Brief #4 (June 1998). Clare, Ross. “Are Administration and Investment Costs in the Australian Superannuation
Industry Too High?” Sydney: Association of Superannuation Funds of Australia Research Centre 2001a.
_____. “Women and Superannuation.” The Ninth Annual Colloquium of Superannuation
Researchers, Sydney, July 2001b. _____. “Equity and Retirement Income Provision in Australia.”: Association of Superannuation
Funds of Australia Research Centre, Sydney 2001c. Congressional Budget Office. Social Security Privatization: Experiences Abroad. Washington,
D.C.: U.S. Government Printing Office, 1999. _____. Social Security: A Primer. Washington, D.C.: U.S. Government Printing Office, 2001. Cox-Edwards, Alejandra. “Social Security Reform and Women’s Pensions.” World Bank Policy
Research Report on Gender and Development Working Paper Series No. 17, February 2001.
_____. “Are Social Security Reforms Gender Neutral? Current Estimates of Standards of Living
and Future Prospects for Chilean Elderly Men and Women.” World Bank Research Project on Gender and Social Security Working Paper, September 1999.
Crawford, M. “The Big Pensions Lie.” New Economy 4 (1997): 38–44. Department for Work and Pensions. The Pension Service. State Pensions – Your Guide. London:
The Pension Service, 2002a. _____. Personal Pensions – Your Guide. London: The Pension Service 2002b. _____. “State Pension Summary of Statistics: March 2002c.” www.dwp.gov.U.K. _____. The Pensioners’ Incomes Series 2000/1. London: Department of Work and Pensions,
2002d. Edey, Malcolm, and Simon, John. “Australia’s Retirement Income System: Implications for
Saving and Capital Markets.” Economic Research Department, Reserve Bank of Australia, Research Discussion Paper 9603, September 1996.

38
Enoff, Louis D., and Moffit, Robert E. “Social Security Privatization in Britain: Key Lessons for
America’s Reformers.” The Heritage Foundation Backgrounder No. 1133, August 1997. Erlich, Reese. “Retirement in Chile is a Private—and Heated—Matter.” The Christian Science
Monitor (May 1, 2002): 7. Financial Services Authority. FSA Guide to Annuities and Income Withdrawal. London:
Financial Services Authority, 2002. Fisher, Gordon M. “Is There Such a Thing as an Absolute Poverty Line Over Time? Evidence
from the United States, Britain, Canada, and Australia on the Income Elasticity of the Poverty Line.” U.S. Census Bureau Poverty Measurement Working Papers, August 1995.
Fitzgerald, V.W. National Saving: A Report To The Treasurer. Canberra, Australia: Australian
Government Publishing Service 1993. Gillion, Colin; Turner, John; Bailey, Clive; and Latulippe, Denis (eds.). Social Security
Pensions: Development and Reform. Geneva: International Labour Office, 2000. Ginn, Jay. “Pension Myth-Selling and Gender.” Radical Statistics 74 (Spring 2000).
www.radstats.org.U.K. Government of Australia. “Australian Government Response to the Questionnaire on
Implementation of the Beijing Platform for Action.” Undated. http://www.un.org/womenwatch/daw/followup/Australia.htm.
Government Actuary’s Department. “Occupational Pension Schemes 2000: Eleventh Survey by
the Government Actuary, Preliminary Results for Private Sector Schemes.” London: Government Actuary’s Department, 2002.
_____. “Pension Schemes Act 1993 Rebates and Reduced Rates of National Insurance
Contributions for Members of Contracted-Out Schemes: Consultative Note by the Government Actuary.” London: Government Actuary’s Department, 2000.
Heholt, Mark. “The U.K. State Pensions System.” Presented at the Social Security and Pension
Reform Workshop, Washington, D.C., July 27, 2001. Inland Revenue. Employee’s Guide to Minimum Contributions. Newcastle upon Tyne, U.K.:
Inland Revenue National Insurance Contributions Office, 2002. Institute for Payroll and Pensions Management. “Stakeholder Pensions Target Is Missed.” 2002.
www.ippm.org. Instituto Nacional de Estadisticas. Compendio Estadistico 2000. Santiago, Chile: Departamento
de Servicios al Usuario y Difusion, INE, 2000.

39
International Labour Organization. LABORSTA. 2003. http://laborsta.ilo.org. Ireland, Lola M., and Bond, K. “Retirees of the 1970s.” In Gary S. Kart and Barbara B. Manard
(eds.). Aging in America—Readings in Social Gerontology. Sherman Oaks, CA: Alfred Publishing Co., 1976.
James, Estelle; Cox-Edwards, Alejandra; and Wong, Rebecca. “The Gender Impact of Pension
Reform: A Cross-Country Analysis.” World Bank, August 2002 (draft). Kay, Stephen J., and Kritzer, Barbara E. “Social Security in Latin America: Recent Reforms and
Challenges.” Federal Reserve Bank of Atlanta Economic Review (First Quarter 2001): 41–52.
King, A. Superannuation – The Right Balance? Melbourne, Australia: CPA Australia, 2001. King, Anthony; Walker, Agnes; and Harding, Ann. “Social Security, Ageing, and Income
Distribution in Australia.” Paper prepared for the International Conference on Family, Social Policy, and Financial Strategy, Taipei, Taiwan, April 16–17, 1999.
Kritzer, Barbara E. “Social Security Privatization in Latin America.” Social Security Bulletin 63
(2000): 17–37. Liu, Lillian. “Retirement Income Security in the United Kingdom.” Social Security Bulletin 62
(1999:1): 23–46. Mitchell, Daniel. “Why Critics of Social Security Personal Retirement Accounts Are Wrong.”
The Heritage Foundation Backgrounder No. 1344 (February 2000). Mitchell, Daniel, and O’Quinn, Robert. “Australia’s Privatized Retirement System: Lessons for
the United States.” The Heritage Foundation Backgrounder No. 1149 (December 1997). Mitchell, Olivia, and Piggott, John. “Developments in Retirement Provision: Global Trends and
Lessons from Australia and the U.S.” Pension Research Council Working Paper 2000-2 (February 2000).
Nitsch, Manfred, and Schwarzer, Helmut. “Recent Developments in Financing Social Security in
Latin America.” Issues in Social Protection Discussion Paper 1. Geneva: International Labour Office, 1996.
Olsberg, Diana. Ageing and Money: Australia’s Retirement Revolution. St. Leonards, NSW:
Allen and Unwin, 1997. _____. “Ms…ing Out? Women & Retirement Savings.” Position paper, University of New South
Wales, December 2002.

40
President’s Commission to Strengthen Social Security. Strengthening Social Security and Creating Personal Wealth for All Americans. Washington, D.C.: President’s Commission, 2001.
Rothman, George. Aggregate and Distributional Analysis of Australian Superannuation Using
the RIMGROUP Model. Paper presented to the fourth Annual Colloquium of Superannuation Researchers, Sydney, Australia, July 1996.
Schulz, James H. Older Women and Private Pensions in Australia. Waltham, MA: National
Center on Women and Aging, 2000a. _____. Older Women and Private Pensions in the United Kingdom. Waltham, MA: National
Center on Women and Aging, 2000b. Schulz, James H.; Borowski, Allan; and Crown, William H. Economics of Population Aging:
The “Graying” of Australia, Japan, and the United States. New York: Auburn House, 1990.
Smeeding, Timothy; Rainwater, Lee; and Burtless, Gary. “United States Poverty in a Cross-
National Context.” In S.H. Danziger and R.H. Haveman (eds.). Understanding Poverty. New York and Cambridge, MA: Russell Sage Foundation and Harvard University Press, 2002.
Superintendencia de AFP. “Informacion Estadistica.” 2002a. www.safp.cl. _____. “Preguntas y Respuestas Frecuentes - Reprogramación de las Deudas Previsionales.”
2002b. www.safp.cl. _____. "Communicado de Prensa.” July 5, 2002c. www.safp.cl. Turner, John, and Rajnes, David. "Rate of Return Guarantees in Mandatory Defined
Contribution Plans." International Social Security Review 54 (October-December 2001): 49–67.
United Nations Statistics Division. The World’s Women 2000: Trends and Statistics. New York:
United Nations, 2000. (Selected tables are updated at http://unstats.un.org/unsd/demographic/ww2000/tables.htm)
U.S. Census Bureau. Statistical Abstract of the United States 2001. Washington, D.C.: U.S.
Government Printing Office, 2001. U.S. Department of State. “Chile.” Country Reports on Human Rights Practices – 2000. Bureau
of Democracy, Human Rights, and Labor, February 23, 2001. www.state.gov. U.S. Social Security Administration. “Women and Social Security.” 2002a. www.ssa.gov.

41
_____. 2002 Annual Report of the Board of Trustees of the Federal Old-Age and Survivors Insurance and Disability Insurance Trust Funds. Washington, D.C.: U.S. Government Printing Office, 2002b.
Wiatrowski, William J. “Social Security in the United States and Chile.” Compensation and
Working Conditions (Fall 1998): 12–17. Williamson, John. “Privatizing Public Pension Systems: Lessons for the United States from Latin
America.” Center for Retirement Research Working Paper 1999-03 (November 1999). _____. “Social Security Privatization: Lessons from the United Kingdom.” Center for
Retirement Research Working Paper 2000-10 (November 2000). World Bank. “Poverty and Income Distribution in a High Growth Economy: The Case of Chile
1987-1998.” Report No. 22037 – CH. Washington, D.C.: The World Bank, Poverty Reduction and Economic Management Sector Unit, Latin America and the Caribbean Region, August 30, 2001.

42
TABLES
Table 1 Population by Country, 2000 (in millions)
Country Population Australia 19.1 Chile 15.2 United Kingdom 59.4 United States 283.2 Source: International Labour Organization (2002).
Table 2 Population Age 60 or Older by Country, 2000
Country Percent Age 60 or Older Australia 16.5 Chile 10.5 United Kingdom 20.5 United States 17.7 Source: Author’s calculations based on United Nations Statistics Division (2000).
Table 3 Economically Activea Population Ages 15b to 59 by Country and Gender, 2001 (percents)
Country All Men Women Australia 76.8 84.5 68.9 Chile 59.6 79.0 40.5 United Kingdom c 63.0 71.2 55.0 United States c 78.6 85.1 72.3 a See text for definition. b The lower age limit is 16 in the U.K. and the U.S. c Based on population age 16 and older Source: Author’s calculations based on International Labour Organization (2003).

43
Table 4
Part-time Employmenta by Country and Gender, 2000 (percents) Part-Time as % of all Employees
Country Men Women Women’s Share of Part-Time
Employment
Australia 14 38 67 Chile 8 14 47 United Kingdom 8 41 80 United States 8 19 70 a Workers working fewer than 30 hours per week. This definition is different from that used by the U.S. Bureau of Labor Statistics, which counts as part-time any worker who works fewer than 35 hours in a typical week. The U.S. Fair Labor Standards Act (FLSA) does not define full-time or part-time employment. Source: Australia, U.K., and U.S.: United Nations Statistics Division (2000); Chile: author’s calculations based on Instituto Nacional de Estadisticas (2000).
Table 5 Length of Work Life by Country and Gender (years)
Country Men Women Women/Men Australiaa 38 21 0.55 Chileb 38 27 0.71 United Kingdomc 44 39 0.89 United States d 44 32 0.73 a Average full-time equivalent years of work at retirement. b Average years of work at retirement for secondary school graduates in urban areas who participate in the social security system. See text for further discussion. c Contributory period required to claim the basic state pension. d Median years of work at retirement. Sources: Australia: Clare (2001b); Chile: James et al. (2002); U.K.: Department for Work and Pensions (2002a): U.S.: U.S. Social Security Administration (2002a).

44
Table 6 Female-Male Earnings Ratios by Country, various years
Country Ratio Australiaa 0.85 Chileb 0.73 United Kingdomc .57-.73 United Statesd 0.74 a Ratio of women’s to men’s average weekly ordinary time earnings. b Average monthly wage for workers in urban areas. c Weekly earnings of full-time salaried employees in selected sectors. d Based on full-time, full-year workers ages 25 and older. Sources: Australia: Government of Australia (undated); Chile: James et al. (2002); U.K.: ILO (2002); U.S.: U.S. Bureau of the Census (2001).
Table 7 Overall and Elderly Poverty Rates by Country, various years (percents)
Relative Poverty b Country
Absolute Poverty a Overall Elderly Elderly/Overall
Australia (1994) 17.6 7.0 12.2 1.7 Chile (1998) 17.0 c c c United Kingdom (1995) 15.7 5.7 4.0 0.7 United States (1997) 13.6 10.7 12.0 1.1 a Absolute poverty is defined using the U.S. poverty level for Australia, the United Kingdom, and the United States, and the standard poverty level used in Chile. See text for further discussion. b Measured as income of less than 40 percent of the median disposable income for individuals, adjusted for household unit size (see Smeeding et al. 2001). c Not available. Source: Australia, U.K., and U.S.: Smeeding et al. (2001); Chile: World Bank (2001).

45
Table 8 Chile: Fixed and Variable Administrative Fees by Pension Fund, September, 2002
Percentage Charge Pension Fund
Fixed Charge (in Chilean
pesos (CLP))
Total a Administration
Only Cuprum 0 2.49 1.90 Habitat 790 2.09 1.18 Magister 690 2.55 2.35 Planvital 1,000 2.55 0.00 Provida 390 2.25 1.40 Santa Maria 695 2.29 1.40 Summa Bansander 690 2.33 1.40
aIncludes insurance premiums for survivor and disability coverage. Source: SAFP (2002a).
Table 9 Chile: Administrative Costs as a Percentage of Monthly Contributions, by Pension Fund
and Selected Monthly Incomes, 2002 Income Subject to Contributions
Pension Fund Lowest a Highest a Planvital 8.99% 1.02% Provida 17.51 14.40 Habitat 18.90 12.60 Cuprum 19.00 19.00 Summa Bansander 20.21 14.70 Santa Maria 20.25 14.71 Magister 29.70 24.20
aAs of September 9, 2002, the minimum monthly pay on which retirement contributions were required to be made was 112,200 CLP and the maximum amount was 984,550 CLP. Source: SAFP (2002a).
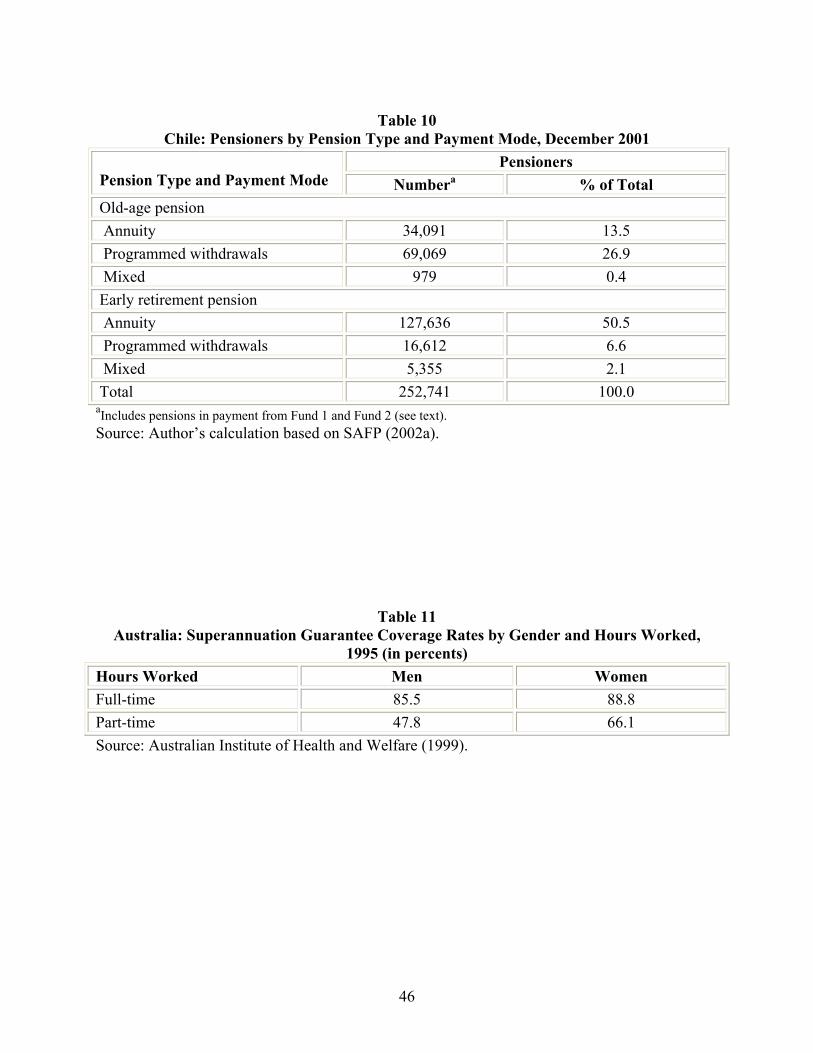
46
Table 10
Chile: Pensioners by Pension Type and Payment Mode, December 2001 Pensioners
Pension Type and Payment Mode Numbera % of Total Old-age pension Annuity 34,091 13.5 Programmed withdrawals 69,069 26.9 Mixed 979 0.4 Early retirement pension Annuity 127,636 50.5 Programmed withdrawals 16,612 6.6 Mixed 5,355 2.1 Total 252,741 100.0
aIncludes pensions in payment from Fund 1 and Fund 2 (see text). Source: Author’s calculation based on SAFP (2002a).
Table 11 Australia: Superannuation Guarantee Coverage Rates by Gender and Hours Worked,
1995 (in percents) Hours Worked Men Women Full-time 85.5 88.8 Part-time 47.8 66.1 Source: Australian Institute of Health and Welfare (1999).

47
Table 12
U.K.: Workforce by Secondary Pension Arrangement, 1996 a Participants
Type of Pension Number (millions) Percent
State earnings-related pension scheme No occupational pension 7.5 26.3 Contracted-in occupational pension 1.2 4.2 Contracted-out occupational pension 9.3 32.6 Personal pension Employee 5.5 19.3 Self-employed 1.5 5.3 No coverage (other than basic state pension) Employee 1.7 6.0 Self-employed 1.8 6.3 Total 28.5 100.0
a Participants may have more than one pension. Percents add to 100 percent because only the principal pension is considered in this table. Source: Author’s tabulation based on Blake (2002).
Table 13 U.K.: Treatment of Earnings for Basic State Pension and SERPS/S2P, 2002–2003
Annual Earnings Basic State Pension SERPS/S2P £3,900 or less Earnings are not credited.a Over £3,900 to £4,615 Earnings are credited toward NI
but no contributions are deducted.
Employees earning over £3,900 to £10,800 are treated as if they had earned £10,800.
Over £4,615 to £30,420
NI contributions are levied. Employers: 11.8 percent of earnings. Employees: 10 percent of earnings.
Over £30,420 Employers: 11.8 percent of earnings. Employees: 0 a Persons in this group may still earn the state pension on other grounds, such as family responsibilities. Source: Inland Revenue (2002).

48
Table 14 U.K.: Benefit Options in Personal Pensions and Stakeholder Pensions
Source of Funds and Benefit Options Date of Benefit Distribution Protected Rights Between 60th and 75th birthdays Annuity based on unisex actuarial tables Income withdrawal (drawdown): 35 percent to 100 percent of single life annuitya Other Contributions Between 50th and 75th birthdays Annuity based on gender-segregated actuarial tables Income withdrawal (drawdown): 35 percent to 100 percent of single life annuitya
a An annuity must be purchased at age 75 with remainder of account. Source: Financial Services Authority (2002).