Embed Size (px)
Citation preview

1
WOMEN AND MEN IN AFGHANISTAN
2011
The Central Statistics Organization (CSO)
in partnership with
The Ministry of Women’s Affairs (MOWA), Afghanistan
Published 2012

2
(Bismillahir Rahamanir Rahim):
In the name of Allah,
The Merciful, the Compassionate
I
FOREWORD
I am very glad that the Central Statistics Organization (CSO) and the Ministry of Women’s
Affairs (MOWA) have jointly updated the baseline handbook on Gender Statistics in
Afghanistan recently, entitled “Women and Men in Afghanistan 2010: Gender Sensitive
Statistics” by collecting additional data from various sources. Women empowerment and
bringing gender perspective in the mainstream of development is a priority agenda of the
Government of Afghanistan. The Government has a put in place a policy framework supportive
of gender equality beginning with the Constitution. It is also signatory to the Convention on
the Elimination of Discrimination against Women (CEDAW). Other notable efforts by the
Government include ratification of the Beijing Platform for Action and mainstreaming gender
equality into major policy frameworks such the Afghanistan Millennium Development Goals
(AMDG), Afghanistan Compact, and the Afghanistan National Development Strategy (ANDS).
More importantly, the Government has developed and adopted the National Action Plan for the
Women of Afghanistan (NAPWA) which serves as its main vehicle for implementing its gender
equality commitments.
Gender statistics and sex disaggregated data are essential components for monitoring progress
in achievement of the NAPWA, its associated National Priority Programs and other related
commitments. This Hand Book has been prepared to provide preliminary baseline data on key
gender indictors of NAPWA which will be enriched progressively as further research is
undertaken. This Hand Book provides key sex disaggregated data based on the NAPWA
Pillars/ sectors, providing a useful data source for planners, administrators, policymakers,
researchers, development partners and gender activists to formulate appropriate programmers
and policies for the development of women.
I would like to express my sincere thanks to the President General, Central Statistics Office
(CSO), Director, MOWA, Country Director and OIC, UN Women Afghanistan, Unit Manager,
ICDU, UN Women Afghanistan and her team including the gender and statistics advisor who
drafted the report, an external editor who helped review the draft report, and the distinguished
members of the Technical Committee for finalizing this handbook.
Suggestions and comments on the report are most welcome.
Ministry of Women Affairs, Government of the Islamic Republic of Afghanistan
II
PREFACE
Sex disaggregated data are a requirement for policy review and a guide for the design and
implementation of development interventions for the women in Afghanistan. As the lead entity
for statistics in Afghanistan, the Central Statistics Organization (CSO) has been generating
statistical data that meets the needs of development planning and policy making. Gender
disaggregated data presented in this publication, are from existing surveys and administrative
records.
In light of the user’s demand for gender statistics, the Women and Men in Afghanistan 2010:
Gender Sensitive Statistics has been compiled by taking published and unpublished data from
different Ministries and Departments of Afghanistan. The framework to compile this updated
gender statistics is based on the baseline gender statistics report of 2008.
This handbook presents the status on women and men in Afghanistan in the six major thematic
areas, namely, Gender and Population; Security, Legal Protection and Human Rights;
Leadership and Political Participation; Economy, Work and Poverty; Health; and Education.
Each chapter presents the latest available statistics on women and men more importantly, it
provides an analysis of the statistics from a gender perspective, revealing existing gender
inequalities and calling attention to issues that must be addressed. Where possible, comparisons
are made with the women’s status in the neighboring countries, particularly in the SAARC
region.
We are grateful to the UN Women Afghanistan for providing financial and technical support in
developing this publication. We also thank the Ministry of Women Affairs (MOWA) for
extending their valuable support in preparation of this report.
I hope that the report will be a useful reference for planners, administrators, policy makers,
development partners and women activists in their quest to develop appropriate programmers
and policies for women’s empowerment and gender equality.
Suggestions and comments for further improvement of the report are most welcome.
Abdul Rahman Ghafoori
The President General
Central Statistics Organization
Government of the Islamic Republic of Afghanistan
III
ACKNOWLEDGEMENTS
The Central Statistics Organization (CSO) and the Ministry of Women’s Affairs (MOWA) are
pleased to convey their most profound gratitude to various ministries and departments, which
were involved in updating this handbook on Gender Statistics of Afghanistan.
This publication would have not been possible without the support of the UN Women
Afghanistan who provided funding and technical support and the distinguished members of
the Technical Committee for finalizing this handbook.
We also express our gratitude to our colleagues in the Central Statistics Organization (CSO) and
the Ministry of Women Affairs (MOWA), for their valuable assistance in planning the data
collection and in supporting us throughout the completion of the updating process. More
importantly, we thank the related ministries and departments who provided the necessary data
on time.
We hope to be able to update this statistics on a regular basis with the same support and
process in the future in order to fulfill the commitment of the Government of Afghanistan to
achieve women empowerment and gender equality.
IV
TABLE OF CONTENTS
FOREWORD ............................................................................................................................................................... I
PREFACE .................................................................................................................................................................... II
ACKNOWLEDGEMENTS ...................................................................................................................................... III
LIST OF TABLES AND FIGURES ....................................................................................................................... VII
ABBREVIATIONS .................................................................................................................................................. XI
EXECUTIVE SUMMARY .................................................................................................................................... XIII
INTRODUCTION .................................................................................................................................................. XVI
Background of the Publication ....................................................................................................... XVII
Target Users ...................................................................................................................................... XVII
CHAPTER 1: GENDER AND POPULATION ...................................................................................................... 1
1.1 Total Population ......................................................................................................................... 1
1.2 Sex Ratios in Settled Population .............................................................................................. 3
1.3 Population By Broad Age Group ............................................................................................. 4
1.4 Location, households and gender ............................................................................................ 6
1.5 Settled population in provinces by sex ................................................................................... 8
1.6 Marital status of settled population by sex ............................................................................ 9
1.7 Returned Refugees ................................................................................................................... 11
1.8 Data Gaps .................................................................................................................................. 12
1.9 Research Needs ........................................................................................................................ 12
CHAPTER 2: SECURITY, LEGAL PROTECTION AND HUMAN RIGHTS ................................................ 14
2.1 Security Situation in Afghanistan .......................................................................................... 14
2.2 State Security Providers .......................................................................................................... 23
2.3 Legal Protection ........................................................................................................................ 25
2.4 Influence and decision making in Legal system .................................................................. 27
2.5 Data Gaps .................................................................................................................................. 30
2.6 Research Needs ........................................................................................................................ 30
CHAPTER 3: LEADERSHIP AND POLITICAL PARTICIPATION .............................................................. 31
V
3.1 Measuring Women’s Empowerment .................................................................................... 31
3.2 Women and Men in Government Services ........................................................................... 33
3.3 Women and Men in Decision Making Positions ................................................................. 43
3.4 Membership composition in National Assembly and Provincial Councils ..................... 50
3.5 Data Gaps .................................................................................................................................. 56
3.6 Research Needs ........................................................................................................................ 56
CHAPTER 4: ECONOMY, WORK AND POVERTY ....................................... Error! Bookmark not defined.
4.1 Gross National Income (GNI) and Per Capita GNI........... Error! Bookmark not defined.
4.2 Gross Domestic Product and PPP Adjusted per Capita GDPError! Bookmark not
defined.
4.3 Level of Poverty ..................................................................... Error! Bookmark not defined.
4.4 Labour Force in Afghanistan ................................................ Error! Bookmark not defined.
4.5 Women in Agriculture and Informal Economy ................. Error! Bookmark not defined.
4.6 Data Gaps ................................................................................ Error! Bookmark not defined.
4.7 Research Needs ...................................................................... Error! Bookmark not defined.
CHAPTER 5: HEALTH ........................................................................................ Error! Bookmark not defined.
5.1 Life Expectancy at Birth ........................................................ Error! Bookmark not defined.
5.2 Infant Mortality Rate (IMR) .................................................. Error! Bookmark not defined.
5.3 Under Five Mortality Rate (U5MR) ..................................... Error! Bookmark not defined.
5.4 Maternal Mortality Ratio (MMR) ......................................... Error! Bookmark not defined.
5.5 Nutritional Status of Children and Women ....................... Error! Bookmark not defined.
5.7 Total Fertility Rate (TFR) and Age Specific Fertility Rate (ASFR)Error! Bookmark not
defined.
5.8 Age at Marriage ...................................................................... Error! Bookmark not defined.
5.9 Proportion of Births attended by Skilled Health PersonnelError! Bookmark not
defined.
5.10 Contraceptive Prevalence Rate (CPR) ..................................... Error! Bookmark not defined.
5.12 Major Causes of Death .......................................................... Error! Bookmark not defined.

VI
5.14 Health Staff /Professionals .................................................... Error! Bookmark not defined.
5.15 HIV/AIDS ................................................................................ Error! Bookmark not defined.
5.16 Data Gaps ................................................................................ Error! Bookmark not defined.
5.17 Research needs ....................................................................... Error! Bookmark not defined.
CHAPTER 6: EDUCATION ................................................................................. Error! Bookmark not defined.
6.1 Primary Education (Grade 1-6) ............................................ Error! Bookmark not defined.
6.2 Secondary Education: Middle School (class 7-9) and High School (class 10-12)....... Error!
Bookmark not defined.
6.3 Tertiary Education (College/ University) .......................... Error! Bookmark not defined.
6.4 Number of Students and Teachers in Technical and Vocational Education by sex . Error!
Bookmark not defined.
6.5 Literacy rate in Afghanistan ................................................. Error! Bookmark not defined.
6.6 Data Gaps ................................................................................ Error! Bookmark not defined.
6.7 Research Needs ...................................................................... Error! Bookmark not defined.
7.0 CONCLUSION ........................................................................................... Error! Bookmark not defined.
REFERENCES ........................................................................................................ Error! Bookmark not defined.
APPENDIX A ......................................................................................................... Error! Bookmark not defined.
VII
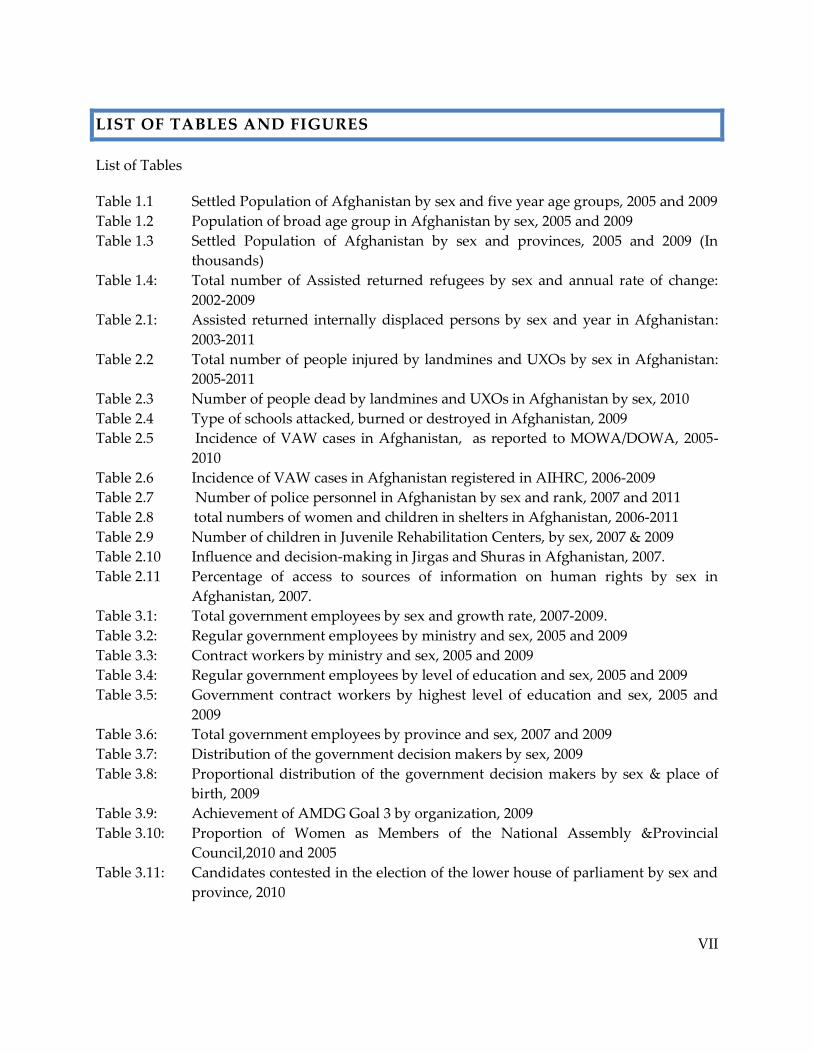
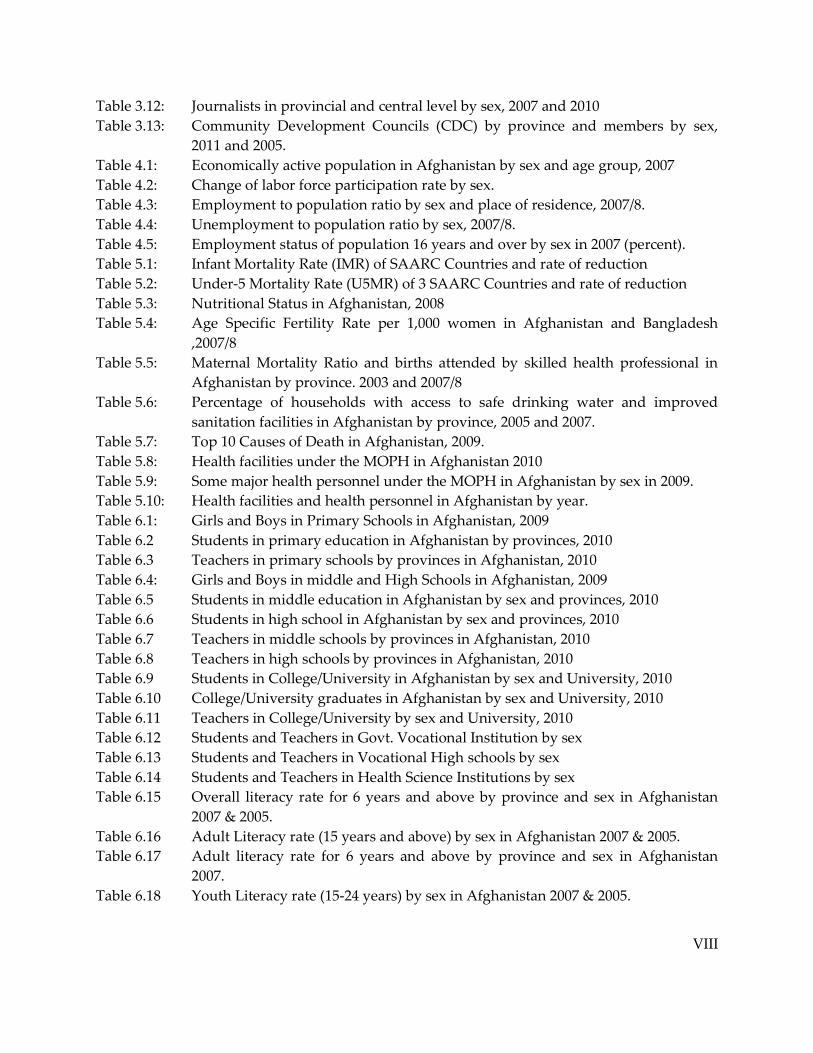
LIST OF TABLES AND FIGURES
List of Tables
Table 1.1 Settled Population of Afghanistan by sex and five year age groups, 2005 and 2009
Table 1.2 Population of broad age group in Afghanistan by sex, 2005 and 2009
Table 1.3 Settled Population of Afghanistan by sex and provinces, 2005 and 2009 (In
thousands)
Table 1.4: Total number of Assisted returned refugees by sex and annual rate of change:
2002-2009
Table 2.1: Assisted returned internally displaced persons by sex and year in Afghanistan:
2003-2011
Table 2.2 Total number of people injured by landmines and UXOs by sex in Afghanistan:
2005-2011
Table 2.3 Number of people dead by landmines and UXOs in Afghanistan by sex, 2010
Table 2.4 Type of schools attacked, burned or destroyed in Afghanistan, 2009
Table 2.5 Incidence of VAW cases in Afghanistan, as reported to MOWA/DOWA, 2005-
2010
Table 2.6 Incidence of VAW cases in Afghanistan registered in AIHRC, 2006-2009
Table 2.7 Number of police personnel in Afghanistan by sex and rank, 2007 and 2011
Table 2.8 total numbers of women and children in shelters in Afghanistan, 2006-2011
Table 2.9 Number of children in Juvenile Rehabilitation Centers, by sex, 2007 & 2009
Table 2.10 Influence and decision-making in Jirgas and Shuras in Afghanistan, 2007.
Table 2.11 Percentage of access to sources of information on human rights by sex in
Afghanistan, 2007.
Table 3.1: Total government employees by sex and growth rate, 2007-2009.
Table 3.2: Regular government employees by ministry and sex, 2005 and 2009
Table 3.3: Contract workers by ministry and sex, 2005 and 2009
Table 3.4: Regular government employees by level of education and sex, 2005 and 2009
Table 3.5: Government contract workers by highest level of education and sex, 2005 and
2009
Table 3.6: Total government employees by province and sex, 2007 and 2009
Table 3.7: Distribution of the government decision makers by sex, 2009
Table 3.8: Proportional distribution of the government decision makers by sex & place of
birth, 2009
Table 3.9: Achievement of AMDG Goal 3 by organization, 2009
Table 3.10: Proportion of Women as Members of the National Assembly &Provincial
Council,2010 and 2005
Table 3.11: Candidates contested in the election of the lower house of parliament by sex and
province, 2010
VIII
Table 3.12: Journalists in provincial and central level by sex, 2007 and 2010
Table 3.13: Community Development Councils (CDC) by province and members by sex,
2011 and 2005.
Table 4.1: Economically active population in Afghanistan by sex and age group, 2007
Table 4.2: Change of labor force participation rate by sex.
Table 4.3: Employment to population ratio by sex and place of residence, 2007/8.
Table 4.4: Unemployment to population ratio by sex, 2007/8.
Table 4.5: Employment status of population 16 years and over by sex in 2007 (percent).
Table 5.1: Infant Mortality Rate (IMR) of SAARC Countries and rate of reduction
Table 5.2: Under-5 Mortality Rate (U5MR) of 3 SAARC Countries and rate of reduction
Table 5.3: Nutritional Status in Afghanistan, 2008
Table 5.4: Age Specific Fertility Rate per 1,000 women in Afghanistan and Bangladesh
,2007/8
Table 5.5: Maternal Mortality Ratio and births attended by skilled health professional in
Afghanistan by province. 2003 and 2007/8
Table 5.6: Percentage of households with access to safe drinking water and improved
sanitation facilities in Afghanistan by province, 2005 and 2007.
Table 5.7: Top 10 Causes of Death in Afghanistan, 2009.
Table 5.8: Health facilities under the MOPH in Afghanistan 2010
Table 5.9: Some major health personnel under the MOPH in Afghanistan by sex in 2009.
Table 5.10: Health facilities and health personnel in Afghanistan by year.
Table 6.1: Girls and Boys in Primary Schools in Afghanistan, 2009
Table 6.2 Students in primary education in Afghanistan by provinces, 2010
Table 6.3 Teachers in primary schools by provinces in Afghanistan, 2010
Table 6.4: Girls and Boys in middle and High Schools in Afghanistan, 2009
Table 6.5 Students in middle education in Afghanistan by sex and provinces, 2010
Table 6.6 Students in high school in Afghanistan by sex and provinces, 2010
Table 6.7 Teachers in middle schools by provinces in Afghanistan, 2010
Table 6.8 Teachers in high schools by provinces in Afghanistan, 2010
Table 6.9 Students in College/University in Afghanistan by sex and University, 2010
Table 6.10 College/University graduates in Afghanistan by sex and University, 2010
Table 6.11 Teachers in College/University by sex and University, 2010
Table 6.12 Students and Teachers in Govt. Vocational Institution by sex
Table 6.13 Students and Teachers in Vocational High schools by sex
Table 6.14 Students and Teachers in Health Science Institutions by sex
Table 6.15 Overall literacy rate for 6 years and above by province and sex in Afghanistan
2007 & 2005.
Table 6.16 Adult Literacy rate (15 years and above) by sex in Afghanistan 2007 & 2005.
Table 6.17 Adult literacy rate for 6 years and above by province and sex in Afghanistan
2007.
Table 6.18 Youth Literacy rate (15-24 years) by sex in Afghanistan 2007 & 2005.
IX
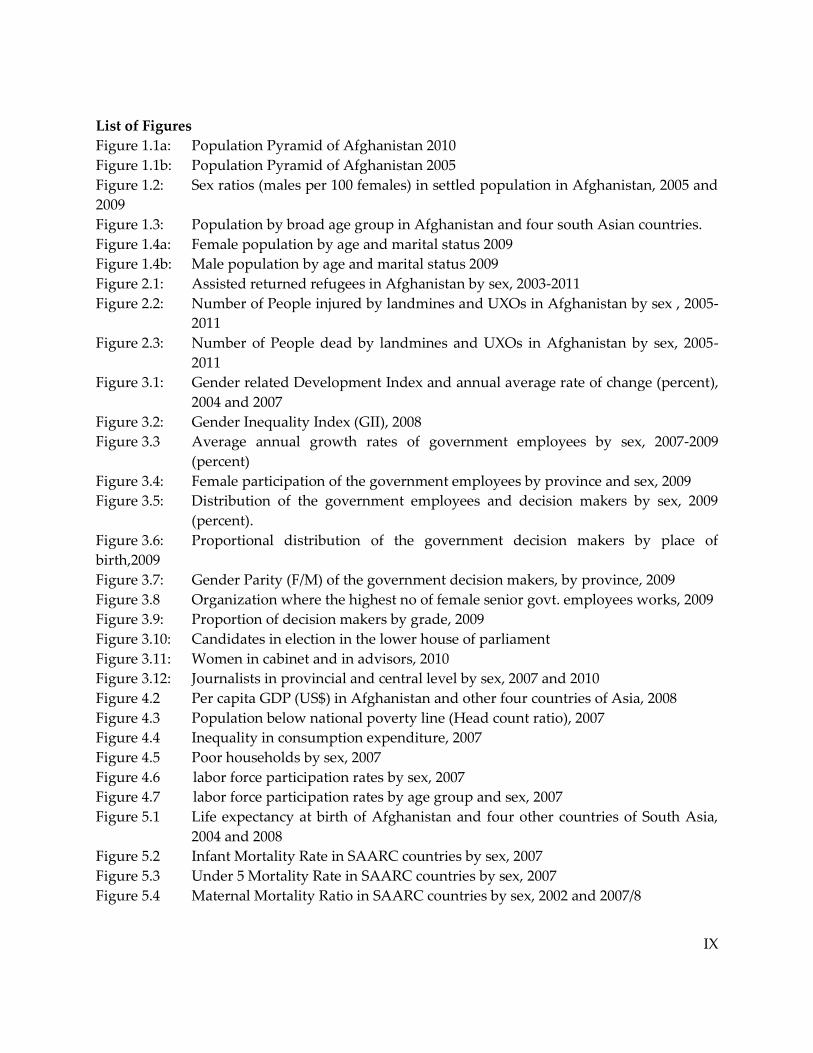
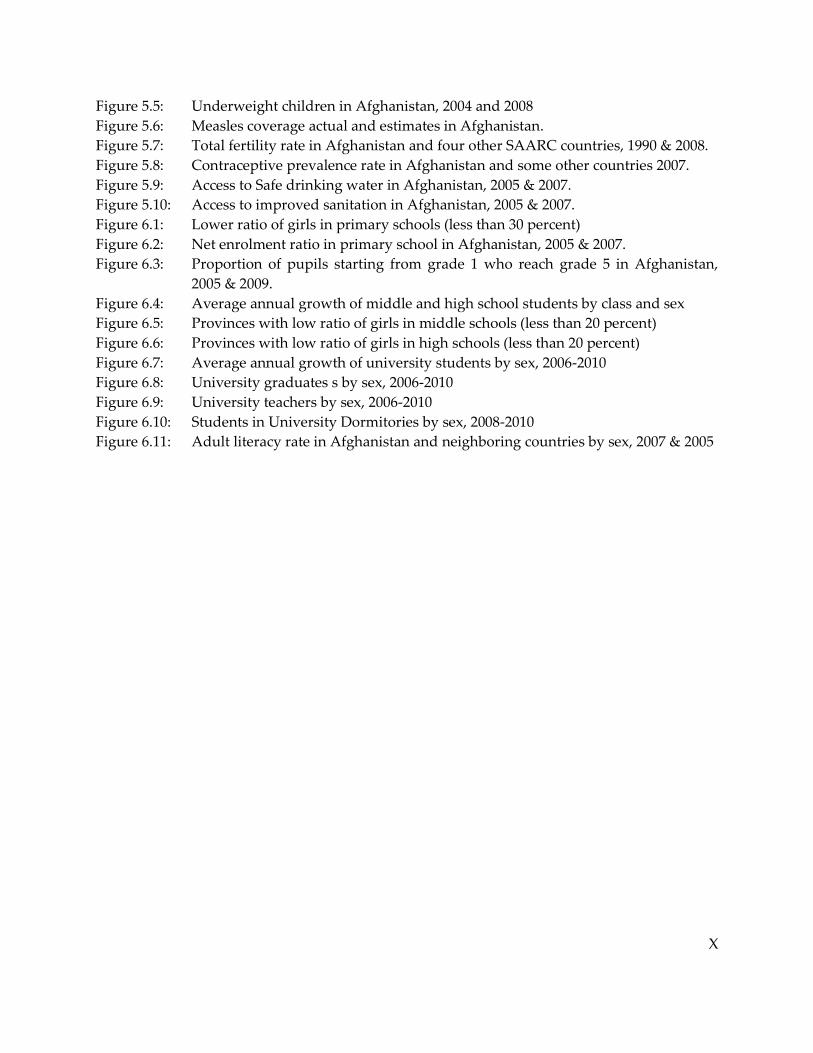
List of Figures
Figure 1.1a: Population Pyramid of Afghanistan 2010
Figure 1.1b: Population Pyramid of Afghanistan 2005
Figure 1.2: Sex ratios (males per 100 females) in settled population in Afghanistan, 2005 and
2009
Figure 1.3: Population by broad age group in Afghanistan and four south Asian countries.
Figure 1.4a: Female population by age and marital status 2009
Figure 1.4b: Male population by age and marital status 2009
Figure 2.1: Assisted returned refugees in Afghanistan by sex, 2003-2011
Figure 2.2: Number of People injured by landmines and UXOs in Afghanistan by sex , 2005-
2011
Figure 2.3: Number of People dead by landmines and UXOs in Afghanistan by sex, 2005-
2011
Figure 3.1: Gender related Development Index and annual average rate of change (percent),
2004 and 2007
Figure 3.2: Gender Inequality Index (GII), 2008
Figure 3.3 Average annual growth rates of government employees by sex, 2007-2009
(percent)
Figure 3.4: Female participation of the government employees by province and sex, 2009
Figure 3.5: Distribution of the government employees and decision makers by sex, 2009
(percent).
Figure 3.6: Proportional distribution of the government decision makers by place of
birth,2009
Figure 3.7: Gender Parity (F/M) of the government decision makers, by province, 2009
Figure 3.8 Organization where the highest no of female senior govt. employees works, 2009
Figure 3.9: Proportion of decision makers by grade, 2009
Figure 3.10: Candidates in election in the lower house of parliament
Figure 3.11: Women in cabinet and in advisors, 2010
Figure 3.12: Journalists in provincial and central level by sex, 2007 and 2010
Figure 4.2 Per capita GDP (US$) in Afghanistan and other four countries of Asia, 2008
Figure 4.3 Population below national poverty line (Head count ratio), 2007
Figure 4.4 Inequality in consumption expenditure, 2007
Figure 4.5 Poor households by sex, 2007
Figure 4.6 labor force participation rates by sex, 2007
Figure 4.7 labor force participation rates by age group and sex, 2007
Figure 5.1 Life expectancy at birth of Afghanistan and four other countries of South Asia,
2004 and 2008
Figure 5.2 Infant Mortality Rate in SAARC countries by sex, 2007
Figure 5.3 Under 5 Mortality Rate in SAARC countries by sex, 2007
Figure 5.4 Maternal Mortality Ratio in SAARC countries by sex, 2002 and 2007/8
X
Figure 5.5: Underweight children in Afghanistan, 2004 and 2008
Figure 5.6: Measles coverage actual and estimates in Afghanistan.
Figure 5.7: Total fertility rate in Afghanistan and four other SAARC countries, 1990 & 2008.
Figure 5.8: Contraceptive prevalence rate in Afghanistan and some other countries 2007.
Figure 5.9: Access to Safe drinking water in Afghanistan, 2005 & 2007.
Figure 5.10: Access to improved sanitation in Afghanistan, 2005 & 2007.
Figure 6.1: Lower ratio of girls in primary schools (less than 30 percent)
Figure 6.2: Net enrolment ratio in primary school in Afghanistan, 2005 & 2007.
Figure 6.3: Proportion of pupils starting from grade 1 who reach grade 5 in Afghanistan,
2005 & 2009.
Figure 6.4: Average annual growth of middle and high school students by class and sex
Figure 6.5: Provinces with low ratio of girls in middle schools (less than 20 percent)
Figure 6.6: Provinces with low ratio of girls in high schools (less than 20 percent)
Figure 6.7: Average annual growth of university students by sex, 2006-2010
Figure 6.8: University graduates s by sex, 2006-2010
Figure 6.9: University teachers by sex, 2006-2010
Figure 6.10: Students in University Dormitories by sex, 2008-2010
Figure 6.11: Adult literacy rate in Afghanistan and neighboring countries by sex, 2007 & 2005
XI
ABBREVIATIONS
AIHRC Afghanistan Independent Human Rights Commission
AMDG Afghanistan Millennium Development Goals
ANDS Afghanistan National Development Strategy
ANA Afghan National Army
ANP Afghan National Police
AISA Afghanistan Investment Support Agency
BPFA Beijing Platform for Action
CDC Community Development Council
CEDAW Convention on the Elimination of all forms of Discrimination against Women
CPR Contraceptive Prevalence Rate
CSO Central Statistics Organization
DHS Demographic and Health Survey
DoWA Department of Women’s Affairs
GDI Gender Development Index
GDP Gross Domestic Product
GEM Gender Empowerment Measure
GII Gender Inequality Index
ICDU Institutional Capacity Development Unit
IDLG Independent Directorate of Local Governance
IDU Inject able Drug Users
IMR Infant Mortality Rate
LFPR Labor Force Participation Rate
XII
MDGs Millennium Development Goals
MICS Multiple Indicators Cluster Survey
MMR Maternal Mortality Ratio/Rate
MoE Ministry of Education
MoJ Ministry of Justice
MoWA Ministry of Women’s Affairs
NGOs Non-Government Organizations
NHDR National Human Development Report
NRVA National Risk and Vulnerability Assessment
NAPWA National Action Plan for the Women of Afghanistan
TFR Total Fertility Rate
SAARC South Asian Association for Regional Cooperation
SRS Sample Registration System
UNAMA United Nations Assistance Mission in Afghanistan
UNMACA United Nations Mine Action Center for Afghanistan
UNFPA United Nations Population Fund
UXO Unexploded Ordnance
VAW Violence Against Women
XIII
Executive Summary
The low socio-economic situation of women and girls in Afghanistan presents a serious
challenge to human development for the country. Their situation is particularly desperate in the
areas of health, human rights, economic productivity, education and literacy, and public
participation in leadership and politics. Yet a systematic and comprehensive approach to
advocacy and policy influencing in the above areas have been slowed down by lack of statistics
in virtually all sectoral areas. This is because the decades of armed conflict made data collection
impossible, not to mention that gender was never treated as a variable in the previous studies.
These factors have made it difficult to capture the status of women and men in various sectors
of life as no data exists in the national records about them.
This Handbook, which is an updated version of the first publication entitled ‘Women and Men in
Afghanistan: Baseline Statistics on Gender’, provides gender statistics which is a consolidated and
reliable source of the evidence needed to bring the concerns of women, girls, boys and men into
public domain for appropriate remedial interventions.
Chapter 1 deals with the theme of “Gender and Population.” The total population of
Afghanistan was estimated at 26 million in 2010, where 24.5 million are settled, and 1.5 million
are nomadic groups. Out of settled population, 12 million (49 percent) were females and 12.5
million (51 percent) were malesData on the population composition pyramid shows that in the
0-4 year age group, 10 percent are girls while 9.5 percent are boys, indicating that more girls
being born than boys. But it might also mean that male-child mortality is higher than female-
child mortality.The pattern changes for the 25-39 year broad age group where females
outnumber males. The shift is explained on war that has claimed the lives of many men and
migration to neighboring counties for employment or higher education.
Chapter 2 deals with “Security, Legal Protection and Human Rights.” It addresses the impact of
violent conflicts on women, especially their participation in security and legal sectors. It
emerges that though combatants are generally males, those who bear the brunt of violence,
displacement, poverty, widowhood and death are mainly women, girls and boys. The girls
suffer threats, kidnappings and other forms Violence against Women (VAW). Data on violence
against women obtained from Ministry of Women’s Affairs (MOWA/DOWA 2005-2010) and
Independent Human Rights Commission (AIHRC, 2011) agree that the top three reported cases
of VAW were beating, forced marriage and lack of economic support from husband. What is
curious about the two studies is their variance. While MOWA reports a decline in VAW
XIV
between 2008 and 2010, AIHRC reports an increase on the same between 2007 and 2009.
Representation of women in security and justice system is also quite low.
Chapter 3 looks at the national landscape of women in leadership and politics. It reveals a
comparative picture of gender related inequality index, women in the government sector,
women and men in decision making positions including community development councils.
According to the CSO Statistical Book, 2008/9 reveals that there are 329,911 employees working
in the government, of which 81.6 percent are male and 18.4 percent are female. This survey
shows that, of the above figure, there are 4,393 government staff holding grade 2 and above
positions. Of these, 4,034 or 91.8 percent are male and only 359 or 8.2 percent are female.
Data analyzed reveals that apart from three ministries, nearly all departments register low
numbers of women in leadership and governance. To meet the target of National Action Plan of
Women of Afghanistan (NAPWA) target of 30 percent representation of women in decision
making positions, the government has to retain all the women currently holding decision
making positions and attain an annual increase of 2.4 percent in the current level of female
representation over the next nine years.
Chapter 4 discusses the statistics showing women’s economic status. An assessment of the
employment and unemployment by sex shows that females are mostly engaged as unpaid
family workers (75 percent). On the other hand, most of the males are working as own account
workers (56 percent). It is also reported that females tend to work more in vulnerable types of
work, with 96 percent as compared to males with 88percent. It is alarming to note that there was
not even one female who worked as an employer, which implies lack of opportunities for
females to progress as leaders in the economic sector.
Chapter 5 contains the current status of women and children with the key maternal and child
health indicators in Afghanistan such as life expectancy at birth; infant, under-5 and maternal
mortality; total fertility rates, contraceptive use, proportion of births attended by skilled health
professionals, immunization coverage and access to improved water and sanitation. The life
expectancy of Afghan women is approximately one half of the highest female life expectancy in
the world, which is Japan at 85.6 years. Curiously, the life expectancy for women in Afghanistan
deviates from world trends. In other countries, women normally live longer than men by an
average of three to six years. In Afghanistan, women’s life expectancy is a little shorter than that
of men. Pregnancy-related conditions remain the main cause of death among Afghan people
since 2002, comprising 23 percent of the total deaths in 2009. This partly explains the short life
expectancy of women and their under-representation in the country’s population.
XV
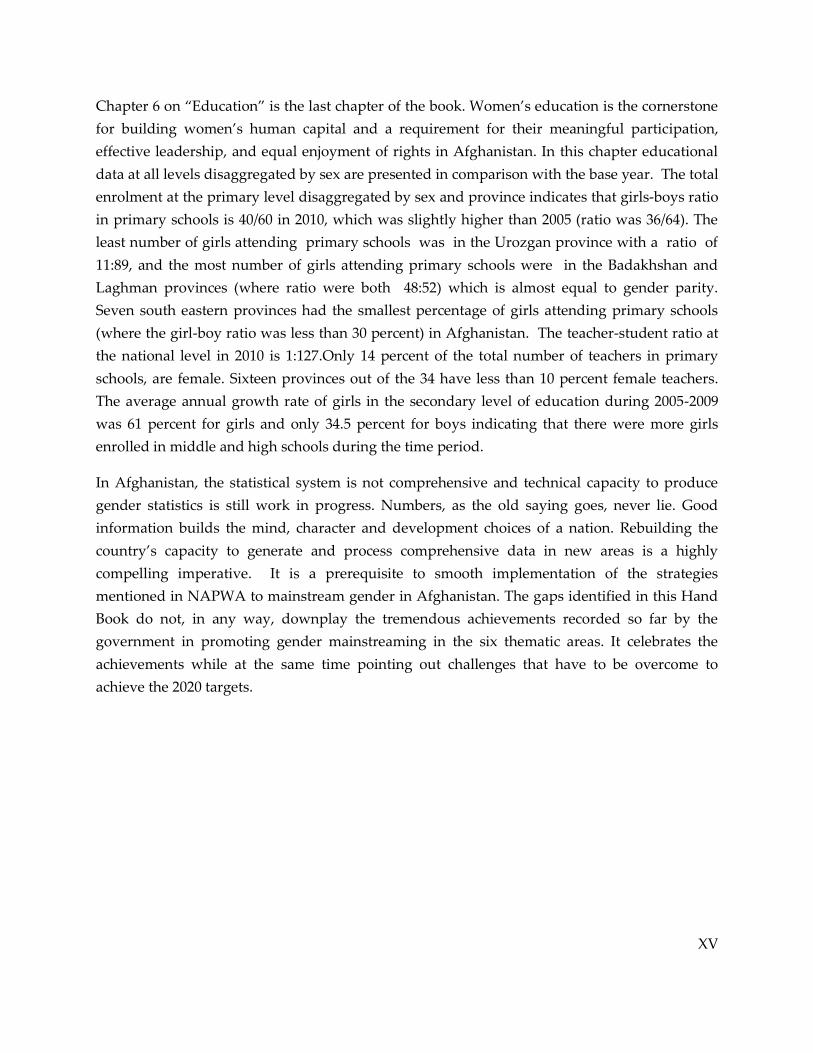
Chapter 6 on “Education” is the last chapter of the book. Women’s education is the cornerstone
for building women’s human capital and a requirement for their meaningful participation,
effective leadership, and equal enjoyment of rights in Afghanistan. In this chapter educational
data at all levels disaggregated by sex are presented in comparison with the base year. The total
enrolment at the primary level disaggregated by sex and province indicates that girls-boys ratio
in primary schools is 40/60 in 2010, which was slightly higher than 2005 (ratio was 36/64). The
least number of girls attending primary schools was in the Urozgan province with a ratio of
11:89, and the most number of girls attending primary schools were in the Badakhshan and
Laghman provinces (where ratio were both 48:52) which is almost equal to gender parity.
Seven south eastern provinces had the smallest percentage of girls attending primary schools
(where the girl-boy ratio was less than 30 percent) in Afghanistan. The teacher-student ratio at
the national level in 2010 is 1:127.Only 14 percent of the total number of teachers in primary
schools, are female. Sixteen provinces out of the 34 have less than 10 percent female teachers.
The average annual growth rate of girls in the secondary level of education during 2005-2009
was 61 percent for girls and only 34.5 percent for boys indicating that there were more girls
enrolled in middle and high schools during the time period.
In Afghanistan, the statistical system is not comprehensive and technical capacity to produce
gender statistics is still work in progress. Numbers, as the old saying goes, never lie. Good
information builds the mind, character and development choices of a nation. Rebuilding the
country’s capacity to generate and process comprehensive data in new areas is a highly
compelling imperative. It is a prerequisite to smooth implementation of the strategies
mentioned in NAPWA to mainstream gender in Afghanistan. The gaps identified in this Hand
Book do not, in any way, downplay the tremendous achievements recorded so far by the
government in promoting gender mainstreaming in the six thematic areas. It celebrates the
achievements while at the same time pointing out challenges that have to be overcome to
achieve the 2020 targets.
XVI
INTRODUCTION
The low socio-economic situation of women and girls in Afghanistan presents a serious
challenge to human development. They are among the worst off in the world, both in
comparison to Afghan men and to women of most countries. Their situation is particularly poor
in the areas of health, human rights, economic productivity, education and literacy, and public
participation in leadership and politics.Yet a systematic and comprehensive approach to
advocacy and policy influencing in the above areas have been slowed down by lack of statistics
on the participation of women in the decision-making processes in Afghanistan. This is because
previous studies have, for a long time, not included gender as one of the units of analysis. This
has made it difficult to capture the status of women and men in various sectors of life as no data
exists in the national records about them.To make women visible, the statistics contained here
attempt, in a modest way, to bring to the fore the realities that define women’s and girls’
marginalization in the Afghan society, steps taken to ameliorate the situation, gains or losses
recorded and what needs to be done to better their situation. This Handbook, therefore,
provides gender statistics which is a consolidated and reliable source of the evidence needed to
bring the concerns of women, girls, boys and men into public domain for appropriate remedial
interventions.
Gender statistics reflect improved statistical systems, and are vital for informed policy and
decision making required to facilitate advances towards achievement of gender equality and
women’s empowerment. Gender statistics provide the basis for analysis of the differences in the
situations and conditions of women and men, girls and boys to lay a foundation
forconcretisation, public debate and change.The production of gender-sensitive statistics does
not involve only the production of sex-disaggregated data. It is just one important component
of gender sensitive statistics. To ensure effective mainstreaming of gender, CSO- Afghanistan
will strive expand this initiative to identify, produce and disseminate sex disaggregated
statistics with respect to all the key sectors in the country to facilitate monitoring changes in the
lives of women and men, girls and boys and for the formulation of appropriate policies, plans
and measures that directly address the core development challenges.Additionally, the
Government of Afghanistan appreciates the need to update gender statistics on a regular basis
in addition to re-evaluating available statistics which were organized without considering
gender as a unit of analysis across all line ministries.
This Handbook is an updated version of the first publication entitled ‘Women and Men in
Afghanistan: Baseline statistics on Gender 2010.’ It illuminates the current status of women and
men, the changes that have occurred in recent years at the national and provincial levels in
XVII
Afghanistan and the gaps that need to be filled. The revision of this publication has been made
possible through the coordinated support from the UN Women, the CSO and MOWA. It is
hoped that the information contained will serve as a practical guide/tool for gender responsive
planning for the country in achieving the ANDS goals by 2020. This publication is designed to
be used by planners, policy and decision makers, program developers and implementers,
researchers, media, teachers, lawmakers and anyone who works for social justice and pro-
people development.
5.6.1 BACKGROUND OF THE PUBLICATION
This is the updated version of the first publication, entitled ‘Women and Men in Afghanistan:
Baseline statistics on Gender’ which aims to highlight the current status of women and men and
also the changes that happened in recent years at the national and provincial levels in
Afghanistan. With support from the UN Women, the CSO and MOWA jointly coordinated the
updating of this publication. The information contained will serve as a practical guide/tool for
gender responsive planning for the country in achieving the ANDS goals by 2020.
Objectives
1. To generate and disseminate data on the key gender concerns as prioritized by the National
Action Plan for Women of Afghanistan (NAPWA) that government and partners can use in
the process of promoting women’s advancement, progress monitoring and reporting;
2. To increase availability and accessibility of gender-sensitive data necessary for better policy
development and targeted service delivery required for the achievement of national
development objectives;
3. Provide a valuable source of gender-disaggregated data to facilitate policy makers,
advocates and development actors explore issues and trends related to gender in
Afghanistan;
5.6.2 TARGET USERS
This publication is designed to be used by planners, policy and decision makers, program
developers and implementer, researchers, media, teachers, law makers and anyone who works
for social justice and pro-people development.
XVIII
Organization of the Publication
The content of this publication begins with an introduction that describes the current status of
women in Afghanistan, the importance of gender statistics, objectives to produce this
handbook. The remaining part follows the six sectoral chapters based on the key priorities of
the National Action Plan for Women In Afghanistan (NAPWA): Gender and Population;
Security, Legal Protection and Human Rights; Leadership and Political Participation; Economy,
Work and Poverty; Health; and Education. Each chapter presents the available statistics on
women and men in that particular sector. More importantly, it gives an analysis of the statistics
from a gender perspective, surfacing the gender inequalities and calling attention to the issues
that must be addressed. Whenever possible, comparisons are made with the women’s status in
the neighboring countries.
1
CHAPTER 1: GENDER AND POPULATION
Gender issues on population reflect the women’s position in the society in terms of population
dynamics like fertility level, mortality, migration and their reasons for migrating, age
composition, population growth etc. The indicators identified herein are sufficient enough to
show how deprived women are in comparison to men.
The chapter presents the sex disaggregated data on population structure by age, population
growth, population by provinces, sex ratio, dependency ratios in recent years. Comparisons are
made by presenting the time series data to come across the changes that happened with the
female population in Afghanistan.
1.1 TOTAL POPULATION
The population of Afghanistan may be classified into two: Settled and nomadic. Settled
population, composed of people who reside in fixed place, whether in rural or urban areas, and
the “nomadic” population, composed of the so-called “kuchis” who do not have permanent
areas of residence.
The total population of Afghanistan was estimated at 26 million in 2010, where 24.5 million are
settled, and 1.5 million are nomadic groups. Out of settled population, 12 million (49percent)
were females and 12.5 million (51 percent) were males. This means that for every 100 females,
there are 105 males in Afghanistan. This is called the sex ratio. This ratio is true for the Kuchi
population as well.
The growth rate of settled population in Afghanistan was estimated by CSO at 2.03 percent per
annum. It is estimated that the settled population will be doubled in the next 35 years if the
growth rate will not reduce significantly. The annual growth rates for males and females are
2.031 percent and 2.029 percent respectively in the same year, which means that there will still
be more men than women among settled population within the time period.
1.2 AGE-SEX COMPOSITION OF POPULATION
The population composition pyramid shows the structure of various age groups disaggregated
by sex. The population pyramids (age, sex & structure) of Afghanistan are presented in the
Figures 1.1a and 1.1b for the years 2010 and 2005, respectively.
2
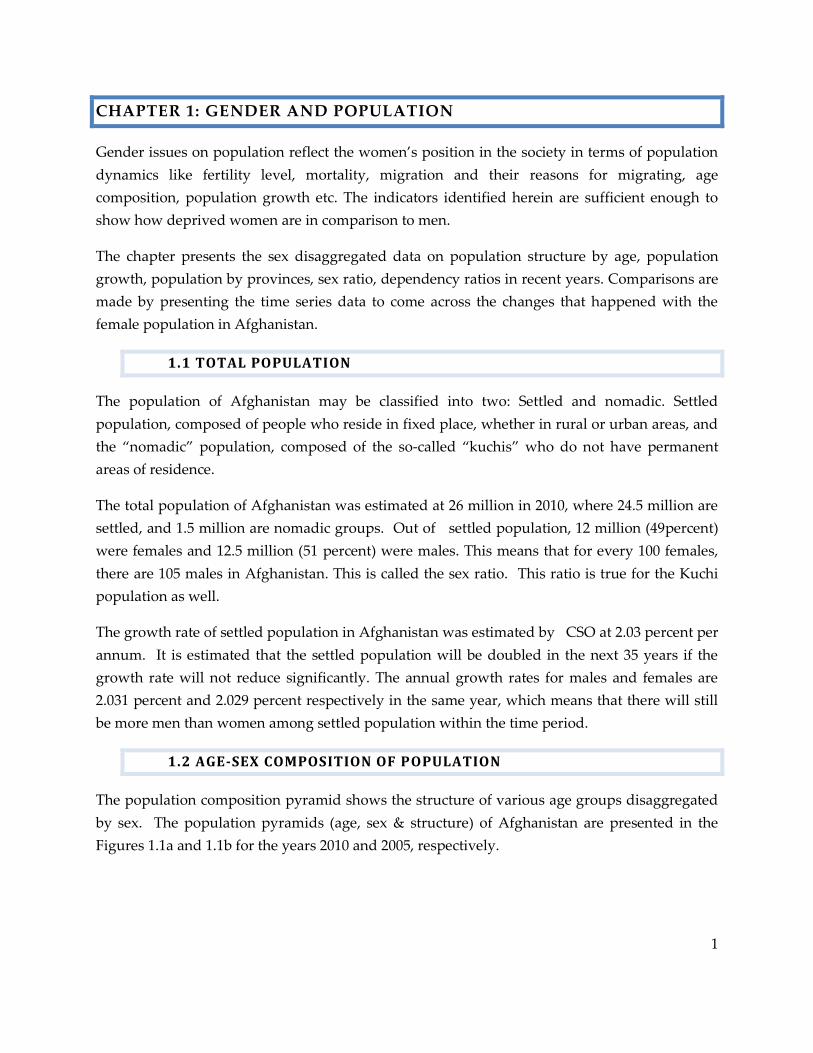
The figures show the distribution of
females and males in 5-year age groups
for 2005 and 2010. The data shows that in
the 0-4 year age group, 10 percent are
girls while 9.5 percent are boys, indicating
that more girls being born than boys. But
it might also mean that male-child
mortality is higher than female-child
mortality. However this assumption
needs further research for verification.
Therefore, there is a need to analyze these
data vis-à-vis infant and child mortality
rates. At the 5-24 year broad age group
however, it is noticeable that there are
more males than females.
On the other hand, it can be seen that there are more females in the 25-39 broad age group.
This may be attributed to several factors like political conflict in Afghanistan where males are
more vulnerable to violence and death caused by these conflicts, and migration to other
countries like Pakistan and Iran for employment.
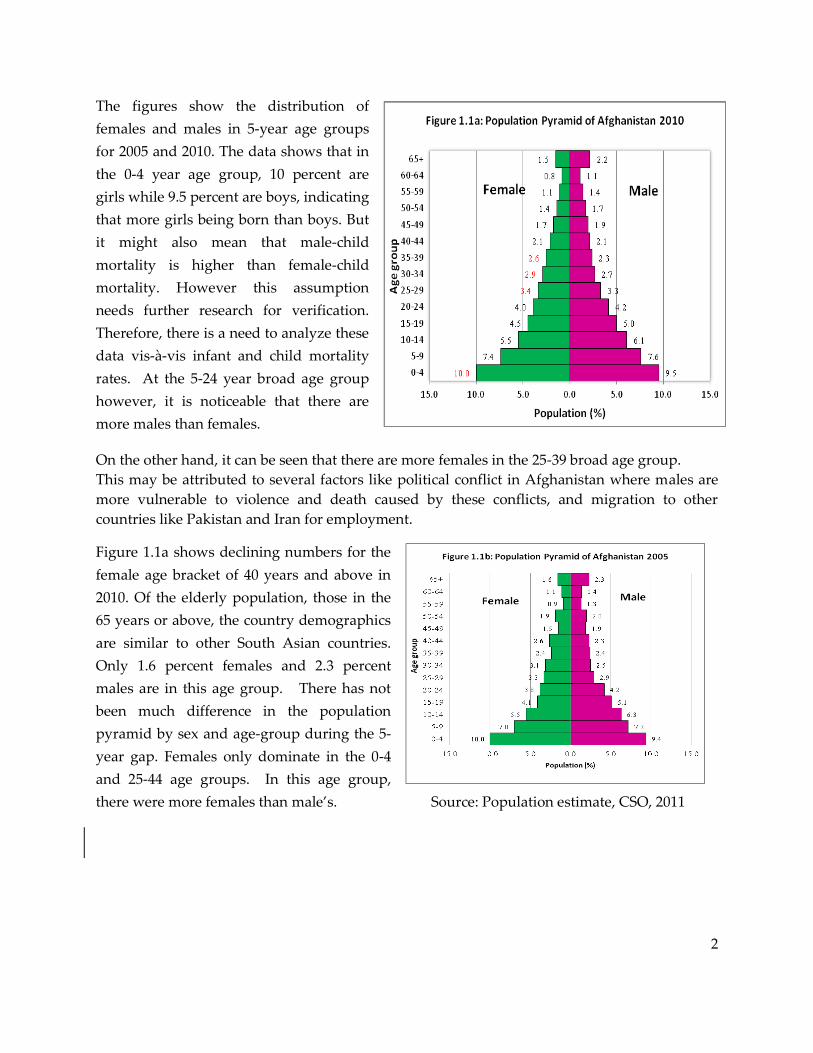
Figure 1.1a shows declining numbers for the
female age bracket of 40 years and above in
2010. Of the elderly population, those in the
65 years or above, the country demographics
are similar to other South Asian countries.
Only 1.6 percent females and 2.3 percent
males are in this age group. There has not
been much difference in the population
pyramid by sex and age-group during the 5-
year gap. Females only dominate in the 0-4
and 25-44 age groups. In this age group,
there were more females than male’s. Source: Population estimate, CSO, 2011

3
5.6.3 SEX RATIOS IN SETTLED POPULATION
Sex ratios among the settled population, for the years 2009 and 2005 by age groups are shown in
Figure 1.2. Sex ratio1 shows the number of males per 100 females. There was no change in sex
ratio in Afghanistan for the years 2005 and 2009. The sex ratio remains that there were 105
males per 100 females. Up to 9 years of age, sex ratio was less than 100 for both the years. There
was not much difference in 2005 and in 2009.
Sex ratios were more than 100 in age 10 -24 years in both the years 2005 and 2009. In 2009, sex
ratios were less than the sex ratios of 2005 except the age groups of 25-29, 30-34 and 40-44. Male
population has decreased from 2005 to 2009, so there was a decline in sex ratios. International
migration in quest of employment/education or male mortality due to conflict might be
probable causes of decline in the sex ratios.
Sex ratios again went down below 100 for the age 25 years to 44 years for both the years 2005
and 2009. This is the working age group and the youth have the option to leave the country or
as mentioned in the above paragraph, there is mortality among males due to conflict.
After the age of 45 years, sex ratios
gradually increased up to more than 140
for both the years 2005 and 2009. This
indicates that in older age group more
men are surviving than women due to
higher mortality of women in those ages.
But this proposition has to be validated
by the age specific mortality rate, which
is not available in Afghanistan at present.
There is no change of average sex ratios
from the years 2005 to 2009, which are
105.
1 Sex ratio implies number of males per 100 females in a country in specific year.
4
Source: Statistical Yearbook, CSO, 2009-10
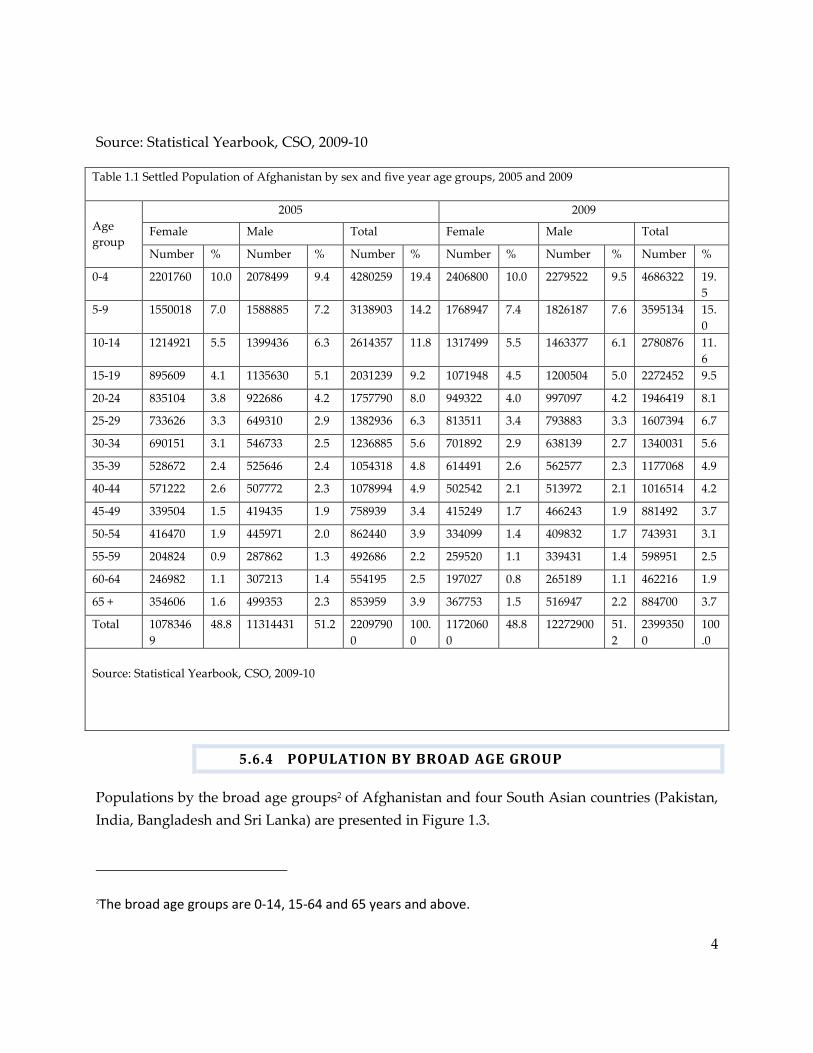
Table 1.1 Settled Population of Afghanistan by sex and five year age groups, 2005 and 2009
Age
group
2005 2009
Female Male Total Female Male Total
Number % Number % Number % Number % Number % Number %
0-4 2201760 10.0 2078499 9.4 4280259 19.4 2406800 10.0 2279522 9.5 4686322 19.
5
5-9 1550018 7.0 1588885 7.2 3138903 14.2 1768947 7.4 1826187 7.6 3595134 15.
0
10-14 1214921 5.5 1399436 6.3 2614357 11.8 1317499 5.5 1463377 6.1 2780876 11.
6
15-19 895609 4.1 1135630 5.1 2031239 9.2 1071948 4.5 1200504 5.0 2272452 9.5
20-24 835104 3.8 922686 4.2 1757790 8.0 949322 4.0 997097 4.2 1946419 8.1
25-29 733626 3.3 649310 2.9 1382936 6.3 813511 3.4 793883 3.3 1607394 6.7
30-34 690151 3.1 546733 2.5 1236885 5.6 701892 2.9 638139 2.7 1340031 5.6
35-39 528672 2.4 525646 2.4 1054318 4.8 614491 2.6 562577 2.3 1177068 4.9
40-44 571222 2.6 507772 2.3 1078994 4.9 502542 2.1 513972 2.1 1016514 4.2
45-49 339504 1.5 419435 1.9 758939 3.4 415249 1.7 466243 1.9 881492 3.7
50-54 416470 1.9 445971 2.0 862440 3.9 334099 1.4 409832 1.7 743931 3.1
55-59 204824 0.9 287862 1.3 492686 2.2 259520 1.1 339431 1.4 598951 2.5
60-64 246982 1.1 307213 1.4 554195 2.5 197027 0.8 265189 1.1 462216 1.9
65 + 354606 1.6 499353 2.3 853959 3.9 367753 1.5 516947 2.2 884700 3.7
Total 1078346
9
48.8 11314431 51.2 2209790
0
100.
0
1172060
0
48.8 12272900 51.
2
2399350
0
100
.0
Source: Statistical Yearbook, CSO, 2009-10
5.6.4 POPULATION BY BROAD AGE GROUP
Populations by the broad age groups2 of Afghanistan and four South Asian countries (Pakistan,
India, Bangladesh and Sri Lanka) are presented in Figure 1.3.
2The broad age groups are 0-14, 15-64 and 65 years and above.
5
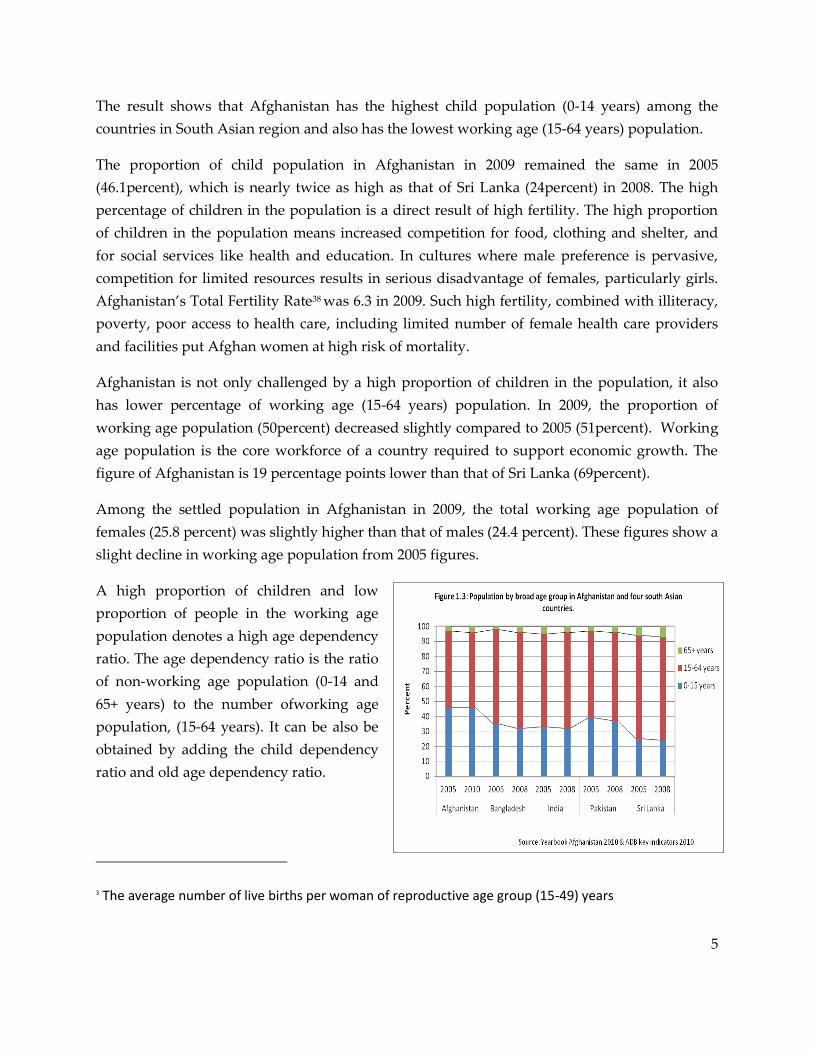
The result shows that Afghanistan has the highest child population (0-14 years) among the
countries in South Asian region and also has the lowest working age (15-64 years) population.
The proportion of child population in Afghanistan in 2009 remained the same in 2005
(46.1percent), which is nearly twice as high as that of Sri Lanka (24percent) in 2008. The high
percentage of children in the population is a direct result of high fertility. The high proportion
of children in the population means increased competition for food, clothing and shelter, and
for social services like health and education. In cultures where male preference is pervasive,
competition for limited resources results in serious disadvantage of females, particularly girls.
Afghanistan’s Total Fertility Rate38 was 6.3 in 2009. Such high fertility, combined with illiteracy,
poverty, poor access to health care, including limited number of female health care providers
and facilities put Afghan women at high risk of mortality.
Afghanistan is not only challenged by a high proportion of children in the population, it also
has lower percentage of working age (15-64 years) population. In 2009, the proportion of
working age population (50percent) decreased slightly compared to 2005 (51percent). Working
age population is the core workforce of a country required to support economic growth. The
figure of Afghanistan is 19 percentage points lower than that of Sri Lanka (69percent).
Among the settled population in Afghanistan in 2009, the total working age population of
females (25.8 percent) was slightly higher than that of males (24.4 percent). These figures show a
slight decline in working age population from 2005 figures.
A high proportion of children and low
proportion of people in the working age
population denotes a high age dependency
ratio. The age dependency ratio is the ratio
of non-working age population (0-14 and
65+ years) to the number ofworking age
population, (15-64 years). It can be also be
obtained by adding the child dependency
ratio and old age dependency ratio.
3 The average number of live births per woman of reproductive age group (15-49) years

6
The child dependency ratio was 9.18 persons per 10 working age population out of the total
settled population of Afghanistan. The old age dependency ratio was 0.73 persons per 10
working age population. Therefore, the age dependency ratio was 9.91 persons per10 working
age population in 2009.
The age dependency ratio of 9.91 per 10 working age population means that, on average, every
10 persons of working age have to support 9.91 non working populations (children and old
age). Population in the age group of 65+ years is still not a concern in Afghanistan for both the
females and males. The ageing population is 3.7 percent, which is almost same as in 2005.
Table 1.2 Population of broad age group in Afghanistan by sex, 2005 and 2009
Age
group
2005 2009
Female Male Total Female Male Total
Numb
er
% numbe
r
% no. % no. % no. % no. %
0-14 49666
99
22.5 506682
0
22.
9
100335
19
45.
4
549324
6
22.
9
556908
6
23.
2
110623
32
46.
1
15-64 54621
64
24.7 574825
8
26.
0
112104
22
50.
7
585960
1
24.
4
618686
7
25.
8
120464
68
50.
2
65+ 35460
6
1.6 499353 2.3 853959 3.9 367753 1.5 516947 2.2 884700 3.7
Total 10783
469
48.8 113144
31
51.
2
220979
00
10
0
117206
00
48.
8
122729
00
51.
2
239935
00
100
Source: Statistical Yearbook, CSO, 2009-10
In economic terms, higher child and old age dependency ratio means a higher burden on the
working age population. High age dependency ratio leads to a scarcity of resources in poorer
families, where women and girls are often most likely the first victims of such scarcity. The
majority of women in Afghanistan are involved only in unpaid household work. The male
population therefore largely bears the economic burden of age dependency in terms of their
better participation in the economy.
5.6.5 LOCATION, HOUSEHOLDS AND GENDER
Majority of the Afghan population is in the rural areas, representing 77percent of the total
population. In 2009, the breakdown of Afghanistan’s total population by location according to
CSO is:
7
Rural population: 18,486,200 (72.5percent)
Urban population: 5,507,300 (21.6percent)
Nomadic population: 1,500,000 (5.9percent)
Nearly 80percent of the population lives in the rural/nomadic areas. This poses a challenge to
the government to focus on development policies and appropriate strategies that are rural
based and can be sustained and implemented though the building of local capacity and
mobilization of the rural population.
At an average household size of 7.3 persons at the national level, 7.2 persons for the rural and
7.6 in nomadic populations, and 7.3 persons for the urban population, as reported by NRVA
2007.The estimated total number of households is 3,438,000, where 2,563,000 are in the rural
areas, 193,000 are nomadic and 682,000 in the urban areas.
The NRVA estimates of average household size suggests that, on the average, there are 3 - 4
females and a similar number of males in every household. According to NRVA report in 2007,
female-headed households were more than 2 percent.
Although the percentage of female-headed households4 is small, the absolute number is still
large, at around 53,006 in the rural areas, 21,396 in the urban areas, and 4,586 in the nomadic
areas. This is a critical concern that government must address because a significant number of
female-headed households do not have any economically active members and the women
themselves have no sustainable income, economic skills, and capital, which makes them highly
vulnerable to economic shocks5 and poverty
According to the 2007 NRVA report, there are 660,000 widows. This may be due to the fact that
Afghanistan went through war for 23 years where most of the men, most probably family men,
4 A female- headed household refers to a household whose head is a female, who is not currently
married or living with her husband in such households. The female heads are responsible for the
economic, sustenance of their family. Such female heads also make most of the major decisions in
household matters.
5 WFP Rural poverty Report notes that “there is a strong relationship between the sex of the household
head and household welfare as follows: female-headed households, defined as such by the households
themselves, are more concentrated in the lowest consumption quintiles. Given this, it is not surprising
to find female-headed households amongst the poorest.”
8
died. These widows, whether heads of households or not, are relatively young, with an average
age of only 35 years. 94 percent of them are illiterate while around 90 percent of Afghan widows
have children, majority experiencing difficulties in providing basic needs for their families.
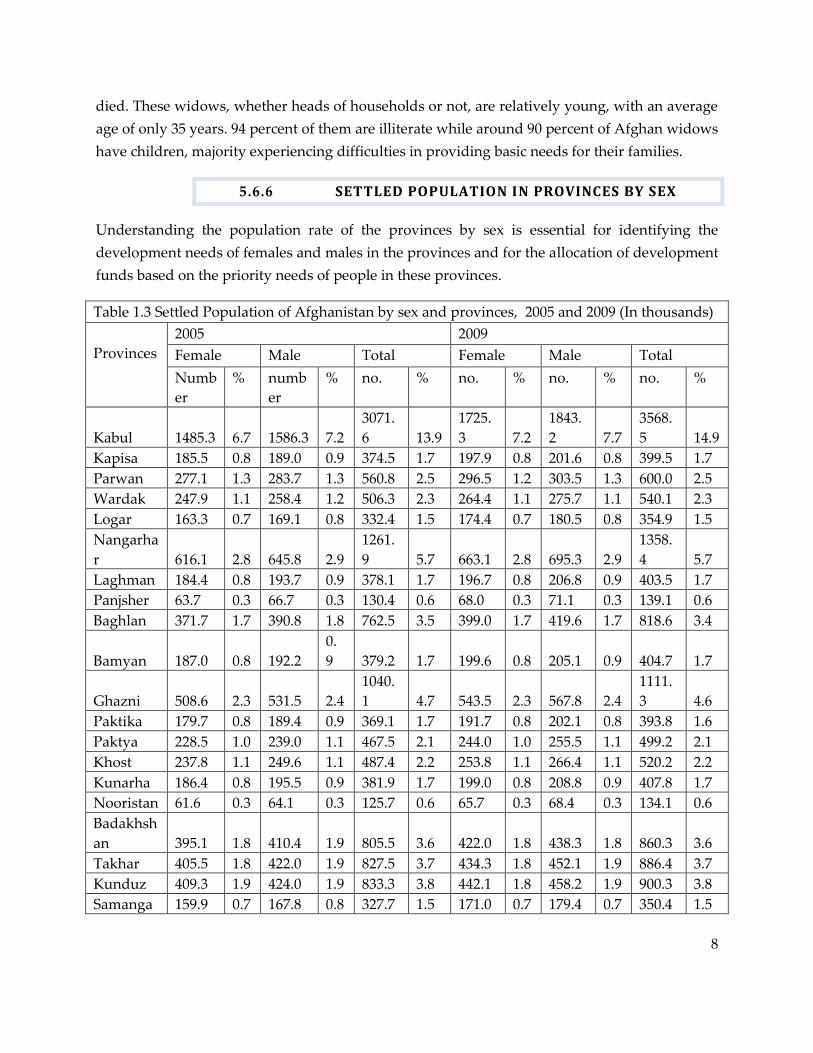
5.6.6 SETTLED POPULATION IN PROVINCES BY SEX
Understanding the population rate of the provinces by sex is essential for identifying the
development needs of females and males in the provinces and for the allocation of development
funds based on the priority needs of people in these provinces.
Table 1.3 Settled Population of Afghanistan by sex and provinces, 2005 and 2009 (In thousands)
Provinces
2005 2009
Female Male Total Female Male Total
Numb
er
% numb
er
% no. % no. % no. % no. %
Kabul 1485.3 6.7 1586.3 7.2
3071.
6 13.9
1725.
3 7.2
1843.
2 7.7
3568.
5 14.9
Kapisa 185.5 0.8 189.0 0.9 374.5 1.7 197.9 0.8 201.6 0.8 399.5 1.7
Parwan 277.1 1.3 283.7 1.3 560.8 2.5 296.5 1.2 303.5 1.3 600.0 2.5
Wardak 247.9 1.1 258.4 1.2 506.3 2.3 264.4 1.1 275.7 1.1 540.1 2.3
Logar 163.3 0.7 169.1 0.8 332.4 1.5 174.4 0.7 180.5 0.8 354.9 1.5
Nangarha
r 616.1 2.8 645.8 2.9
1261.
9 5.7 663.1 2.8 695.3 2.9
1358.
4 5.7
Laghman 184.4 0.8 193.7 0.9 378.1 1.7 196.7 0.8 206.8 0.9 403.5 1.7
Panjsher 63.7 0.3 66.7 0.3 130.4 0.6 68.0 0.3 71.1 0.3 139.1 0.6
Baghlan 371.7 1.7 390.8 1.8 762.5 3.5 399.0 1.7 419.6 1.7 818.6 3.4
Bamyan 187.0 0.8 192.2
0.
9 379.2 1.7 199.6 0.8 205.1 0.9 404.7 1.7
Ghazni 508.6 2.3 531.5 2.4
1040.
1 4.7 543.5 2.3 567.8 2.4
1111.
3 4.6
Paktika 179.7 0.8 189.4 0.9 369.1 1.7 191.7 0.8 202.1 0.8 393.8 1.6
Paktya 228.5 1.0 239.0 1.1 467.5 2.1 244.0 1.0 255.5 1.1 499.2 2.1
Khost 237.8 1.1 249.6 1.1 487.4 2.2 253.8 1.1 266.4 1.1 520.2 2.2
Kunarha 186.4 0.8 195.5 0.9 381.9 1.7 199.0 0.8 208.8 0.9 407.8 1.7
Nooristan 61.6 0.3 64.1 0.3 125.7 0.6 65.7 0.3 68.4 0.3 134.1 0.6
Badakhsh
an 395.1 1.8 410.4 1.9 805.5 3.6 422.0 1.8 438.3 1.8 860.3 3.6
Takhar 405.5 1.8 422.0 1.9 827.5 3.7 434.3 1.8 452.1 1.9 886.4 3.7
Kunduz 409.3 1.9 424.0 1.9 833.3 3.8 442.1 1.8 458.2 1.9 900.3 3.8
Samanga 159.9 0.7 167.8 0.8 327.7 1.5 171.0 0.7 179.4 0.7 350.4 1.5
9
n
Balkh 524.2 2.4 548.8 2.5
1073.
0 4.9 571.1 2.4 597.9 2.5
1168.
0 4.9
Sar-i-pul 230.7 1.0 242.0 1.1 472.7 2.1 246.6 1.0 258.8 1.1 505.4 2.1
Ghor 286.6 1.3 299.3 1.4 585.9 2.7 305.8 1.3 319.4 1.3 625.2 2.6
Dai
Kundi 190.2 0.9 200.8 0.9 391.0 1.9 203.0 0.8 214.3 0.9 417.3 1.7
Urozgan 144.2 0.7 153.0 0.7 297.2 1.3 153.9 0.6 163.3 0.7 317.2 1.3
Zabul 125.5 0.6 132.1 0.6 257.6 1.2 134.0 0.6 141.1 0.6 275.1 1.1
Kandahar 482.3 2.2 507.8 2.3 990.1 4.5 526.2 2.2 554.1 2.3
1080.
3 4.5
Jawzjan 222.0 1.0 230.0 1.0 452.0 2.0 238.3 1.0 247.0 1.0 485.3 2.0
Faryab 411.5 1.9 428.9 1.9 840.4 3.8 440.7 1.8 459.3 1.9 900.0 3.8
Helmand 380.6 1.7 401.5 1.8 782.1 3.5 406.7 1.7 429.1 1.8 835.8 3.5
Badghis 205.5 0.9 214.9 1.0 420.4 1.9 219.4 0.9 229.4 1.0 448.8 1.9
Herat 762.3 3.4 782.5 3.5
1544.
8 7.0 827.0 3.4 849.0 3.5
1676.
0 7.0
Farah 208.9 0.9 219.9 1.0 428.8 1.9 223.3 0.9 235.2 1.0 458.5 1.9
Nimroz 67.7 0.3 70.8 0.3 138.5 0.6 72.6 0.3 75.9 0.3 458.5 0.6
Total
10796.
6
48.
9
11301.
3
51.
1
22097
.9
100.
0
11720
.6
48.
8
12272
.9
51.
2
23993
.5
100.
0
Source: Statistical Yearbook, CSO, 2009-10
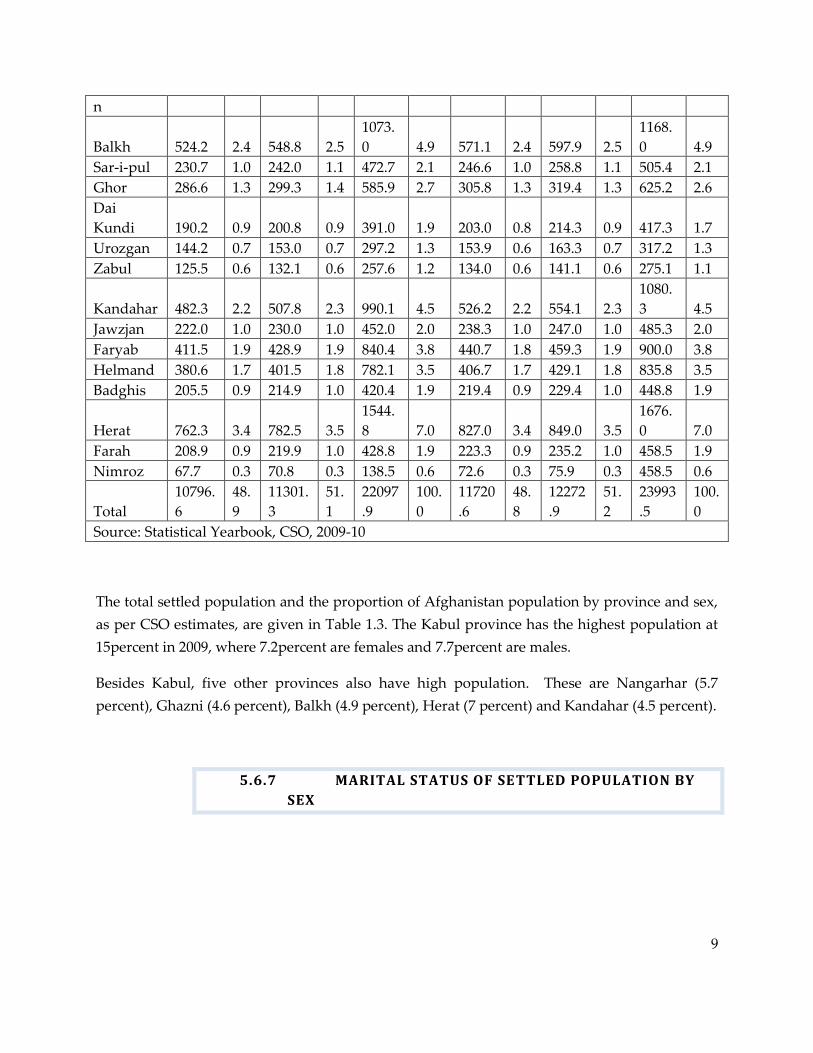
The total settled population and the proportion of Afghanistan population by province and sex,
as per CSO estimates, are given in Table 1.3. The Kabul province has the highest population at
15percent in 2009, where 7.2percent are females and 7.7percent are males.
Besides Kabul, five other provinces also have high population. These are Nangarhar (5.7
percent), Ghazni (4.6 percent), Balkh (4.9 percent), Herat (7 percent) and Kandahar (4.5 percent).
5.6.7 MARITAL STATUS OF SETTLED POPULATION BY
SEX
10
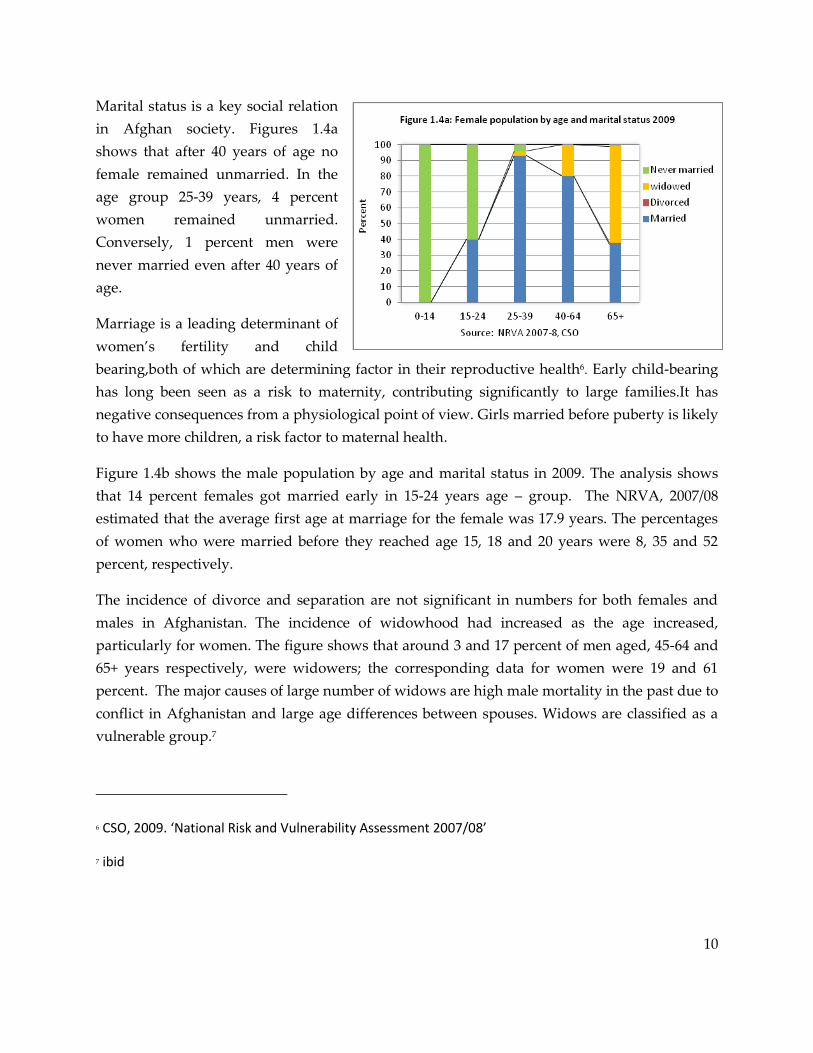
Marital status is a key social relation
in Afghan society. Figures 1.4a
shows that after 40 years of age no
female remained unmarried. In the
age group 25-39 years, 4 percent
women remained unmarried.
Conversely, 1 percent men were
never married even after 40 years of
age.
Marriage is a leading determinant of
women’s fertility and child
bearing,both of which are determining factor in their reproductive health6. Early child-bearing
has long been seen as a risk to maternity, contributing significantly to large families.It has
negative consequences from a physiological point of view. Girls married before puberty is likely
to have more children, a risk factor to maternal health.
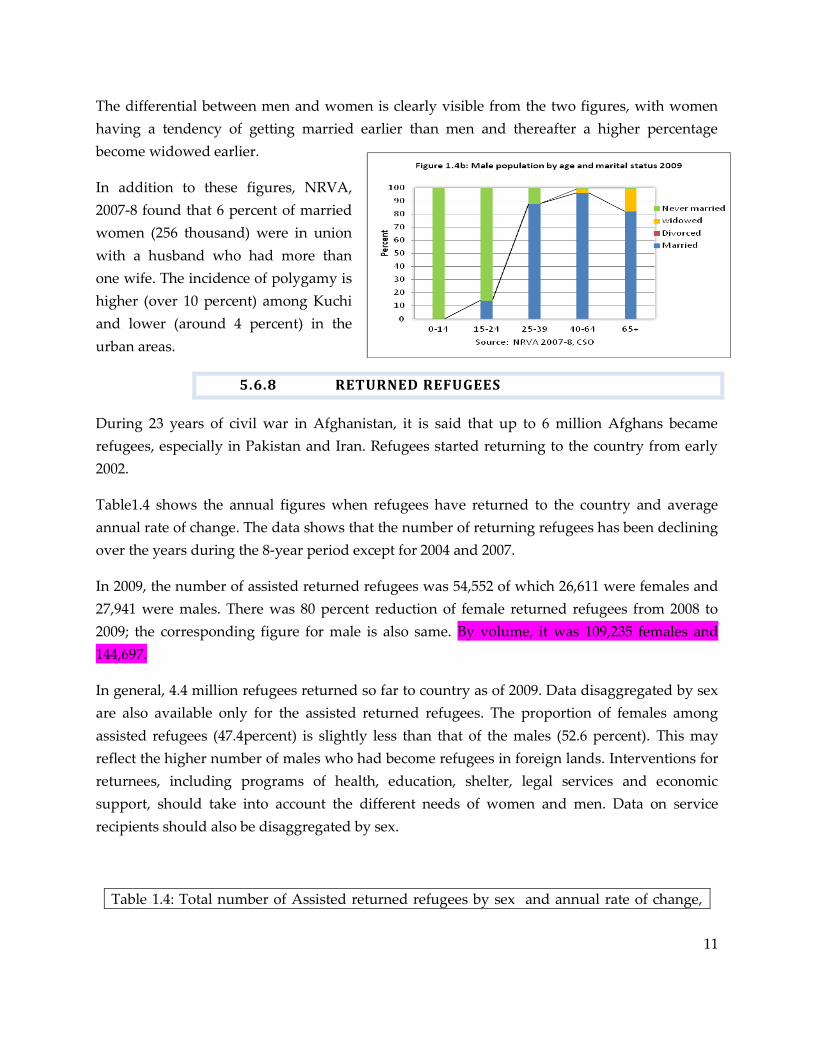
Figure 1.4b shows the male population by age and marital status in 2009. The analysis shows
that 14 percent females got married early in 15-24 years age – group. The NRVA, 2007/08
estimated that the average first age at marriage for the female was 17.9 years. The percentages
of women who were married before they reached age 15, 18 and 20 years were 8, 35 and 52
percent, respectively.
The incidence of divorce and separation are not significant in numbers for both females and
males in Afghanistan. The incidence of widowhood had increased as the age increased,
particularly for women. The figure shows that around 3 and 17 percent of men aged, 45-64 and
65+ years respectively, were widowers; the corresponding data for women were 19 and 61
percent. The major causes of large number of widows are high male mortality in the past due to
conflict in Afghanistan and large age differences between spouses. Widows are classified as a
vulnerable group.7
6 CSO, 2009. ‘National Risk and Vulnerability Assessment 2007/08’
7 ibid
11
The differential between men and women is clearly visible from the two figures, with women
having a tendency of getting married earlier than men and thereafter a higher percentage
become widowed earlier.
In addition to these figures, NRVA,
2007-8 found that 6 percent of married
women (256 thousand) were in union
with a husband who had more than
one wife. The incidence of polygamy is
higher (over 10 percent) among Kuchi
and lower (around 4 percent) in the
urban areas.
5.6.8 RETURNED REFUGEES
During 23 years of civil war in Afghanistan, it is said that up to 6 million Afghans became
refugees, especially in Pakistan and Iran. Refugees started returning to the country from early
2002.
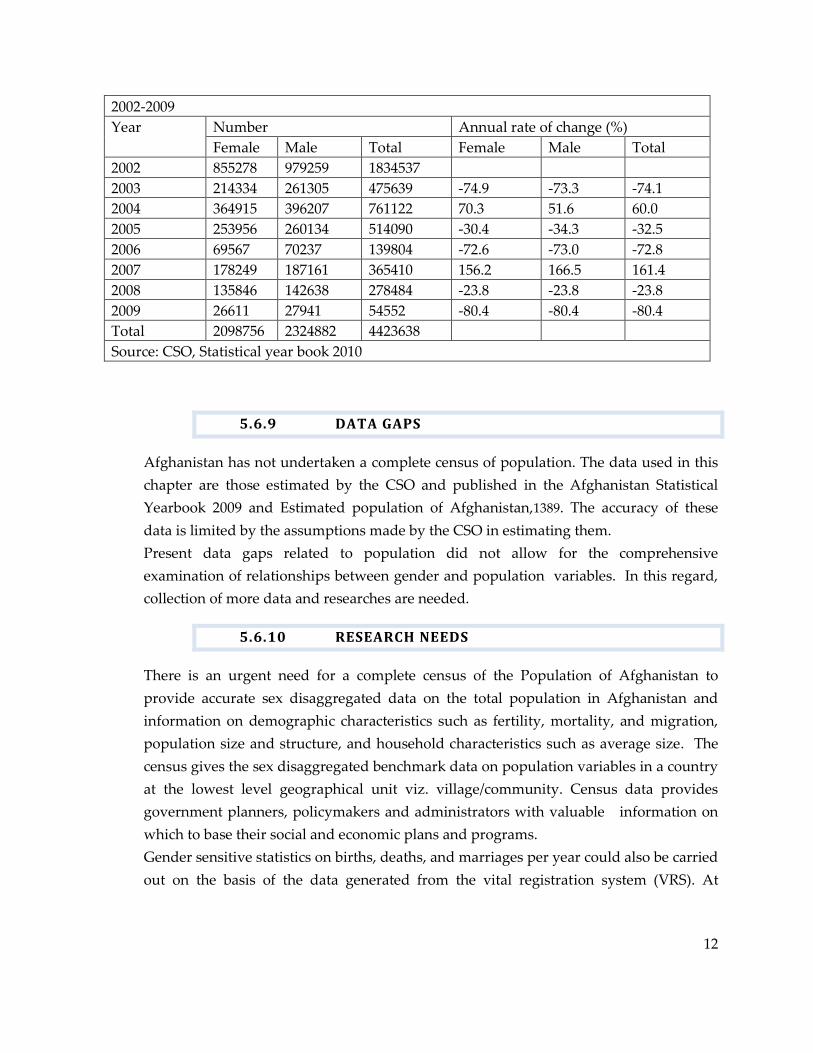
Table1.4 shows the annual figures when refugees have returned to the country and average
annual rate of change. The data shows that the number of returning refugees has been declining
over the years during the 8-year period except for 2004 and 2007.
In 2009, the number of assisted returned refugees was 54,552 of which 26,611 were females and
27,941 were males. There was 80 percent reduction of female returned refugees from 2008 to
2009; the corresponding figure for male is also same. By volume, it was 109,235 females and
144,697.
In general, 4.4 million refugees returned so far to country as of 2009. Data disaggregated by sex
are also available only for the assisted returned refugees. The proportion of females among
assisted refugees (47.4percent) is slightly less than that of the males (52.6 percent). This may
reflect the higher number of males who had become refugees in foreign lands. Interventions for
returnees, including programs of health, education, shelter, legal services and economic
support, should take into account the different needs of women and men. Data on service
recipients should also be disaggregated by sex.
Table 1.4: Total number of Assisted returned refugees by sex and annual rate of change,
12
2002-2009
Year Number Annual rate of change (%)
Female Male Total Female Male Total
2002 855278 979259 1834537
2003 214334 261305 475639 -74.9 -73.3 -74.1
2004 364915 396207 761122 70.3 51.6 60.0
2005 253956 260134 514090 -30.4 -34.3 -32.5
2006 69567 70237 139804 -72.6 -73.0 -72.8
2007 178249 187161 365410 156.2 166.5 161.4
2008 135846 142638 278484 -23.8 -23.8 -23.8
2009 26611 27941 54552 -80.4 -80.4 -80.4
Total 2098756 2324882 4423638
Source: CSO, Statistical year book 2010
5.6.9 DATA GAPS
Afghanistan has not undertaken a complete census of population. The data used in this
chapter are those estimated by the CSO and published in the Afghanistan Statistical
Yearbook 2009 and Estimated population of Afghanistan,1839. The accuracy of these
data is limited by the assumptions made by the CSO in estimating them.
Present data gaps related to population did not allow for the comprehensive
examination of relationships between gender and population variables. In this regard,
collection of more data and researches are needed.
5.6.10 RESEARCH NEEDS
There is an urgent need for a complete census of the Population of Afghanistan to
provide accurate sex disaggregated data on the total population in Afghanistan and
information on demographic characteristics such as fertility, mortality, and migration,
population size and structure, and household characteristics such as average size. The
census gives the sex disaggregated benchmark data on population variables in a country
at the lowest level geographical unit viz. village/community. Census data provides
government planners, policymakers and administrators with valuable information on
which to base their social and economic plans and programs.
Gender sensitive statistics on births, deaths, and marriages per year could also be carried
out on the basis of the data generated from the vital registration system (VRS). At
13
present, the vital registration has been done by the Ministry of Interior, and it is in a very
elementary stage and requires considerable development.
Complete vital registration systems, however, are expensive. A sample registration
system (SRS) would be less expensive, compared to VRS. Therefore, the nationwide
sample registration system could be implemented to collect, analyze and disseminate
data on birth, deaths, marriages and migration data.
As mentioned above, further data collection and research are needed to discuss the
relationships between gender and population variables in Afghanistan. For example,
research is needed on the effects of women’s empowerment on the age at marriage, age
at first birth, fertility, contraceptive use, proportion of births attended by skilled health
personnel, breast feeding, birth spacing, pre-natal, post-natal and during delivery care,
infant, child, under five and maternal mortality rates, age structure of population,
participation of women in labor market, internal and international migration of women,
and size and growth rate of population.
Demographic and health surveys are also a special kind of survey needed to understand
the state of fertility and mortality, as well as health and nutrition, and the factors that
influence them.
There is a need to systematize the collection of other data and information on the
population generated by various ministries and other organizations, including:
Administrative data – data maintained by government and non – government
institutions as part of their administrative records;
Service statistics- data from the services provided through programs and projects of
government and non – government institutions; and
Secondary data generated by research, assessment or special studies conducted by
government, non – government, academic and research institutions as well as
individuals on specific themes/ areas.
14
CHAPTER 2: SECURITY, LEGAL PROTECTION AND HUMAN RIGHTS
2.1 SECURITY SITUATION IN AFGHANISTAN
Security, based on the traditional concept, is defined as becoming free from external and
internal threats8. Afghanistan has been facing security threats like continuing gun battles with
anti-government elements, suicide attacks in many provinces that retarded the pace of
development. Security of the country is essential for economic growth and poverty reduction.
The Government of Afghanistan has developed the national security policy to ensure security of
state, persons and assets through the provision of an integrated and sustainable national
security infrastructure, law and order policy. This will facilitate development of Afghanistan’s
economy, social fabric and thus will enhance national unity.9
The enjoyment of women’s rights in Afghanistan remains elusive in spite of the Constitutional
guarantee of equality in rights and duties of women and men because of on-going armed
conflict, cultural beliefs and practices, and the limited capacity of justice system. There were
some measures taken, in particular the national action plan for women, to establish greater
gender equality by eliminating discrimination and promoting women’s participating and
leadership.
The chapter contains the areas relating to the conflict and violence on the lives of women viz.
participation of women in security sector and legal departments, trend of violence against
women, situation of right to information etc.
2.1.1 Concept of Security in NAPWA
Secure environment is a vital precondition to women’s advancement. Security for women is
defined in the NAPWA as ’security being free from intimidation, fear, threats and violence in
8 Security is defined in terms of traditional and modern concepts. According to the traditional concept, a
country’s military is responsible for providing security for its people from external threats, while the
police force is responsible for providing internal security. The intelligence service helps contain both
external and internal threats. The modern concept of security, on the other hand, is based on the
principle of human security.
9 Govt. of Afghanistan. ‘Afghanistan National Development Strategy, 2008-2013’,
15
both the public and private spheres of life, allowing them to freely exercise their rights, and
pursue activities that will develop their capacities and lead a full and satisfying life.
Insecurity still continues with a slight reduction of armed conflict since the peace process
started in 2001. Insurgency and organized crimes present pervasive threats to the lives of people
in Afghanistan. Women and girls bear the adverse effects of insecurity. There is threat against
school girls, kidnapping by anti-government forces as well as Violence against Women. The
threats have also been disrupting the delivery of services in the areas of health, education and
income generation.
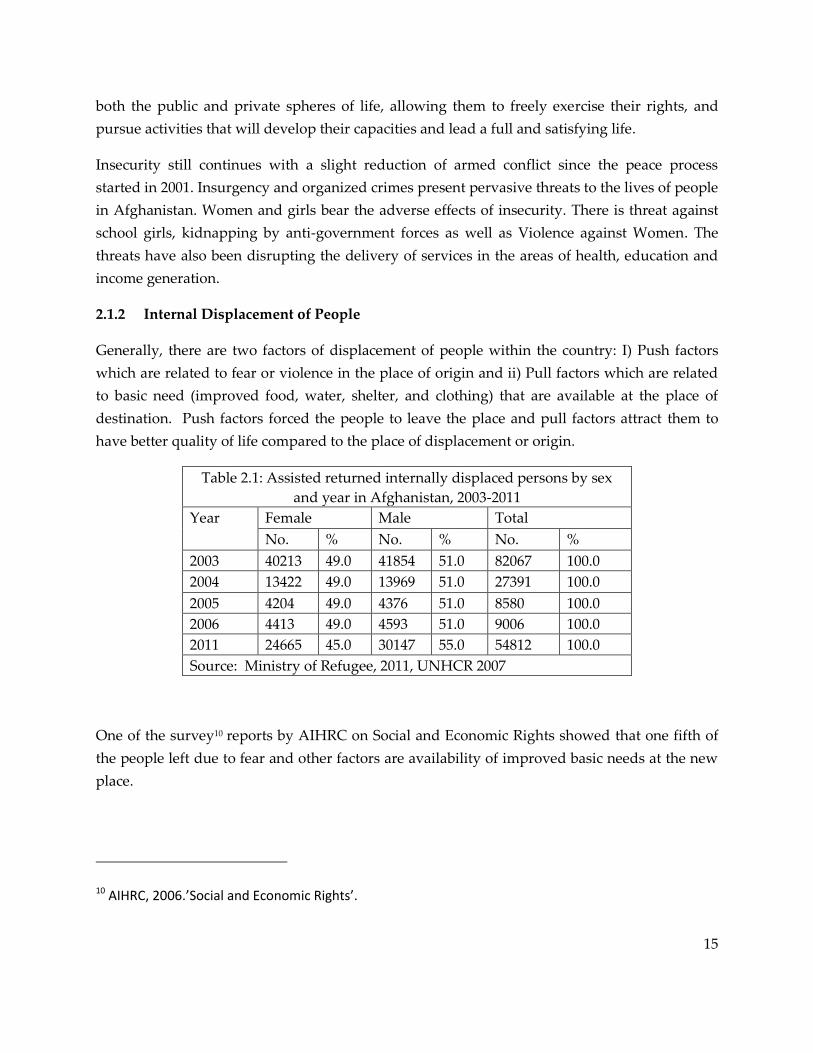
2.1.2 Internal Displacement of People
Generally, there are two factors of displacement of people within the country: I) Push factors
which are related to fear or violence in the place of origin and ii) Pull factors which are related
to basic need (improved food, water, shelter, and clothing) that are available at the place of
destination. Push factors forced the people to leave the place and pull factors attract them to
have better quality of life compared to the place of displacement or origin.
Table 2.1: Assisted returned internally displaced persons by sex
and year in Afghanistan, 2003-2011
Year Female Male Total
No. % No. % No. %
2003 40213 49.0 41854 51.0 82067 100.0
2004 13422 49.0 13969 51.0 27391 100.0
2005 4204 49.0 4376 51.0 8580 100.0
2006 4413 49.0 4593 51.0 9006 100.0
2011 24665 45.0 30147 55.0 54812 100.0
Source: Ministry of Refugee, 2011, UNHCR 2007
One of the survey10 reports by AIHRC on Social and Economic Rights showed that one fifth of
the people left due to fear and other factors are availability of improved basic needs at the new
place.
10 AIHRC, 2006.’Social and Economic Rights’.
16
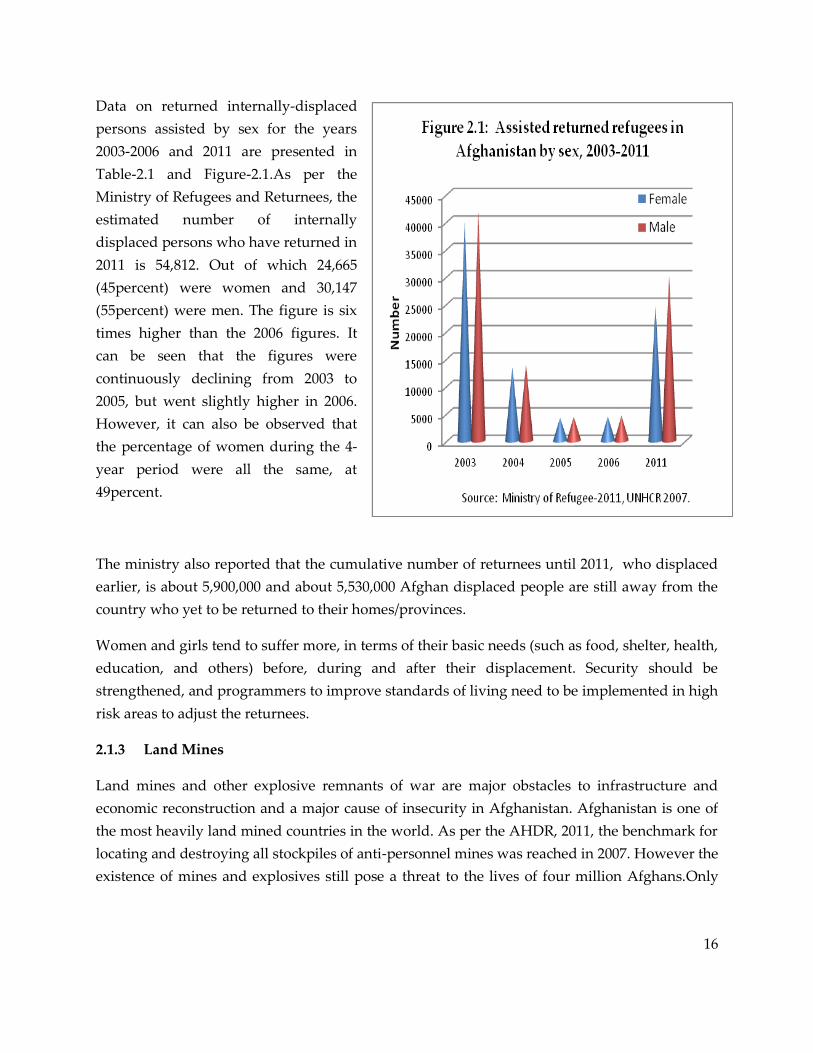
Data on returned internally-displaced
persons assisted by sex for the years
2003-2006 and 2011 are presented in
Table-2.1 and Figure-2.1.As per the
Ministry of Refugees and Returnees, the
estimated number of internally
displaced persons who have returned in
2011 is 54,812. Out of which 24,665
(45percent) were women and 30,147
(55percent) were men. The figure is six
times higher than the 2006 figures. It
can be seen that the figures were
continuously declining from 2003 to
2005, but went slightly higher in 2006.
However, it can also be observed that
the percentage of women during the 4-
year period were all the same, at
49percent.
The ministry also reported that the cumulative number of returnees until 2011, who displaced
earlier, is about 5,900,000 and about 5,530,000 Afghan displaced people are still away from the
country who yet to be returned to their homes/provinces.
Women and girls tend to suffer more, in terms of their basic needs (such as food, shelter, health,
education, and others) before, during and after their displacement. Security should be
strengthened, and programmers to improve standards of living need to be implemented in high
risk areas to adjust the returnees.
2.1.3 Land Mines
Land mines and other explosive remnants of war are major obstacles to infrastructure and
economic reconstruction and a major cause of insecurity in Afghanistan. Afghanistan is one of
the most heavily land mined countries in the world. As per the AHDR, 2011, the benchmark for
locating and destroying all stockpiles of anti-personnel mines was reached in 2007. However the
existence of mines and explosives still pose a threat to the lives of four million Afghans.Only
17
two provinces have been completely cleared of mines. Statistics have shown that about 5000
Afghans have been either killed or injured in mine explosions since 2001.
According to the United Nations Mine Action Centre for Afghanistan (UNMACA), the number
of people injured due to landmines and unexploded ordnance (UXOs) was 1,070 in 2011, which
was 73 percent higher than in 2006. Among the injured persons, 163 (15percent) were females
and 907 (85percent) were males. It can be seen in Table 2.2 that the number of injured people
due to landmines and UXOs has declined from 2005 to 2006 but the figures almost doubled in
2011.
Table 2.2 Total number of people injured by landmines and UXOs by sex in
Afghanistan, 2005-2011
Year Female Male Unknown Total
No. % No. % No. % No
2005 71 9.2 668 90.5 2 0.3 771
2006 68 11.0 549 89.0 0 0 617
2011 163 15.0 907 85.0 0 0 1070
Source: UNMACA, 2011
UNMACA also have data on people killed by land mines. On Table 2.3, a total of 581 people
were killed in 3 years, where 10.2percent were women.
Table 2.3 Number of people dead by landmines and UXOs in
Afghanistan by sex, 2005 - 2011
Year Female Male Unknown Total
No. % No. % No. % No
2005 13 8.1 146 91.3 1 0.6 160
2006 11 9.5 105 90.5 0 0 116
2011 35 11 270 89 0 0 305
Source: UNMACA, 2011
18
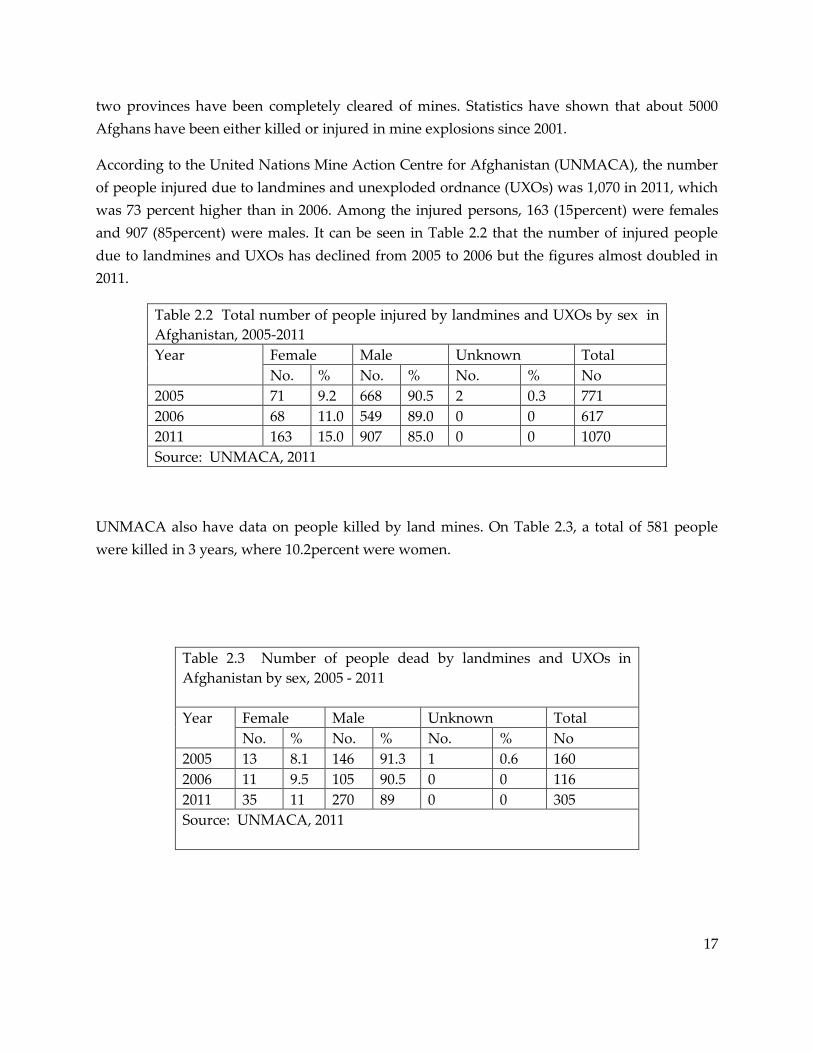
Land mines and UXO not only threaten
Afghans with death or
dismemberment, they rob farmers of
their livelihoods and impede
reconstruction. The total number of
male injured persons has also been
increased during the same time, 65
percent increases (2005-2011), as shown
on Figure 2.2.
The Mine Action Programmed for Afghanistan which was established in 1989 employs some
8,000 Afghans across the country. However, there were no sex-disaggregated data available to
support this.The total number of males killed by land mines and UXOs hasalso increased by 157
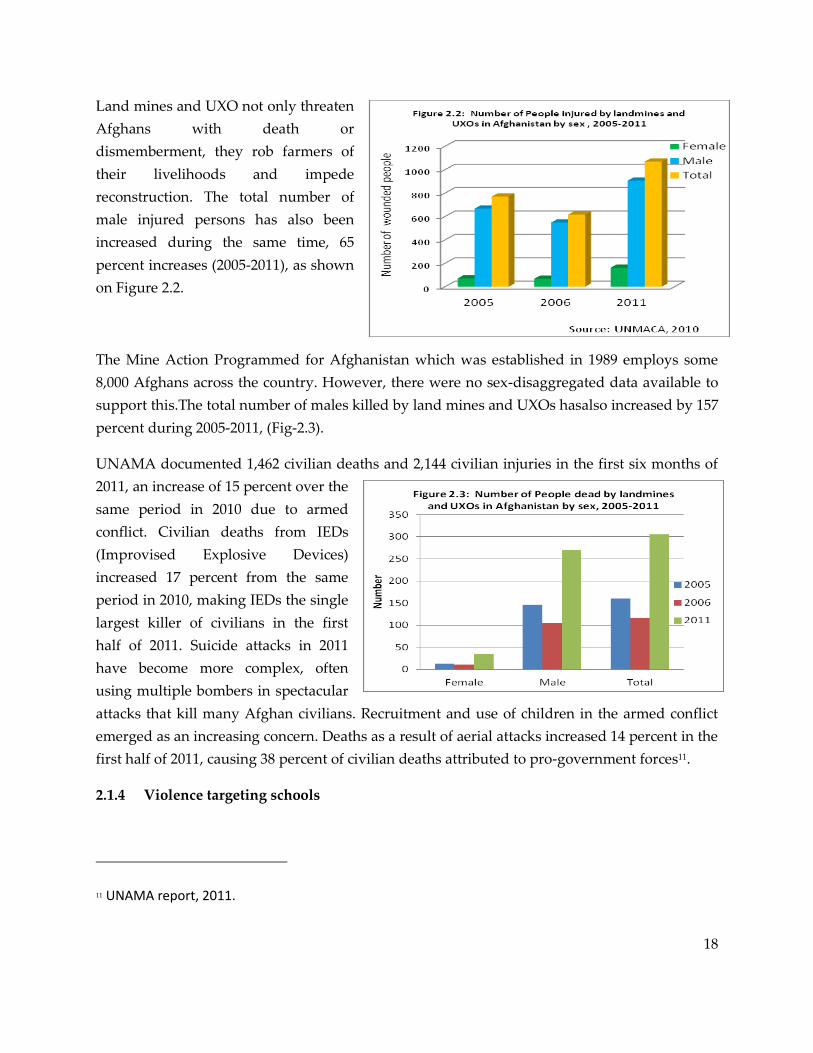
percent during 2005-2011, (Fig-2.3).
UNAMA documented 1,462 civilian deaths and 2,144 civilian injuries in the first six months of
2011, an increase of 15 percent over the
same period in 2010 due to armed
conflict. Civilian deaths from IEDs
(Improvised Explosive Devices)
increased 17 percent from the same
period in 2010, making IEDs the single
largest killer of civilians in the first
half of 2011. Suicide attacks in 2011
have become more complex, often
using multiple bombers in spectacular
attacks that kill many Afghan civilians. Recruitment and use of children in the armed conflict
emerged as an increasing concern. Deaths as a result of aerial attacks increased 14 percent in the
first half of 2011, causing 38 percent of civilian deaths attributed to pro-government forces11.
2.1.4 Violence targeting schools
11 UNAMA report, 2011.
19
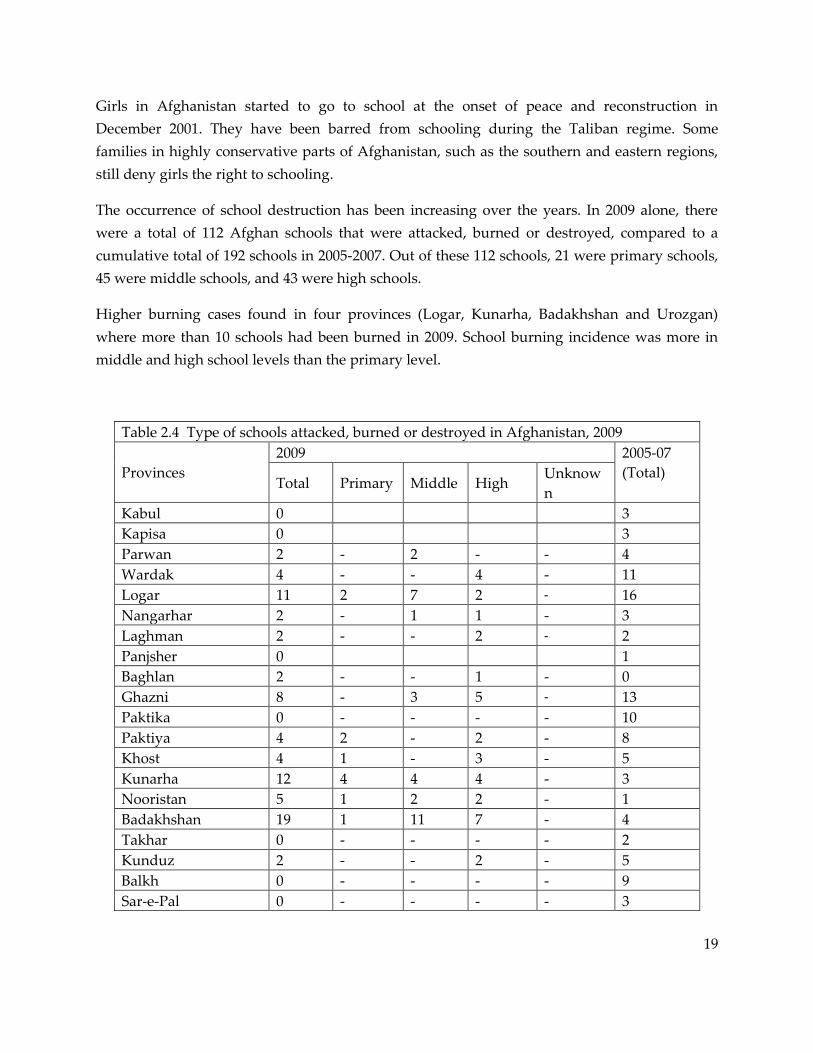
Girls in Afghanistan started to go to school at the onset of peace and reconstruction in
December 2001. They have been barred from schooling during the Taliban regime. Some
families in highly conservative parts of Afghanistan, such as the southern and eastern regions,
still deny girls the right to schooling.
The occurrence of school destruction has been increasing over the years. In 2009 alone, there
were a total of 112 Afghan schools that were attacked, burned or destroyed, compared to a
cumulative total of 192 schools in 2005-2007. Out of these 112 schools, 21 were primary schools,
45 were middle schools, and 43 were high schools.
Higher burning cases found in four provinces (Logar, Kunarha, Badakhshan and Urozgan)
where more than 10 schools had been burned in 2009. School burning incidence was more in
middle and high school levels than the primary level.
Table 2.4 Type of schools attacked, burned or destroyed in Afghanistan, 2009
Provinces
2009 2005-07
(Total) Total Primary Middle High
Unknow
n
Kabul 0 3
Kapisa 0 3
Parwan 2 - 2 - - 4
Wardak 4 - - 4 - 11
Logar 11 2 7 2 - 16
Nangarhar 2 - 1 1 - 3
Laghman 2 - - 2 - 2
Panjsher 0 1
Baghlan 2 - - 1 - 0
Ghazni 8 - 3 5 - 13
Paktika 0 - - - - 10
Paktiya 4 2 - 2 - 8
Khost 4 1 - 3 - 5
Kunarha 12 4 4 4 - 3
Nooristan 5 1 2 2 - 1
Badakhshan 19 1 11 7 - 4
Takhar 0 - - - - 2
Kunduz 2 - - 2 - 5
Balkh 0 - - - - 9
Sar-e-Pal 0 - - - - 3

20
Ghor 2 - 1 1 - 3
Dai Kundi 0 - - - - 1
Urozgan 11 8 3 - - 5
Zabul 0 - - - - 11
Kandahar 0 - - - - 11
Jawzjan 9 1 5 3 - 1
Faryab 3 - 3 - - 1
Helmand 0 - - - - 39
Badghis 1 - - - 1 4
Heart 3 - - 2 1 0
Farah 5 1 2 2 - 8
Nimroz 1 - 1 - - 2
Total 112 21 45 43 3 192
Source: Ministry of Education 2010
2.1.5 Violence against Women
Violence against women12 is one of the main security problems for women in Afghanistan.
Current data on violence against women were obtained from Ministry of Women’s Affairs and
Independent Human Rights Commission where most of the cases were reported. However,
there are efforts by government and NGOs to record VAW cases systematically.
The total number of VAW incidences reported to MOWA was lower in 2010 compared to 2008
(Table 2.5). The total number of reported cases 2010 was 1,443 compared to 2,914 cases in 2008.
This showed a decrease of slightly more than 50percent. The top three reported cases of VAW in
2010 were escape from home (340 cases or 23.6 percent) beating (319 cases or 22.1 percent), and
divorce/separation (171 cases or 11.9percent) which comprised almost 58 percent of all reported
cases. These were also the top reported cases in 2008 but beating came first with 723 cases
(32.6percent), divorce / separation with 259 cases (11.2percent), and escape from home with 226
cases (10.2percent). It can be noted from the data that the number of cases reported for
beatings and forced marriages has been decreasing over the years. The total number of beatings
reported in 2005-2006 was 1,011, which comprised almost half of the total number of reported
12 VAW is defined as “any act of gender based violence that results in, or is likely to result in, physical,
sexual or psychological harm or suffering to women, including threats of such acts, coercion or arbitrary
deprivation of liberty, whether occurring in public or private life” (BPFA, para.113).

21
cases of VAW incidence in Afghanistan with 47.4percent. These reports have significantly
decreased to 723 cases in 2008 and only 319 cases in 2010. Likewise, for forced marriages, a total
of 769 cases were reported in 2005-2006. Reporting decreased to 190 cases in 2008 and 95 cases
in 2010. Other significant VAW cases reported included murder, lack of economic support from
husband, self immolation/burning and abduction/disappearance.
Table 2.5 Incidence of VAW cases in Afghanistan, as reported to MOWA/DOWA, 2005-
2010
Types of VAW Cases 2010 Cases 2008 Cases 2005-2006
No % No % No %
Beating 319 22.1 723 32.6 1011 47.4
Forced Marriage 95 6.6 190 8.6 769 36.1
Lack of economic support from
husband
107 7.4 87 3.9 100 4.7
Property taken away by in-laws 27 1.9 52 2.4 20 0.9
Murder 69 4.8 194 8.8 87 4.1
Exchange of women/girl 8 0.5 93 4.2
Rape 12 0.8 83 3.7 33 1.5
Prevention of women in social
activities
- 0 - 0 24 1.1
Trafficking of girls/ selling 9 0.6 42 1.9 10 0.5
Suicide 17 1.2 30 1.4 - -
Self immolation /burning 84 5.8 54 2.4 - -
Heritage (property) not received
from parents
- 0 - 0 3 0.1
Escape from Home 340 23.6 226 10.2 2 0.1
Divorce/ Separation 171 11.9 259 11.7 - -
Abduction/ Disappear 40 2.8 49 2.2 - -
Others (child marriage, nullify
engagement, drug addict etc.)
145 10 134 6 74 3.4
Total 1443 100.0 2914 100.0 2133 100.0
Source: MOWA, 2011
The total number of reported VAW cases registered in the Afghanistan Independent Human
Rights Commission headquarters in Kabul and regional offices are shown in Table 2.6. The total
number of reported cases nationally in 2007-09 was 1,603 indicating an increase of 33.7 percent
compared to 1,199 cases in 2006. The top three reported cases of VAW in 2007-09 were beating
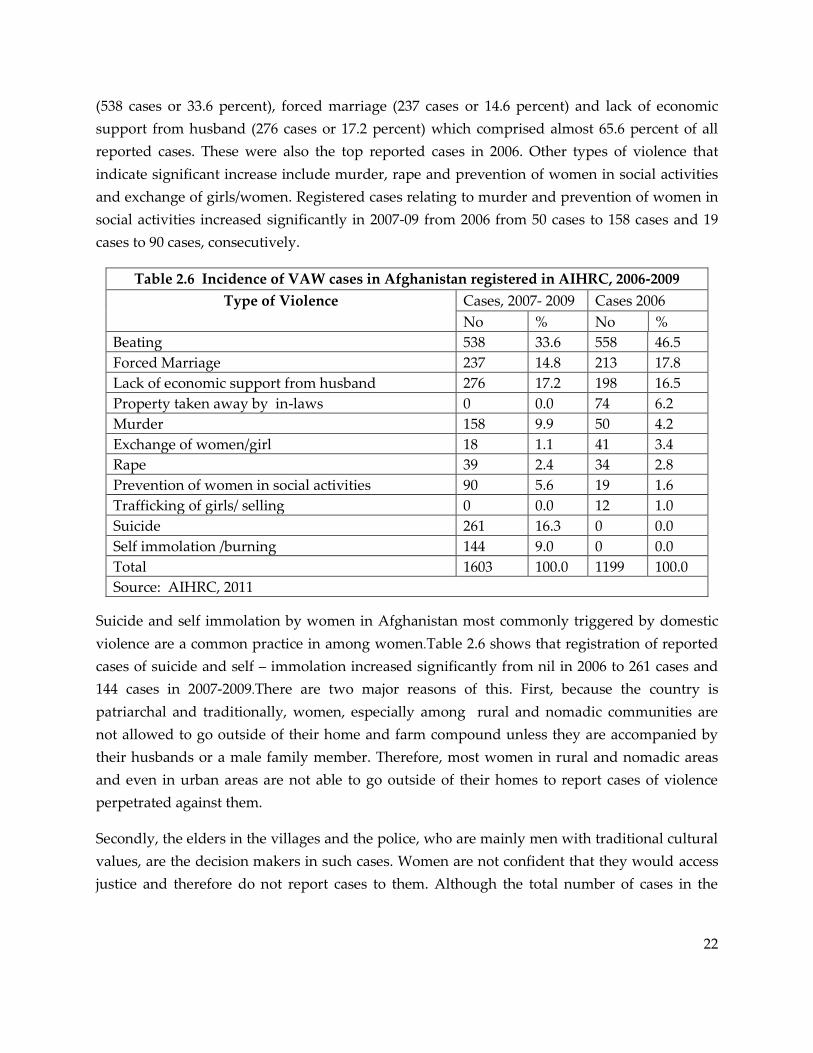
22
(538 cases or 33.6 percent), forced marriage (237 cases or 14.6 percent) and lack of economic
support from husband (276 cases or 17.2 percent) which comprised almost 65.6 percent of all
reported cases. These were also the top reported cases in 2006. Other types of violence that
indicate significant increase include murder, rape and prevention of women in social activities
and exchange of girls/women. Registered cases relating to murder and prevention of women in
social activities increased significantly in 2007-09 from 2006 from 50 cases to 158 cases and 19
cases to 90 cases, consecutively.
Table 2.6 Incidence of VAW cases in Afghanistan registered in AIHRC, 2006-2009
Type of Violence
Cases, 2007- 2009 Cases 2006
No % No %
Beating 538 33.6 558 46.5
Forced Marriage 237 14.8 213 17.8
Lack of economic support from husband 276 17.2 198 16.5
Property taken away by in-laws 0 0.0 74 6.2
Murder 158 9.9 50 4.2
Exchange of women/girl 18 1.1 41 3.4
Rape 39 2.4 34 2.8
Prevention of women in social activities 90 5.6 19 1.6
Trafficking of girls/ selling 0 0.0 12 1.0
Suicide 261 16.3 0 0.0
Self immolation /burning 144 9.0 0 0.0
Total 1603 100.0 1199 100.0
Source: AIHRC, 2011
Suicide and self immolation by women in Afghanistan most commonly triggered by domestic
violence are a common practice in among women.Table 2.6 shows that registration of reported
cases of suicide and self – immolation increased significantly from nil in 2006 to 261 cases and
144 cases in 2007-2009.There are two major reasons of this. First, because the country is
patriarchal and traditionally, women, especially among rural and nomadic communities are
not allowed to go outside of their home and farm compound unless they are accompanied by
their husbands or a male family member. Therefore, most women in rural and nomadic areas
and even in urban areas are not able to go outside of their homes to report cases of violence
perpetrated against them.
Secondly, the elders in the villages and the police, who are mainly men with traditional cultural
values, are the decision makers in such cases. Women are not confident that they would access
justice and therefore do not report cases to them. Although the total number of cases in the

23
tables is small, they show the types of brutality committed against women by family members
and others.
A new form of violence that needs examination is prevention of women from participation in
social activities, a direct contradiction of the Government’s policy of promoting women’s
participation in all aspects of life13. Selling and trafficking of girls, while low in percentage
terms, is another form of VAW that requires close monitoring.
5.6.11 STATE SECURITY PROVIDERS
Afghanistan’s security and justice sector includes a number of institutions responsible for
maintaining security and ensuring enforcement of laws. The security and justice sectors include
the Ministry of Justice, Attorney General’s Office, Afghan National Police and Courts. The
Afghan National Army also provides security from internal and external threats. The number
and proportion of these services is important for providing security to women.
2.2.1 Afghan National Police
There are a total of 137,697 police officers in the country in 2011, denoting an increase of 82.7
percent compared to 2007 total count of 75,353.The number of female police personnel in 2007
and 2011 is shown in Table 2.7 Currently; only 1,112 women are working in the police force
which is only slightly less than one percent of the total police force. Comparatively, in 2007,
only 275 or 0.4percent women were in police force. By rank, women police constituted only 0.82
percent of officers, 1.51 percent of sergeants, and 0.52 percent of soldiers in 2011.
Policewomen suffer from systematic gender biases within the police institutions. According to
Afghanistan NHDR 2007, these gender issues include low level of participation of women in the
police force, policewomen performing minor support role to policemen, and male-defined
organizational and rank structures, policies and standards, trainings and promotion systems.
The following data showed that the number of women in the police service is very small, which
comprised less than 1 percent of the total number of police personnel. Increasing women’s
13 Strengthening women’s participation in all spheres of life is a component of the ANDS gender equity
goal.
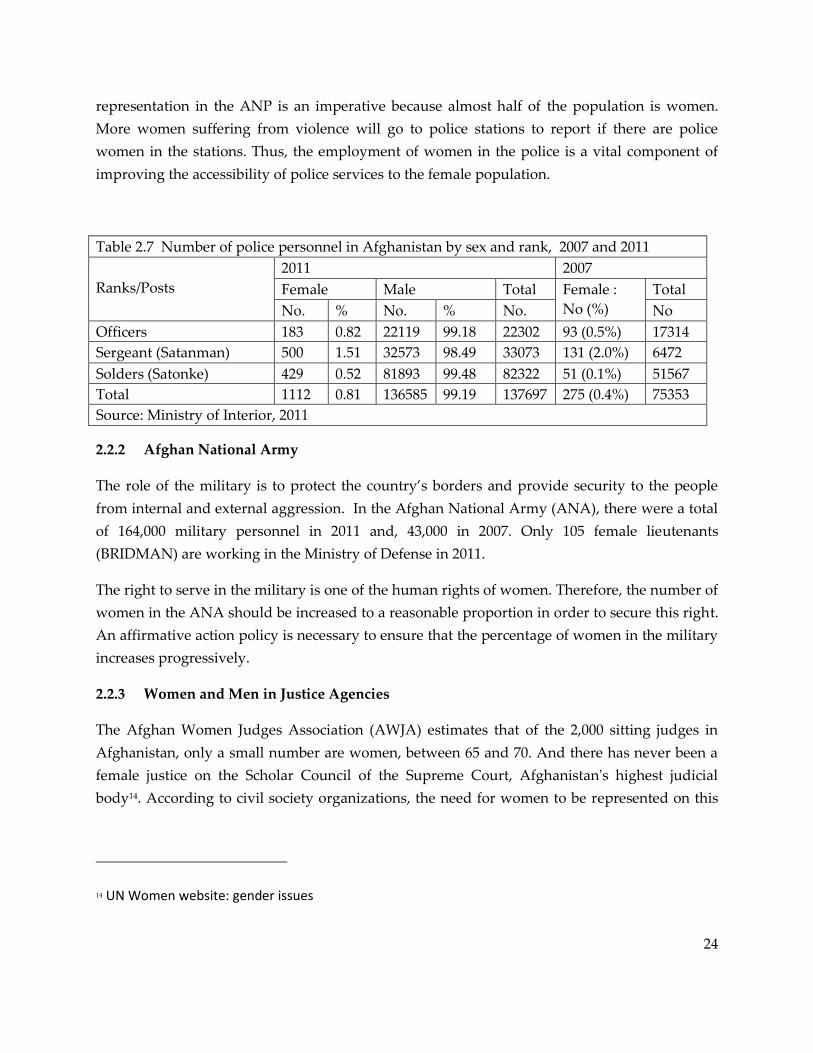
24
representation in the ANP is an imperative because almost half of the population is women.
More women suffering from violence will go to police stations to report if there are police
women in the stations. Thus, the employment of women in the police is a vital component of
improving the accessibility of police services to the female population.
Table 2.7 Number of police personnel in Afghanistan by sex and rank, 2007 and 2011
Ranks/Posts
2011 2007
Female Male Total Female :
No (%)
Total
No. % No. % No. No
Officers 183 0.82 22119 99.18 22302 93 (0.5%) 17314
Sergeant (Satanman) 500 1.51 32573 98.49 33073 131 (2.0%) 6472
Solders (Satonke) 429 0.52 81893 99.48 82322 51 (0.1%) 51567
Total 1112 0.81 136585 99.19 137697 275 (0.4%) 75353
Source: Ministry of Interior, 2011
2.2.2 Afghan National Army
The role of the military is to protect the country’s borders and provide security to the people
from internal and external aggression. In the Afghan National Army (ANA), there were a total
of 164,000 military personnel in 2011 and, 43,000 in 2007. Only 105 female lieutenants
(BRIDMAN) are working in the Ministry of Defense in 2011.
The right to serve in the military is one of the human rights of women. Therefore, the number of
women in the ANA should be increased to a reasonable proportion in order to secure this right.
An affirmative action policy is necessary to ensure that the percentage of women in the military
increases progressively.
2.2.3 Women and Men in Justice Agencies
The Afghan Women Judges Association (AWJA) estimates that of the 2,000 sitting judges in
Afghanistan, only a small number are women, between 65 and 70. And there has never been a
female justice on the Scholar Council of the Supreme Court, Afghanistan's highest judicial
body14. According to civil society organizations, the need for women to be represented on this
14 UN Women website: gender issues

25
body is especially critical for a justice system that has long been criticized for its lack of
sensitivity to gender concerns.
The Afghanistan Human Development Report 2007 stated that of the 1,919 total posts in the
Ministry of Justice, 1,325 are filled with 1,235 men (93.2percent) and 90 women (6.8percent).
According to the Attorney General’s Office, there were 105 female attorneys (5.5 percent) out of
the total of 1,908 attorneys in the year 2011. Although there was an increase in the number of
female attorneys in Afghanistan from 2007 (76 out of the total 1,241) to 2011, the percentage of
female attorneys decreased from 6.1 percent to 5.5 percent.
Those low proportions would have adverse consequences to the ability of women to access
justice. This is another area where focused targeting and an affirmative action policy should be
adopted.
5.6.12 LEGAL PROTECTION
2.2.1 Number of cases on violence against women registered vs. acted upon in MOWA
All cases reported to MOWA were said to have been processed. Cases of women being beaten
were solved in MOWA, while the rest of the cases were sent to Attorney General’s Office and
appropriate courts. Of the women/girls who reported VAW cases to MOWA until 2011, 4,306
cases (64 percent) of the total were resolved and 2,459 (36 percent) were pending.
2.3.2 Centers for Women/Girls in Difficult Situations
There are no referral centers in Afghanistan for women in difficult situations. A few women in
such situations go to MOWA, AIHRC, Women’s Judicial Union or the Assistance Department of
the Supreme Court to register their cases, and seek advice and support. Where appropriate,
these offices refer them to shelters for protection.
In 2011, there are 11 shelters in the country for women and children for difficult situations. Data
on the number of women and children who are served by these shelters are shown in Table
2.8.The total number of women and children in shelters in 2011 has declined to 259 from the
2010 figure of 350. It can be seen from the table that the number of women and children in
shelters has been steadily increasing from 2006 to 2010, but declined in 2011.
Table 2.8 Total number of women and children in shelters in Afghanistan,
2006-2011
2006 2008 2009 2010 2011
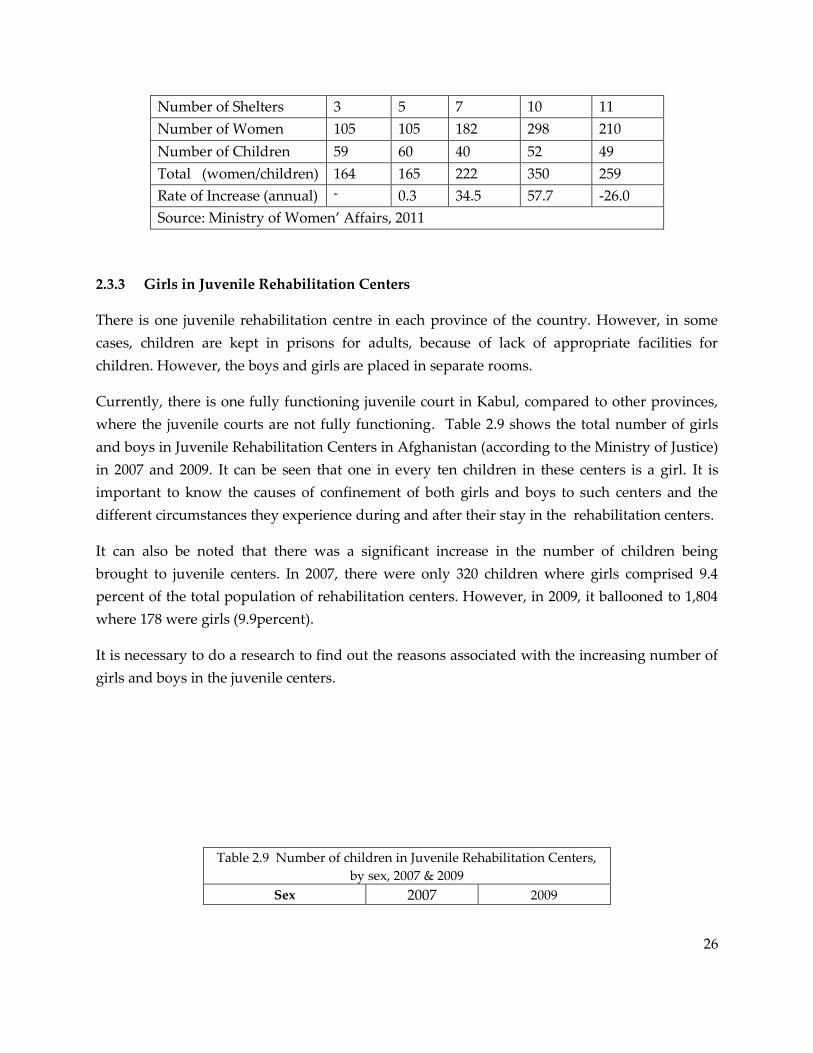
26
Number of Shelters 3 5 7 10 11
Number of Women 105 105 182 298 210
Number of Children 59 60 40 52 49
Total (women/children) 164 165 222 350 259
Rate of Increase (annual) - 0.3 34.5 57.7 -26.0
Source: Ministry of Women’ Affairs, 2011
2.3.3 Girls in Juvenile Rehabilitation Centers
There is one juvenile rehabilitation centre in each province of the country. However, in some
cases, children are kept in prisons for adults, because of lack of appropriate facilities for
children. However, the boys and girls are placed in separate rooms.
Currently, there is one fully functioning juvenile court in Kabul, compared to other provinces,
where the juvenile courts are not fully functioning. Table 2.9 shows the total number of girls
and boys in Juvenile Rehabilitation Centers in Afghanistan (according to the Ministry of Justice)
in 2007 and 2009. It can be seen that one in every ten children in these centers is a girl. It is
important to know the causes of confinement of both girls and boys to such centers and the
different circumstances they experience during and after their stay in the rehabilitation centers.
It can also be noted that there was a significant increase in the number of children being
brought to juvenile centers. In 2007, there were only 320 children where girls comprised 9.4
percent of the total population of rehabilitation centers. However, in 2009, it ballooned to 1,804
where 178 were girls (9.9percent).
It is necessary to do a research to find out the reasons associated with the increasing number of
girls and boys in the juvenile centers.
Table 2.9 Number of children in Juvenile Rehabilitation Centers,
by sex, 2007 & 2009
Sex 2007 2009
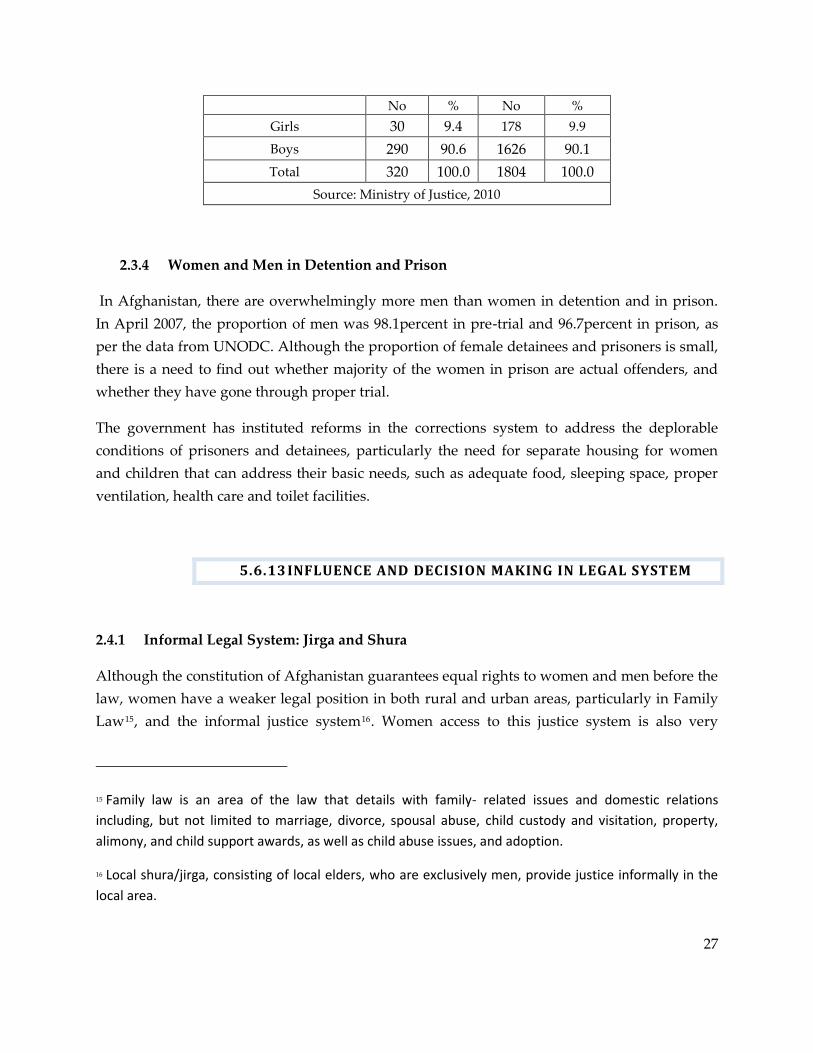
27
No % No %
Girls 30 9.4 178 9.9
Boys 290 90.6 1626 90.1
Total 320 100.0 1804 100.0
Source: Ministry of Justice, 2010
2.3.4 Women and Men in Detention and Prison
In Afghanistan, there are overwhelmingly more men than women in detention and in prison.
In April 2007, the proportion of men was 98.1percent in pre-trial and 96.7percent in prison, as
per the data from UNODC. Although the proportion of female detainees and prisoners is small,
there is a need to find out whether majority of the women in prison are actual offenders, and
whether they have gone through proper trial.
The government has instituted reforms in the corrections system to address the deplorable
conditions of prisoners and detainees, particularly the need for separate housing for women
and children that can address their basic needs, such as adequate food, sleeping space, proper
ventilation, health care and toilet facilities.
5.6.13 INFLUENCE AND DECISION MAKING IN LEGAL SYSTEM
2.4.1 Informal Legal System: Jirga and Shura
Although the constitution of Afghanistan guarantees equal rights to women and men before the
law, women have a weaker legal position in both rural and urban areas, particularly in Family
Law15, and the informal justice system16. Women access to this justice system is also very
15 Family law is an area of the law that details with family- related issues and domestic relations
including, but not limited to marriage, divorce, spousal abuse, child custody and visitation, property,
alimony, and child support awards, as well as child abuse issues, and adoption.
16 Local shura/jirga, consisting of local elders, who are exclusively men, provide justice informally in the
local area.
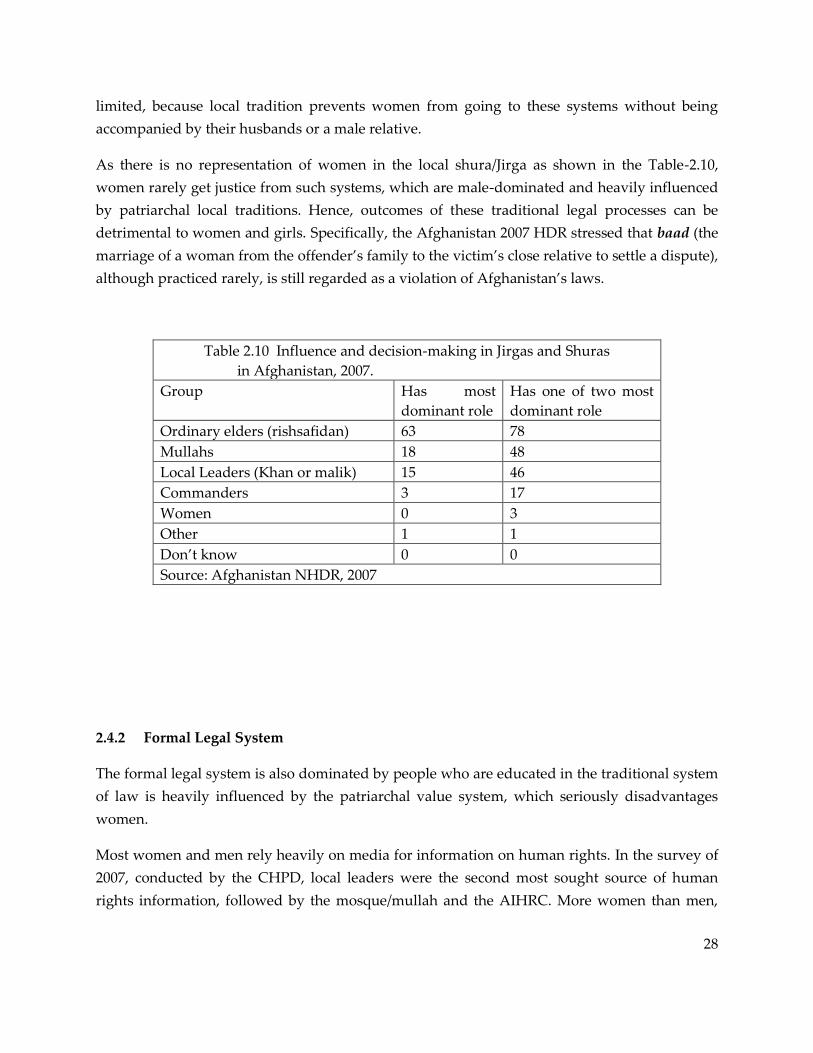
28
limited, because local tradition prevents women from going to these systems without being
accompanied by their husbands or a male relative.
As there is no representation of women in the local shura/Jirga as shown in the Table-2.10,
women rarely get justice from such systems, which are male-dominated and heavily influenced
by patriarchal local traditions. Hence, outcomes of these traditional legal processes can be
detrimental to women and girls. Specifically, the Afghanistan 2007 HDR stressed that baad (the
marriage of a woman from the offender’s family to the victim’s close relative to settle a dispute),
although practiced rarely, is still regarded as a violation of Afghanistan’s laws.
Table 2.10 Influence and decision-making in Jirgas and Shuras
in Afghanistan, 2007.
Group Has most
dominant role
Has one of two most
dominant role
Ordinary elders (rishsafidan) 63 78
Mullahs 18 48
Local Leaders (Khan or malik) 15 46
Commanders 3 17
Women 0 3
Other 1 1
Don’t know 0 0
Source: Afghanistan NHDR, 2007
2.4.2 Formal Legal System
The formal legal system is also dominated by people who are educated in the traditional system
of law is heavily influenced by the patriarchal value system, which seriously disadvantages
women.
Most women and men rely heavily on media for information on human rights. In the survey of
2007, conducted by the CHPD, local leaders were the second most sought source of human
rights information, followed by the mosque/mullah and the AIHRC. More women than men,
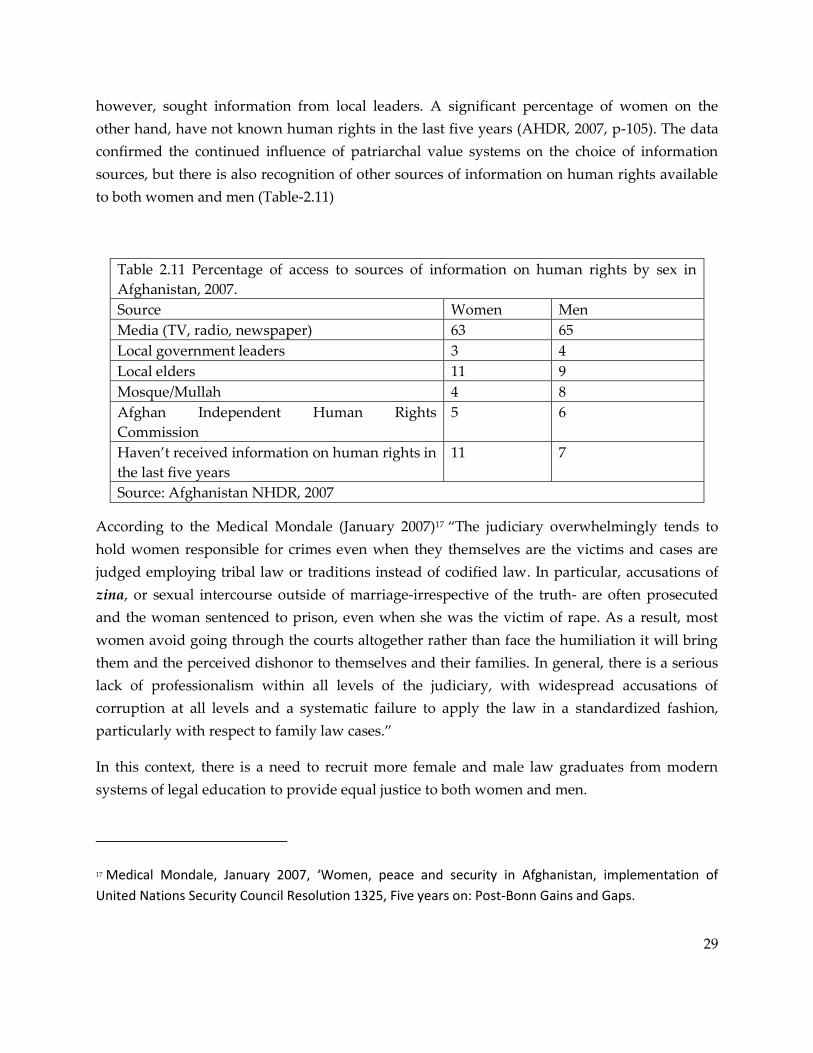
29
however, sought information from local leaders. A significant percentage of women on the
other hand, have not known human rights in the last five years (AHDR, 2007, p-105). The data
confirmed the continued influence of patriarchal value systems on the choice of information
sources, but there is also recognition of other sources of information on human rights available
to both women and men (Table-2.11)
Table 2.11 Percentage of access to sources of information on human rights by sex in
Afghanistan, 2007.
Source Women Men
Media (TV, radio, newspaper) 63 65
Local government leaders 3 4
Local elders 11 9
Mosque/Mullah 4 8
Afghan Independent Human Rights
Commission
5 6
Haven’t received information on human rights in
the last five years
11 7
Source: Afghanistan NHDR, 2007
According to the Medical Mondale (January 2007)17 “The judiciary overwhelmingly tends to
hold women responsible for crimes even when they themselves are the victims and cases are
judged employing tribal law or traditions instead of codified law. In particular, accusations of
zina, or sexual intercourse outside of marriage-irrespective of the truth- are often prosecuted
and the woman sentenced to prison, even when she was the victim of rape. As a result, most
women avoid going through the courts altogether rather than face the humiliation it will bring
them and the perceived dishonor to themselves and their families. In general, there is a serious
lack of professionalism within all levels of the judiciary, with widespread accusations of
corruption at all levels and a systematic failure to apply the law in a standardized fashion,
particularly with respect to family law cases.”
In this context, there is a need to recruit more female and male law graduates from modern
systems of legal education to provide equal justice to both women and men.
17 Medical Mondale, January 2007, ‘Women, peace and security in Afghanistan, implementation of
United Nations Security Council Resolution 1325, Five years on: Post-Bonn Gains and Gaps.

30
2.5 DATA GAPS
Annual data on number of military, police and administrative personnel in the
Ministries of Defense and Intelligence Agencies by sex and by rank.
Data on the number of employed persons in the Mine Action Programmed for
Afghanistan
5.6.14 RESEARCH NEEDS
Research on the gender impacts of the land mines and UXOs clearance
programmers of UNMACA and other organizations.
Gender oriented research on the police and military organization, the systems
and procedures, and the issues faced by women, policy reform and entry points
to increase women’s participation in these organizations.
In-depth qualitative studies on the impact of the school
attacks/burning/destruction by rebel forces on the psychology of teachers and
parents, and on the education of girls and boys.
Study required on the extent and causes of the following VAW cases: those who
escaped from their homes, beatings, divorce/separation, trafficking and selling of
girls, suicide and self immolation among women and girls.
A detailed study on legal protection provided to women by governmental and
non-governmental organizations. Studies of whether the women and girls in
prison are actual offenders, and whether they have been properly trialed under
the law.
Research on other potential sources of human right violation against rural
women in Afghanistan.

31
CHAPTER 3: LEADERSHIP AND POLITICAL PARTICIPATION
The Government of Afghanistan affirms the importance of a gender perspective in decision,
policy and law making in all institutions to promote greater understanding of both women and
men’s needs in the nation building processes. In this light, the Government has set the goal of 80
percent representation of women in high level decision, policy and law making positions in key
government institutions including in the sectors of judiciary, security and service delivery by
the year 2020.18
This chapter provides an analysis of the comparative picture of gender related inequality index,
women in the government sector, women and men in decision making positions, women in
national assembly, cabinet, diplomatic posts, media sector and in community development
councils to track changes in women’s leadership status and political participation.
3.1 MEASURING WOMEN’S EMPOWERMENT
The 2010 Global Human Development Report presented the gender inequality index that
supports the claim that gender inequality remains a major barrier to human developments.Until
2009, human development report estimated two different indicators for measuring women’s
empowerment: Gender related Development Index (GDI) and Gender Empowerment Measure
(GEM). The two measures have been used as advocacy and monitoring tools for gender-related
human development analysis and policy discussions.
3.1.1 Gender related Development Index (GDI)
The Human Development Report 1995 introduced two new measures of human development
that highlight the status of women. The first, Gender-related Development Index (GDI),
measures achievement in the same basic capabilities as the Human Development Index (HDI)
does, but adjusted to take note of inequalities between women and men. A higher GDI reflects a
higher level of development for women and men, while a lower GDI reflects a greater gender
disparity in basic capabilities. Simply stated, the GDI is the HDI discounted, or adjusted
downwards, for gender inequality.
18 Govt. of Afghanistan, 2008. ‘National Action Plan for the Women of Afghanistan (NAPWA)’.

32
GDI in Afghanistan and five other
South Asian countries are presented
in Figure 3.1. The data shows that
Afghanistan has the lowest GDI
among the selected countries in 2004
and 2007. In 2007, Afghanistan’s HDI
was 0.352, making it 154 (out of the
total 182) in the global ranking.
The average annual rate of change of
GDI in Afghanistan was about 1
percent during the 3-year period.
Among the South Asian countries Sri
Lanka has the highest GDI in 2007 at
0.76. However, the rate of change of
GDI was higher for Nepal and
Pakistan both at around 2.5 percent.
3.1.2 Gender Empowerment
Measure (GEM)
The second measure, Gender Empowerment Measure (GEM), evaluates progress in advancing
women's standing in political and economic forums. It examines the extent to which women
and men are able to actively participate in economic and political life and take part in decision-
making. A low GEM shows that women’s participation in political and social life is limited and
they lack opportunities to make use of their capabilities. GEM was not possible to estimate for
Afghanistan due to unavailability of data.
3.1.3 Gender Inequality Index (GII)
Gender inequality remains a major barrier to human development. Girls and women have
made major strides since 1990, but they have not yet gained gender equality. Gender equity is a
key aspect of human development. The 2010 Human Development Report introduced a new
composite index, the Gender Inequality Index which aims to measure multidimensional
inequality in gender.
The GII is unique in including educational attainment, economic and political participation and
female-specific health issues and in accounting for overlapping inequalities at the national level.
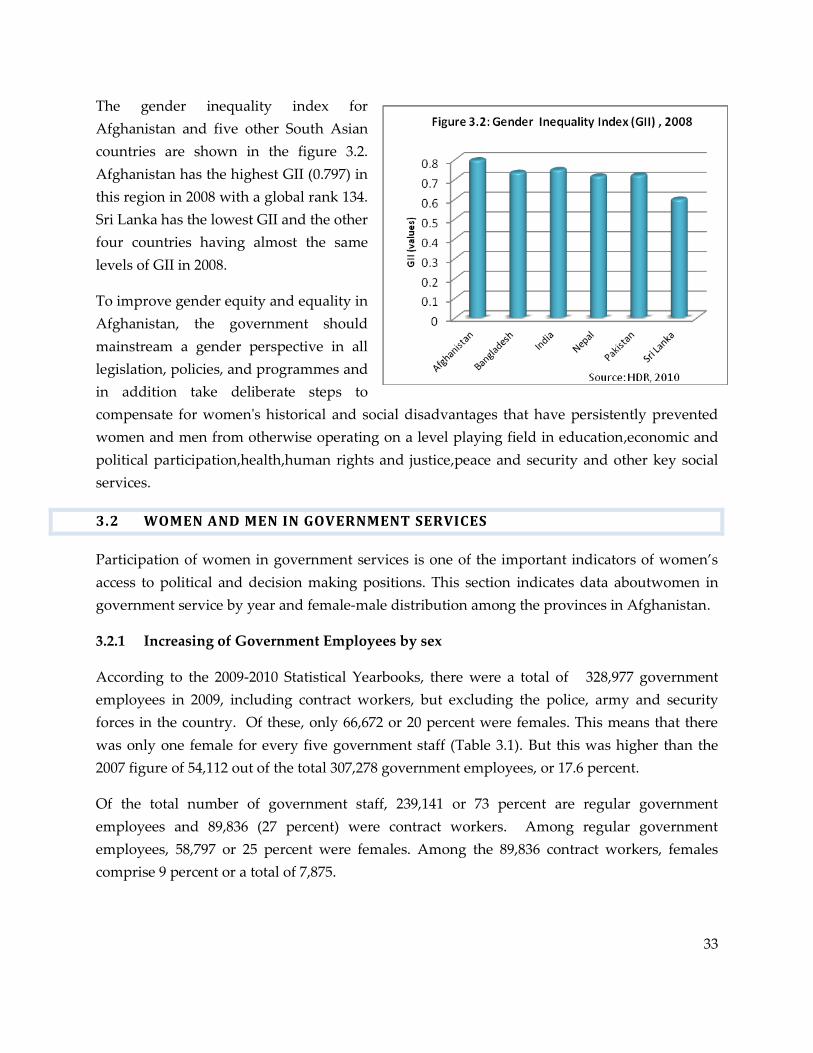
33
The gender inequality index for
Afghanistan and five other South Asian
countries are shown in the figure 3.2.
Afghanistan has the highest GII (0.797) in
this region in 2008 with a global rank 134.
Sri Lanka has the lowest GII and the other
four countries having almost the same
levels of GII in 2008.
To improve gender equity and equality in
Afghanistan, the government should
mainstream a gender perspective in all
legislation, policies, and programmes and
in addition take deliberate steps to
compensate for women's historical and social disadvantages that have persistently prevented
women and men from otherwise operating on a level playing field in education,economic and
political participation,health,human rights and justice,peace and security and other key social
services.
3.2 WOMEN AND MEN IN GOVERNMENT SERVICES
Participation of women in government services is one of the important indicators of women’s
access to political and decision making positions. This section indicates data aboutwomen in
government service by year and female-male distribution among the provinces in Afghanistan.
3.2.1 Increasing of Government Employees by sex
According to the 2009-2010 Statistical Yearbooks, there were a total of 328,977 government
employees in 2009, including contract workers, but excluding the police, army and security
forces in the country. Of these, only 66,672 or 20 percent were females. This means that there
was only one female for every five government staff (Table 3.1). But this was higher than the
2007 figure of 54,112 out of the total 307,278 government employees, or 17.6 percent.
Of the total number of government staff, 239,141 or 73 percent are regular government
employees and 89,836 (27 percent) were contract workers. Among regular government
employees, 58,797 or 25 percent were females. Among the 89,836 contract workers, females
comprise 9 percent or a total of 7,875.
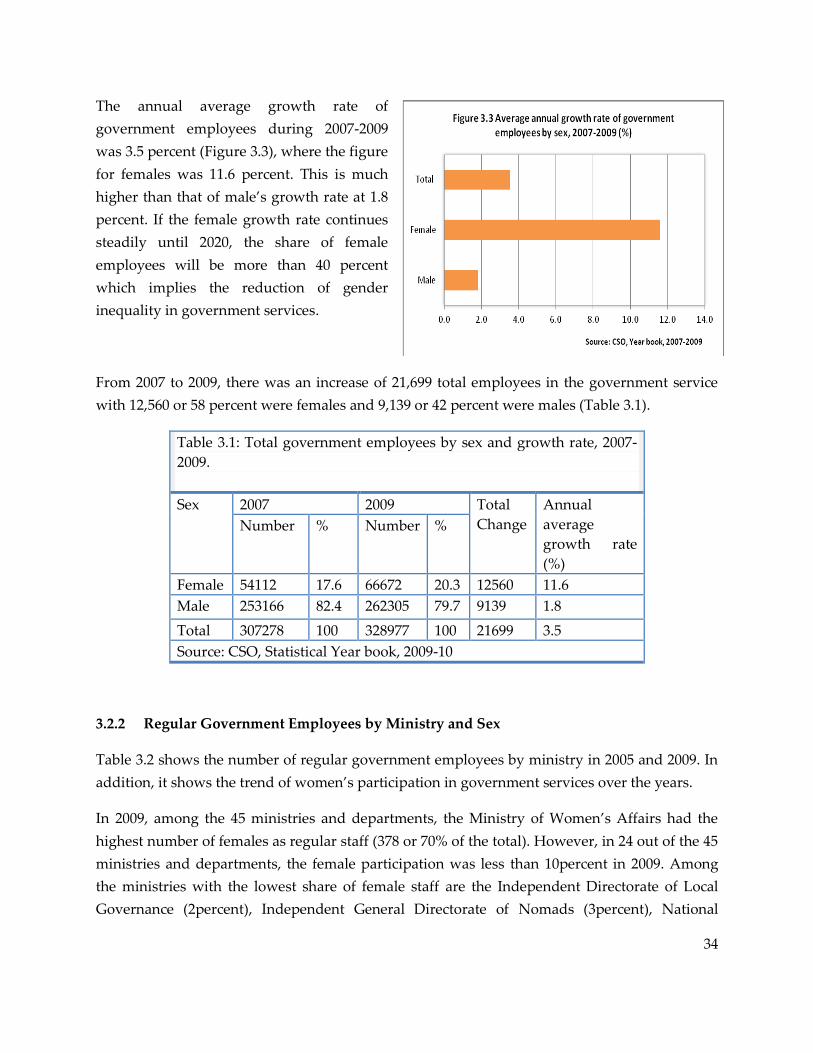
34
The annual average growth rate of
government employees during 2007-2009
was 3.5 percent (Figure 3.3), where the figure
for females was 11.6 percent. This is much
higher than that of male’s growth rate at 1.3
percent. If the female growth rate continues
steadily until 2020, the share of female
employees will be more than 40 percent
which implies the reduction of gender
inequality in government services.
From 2007 to 2009, there was an increase of 21,699 total employees in the government service
with 12,560 or 58 percent were females and 9,139 or 42 percent were males (Table 3.1).
Table 3.1: Total government employees by sex and growth rate, 2007-
2009.
Sex 2007 2009 Total
Change
Annual
average
growth rate
(%)
Number % Number %
Female 54112 17.6 66672 20.3 12560 11.6
Male 253166 82.4 262305 79.7 9139 1.8
Total 307278 100 328977 100 21699 3.5
Source: CSO, Statistical Year book, 2009-10
3.2.2 Regular Government Employees by Ministry and Sex
Table 3.2 shows the number of regular government employees by ministry in 2005 and 2009. In
addition, it shows the trend of women’s participation in government services over the years.
In 2009, among the 45 ministries and departments, the Ministry of Women’s Affairs had the
highest number of females as regular staff (378 or 70% of the total). However, in 24 out of the 45
ministries and departments, the female participation was less than 10percent in 2009. Among
the ministries with the lowest share of female staff are the Independent Directorate of Local
Governance (2percent), Independent General Directorate of Nomads (3percent), National
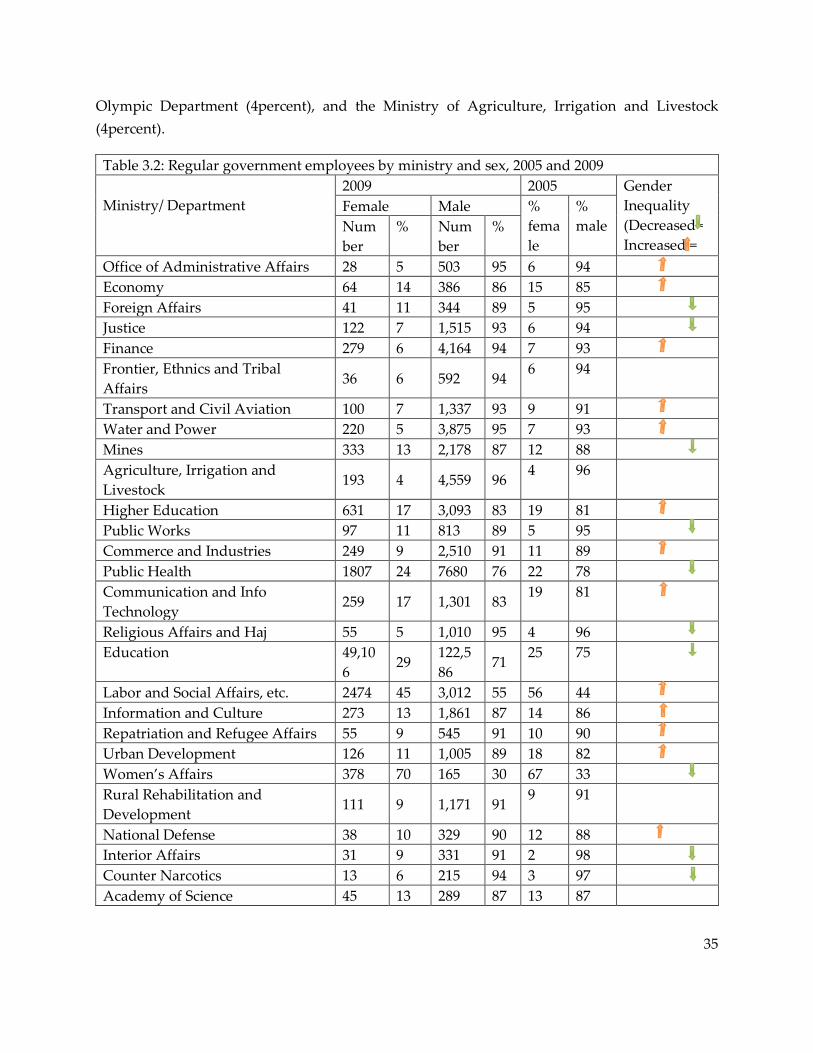
35
Olympic Department (4percent), and the Ministry of Agriculture, Irrigation and Livestock
(4percent).
Table 3.2: Regular government employees by ministry and sex, 2005 and 2009
Ministry/ Department
2009 2005 Gender
Inequality
(Decreased=
Increased =
Female Male %
fema
le
%
male Num
ber
% Num
ber
%
Office of Administrative Affairs 28 5 503 95 6 94
Economy 64 14 386 86 15 85
Foreign Affairs 41 11 344 89 5 95
Justice 122 7 1,515 93 6 94
Finance 279 6 4,164 94 7 93
Frontier, Ethnics and Tribal
Affairs 36 6 592 94
6 94
Transport and Civil Aviation 100 7 1,337 93 9 91
Water and Power 220 5 3,875 95 7 93
Mines 333 13 2,178 87 12 88
Agriculture, Irrigation and
Livestock 193 4 4,559 96
4 96
Higher Education 631 17 3,093 83 19 81
Public Works 97 11 813 89 5 95
Commerce and Industries 249 9 2,510 91 11 89
Public Health 1807 24 7680 76 22 78
Communication and Info
Technology 259 17 1,301 83
19 81
Religious Affairs and Haj 55 5 1,010 95 4 96
Education 49,10
6 29
122,5
86 71
25 75
Labor and Social Affairs, etc. 2474 45 3,012 55 56 44
Information and Culture 273 13 1,861 87 14 86
Repatriation and Refugee Affairs 55 9 545 91 10 90
Urban Development 126 11 1,005 89 18 82
Women’s Affairs 378 70 165 30 67 33
Rural Rehabilitation and
Development 111 9 1,171 91
9 91
National Defense 38 10 329 90 12 88
Interior Affairs 31 9 331 91 2 98
Counter Narcotics 13 6 215 94 3 97
Academy of Science 45 13 289 87 13 87
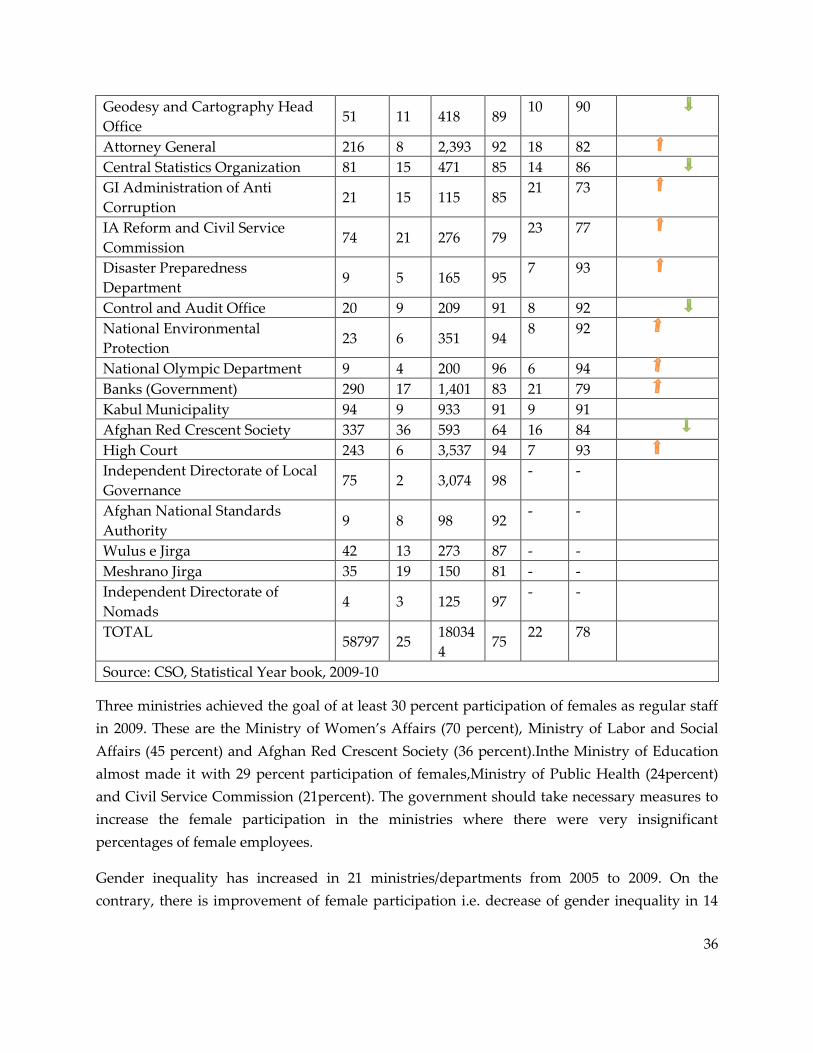
36
Geodesy and Cartography Head
Office 51 11 418 89
10 90
Attorney General 216 8 2,393 92 18 82
Central Statistics Organization 81 15 471 85 14 86
GI Administration of Anti
Corruption 21 15 115 85
21 73
IA Reform and Civil Service
Commission 74 21 276 79
23 77
Disaster Preparedness
Department 9 5 165 95
7 93
Control and Audit Office 20 9 209 91 8 92
National Environmental
Protection 23 6 351 94
8 92
National Olympic Department 9 4 200 96 6 94
Banks (Government) 290 17 1,401 83 21 79
Kabul Municipality 94 9 933 91 9 91
Afghan Red Crescent Society 337 36 593 64 16 84
High Court 243 6 3,537 94 7 93
Independent Directorate of Local
Governance 75 2 3,074 98
- -
Afghan National Standards
Authority 9 8 98 92
- -
Wulus e Jirga 42 13 273 87 - -
Meshrano Jirga 35 19 150 81 - -
Independent Directorate of
Nomads 4 3 125 97
- -
TOTAL 58797 25
18034
4 75
22 78
Source: CSO, Statistical Year book, 2009-10
Three ministries achieved the goal of at least 30 percent participation of females as regular staff
in 2009. These are the Ministry of Women’s Affairs (70 percent), Ministry of Labor and Social
Affairs (45 percent) and Afghan Red Crescent Society (36 percent).Inthe Ministry of Education
almost made it with 29 percent participation of females,Ministry of Public Health (24percent)
and Civil Service Commission (21percent). The government should take necessary measures to
increase the female participation in the ministries where there were very insignificant
percentages of female employees.
Gender inequality has increased in 21 ministries/departments from 2005 to 2009. On the
contrary, there is improvement of female participation i.e. decrease of gender inequality in 14

37
ministries/departments. The most significant improvement is found in Afghan Red Crescent
Society where female participation has increased from 16 percent to 36 percent during the
period 2005-2009 and the most significant decrease was in the Attorney General’s Office where
female participation decreased from 18 percent in 2005 to 8 percent in 2009
3.2.3 Contract Workers in Government Services by Ministry and Sex
Table 3.3 shows the participation of female contract workers in the government services. Out of
the 45 ministries and departments, the Ministry of Women’s Affairs has the highest number of
females as contractual staff (86 or 34percent of total). It is interesting to note that in 17 of the 45
ministries and departments, female comprise more than 10 percent of their contract staff. The
ministry with the lowest number of female contract staff is the Ministry of Religious Affairs and
Haj (25 or 0.4percent)the other ministries/departments with low participation of women, are
Kabul municipality (1 percent), Afghan National Standard Authority (2 percent), National
Olympic Department (2 percent), Counter Narcotics (2 percent) and Ministry of Water and
Power (2 percent).
Gender inequality for the contract workers has increased in 18 ministries/departments from
2005 to 2009. On the contrary, there is improvement of female participation i.e. decrease of
gender inequality in 18 ministries/departments. The most significant improvement is found in
the Ministry of Interior where female participation has increased from 1 percent to 16 percent
from 2005 to 2009, but the biggest decline are in government banks and higher education where
female participation decreased by more than 50 percent 2005 to 2009.
Table 3.3: Contract workers by ministry and sex, 2005 and 2009
Ministry/ Department
2009 2005
Female Male %
fema
le
%
male Num
ber
% Numb
er
%
Office of Administrative Affairs 29 5 591 95 6 94
Economy 39 13 251 87 9 91
Foreign Affairs 11 3 310 97 4 96
Justice 48 9 496 91 15 85
Finance 96 10 841 90 25 75
Frontier, Ethnics and Tribal Affairs 28 6 416 94 6 94
Transport and Civil Aviation 68 10 589 90 4 96
Water and Power 82 2 4,950 98 3 97
Mines 312 7 4,382 93 5 95
Agriculture, Irrigation and Livestock 143 3 3,979 97 4 96
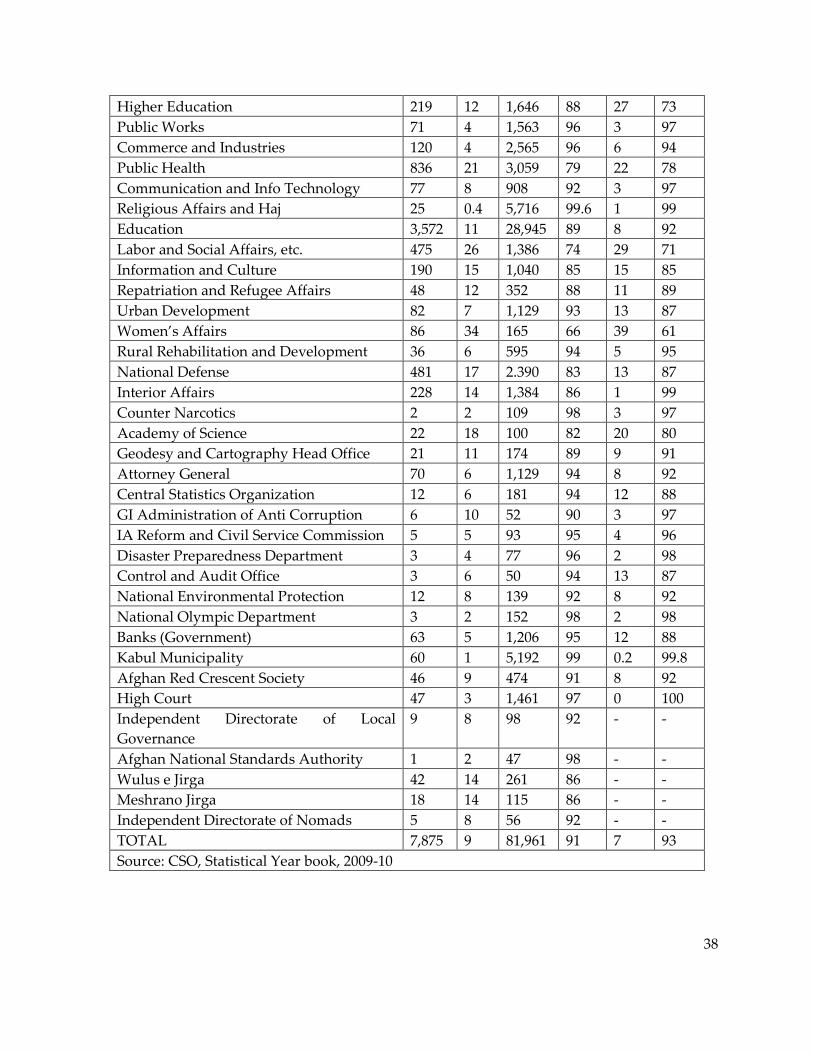
38
Higher Education 219 12 1,646 88 27 73
Public Works 71 4 1,563 96 3 97
Commerce and Industries 120 4 2,565 96 6 94
Public Health 836 21 3,059 79 22 78
Communication and Info Technology 77 8 908 92 3 97
Religious Affairs and Haj 25 0.4 5,716 99.6 1 99
Education 3,572 11 28,945 89 8 92
Labor and Social Affairs, etc. 475 26 1,386 74 29 71
Information and Culture 190 15 1,040 85 15 85
Repatriation and Refugee Affairs 48 12 352 88 11 89
Urban Development 82 7 1,129 93 13 87
Women’s Affairs 86 34 165 66 39 61
Rural Rehabilitation and Development 36 6 595 94 5 95
National Defense 481 17 2.390 83 13 87
Interior Affairs 228 14 1,384 86 1 99
Counter Narcotics 2 2 109 98 3 97
Academy of Science 22 18 100 82 20 80
Geodesy and Cartography Head Office 21 11 174 89 9 91
Attorney General 70 6 1,129 94 8 92
Central Statistics Organization 12 6 181 94 12 88
GI Administration of Anti Corruption 6 10 52 90 3 97
IA Reform and Civil Service Commission 5 5 93 95 4 96
Disaster Preparedness Department 3 4 77 96 2 98
Control and Audit Office 3 6 50 94 13 87
National Environmental Protection 12 8 139 92 8 92
National Olympic Department 3 2 152 98 2 98
Banks (Government) 63 5 1,206 95 12 88
Kabul Municipality 60 1 5,192 99 0.2 99.8
Afghan Red Crescent Society 46 9 474 91 8 92
High Court 47 3 1,461 97 0 100
Independent Directorate of Local
Governance
9 8 98 92 - -
Afghan National Standards Authority 1 2 47 98 - -
Wulus e Jirga 42 14 261 86 - -
Meshrano Jirga 18 14 115 86 - -
Independent Directorate of Nomads 5 8 56 92 - -
TOTAL 7,875 9 81,961 91 7 93
Source: CSO, Statistical Year book, 2009-10

39
3.2.4 Government Employees by Level of Education and Sex The breakdown of government
employees by their highest level of education are shown in Tables 3.4 and 3.5.
It can be seen that among the regular employees, in 2009, one in every two employees is a high
school graduate. Among them, females accounted for only one-fifths (19.3percent). However,
among those who have college degrees and higher education, only three in every ten
(30.0percent) are females, which mean that only few females may be able to occupy higher
positions in the government.
Comparing the 2009 figures with 2005, there hasn’t been a significant difference in the
percentages of female employees, although it can be seen that these figures are relatively higher
than 2009, which means there was a decrease in their percentages particularly in high school,
and college and higher education levels.
Table 3.4: Regular government employees by level of education and sex,
2005 and 2009
Level of Education
2009 2005
Female Male %
female
%
male Numb
er
% Num
ber
%
PH D 6 0.01 98 0.05 0.01 0.12
MSC 262 0.45 2,231 1.24 1.04 1.83
Upper BA 442 0.75 2,384 1.32 0 0
BA/BCS 5,845 9.94 15,39
3 8.54 11.53 8.3
College 11,335 19.2
8
21,68
6
12.0
2 23.24 9.76
High School 23,169 39.4 97,11
9
53.8
5 49.97 52.51
Vocational 294 0.5 1,608 0.89 2.27 2.41
Technical School 74 0.13 483 0.27 0.16 0.15
Primary School 10,326 17.5
6
36,14
8
20.0
4 11.69 24.38
Private School 32 0.05 622 0.35 0.09 0.54
Unknown 7012 11.9
3 2572 1.43 0 0

40
Total 58797 100
18034
4 100 100 100
Source: CSO, Statistical Year book, 2009-10
Table 3.5 shows Government contract workers by highest level of education and sex, in 2005
and 2009.Most of the government contract workers in 2009 have little or no education at all.
Four in every five (80.4percent) female contract workers are uneducated, 6.6 percent have gone
to primary school, and only 0.1 percent (or 7 out of the total 7,875 female contract workers) has
college degrees.
Comparatively, among the male contract workers, three in every four (77.4percent) are
uneducated, 9.6 percent have gone to primary school, and a mere 0.1 percent (70 out of the total
81,961 male contract workers) have college degrees.
Table 3.5: Government contract workers by highest level of
education and sex, 2005 and 2009
Level of
Education
2009 2005
Female Male %
female
%
male Numb
er
% Num
ber
%
Upper BA 19 0.02 0
BA/BCS 0 0.00 0.01
College 7 0.09 70 0.09 0 0
High School 39 0.50 477 0.58 0.42 0.3
Vocational 17 0.22 117 0.14 0.05 0.01
Technical
School
108
1.37
482
0.59 0.61 0.54
Primary
School
522
6.63
5,320
6.49 8.99 11.04
Private School 283 3.59 7,910 9.65 8.46 7.17
Uneducated 6,334
80.4
3
63,40
4
77.3
6 45.27 48.86
Unknown 565 7.17 4,162 5.08 36.2 32.07
Total 7875 100 81961 100 100 100
Source: CSO, Statistical Year book, 2009-10
It is interesting to note that the percentage of male and female contract workers who have no
education at all in 2005 are 48.9 percent and 45.3 percent respectively. This is quite alarming
since it was shown that as years passed, more and more uneducated Afghan persons are
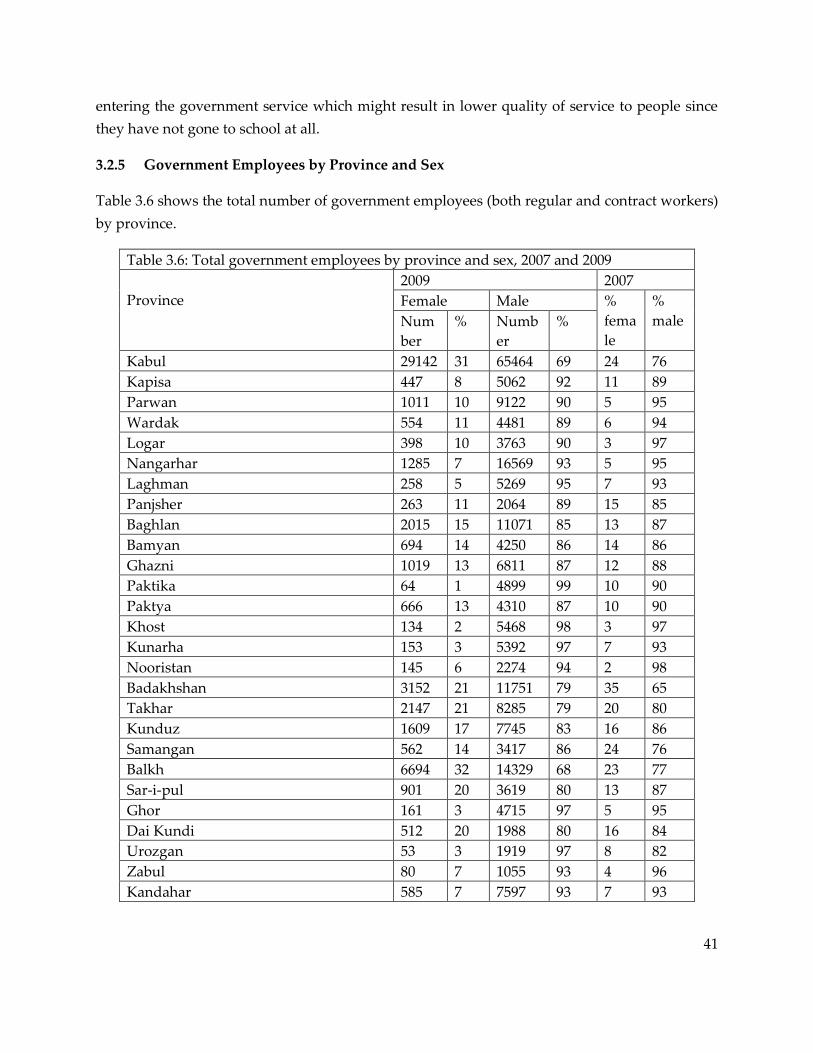
41
entering the government service which might result in lower quality of service to people since
they have not gone to school at all.
3.2.5 Government Employees by Province and Sex
Table 3.6 shows the total number of government employees (both regular and contract workers)
by province.
Table 3.6: Total government employees by province and sex, 2007 and 2009
Province
2009 2007
Female Male %
fema
le
%
male Num
ber
% Numb
er
%
Kabul 29142 31 65464 69 24 76
Kapisa 447 8 5062 92 11 89
Parwan 1011 10 9122 90 5 95
Wardak 554 11 4481 89 6 94
Logar 398 10 3763 90 3 97
Nangarhar 1285 7 16569 93 5 95
Laghman 258 5 5269 95 7 93
Panjsher 263 11 2064 89 15 85
Baghlan 2015 15 11071 85 13 87
Bamyan 694 14 4250 86 14 86
Ghazni 1019 13 6811 87 12 88
Paktika 64 1 4899 99 10 90
Paktya 666 13 4310 87 10 90
Khost 134 2 5468 98 3 97
Kunarha 153 3 5392 97 7 93
Nooristan 145 6 2274 94 2 98
Badakhshan 3152 21 11751 79 35 65
Takhar 2147 21 8285 79 20 80
Kunduz 1609 17 7745 83 16 86
Samangan 562 14 3417 86 24 76
Balkh 6694 32 14329 68 23 77
Sar-i-pul 901 20 3619 80 13 87
Ghor 161 3 4715 97 5 95
Dai Kundi 512 20 1988 80 16 84
Urozgan 53 3 1919 97 8 82
Zabul 80 7 1055 93 4 96
Kandahar 585 7 7597 93 7 93
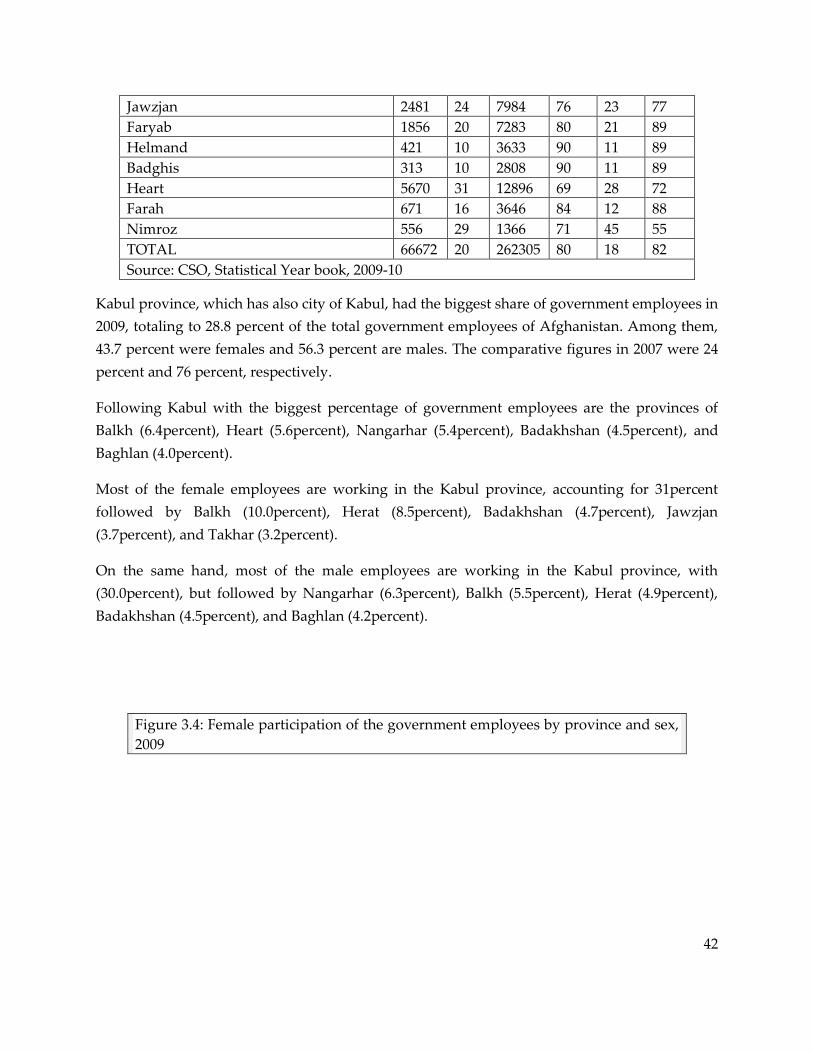
42
Jawzjan 2481 24 7984 76 23 77
Faryab 1856 20 7283 80 21 89
Helmand 421 10 3633 90 11 89
Badghis 313 10 2808 90 11 89
Heart 5670 31 12896 69 28 72
Farah 671 16 3646 84 12 88
Nimroz 556 29 1366 71 45 55
TOTAL 66672 20 262305 80 18 82
Source: CSO, Statistical Year book, 2009-10
Kabul province, which has also city of Kabul, had the biggest share of government employees in
2009, totaling to 28.8 percent of the total government employees of Afghanistan. Among them,
43.7 percent were females and 56.3 percent are males. The comparative figures in 2007 were 24
percent and 76 percent, respectively.
Following Kabul with the biggest percentage of government employees are the provinces of
Balkh (6.4percent), Heart (5.6percent), Nangarhar (5.4percent), Badakhshan (4.5percent), and
Baghlan (4.0percent).
Most of the female employees are working in the Kabul province, accounting for 31percent
followed by Balkh (10.0percent), Herat (8.5percent), Badakhshan (4.7percent), Jawzjan
(3.7percent), and Takhar (3.2percent).
On the same hand, most of the male employees are working in the Kabul province, with
(30.0percent), but followed by Nangarhar (6.3percent), Balkh (5.5percent), Herat (4.9percent),
Badakhshan (4.5percent), and Baghlan (4.2percent).
Figure 3.4: Female participation of the government employees by province and sex,
2009
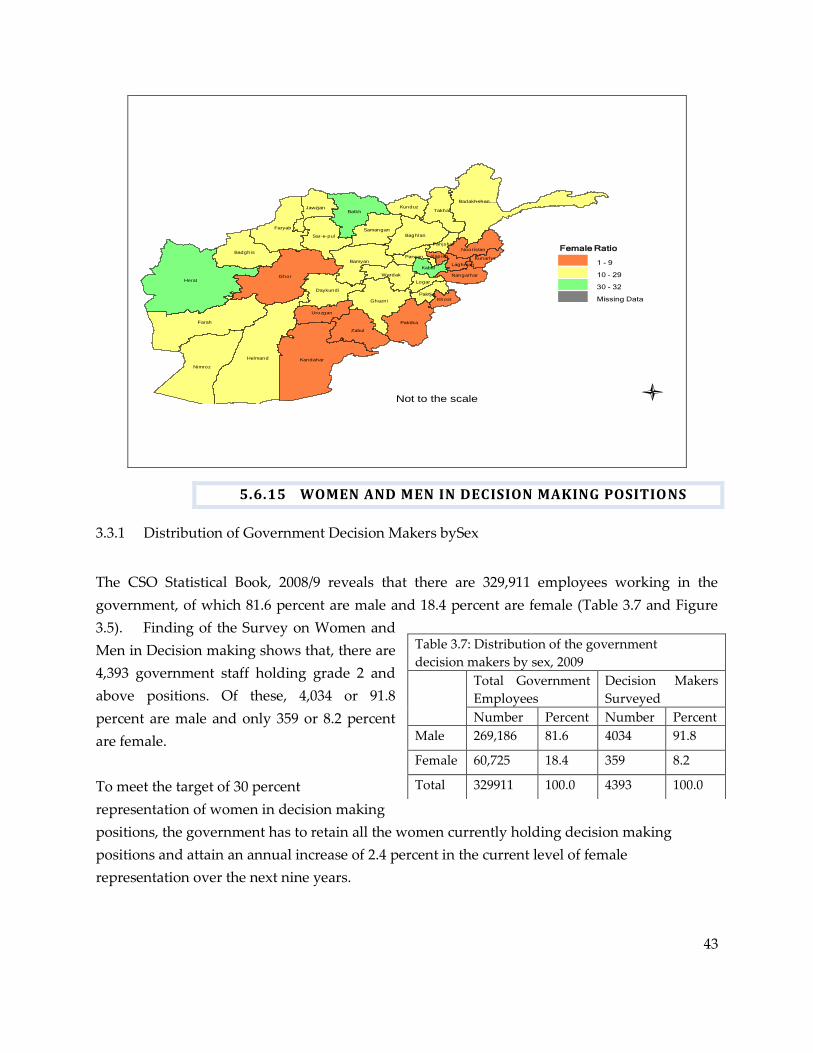
43
l
Farah
Herat
Badghis
Helmand
Nimroz
Parwan Kapisa
KabulLaghman
Nangarhar
Logar
Wardak
Baghlan
Panjsher
Ghor
Sar-e-pul
Balkh
Samangan
Kandahar
Zabul
Urozgan
Daykundi
Faryab
Jawzjan
Paktya
Paktika
Ghazni
Bamyan
Badakhshan
Nooristan
Kunarha
Khost
KunduzTakhar
Female Ratio
1 - 9
10 - 29
30 - 32
Missing Data
Not to the scale
5.6.15 WOMEN AND MEN IN DECISION MAKING POSITIONS
3.3.1 Distribution of Government Decision Makers bySex
The CSO Statistical Book, 2008/9 reveals that there are 329,911 employees working in the
government, of which 81.6 percent are male and 18.4 percent are female (Table 3.7 and Figure
3.5). Finding of the Survey on Women and
Men in Decision making shows that, there are
4,393 government staff holding grade 2 and
above positions. Of these, 4,034 or 91.8
percent are male and only 359 or 8.2 percent
are female.
To meet the target of 30 percent
representation of women in decision making
positions, the government has to retain all the women currently holding decision making
positions and attain an annual increase of 2.4 percent in the current level of female
representation over the next nine years.
Table 3.7: Distribution of the government
decision makers by sex, 2009
Total Government
Employees
Decision Makers
Surveyed
Number Percent Number Percent
Male 269,186 81.6 4034 91.8
Female 60,725 18.4 359 8.2
Total 329911 100.0 4393 100.0
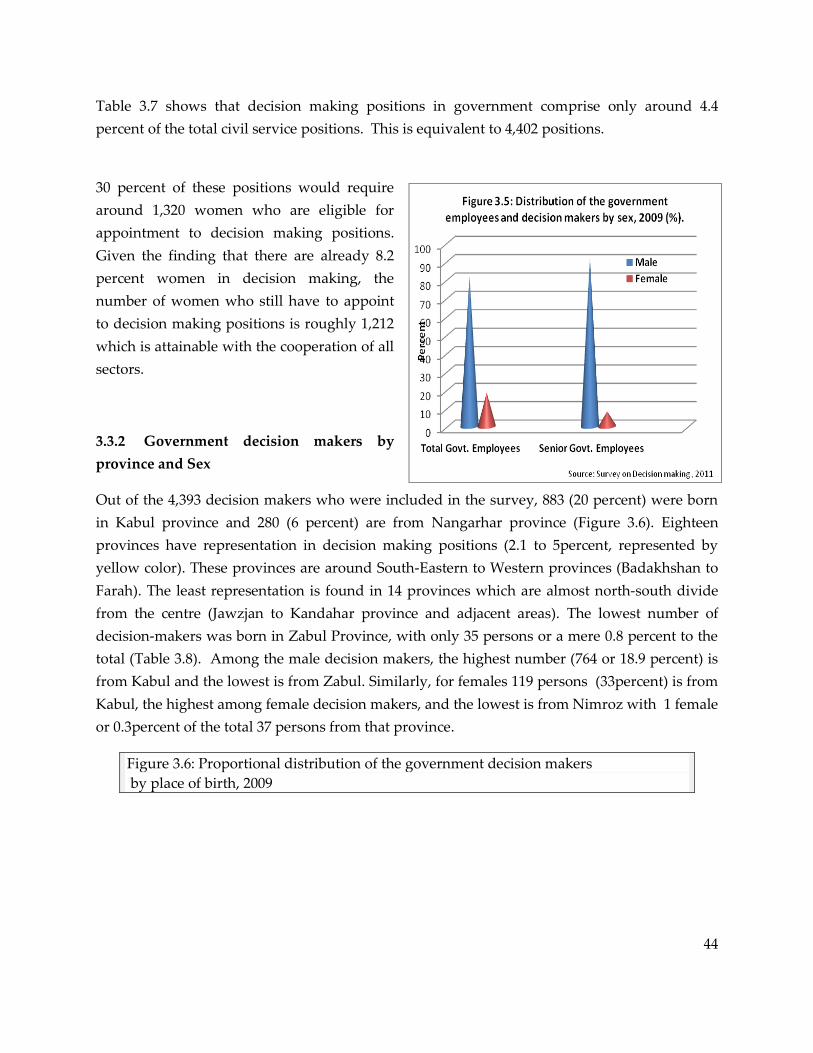
44
Table 3.7 shows that decision making positions in government comprise only around 4.4
percent of the total civil service positions. This is equivalent to 4,402 positions.
30 percent of these positions would require
around 1,320 women who are eligible for
appointment to decision making positions.
Given the finding that there are already 8.2
percent women in decision making, the
number of women who still have to appoint
to decision making positions is roughly 1,212
which is attainable with the cooperation of all
sectors.
3.3.2 Government decision makers by
province and Sex
Out of the 4,393 decision makers who were included in the survey, 883 (20 percent) were born
in Kabul province and 280 (6 percent) are from Nangarhar province (Figure 3.6). Eighteen
provinces have representation in decision making positions (2.1 to 5percent, represented by
yellow color). These provinces are around South-Eastern to Western provinces (Badakhshan to
Farah). The least representation is found in 14 provinces which are almost north-south divide
from the centre (Jawzjan to Kandahar province and adjacent areas). The lowest number of
decision-makers was born in Zabul Province, with only 35 persons or a mere 0.8 percent to the
total (Table 3.8). Among the male decision makers, the highest number (764 or 18.9 percent) is
from Kabul and the lowest is from Zabul. Similarly, for females 119 persons (33percent) is from
Kabul, the highest among female decision makers, and the lowest is from Nimroz with 1 female
or 0.3percent of the total 37 persons from that province.
Figure 3.6: Proportional distribution of the government decision makers
by place of birth, 2009
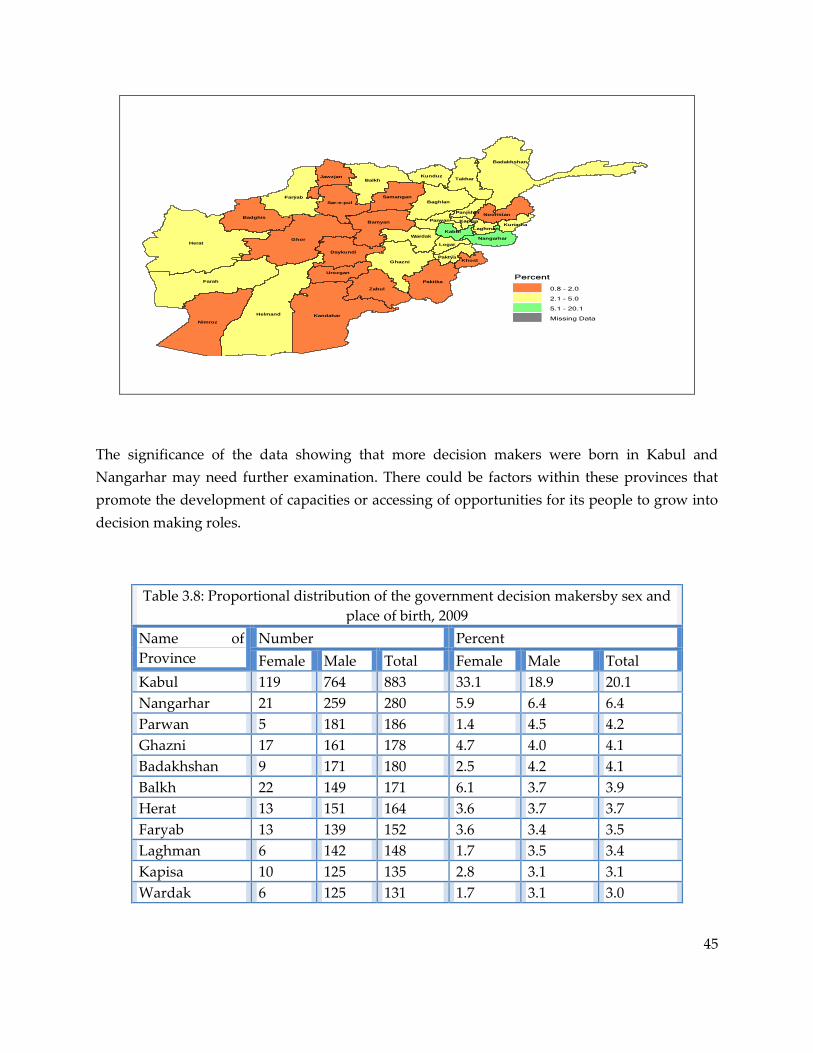
45
The significance of the data showing that more decision makers were born in Kabul and
Nangarhar may need further examination. There could be factors within these provinces that
promote the development of capacities or accessing of opportunities for its people to grow into
decision making roles.
Table 3.8: Proportional distribution of the government decision makersby sex and
place of birth, 2009
Name of
Province
Number Percent
Female Male Total Female Male Total
Kabul 119 764 883 33.1 18.9 20.1
Nangarhar 21 259 280 5.9 6.4 6.4
Parwan 5 181 186 1.4 4.5 4.2
Ghazni 17 161 178 4.7 4.0 4.1
Badakhshan 9 171 180 2.5 4.2 4.1
Balkh 22 149 171 6.1 3.7 3.9
Herat 13 151 164 3.6 3.7 3.7
Faryab 13 139 152 3.6 3.4 3.5
Laghman 6 142 148 1.7 3.5 3.4
Kapisa 10 125 135 2.8 3.1 3.1
Wardak 6 125 131 1.7 3.1 3.0
l
Farah
Herat
Badghis
Helmand
Nimroz
Parwan Kapisa
KabulLaghman
Nangarhar
Logar
Wardak
Baghlan
Panjsher
Ghor
Sar-e-pul
Balkh
Samangan
Kandahar
Zabul
Urozgan
Daykundi
Faryab
Jawzjan
Paktya
Paktika
Ghazni
Bamyan
Badakhshan
Nooristan
Kunarha
Khost
KunduzTakhar

46
Logar 8 124 132 2.2 3.1 3.0
Baghlan 9 121 130 2.5 3.0 3.0
Takhar 4 121 125 1.1 3.0 2.8
Kunduz 8 106 114 2.2 2.6 2.6
Paktiya 4 110 114 1.1 2.7 2.6
Panjsher 6 103 109 1.7 2.5 2.5
Kunarha 7 100 107 2.0 2.5 2.4
Helmand 6 92 98 1.7 2.3 2.2
Farah 5 88 93 1.4 2.2 2.1
Samangan 5 79 84 1.4 2.0 1.9
Khost 4 68 72 1.1 1.7 1.6
Jawzjan 10 59 69 2.8 1.5 1.6
Kandahar 4 63 67 1.1 1.6 1.5
Paktika 5 51 56 1.4 1.3 1.3
Sar-e-Pul 7 52 59 2.0 1.3 1.3
Urozgan 2 49 51 0.6 1.2 1.2
Bamyan 3 51 54 0.8 1.3 1.2
Nooristan 4 44 48 1.1 1.1 1.1
Badghis 6 36 42 1.7 0.9 1.0
Ghor 4 41 45 1.1 1.0 1.0
Dai Kundi 3 40 43 0.8 1.0 1.0
Zabul 3 32 35 0.8 0.8 0.8
Nimro 1 36 37 0.3 0.9 0.8
Unknown 0 1 1 0.0 0.0 0.0
Total 359 4034 4393 100.0 100.0 100.0
Source: Women and Men in Decision making, CSO, 2011
3.3.3 Gender parity among government decision makers by province
The Gender Parity Index (GPI) was calculated by province based on the place of birth of the
government decision makers and presented in Fig. 3.7. At national level, the ratio of female and
male in decision making position is 10:90 or GPI=0.9
The provincial level data showed that five provinces have rationally higher GPI with a ratio of
15:85. These provinces are Kabul, Badghis, Jawzjan, Balkh and Sar-e-pul.The next level of high
gender parity (10:90) was found in 21 provinces which are scattered all over the country.

47
Figure 3.7: Gender Parity (F/M) of the government decision makers, by province, 2009
The worst scenario is found in eight provinces where the female-male ratio is 5:95 or less. These
provinces are mostly in Eastern and North-Eastern regions. It is important to pay attention to
the recruitment of women in provinces where there is less female representation. A quota policy
in this regard may be considered for the provinces that are extremely lagging behind in meeting
the government’s target on women’s participation in decision making.
3.3.4 Government Agencies with relatively higher representation of women decision making
According to the Women and Men in Decision Making Survey, eight (17 percent) of the 47
surveyed organizations registered a relatively higher representation of women in decision
making.These are: the Provincial Council, both Houses of the Parliament, Ministry of Women’s
Affairs (MOWA), IARCSC, Independent Directorate of Local Governance (IDLG), Ministry of
Public Health (MOPH), and Attorney General’s Office. The rest of the 47 ministries/agencies
have only less than eight women decision makers.
l
Farah
Herat
Badghis
Helmand
Nimroz
ParwanKapisa
KabulLaghman
Nangarhar
Logar
Wardak
Baghlan
Panjsher
Ghor
Sar-e-pul
Balkh
Samangan
Kandahar
Zabul
Urozgan
Daykundi
Faryab
Jawzjan
Paktya
Paktika
Ghazni
Bamyan
Badakhshan
Nooristan
Kunarha
Khost
KunduzTakhar
Ratio =F: M
5:95
10:90
15:85
Missing Data
Not to the scale
N
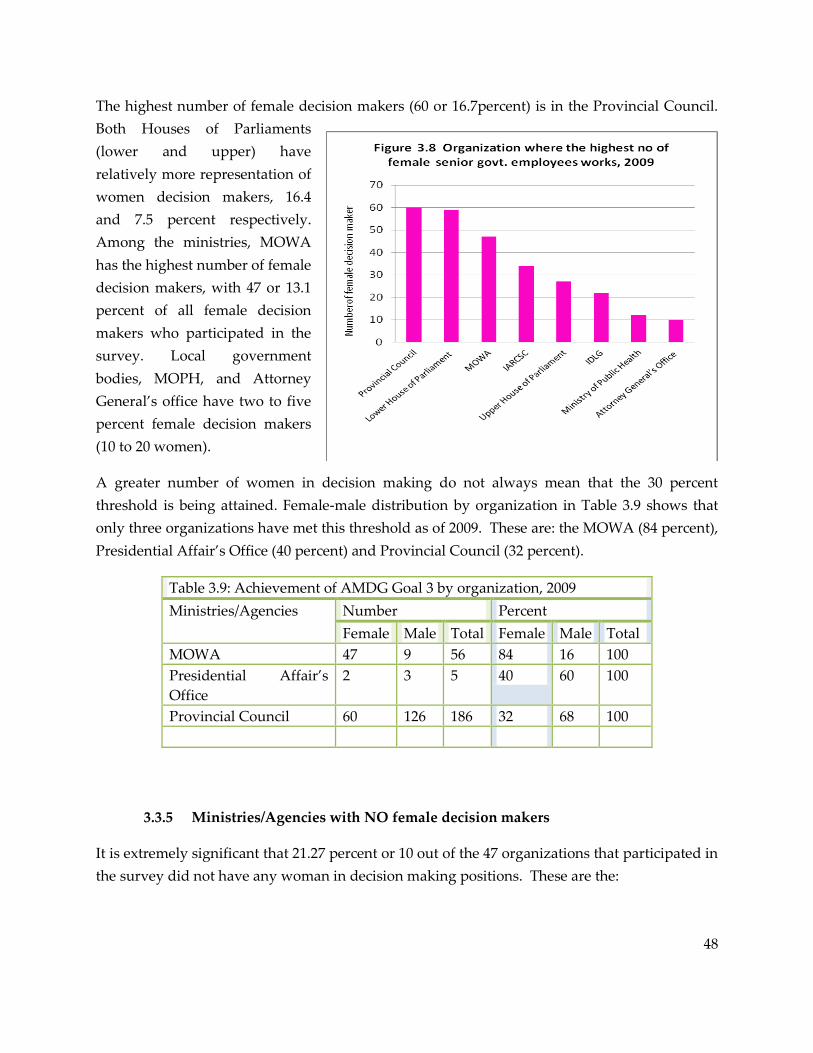
48
The highest number of female decision makers (60 or 16.7percent) is in the Provincial Council.
Both Houses of Parliaments
(lower and upper) have
relatively more representation of
women decision makers, 16.4
and 7.5 percent respectively.
Among the ministries, MOWA
has the highest number of female
decision makers, with 47 or 13.1
percent of all female decision
makers who participated in the
survey. Local government
bodies, MOPH, and Attorney
General’s office have two to five
percent female decision makers
(10 to 20 women).
A greater number of women in decision making do not always mean that the 30 percent
threshold is being attained. Female-male distribution by organization in Table 3.9 shows that
only three organizations have met this threshold as of 2009. These are: the MOWA (84 percent),
Presidential Affair’s Office (40 percent) and Provincial Council (82 percent).
Table 3.9: Achievement of AMDG Goal 3 by organization, 2009
Ministries/Agencies
Number Percent
Female Male Total Female Male Total
MOWA 47 9 56 84 16 100
Presidential Affair’s
Office
2 3 5 40 60 100
Provincial Council 60 126 186 32 68 100
3.3.5 Ministries/Agencies with NO female decision makers
It is extremely significant that 21.27 percent or 10 out of the 47 organizations that participated in
the survey did not have any woman in decision making positions. These are the:
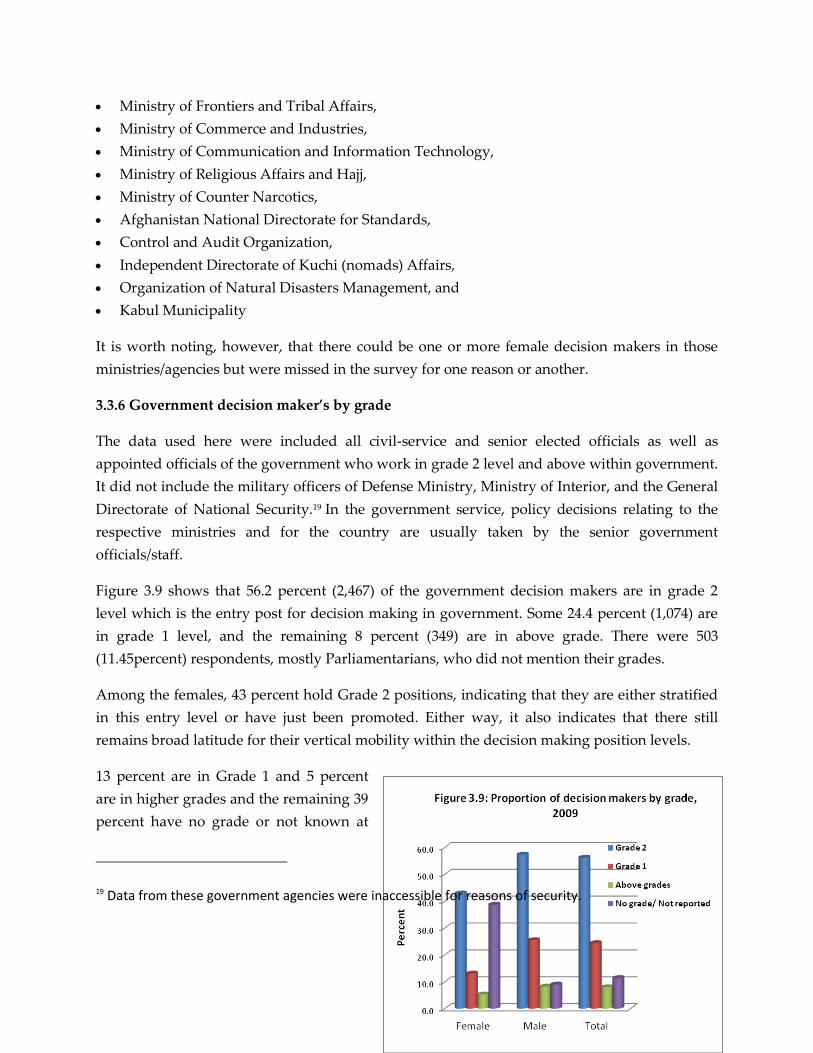
49
Ministry of Frontiers and Tribal Affairs,
Ministry of Commerce and Industries,
Ministry of Communication and Information Technology,
Ministry of Religious Affairs and Hajj,
Ministry of Counter Narcotics,
Afghanistan National Directorate for Standards,
Control and Audit Organization,
Independent Directorate of Kuchi (nomads) Affairs,
Organization of Natural Disasters Management, and
Kabul Municipality
It is worth noting, however, that there could be one or more female decision makers in those
ministries/agencies but were missed in the survey for one reason or another.
3.3.6 Government decision maker’s by grade
The data used here were included all civil-service and senior elected officials as well as
appointed officials of the government who work in grade 2 level and above within government.
It did not include the military officers of Defense Ministry, Ministry of Interior, and the General
Directorate of National Security.19 In the government service, policy decisions relating to the
respective ministries and for the country are usually taken by the senior government
officials/staff.
Figure 3.9 shows that 56.2 percent (2,467) of the government decision makers are in grade 2
level which is the entry post for decision making in government. Some 24.4 percent (1,074) are
in grade 1 level, and the remaining 8 percent (349) are in above grade. There were 503
(11.45percent) respondents, mostly Parliamentarians, who did not mention their grades.
Among the females, 43 percent hold Grade 2 positions, indicating that they are either stratified
in this entry level or have just been promoted. Either way, it also indicates that there still
remains broad latitude for their vertical mobility within the decision making position levels.
13 percent are in Grade 1 and 5 percent
are in higher grades and the remaining 39
percent have no grade or not known at
19 Data from these government agencies were inaccessible for reasons of security.
50
all. It is worth noting that the proportion of females in higher grades and Grade 2 is lower than
their male counterparts.
This finding calls attention to the need to uplift more women to Grade 1 and higher positions
which will need policy and program interventions, such as quota and planned capacity
building for selected qualified women from Grades 2 and 1 level.
5.6.16 MEMBERSHIP COMPOSITION IN NATIONAL ASSEMBLY
AND PROVINCIAL COUNCILS
Afghanistan has a bicameral legislature comprised of the Lower House or Wolesi Jirga and the
Upper House or Meshrano Jirga. The Lower House (or The People’s Council) consists of 249
members who are elected directly by the people’s vote for a five- year term. Among the 249
seats in the Lower House, 68 seats are reserved for the women as per the Afghanistan
Constitution. In the Upper House, of the 102 seats, 34 members are appointed by the President
of Afghanistan for a five- year term, 34 members are appointed by the district councils for a
three- year term, and the remaining 34 for four-year term. As per the Constitution, 50 percent of
the presidential appointees in the Upper House must be women.
In the last parliamentarian election in 2010, 69 women (28percent) were elected in the Lower
House of parliament. There is no significant change from the last election in 2005 where 27
percent were women.
In the Upper house, the women’s representation was 26 percent (or 27 women) in 2010, which
was 3.5 percent higher than that of women’s representation in 2005. These figures show that
women’s representation in both houses are increasing, and nearing the 80percent target as
stipulated in the MDG Goal. This seems that the women participation in both the houses are
approaching to the target of 30 percent representation of women. To make 30 percent women in
parliament, there need to be elected another 14 women in lower house and 6 women in upper
house.
Table 3.10: Proportion of Women as Members of the National Assembly and
Provincial Council, 2010 and 2005
National Assembly
2010 2005
Women Total
number
Women Total
Number Number % Number %
Lower House 69 28 249 68 27 249
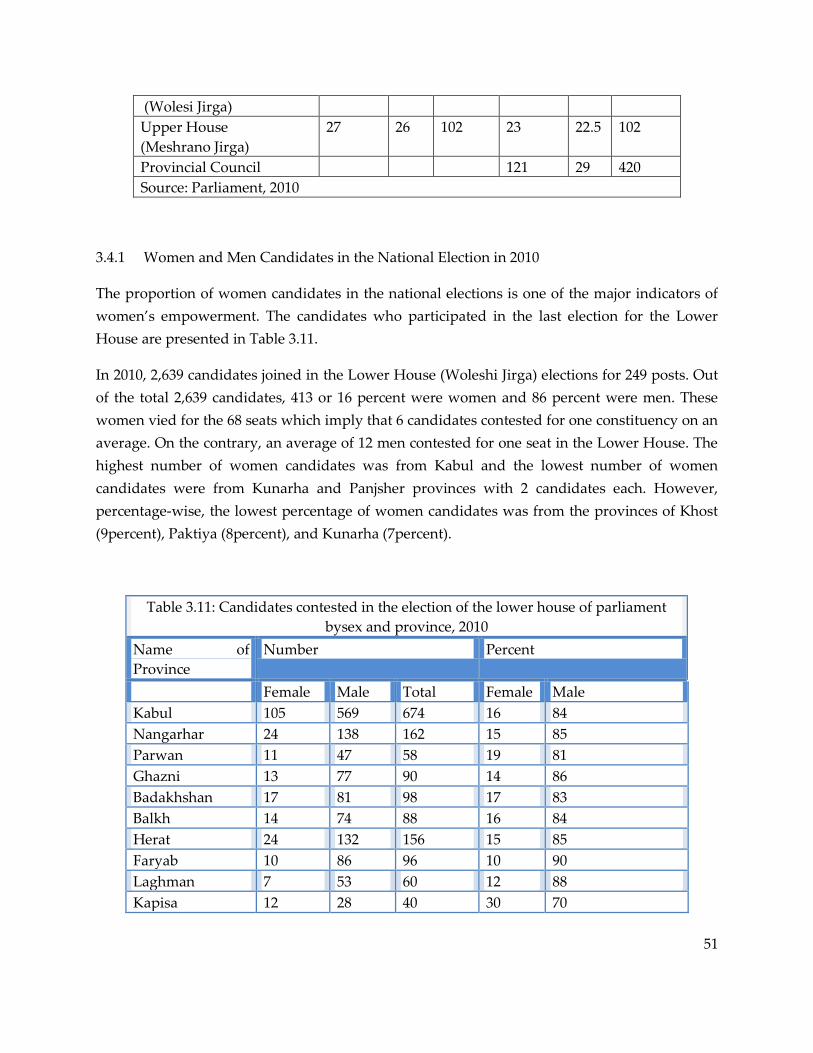
51
(Wolesi Jirga)
Upper House
(Meshrano Jirga)
27 26 102 23 22.5 102
Provincial Council 121 29 420
Source: Parliament, 2010
3.4.1 Women and Men Candidates in the National Election in 2010
The proportion of women candidates in the national elections is one of the major indicators of
women’s empowerment. The candidates who participated in the last election for the Lower
House are presented in Table 3.11.
In 2010, 2,639 candidates joined in the Lower House (Woleshi Jirga) elections for 249 posts. Out
of the total 2,639 candidates, 413 or 16 percent were women and 86 percent were men. These
women vied for the 68 seats which imply that 6 candidates contested for one constituency on an
average. On the contrary, an average of 12 men contested for one seat in the Lower House. The
highest number of women candidates was from Kabul and the lowest number of women
candidates were from Kunarha and Panjsher provinces with 2 candidates each. However,
percentage-wise, the lowest percentage of women candidates was from the provinces of Khost
(9percent), Paktiya (8percent), and Kunarha (7percent).
Table 3.11: Candidates contested in the election of the lower house of parliament
bysex and province, 2010
Name of
Province
Number Percent
Female Male Total Female Male
Kabul 105 569 674 16 84
Nangarhar 24 138 162 15 85
Parwan 11 47 58 19 81
Ghazni 13 77 90 14 86
Badakhshan 17 81 98 17 83
Balkh 14 74 88 16 84
Herat 24 132 156 15 85
Faryab 10 86 96 10 90
Laghman 7 53 60 12 88
Kapisa 12 28 40 30 70
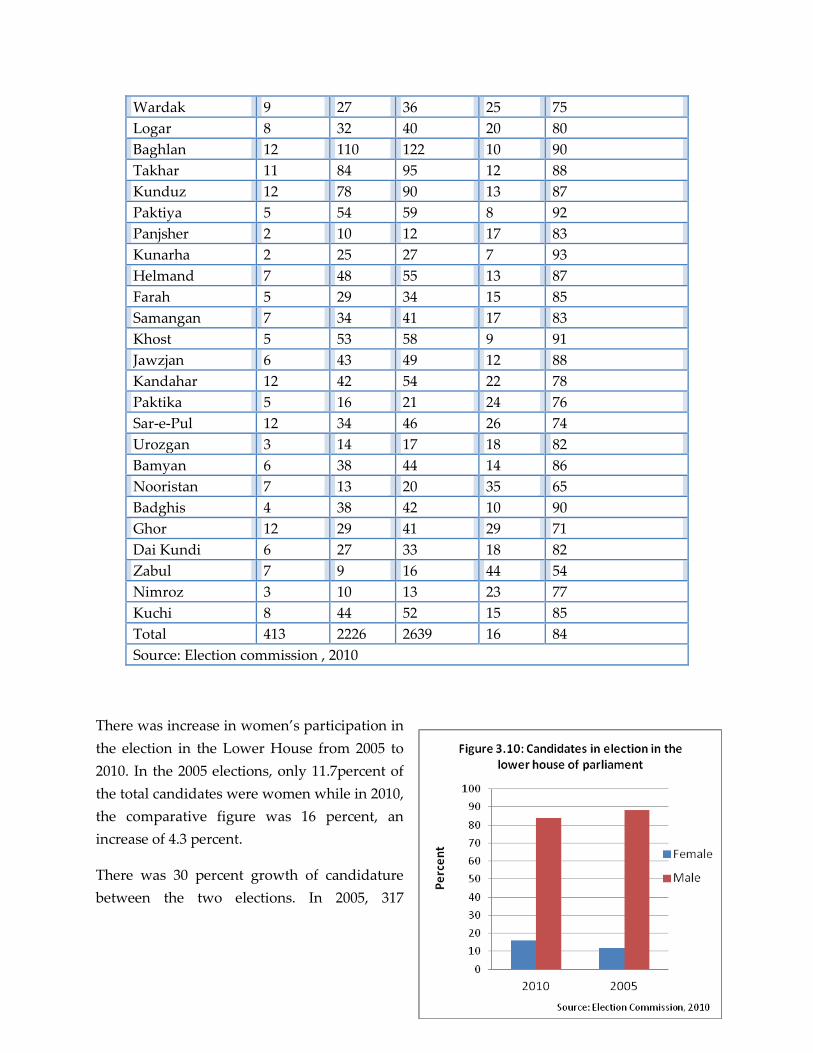
52
Wardak 9 27 36 25 75
Logar 8 32 40 20 80
Baghlan 12 110 122 10 90
Takhar 11 84 95 12 88
Kunduz 12 78 90 13 87
Paktiya 5 54 59 8 92
Panjsher 2 10 12 17 83
Kunarha 2 25 27 7 93
Helmand 7 48 55 13 87
Farah 5 29 34 15 85
Samangan 7 34 41 17 83
Khost 5 53 58 9 91
Jawzjan 6 43 49 12 88
Kandahar 12 42 54 22 78
Paktika 5 16 21 24 76
Sar-e-Pul 12 34 46 26 74
Urozgan 3 14 17 18 82
Bamyan 6 38 44 14 86
Nooristan 7 13 20 35 65
Badghis 4 38 42 10 90
Ghor 12 29 41 29 71
Dai Kundi 6 27 33 18 82
Zabul 7 9 16 44 54
Nimroz 3 10 13 23 77
Kuchi 8 44 52 15 85
Total 413 2226 2639 16 84
Source: Election commission , 2010
There was increase in women’s participation in
the election in the Lower House from 2005 to
2010. In the 2005 elections, only 11.7percent of
the total candidates were women while in 2010,
the comparative figure was 16 percent, an
increase of 4.3 percent.
There was 30 percent growth of candidature
between the two elections. In 2005, 317
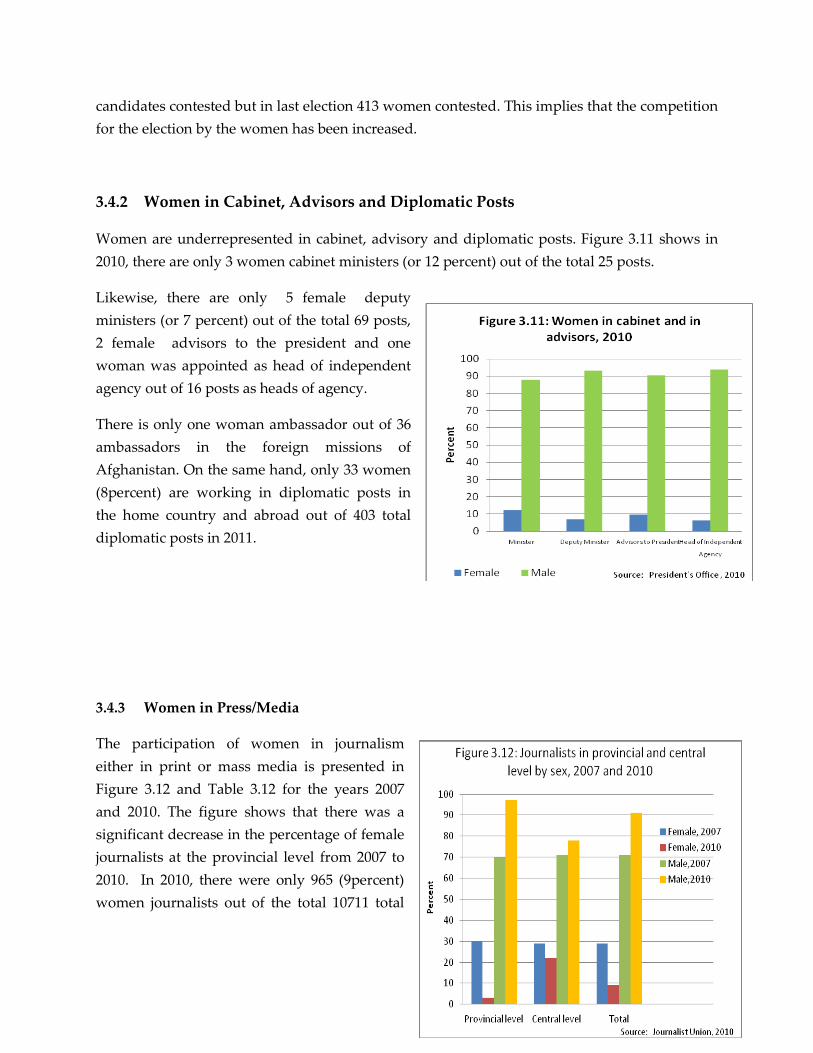
53
candidates contested but in last election 413 women contested. This implies that the competition
for the election by the women has been increased.
3.4.2 Women in Cabinet, Advisors and Diplomatic Posts
Women are underrepresented in cabinet, advisory and diplomatic posts. Figure 3.11 shows in
2010, there are only 3 women cabinet ministers (or 12 percent) out of the total 25 posts.
Likewise, there are only 5 female deputy
ministers (or 7 percent) out of the total 69 posts,
2 female advisors to the president and one
woman was appointed as head of independent
agency out of 16 posts as heads of agency.
There is only one woman ambassador out of 36
ambassadors in the foreign missions of
Afghanistan. On the same hand, only 33 women
(8percent) are working in diplomatic posts in
the home country and abroad out of 403 total
diplomatic posts in 2011.
3.4.3 Women in Press/Media
The participation of women in journalism
either in print or mass media is presented in
Figure 3.12 and Table 3.12 for the years 2007
and 2010. The figure shows that there was a
significant decrease in the percentage of female
journalists at the provincial level from 2007 to
2010. In 2010, there were only 965 (9percent)
women journalists out of the total 10711 total
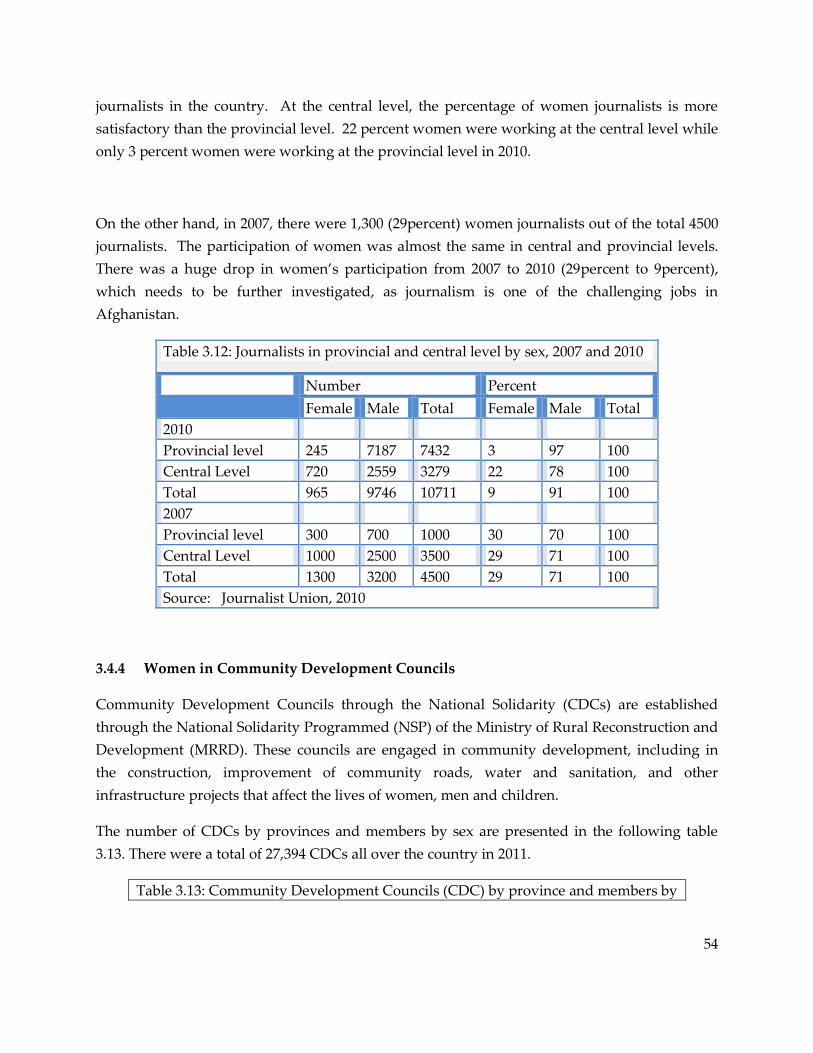
54
journalists in the country. At the central level, the percentage of women journalists is more
satisfactory than the provincial level. 22 percent women were working at the central level while
only 3 percent women were working at the provincial level in 2010.
On the other hand, in 2007, there were 1,300 (29percent) women journalists out of the total 4500
journalists. The participation of women was almost the same in central and provincial levels.
There was a huge drop in women’s participation from 2007 to 2010 (29percent to 9percent),
which needs to be further investigated, as journalism is one of the challenging jobs in
Afghanistan.
Table 3.12: Journalists in provincial and central level by sex, 2007 and 2010
Number Percent
Female Male Total Female Male Total
2010
Provincial level 245 7187 7432 3 97 100
Central Level 720 2559 3279 22 78 100
Total 965 9746 10711 9 91 100
2007
Provincial level 300 700 1000 30 70 100
Central Level 1000 2500 3500 29 71 100
Total 1300 3200 4500 29 71 100
Source: Journalist Union, 2010
3.4.4 Women in Community Development Councils
Community Development Councils through the National Solidarity (CDCs) are established
through the National Solidarity Programmed (NSP) of the Ministry of Rural Reconstruction and
Development (MRRD). These councils are engaged in community development, including in
the construction, improvement of community roads, water and sanitation, and other
infrastructure projects that affect the lives of women, men and children.
The number of CDCs by provinces and members by sex are presented in the following table
3.13. There were a total of 27,394 CDCs all over the country in 2011.
Table 3.13: Community Development Councils (CDC) by province and members by

55
sex, 2011 and 2005.
Province
2011 2005
CDCs
Number
Members Members
Female Male % female %
male Number % Number %
Kabul 810 4264 36 7656 64 38 62
Kapisa 713 1803 27 4982 73 30 70
Parwan 825 2883 28 7491 72 18 82
Wardak 1067 6033 43 8087 57 32 68
Logar 606 2932 37 5023 63 29 71
Nangarhar 1288 10747 45 12965 55 26 74
Laghman 763 2829 33 5846 67 18 82
Panjsher 234 1645 34 3156 66 8 92
Baghlan 930 2388 27 6333 73 24 76
Bamyan 705 3726 41 5299 59 34 66
Ghazni 1489 4264 29 10551 71 31 69
Paktika 675 2344 33 4851 67 18 82
Paktya 770 2423 32 5087 68 25 75
Khost 771 1092 15 6234 85 19 81
Kunarha 877 946 12 6704 88 11 89
Nooristan 252 102 6 1671 94 9 91
Badakhshan 1742 3049 27 8360 73 18 82
Takhar 1323 3913 34 7745 66 25 75
Kunduz 857 2775 26 7770 74 24 76
Samangan 481 3631 46 4201 54 41 59
Balkh 859 5367 44 6857 56 30 70
Sar-i-pul 612 3135 41 4585 59 27 73
Ghor 1293 7197 37 12254 63 12 88
Dai Kundi 590 3124 44 3963 56 38 62
Urozgan 343 0 0 3521 100 0 100
Zabul 165 9 1 1648 99 3 97
Kandahar 901 1 0 7385 100 1 99
Jawzjan 504 2577 35 4735 65 26 74
Faryab 987 4858 34 9243 66 24 76
Helmand 567 108 2 5108 98 0.4 99.6
Badghis 572 609 18 2795 82 35 65
Herat 1960 9536 39 14941 61 46 54
Farah 490 2331 36 4091 64 27 73
Nimroz 373 325 12 2406 88 10 90
TOTAL 27394 102966 33 213544 67 24 76
56
The total number of members is 316,510, of which 102,966 (33percent) were females and 213,544
(67percent) were males. In 2005, the comparative figure 24 percent which implies that there was
a remarkable increase in women’s participation and this trend would foster the women’s
empowerment in the country.
Of the 34 provinces, more than half (19 provinces) have more than 30 percent female
participation in CDCs in 2011, while in 2007 the figure was only 9 provinces.
The highest participation of women was found in Samangan province (46percent) and the
lowest was in Urozgan and Kandahar provinces. Five provinces have less than 10 percent
women in CDCs in 2011, namely Nooristan (6percent), Helmand (2percent), Zabul (1percent),
Urozgan (0percent), and Kandahar (0percent).
5.6.17 DATA GAPS
Data on the actual number of Community Development Councilsby sex is not available. CSO
does not publish the data in the regular publication in the Statistical YearBook.
5.6.18 RESEARCH NEEDS
Qualitative research for causal analysis of poor participation of women, in particular the 5
provinces with less than 10 percent women’s participation. The gender empowerment measure
can be established based on data on percentage of female professional and technical workers