Embed Size (px)
Citation preview
WWWWWomen and Men in omen and Men in omen and Men in omen and Men in omen and Men in ArmeniaArmeniaArmeniaArmeniaArmenia
A Statistical Booklet
Ðì SA
National Statistical ServiceNational Statistical ServiceNational Statistical ServiceNational Statistical ServiceNational Statistical Serviceof the Republic of of the Republic of of the Republic of of the Republic of of the Republic of ArmeniaArmeniaArmeniaArmeniaArmenia
Yerevan - 2004
WOMEN AND MEN IN ARMENIA, 2003(A Statistical Booklet)
© NANANANANATIONALTIONALTIONALTIONALTIONAL ST ST ST ST STAAAAATISTICALTISTICALTISTICALTISTICALTISTICAL SER SER SER SER SERVICE OF VICE OF VICE OF VICE OF VICE OF THETHETHETHETHEREPUBLIC OF REPUBLIC OF REPUBLIC OF REPUBLIC OF REPUBLIC OF ARMENIA, 2004. - 73 pages.ARMENIA, 2004. - 73 pages.ARMENIA, 2004. - 73 pages.ARMENIA, 2004. - 73 pages.ARMENIA, 2004. - 73 pages.
3 Government House, Republic Square
Yerevan, 375010
http://www.armstat.am
E-mail: armstat@@@@@sci.am
Phone: (3741) 523-356
3
ContentsContentsContentsContentsContents
Gender Issues...............................................................................4
UN Millenium Development Goals, Poverty Reduction StrategyPaper of Armenia and Gender.......................................................5
The need for Gender Statistics......................................................7
Reading Guide..............................................................................8
Population......................................................................................9
Health..........................................................................................20
Social Security and Social Defence ............................................28
Family and Household................................................................33
Education.....................................................................................35
Work and Employment................................................................44
Crime...........................................................................................61
Power and Influence...................................................................66
4
Gender Issues
A general analysis of the gender situation was presented to
the international community during the United Nations (UN) FourthWorld Beijing Conferance on Women in 1995. Discussions ensuredregarding the gender problems and an action plan to remedy themparticularly in the field of educational information. The followinghas been defined:
• According to Article 206 (a), national, regional, and
international statistical agencies, as well as specialized governmentagencies cooperating with the scientific research institutions willprovide the UN with the collection, processing, analysis andpresentation of information on age/sex composition of population,expressing the interrelationship and problems of women and menin the different sectors of society.
• According to Article 207 (a), the states (countries) should
provide clear statistical publications on women and men.
In 2000, during the preparatory meetings of "Beijing+5"organized by the United Nations Economic Commission for Europe(UNECE), the monitoring of the implementation process formulas,adopted during the Fourth World Beijing Conferance, was presented.Comments included that in developing countries the existing genderinequality delays the economic growth and the poverty reductionactivities. This situation is definitely stressful for very poor householdswith low incomes. Additionally, mention was made of all the countriesof the UNECE region especially with respect to the political decision-making process:
• Lack of women's participation,
5
• An undeveloped civil society,
• An unstable and weak economy and labor market,
• A downward-leaning social situation
• Women trafficking
• Inter-ethical tension
• Armed conflict, etc.
UN Millennium Development Goals, PovertyReduction Strategy Paper of the Republic ofArmenia (RA) and Gender
The following outlines the Poverty Reduction Strategy Paperof the RA and gender issues:
° Article 15 of the Armenian Constitution, namely, the
provision on equal rights and opportunities for women and men,
° The UN Convention on the Elimination of All Forms of
Discrimination Against Women,
° The implementation of the Fourth World Beijing Conferance
recommendations,
° Decision 242 on the "Program Principles on Improvement
of the Women's situation in Armenia" adopted by the RAGovernment on April 15, 1998,
° Decision 406 adopted by the RA Government on June 26,
1998,
° The National Program 1998-2000 on the improvement of
6
the women's situation and increasing their role in the society:
this includes such principles as a gender expertise of the RA legislation,increasing the representational level of women in the field of publicadministration, the elaboration and implementation of programs onincreasing women's employment, the improvement of socio-psychological and other services for women who are victims ofviolence and crime, the organization of protections against exploitationof teenagers, especially girls; women-entrepreneurs, as well assupporting mechanisms for women as family and household heads,the elaboration of work security protections for working women, thecollection of statistical data, and the publication of a statistical bulletinon the socio-economic situation of women.In 2003, the Revised European Social Charter was ratified by RA.Additionally, the Poverty Reduction Strategy Paper (PRSP) waselaborated upon after adoption by the mutual efforts of the RAGovernment, international organizations, many societal groups sincegender policy development was one of the main components.The National Action Plan (NAP) 2004-2010 on the improvement ofthe women's situation in RA and increasing their role in society wasdefined and presented to the Government of RA also in 2003. TheNAP addressed to implementing the obligations defined by the UNConvention on the Elimination of All Forms of Discrimination AgainstWomen, the recommendations of the Fourth World Beijing Conferance,the documents of the Committee on Legal Equity of women and menin the European Council, the requirements of the UN MillenniumDevelopment Goals and other international documents of RA. ThePaper will promote the provision of equal rights and equal opportunityfor women and men as the precondition to create a democratic, legal,and social state and a civil society.In this presentation on gender statistics, based on all the above-mentioned items, the main purpose is to highlight the relationshipbetween women and men in Armenia, the current situation regardingtheir opportunities in the social environment, and the creation of the
7
necessary gender information database in policy elaboration forproviding equal conditions for women and men.
The Necessity of Gender Statistics
In the statistics women and men have to be "visible." Gender statisticsare data that express the place and role of women and men in societytaking into account the characteristics of both women and men associal-demographic groups, as well as to implement the principles oflegal equity and equal opportunity.Taking into account all the above-mentioned points, the statisticaldata should be separated by sex, and at the same time, express thegender problems in Armenian society. Additionally, the data shouldbe comprehensible for the user.
8
Reading guideReading guideReading guideReading guideReading guide
This information has been processed on the base of Statisticalproduction of the National Statistical Service of RA. The tables andgraphs brought in this booklet give absolute numbers and proportionsfor certain attributes among women and men.Proportions are used in two ways:
• women and men by particular characteristics,• sex distribution by specified groups.
Data on number of population are presented based on the indicatorsof resident population.
Explanation of symbolsExplanation of symbolsExplanation of symbolsExplanation of symbolsExplanation of symbols
- No observation
0 Magnitude less than half of unit............... Data not available or too uncertain to be used
9
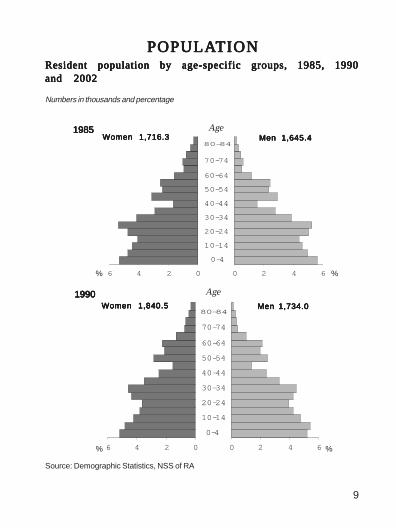
POPULAPOPULAPOPULAPOPULAPOPULATIONTIONTIONTIONTION
0 2 4 6
0-4
10-14
20-24
30-34
40-44
50-54
60-64
70-74
80-85
0246
0-4
10-14
20-24
30-34
40-44
50-54
60-64
70-74
80-85Women 1,716.3Women 1,716.3Women 1,716.3Women 1,716.3Women 1,716.3 Men 1,645.4Men 1,645.4Men 1,645.4Men 1,645.4Men 1,645.4
Age 19851985198519851985
%%
80-84
0 2 4 6
0-4
10-14
20-24
30-34
40-44
50-54
60-64
70-74
80-85
0246
0-4
10-14
20-24
30-34
40-44
50-54
60-64
70-74
80-85
Source: Demographic Statistics, NSS of RA
Age 19901990199019901990
%%
Women 1,840.5Women 1,840.5Women 1,840.5Women 1,840.5Women 1,840.5 Men 1,734.0Men 1,734.0Men 1,734.0Men 1,734.0Men 1,734.080-84
Resident population by age-specific groups, 1985, 1990Resident population by age-specific groups, 1985, 1990Resident population by age-specific groups, 1985, 1990Resident population by age-specific groups, 1985, 1990Resident population by age-specific groups, 1985, 1990and 2002and 2002and 2002and 2002and 2002
Numbers in thousands and percentage
10
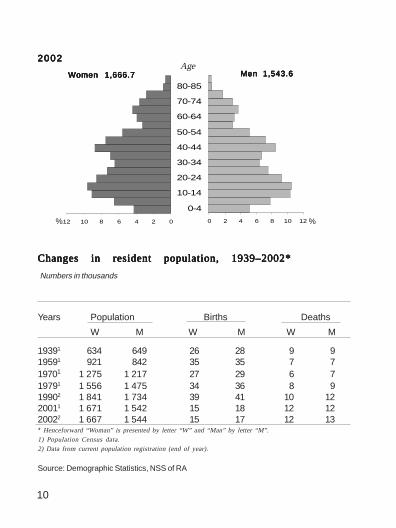
Changes in resident population, 1939–2002*Changes in resident population, 1939–2002*Changes in resident population, 1939–2002*Changes in resident population, 1939–2002*Changes in resident population, 1939–2002*
Numbers in thousands
Years Population Births Deaths
W M W M W M
19391 634 649 26 28 9 919591 921 842 35 35 7 719701 1 275 1 217 27 29 6 719791 1 556 1 475 34 36 8 919902 1 841 1 734 39 41 10 1220011 1 671 1 542 15 18 12 1220022 1 667 1 544 15 17 12 13* Henceforward “Woman” is presented by letter “W” and “Man” by letter “M”.1) Population Census data.2) Data from current population registration (end of year).
Source: Demographic Statistics, NSS of RA
Women 1,666.7Women 1,666.7Women 1,666.7Women 1,666.7Women 1,666.7 Men 1,543.6Men 1,543.6Men 1,543.6Men 1,543.6Men 1,543.6Age
024681012
0-4
10-14
20-24
30-34
40-44
50-54
60-64
70-74
80-85
0 2 4 6 8 10 12
0-4
10-14
20-24
30-34
40-44
50-54
60-64
70-74
80-85
% %
20022002200220022002
11
Population by age-specific groups in urban and ruralPopulation by age-specific groups in urban and ruralPopulation by age-specific groups in urban and ruralPopulation by age-specific groups in urban and ruralPopulation by age-specific groups in urban and ruralareas, 1990 and 2002areas, 1990 and 2002areas, 1990 and 2002areas, 1990 and 2002areas, 1990 and 2002
Percentage
0
20
40
60
80
100
W M
0
20
40
60
80
100
W M
19901990199019901990 Urban Rural
20022002200220022002 1
Urban Rural
%
Source: Demographic Statistics, NSS of RA
W M W M
W MW M
55 (60)+16–54 (59) 0–15
1) According to the age scale defined by the Resolution of the Government of RA, 1996, the pensionage for women at the end of 2002 was 58 and for men was 62.
0%
20%
40%
60%
80%
100%
0%
20%
40%
60%
80%
100%
59 (63)+16–58 (62) 0–15
%
12
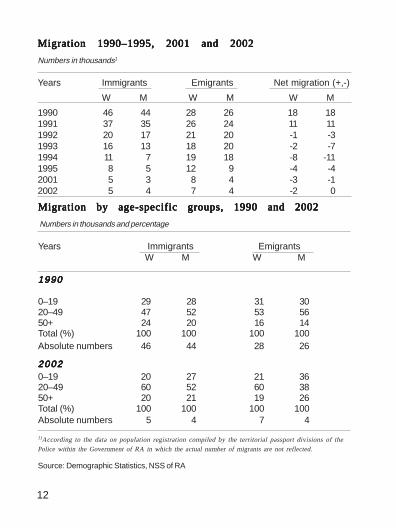
Migration 1990–1995, 2001 and 2002Migration 1990–1995, 2001 and 2002Migration 1990–1995, 2001 and 2002Migration 1990–1995, 2001 and 2002Migration 1990–1995, 2001 and 2002
Numbers in thousands1
Years Immigrants Emigrants Net migration (+,-)
W M W M W M
1990 46 44 28 26 18 181991 37 35 26 24 11 111992 20 17 21 20 -1 -31993 16 13 18 20 -2 -71994 11 7 19 18 -8 -111995 8 5 12 9 -4 -42001 5 3 8 4 -3 -12002 5 4 7 4 -2 0
Migration by age-specific groups, 1990 and 2002Migration by age-specific groups, 1990 and 2002Migration by age-specific groups, 1990 and 2002Migration by age-specific groups, 1990 and 2002Migration by age-specific groups, 1990 and 2002
Numbers in thousands and percentage
Years Immigrants Emigrants W M W M
19901990199019901990
0–19 29 28 31 3020–49 47 52 53 5650+ 24 20 16 14Total (%) 100 100 100 100Absolute numbers 46 44 28 26
200220022002200220020–19 20 27 21 3620–49 60 52 60 3850+ 20 21 19 26Total (%) 100 100 100 100Absolute numbers 5 4 7 4
Source: Demographic Statistics, NSS of RA
1)According to the data on population registration compiled by the territorial passport divisions of the
Police within the Government of RA in which the actual number of migrants are not reflected.
13
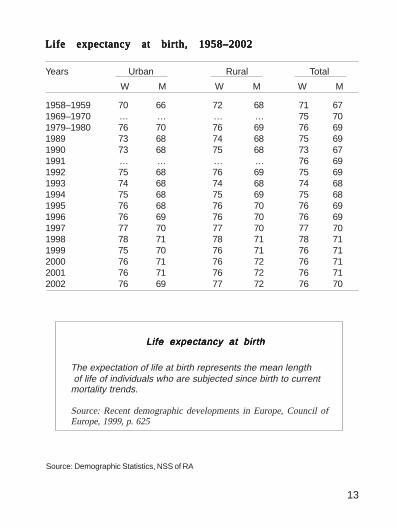
Life expectancy at birth, 1958–2002Life expectancy at birth, 1958–2002Life expectancy at birth, 1958–2002Life expectancy at birth, 1958–2002Life expectancy at birth, 1958–2002
Years Urban Rural Total
W M W M W M
1958–1959 70 66 72 68 71 671969–1970 … … … … 75 701979–1980 76 70 76 69 76 691989 73 68 74 68 75 691990 73 68 75 68 73 671991 … … … … 76 691992 75 68 76 69 75 691993 74 68 74 68 74 681994 75 68 75 69 75 681995 76 68 76 70 76 691996 76 69 76 70 76 691997 77 70 77 70 77 701998 78 71 78 71 78 711999 75 70 76 71 76 712000 76 71 76 72 76 712001 76 71 76 72 76 712002 76 69 77 72 76 70
Source: Demographic Statistics, NSS of RA
Life expectancy at birth Life expectancy at birth Life expectancy at birth Life expectancy at birth Life expectancy at birth
The expectation of life at birth represents the mean length of life of individuals who are subjected since birth to currentmortality trends.
Source: Recent demographic developments in Europe, Council ofEurope, 1999, p. 625
14
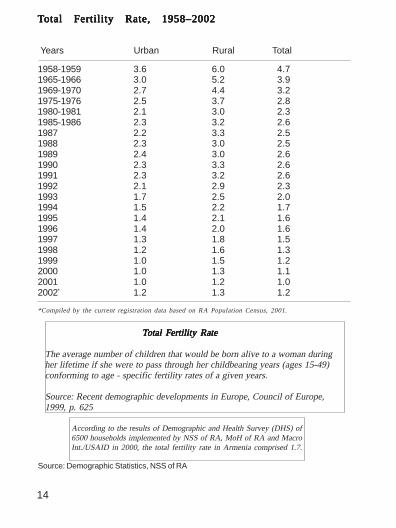
TTTTTotal Fertility Rate, 1958–2002otal Fertility Rate, 1958–2002otal Fertility Rate, 1958–2002otal Fertility Rate, 1958–2002otal Fertility Rate, 1958–2002
Years Urban Rural Total
1958-1959 3.6 6.0 4.71965-1966 3.0 5.2 3.91969-1970 2.7 4.4 3.21975-1976 2.5 3.7 2.81980-1981 2.1 3.0 2.31985-1986 2.3 3.2 2.61987 2.2 3.3 2.51988 2.3 3.0 2.51989 2.4 3.0 2.61990 2.3 3.3 2.61991 2.3 3.2 2.61992 2.1 2.9 2.31993 1.7 2.5 2.01994 1.5 2.2 1.71995 1.4 2.1 1.61996 1.4 2.0 1.61997 1.3 1.8 1.51998 1.2 1.6 1.31999 1.0 1.5 1.22000 1.0 1.3 1.12001 1.0 1.2 1.02002* 1.2 1.3 1.2
*Compiled by the current registration data based on RA Population Census, 2001.
According to the results of Demographic and Health Survey (DHS) of6500 households implemented by NSS of RA, MoH of RA and MacroInt./USAID in 2000, the total fertility rate in Armenia comprised 1.7.
Source: Demographic Statistics, NSS of RA
TTTTTotal Fertility Rateotal Fertility Rateotal Fertility Rateotal Fertility Rateotal Fertility Rate
The average number of children that would be born alive to a woman duringher lifetime if she were to pass through her childbearing years (ages 15-49)conforming to age - specific fertility rates of a given years.
Source: Recent demographic developments in Europe, Council of Europe,1999, p. 625
15
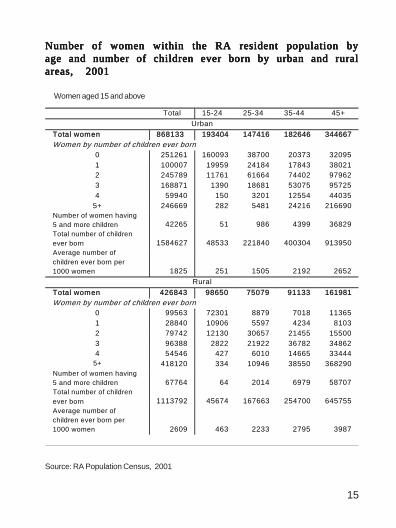
Number of women within the RA resident population byNumber of women within the RA resident population byNumber of women within the RA resident population byNumber of women within the RA resident population byNumber of women within the RA resident population byage and number of children ever born by urban and ruralage and number of children ever born by urban and ruralage and number of children ever born by urban and ruralage and number of children ever born by urban and ruralage and number of children ever born by urban and ruralareas, 2001areas, 2001areas, 2001areas, 2001areas, 2001
Women aged 15 and above
Total 15-24 25-34 35-44 45+
Urban
Total women 868133 193404 147416 182646 344667 Women by number of children ever born
0 251261 160093 38700 20373 32095 1 100007 19959 24184 17843 38021 2 245789 11761 61664 74402 97962 3 168871 1390 18681 53075 95725 4 59940 150 3201 12554 44035
5+ 246669 282 5481 24216 216690 Number of women having 5 and more children 42265 51 986 4399 36829 Total number of children ever born 1584627 48533 221840 400304 913950 Average number of children ever born per 1000 women 1825 251 1505 2192 2652
Rural
Total women 426843 98650 75079 91133 161981 Women by number of children ever born
0 99563 72301 8879 7018 11365 1 28840 10906 5597 4234 8103 2 79742 12130 30657 21455 15500 3 96388 2822 21922 36782 34862 4 54546 427 6010 14665 33444
5+ 418120 334 10946 38550 368290 Number of women having 5 and more children 67764 64 2014 6979 58707 Total number of children
ever born 1113792 45674 167663 254700 645755 Average number of children ever born per 1000 women 2609 463 2233 2795 3987
Source: RA Population Census, 2001
16
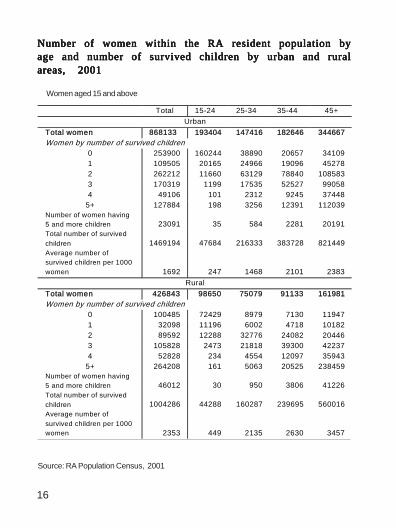
Number of women within the RA resident population byNumber of women within the RA resident population byNumber of women within the RA resident population byNumber of women within the RA resident population byNumber of women within the RA resident population byage and number of survived children by urban and ruralage and number of survived children by urban and ruralage and number of survived children by urban and ruralage and number of survived children by urban and ruralage and number of survived children by urban and ruralareas, 2001areas, 2001areas, 2001areas, 2001areas, 2001
Women aged 15 and above
Total 15-24 25-34 35-44 45+
Urban
Total women 868133 193404 147416 182646 344667 Women by number of survived children
0 253900 160244 38890 20657 34109 1 109505 20165 24966 19096 45278 2 262212 11660 63129 78840 108583 3 170319 1199 17535 52527 99058 4 49106 101 2312 9245 37448
5+ 127884 198 3256 12391 112039 Number of women having 5 and more children 23091 35 584 2281 20191 Total number of survived
children 1469194 47684 216333 383728 821449 Average number of survived children per 1000
women 1692 247 1468 2101 2383
Rural
Total women 426843 98650 75079 91133 161981 Women by number of survived children
0 100485 72429 8979 7130 11947 1 32098 11196 6002 4718 10182 2 89592 12288 32776 24082 20446 3 105828 2473 21818 39300 42237 4 52828 234 4554 12097 35943
5+ 264208 161 5063 20525 238459 Number of women having 5 and more children 46012 30 950 3806 41226 Total number of survived
children 1004286 44288 160287 239695 560016 Average number of
survived children per 1000 women 2353 449 2135 2630 3457
Source: RA Population Census, 2001
17
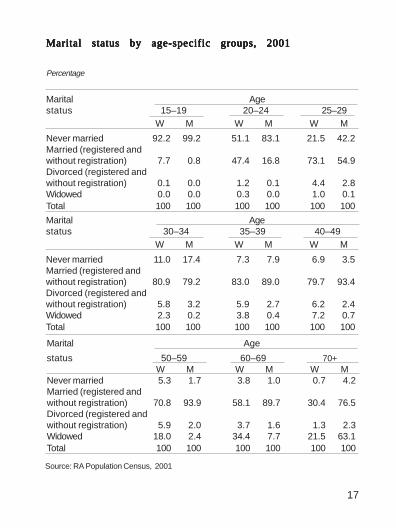
Marital status by age-specific groups, 2001Marital status by age-specific groups, 2001Marital status by age-specific groups, 2001Marital status by age-specific groups, 2001Marital status by age-specific groups, 2001
Percentage
Marital Agestatus 15–19 20–24 25–29
W M W M W M
Never married 92.2 99.2 51.1 83.1 21.5 42.2Married (registered andwithout registration) 7.7 0.8 47.4 16.8 73.1 54.9Divorced (registered andwithout registration) 0.1 0.0 1.2 0.1 4.4 2.8Widowed 0.0 0.0 0.3 0.0 1.0 0.1Total 100 100 100 100 100 100
Marital Agestatus 30–34 35–39 40–49
W M W M W M
Never married 11.0 17.4 7.3 7.9 6.9 3.5Married (registered andwithout registration) 80.9 79.2 83.0 89.0 79.7 93.4Divorced (registered andwithout registration) 5.8 3.2 5.9 2.7 6.2 2.4Widowed 2.3 0.2 3.8 0.4 7.2 0.7Total 100 100 100 100 100 100
Marital Age
status 50–59 60–69 70+W M W M W M
Never married 5.3 1.7 3.8 1.0 0.7 4.2Married (registered andwithout registration) 70.8 93.9 58.1 89.7 30.4 76.5Divorced (registered andwithout registration) 5.9 2.0 3.7 1.6 1.3 2.3Widowed 18.0 2.4 34.4 7.7 21.5 63.1Total 100 100 100 100 100 100
Source: RA Population Census, 2001
18
Marital Yearsstatus 15–19 20–24 25–29
W M W M W MNever married 90.7 98.6 54.0 80.8 27.0 42.3Married (registered andwithout registration) 9.1 0.4 45.1 18.8 66.7 57.5Divorced (registered andwithout registration) 0.2 - 0.5 0.2 5.0 0.2Widowed - - 0.4 0.2 1.3 -Total 100 100 100 100 100 100
Marital Years
status 30–34 35–39 40–49W M W M W M
Never married 11.5 17.9 9.0 6.8 7.9 2.4Married (registered andwithout registration) 80.6 81.4 80.2 91.5 75.3 95.4Divorced (registered andwithout registration) 6.1 0.7 7.8 1.2 8.6 1.5Widowed 1.8 - 3.0 0.5 8.2 0.7Total 100 100 100 100 100 100
Marital Years
status 50–59 60–69 70+M W M W M W
Never married 6.0 0.7 2.4 0.8 2.7 0.6Married (registered andwithout registration) 71.2 96.0 56.7 88.2 30.0 79.3Divorced (registered andwithout registration) 4.8 1.0 3.4 1.2 0.7 0.6Widowed 18.0 2.3 37.5 9.8 66.6 19.5Total 100 100 100 100 100 100
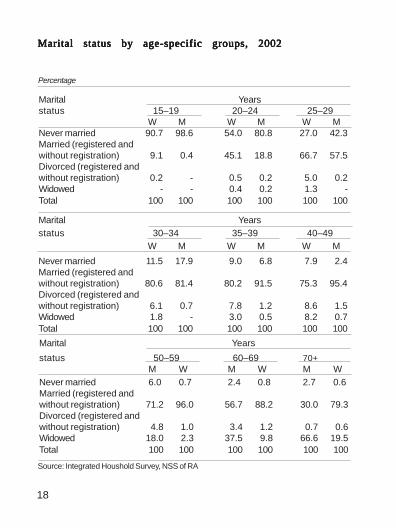
Marital status by age-specific groups, 2002Marital status by age-specific groups, 2002Marital status by age-specific groups, 2002Marital status by age-specific groups, 2002Marital status by age-specific groups, 2002
Percentage
Source: Integrated Houshold Survey, NSS of RA
19
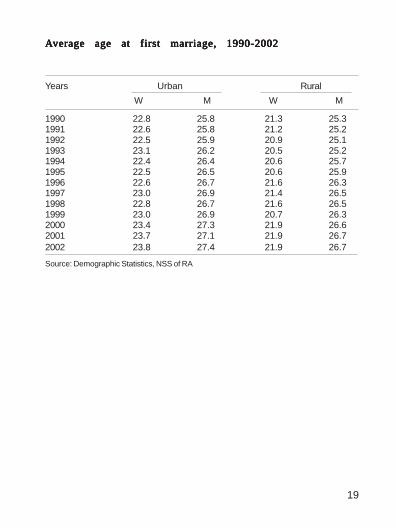
AAAAAverage age at first marriage, 1990-2002verage age at first marriage, 1990-2002verage age at first marriage, 1990-2002verage age at first marriage, 1990-2002verage age at first marriage, 1990-2002
Years Urban Rural
W M W M
1990 22.8 25.8 21.3 25.31991 22.6 25.8 21.2 25.21992 22.5 25.9 20.9 25.11993 23.1 26.2 20.5 25.21994 22.4 26.4 20.6 25.71995 22.5 26.5 20.6 25.91996 22.6 26.7 21.6 26.31997 23.0 26.9 21.4 26.51998 22.8 26.7 21.6 26.51999 23.0 26.9 20.7 26.32000 23.4 27.3 21.9 26.62001 23.7 27.1 21.9 26.72002 23.8 27.4 21.9 26.7
Source: Demographic Statistics, NSS of RA
20
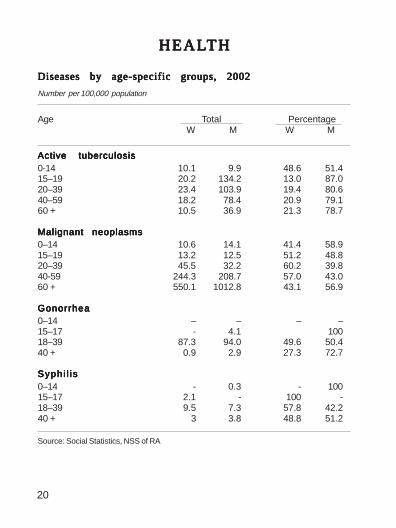
Diseases by age-specific groups, 2002Diseases by age-specific groups, 2002Diseases by age-specific groups, 2002Diseases by age-specific groups, 2002Diseases by age-specific groups, 2002
Number per 100,000 population
Age Total Percentage W M W M
Active tuberculosisActive tuberculosisActive tuberculosisActive tuberculosisActive tuberculosis0-14 10.1 9.9 48.6 51.415–19 20.2 134.2 13.0 87.020–39 23.4 103.9 19.4 80.640–59 18.2 78.4 20.9 79.160 + 10.5 36.9 21.3 78.7
Malignant neoplasmsMalignant neoplasmsMalignant neoplasmsMalignant neoplasmsMalignant neoplasms0–14 10.6 14.1 41.4 58.915–19 13.2 12.5 51.2 48.820–39 45.5 32.2 60.2 39.840-59 244.3 208.7 57.0 43.060 + 550.1 1012.8 43.1 56.9
GonorrheaGonorrheaGonorrheaGonorrheaGonorrhea0–14 – – – –15–17 - 4.1 10018–39 87.3 94.0 49.6 50.440 + 0.9 2.9 27.3 72.7
Syph i l i sSyph i l i sSyph i l i sSyph i l i sSyph i l i s0–14 - 0.3 - 10015–17 2.1 - 100 -18–39 9.5 7.3 57.8 42.240 + 3 3.8 48.8 51.2
Source: Social Statistics, NSS of RA
HEALHEALHEALHEALHEALTHTHTHTHTH
21
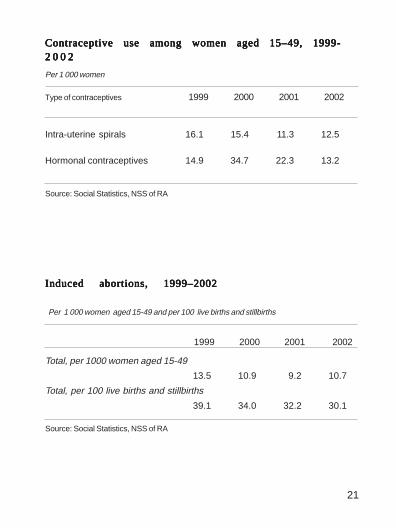
Contraceptive use among women aged 15–49, 1999-Contraceptive use among women aged 15–49, 1999-Contraceptive use among women aged 15–49, 1999-Contraceptive use among women aged 15–49, 1999-Contraceptive use among women aged 15–49, 1999-2 0 0 22 0 0 22 0 0 22 0 0 22 0 0 2
Per 1 000 women
Type of contraceptives 1999 2000 2001 2002
Intra-uterine spirals 16.1 15.4 11.3 12.5
Hormonal contraceptives 14.9 34.7 22.3 13.2
IIIIInduced abortions, 1999–2002nduced abortions, 1999–2002nduced abortions, 1999–2002nduced abortions, 1999–2002nduced abortions, 1999–2002
1999 2000 2001 2002
Total, per 1000 women aged 15-49
13.5 10.9 9.2 10.7
Total, per 100 live births and stillbirths
39.1 34.0 32.2 30.1
Per 1 000 women aged 15-49 and per 100 live births and stillbirths
Source: Social Statistics, NSS of RA
Source: Social Statistics, NSS of RA
22
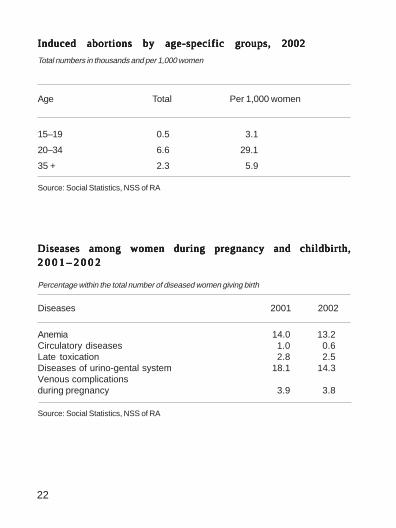
Induced abortions by age-specific groups, 2002Induced abortions by age-specific groups, 2002Induced abortions by age-specific groups, 2002Induced abortions by age-specific groups, 2002Induced abortions by age-specific groups, 2002
Total numbers in thousands and per 1,000 women
Age Total Per 1,000 women
15–19 0.5 3.1
20–34 6.6 29.1
35 + 2.3 5.9
Diseases among women during pregnancy and childbirth,Diseases among women during pregnancy and childbirth,Diseases among women during pregnancy and childbirth,Diseases among women during pregnancy and childbirth,Diseases among women during pregnancy and childbirth,2 0 0 1 – 2 0 0 22 0 0 1 – 2 0 0 22 0 0 1 – 2 0 0 22 0 0 1 – 2 0 0 22 0 0 1 – 2 0 0 2
Diseases 2001 2002
Anemia 14.0 13.2Circulatory diseases 1.0 0.6Late toxication 2.8 2.5Diseases of urino-gental system 18.1 14.3Venous complicationsduring pregnancy 3.9 3.8
Percentage within the total number of diseased women giving birth
Source: Social Statistics, NSS of RA
Source: Social Statistics, NSS of RA
23
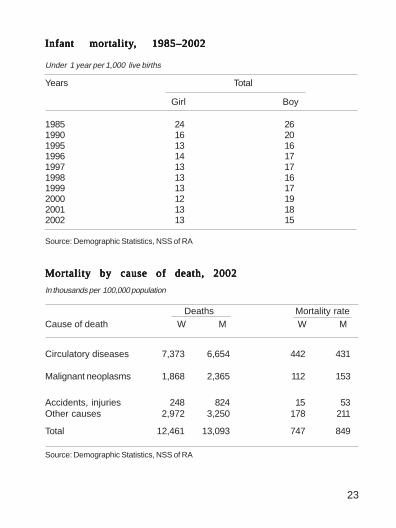
Infant mortalityInfant mortalityInfant mortalityInfant mortalityInfant mortality, 1985–2002, 1985–2002, 1985–2002, 1985–2002, 1985–2002
Years Total
1985 24 261990 16 201995 13 161996 14 171997 13 171998 13 161999 13 172000 12 192001 13 182002 13 15
Deaths Mortality rate
Cause of death W M W M
Circulatory diseases 7,373 6,654 442 431
Malignant neoplasms 1,868 2,365 112 153
Accidents, injuries 248 824 15 53Other causes 2,972 3,250 178 211
Total 12,461 13,093 747 849
In thousands per 100,000 population
Mortality by cause of death, 2002Mortality by cause of death, 2002Mortality by cause of death, 2002Mortality by cause of death, 2002Mortality by cause of death, 2002
Girl Boy
Under 1 year per 1,000 live births
Source: Demographic Statistics, NSS of RA
Source: Demographic Statistics, NSS of RA
24
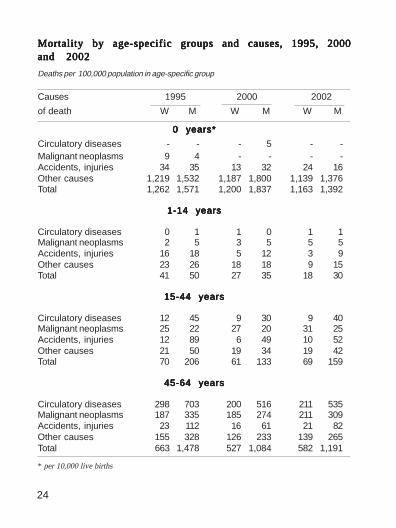
Mortality by age-specific groups and causes, 1995, 2000Mortality by age-specific groups and causes, 1995, 2000Mortality by age-specific groups and causes, 1995, 2000Mortality by age-specific groups and causes, 1995, 2000Mortality by age-specific groups and causes, 1995, 2000and 2002and 2002and 2002and 2002and 2002
Deaths per 100,000 population in age-specific group
Causes 1995 2000 2002
of death W M W M W M
0 years*0 years*0 years*0 years*0 years*
Circulatory diseases - - - 5 - -Malignant neoplasms 9 4 - - - -Accidents, injuries 34 35 13 32 24 16Other causes 1,219 1,532 1,187 1,800 1,139 1,376Total 1,262 1,571 1,200 1,837 1,163 1,392
1-14 years1-14 years1-14 years1-14 years1-14 years
Circulatory diseases 0 1 1 0 1 1Malignant neoplasms 2 5 3 5 5 5Accidents, injuries 16 18 5 12 3 9Other causes 23 26 18 18 9 15Total 41 50 27 35 18 30
15-44 years15-44 years15-44 years15-44 years15-44 years
Circulatory diseases 12 45 9 30 9 40Malignant neoplasms 25 22 27 20 31 25Accidents, injuries 12 89 6 49 10 52Other causes 21 50 19 34 19 42Total 70 206 61 133 69 159
45-64 years45-64 years45-64 years45-64 years45-64 years
Circulatory diseases 298 703 200 516 211 535Malignant neoplasms 187 335 185 274 211 309Accidents, injuries 23 112 16 61 21 82Other causes 155 328 126 233 139 265Total 663 1,478 527 1,084 582 1,191
* per 10,000 live births
25
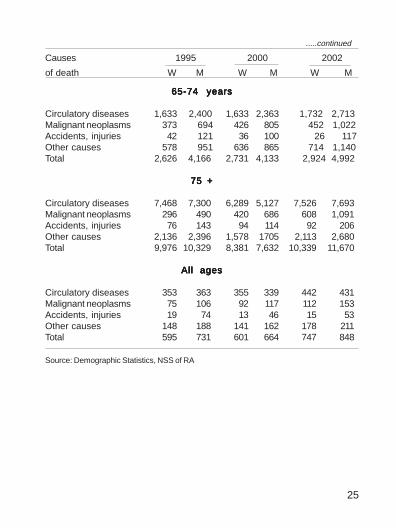
Causes 1995 2000 2002
of death W M W M W M
65-74 years65-74 years65-74 years65-74 years65-74 years
Circulatory diseases 1,633 2,400 1,633 2,363 1,732 2,713Malignant neoplasms 373 694 426 805 452 1,022Accidents, injuries 42 121 36 100 26 117Other causes 578 951 636 865 714 1,140Total 2,626 4,166 2,731 4,133 2,924 4,992
75 +75 +75 +75 +75 +
Circulatory diseases 7,468 7,300 6,289 5,127 7,526 7,693Malignant neoplasms 296 490 420 686 608 1,091Accidents, injuries 76 143 94 114 92 206Other causes 2,136 2,396 1,578 1705 2,113 2,680Total 9,976 10,329 8,381 7,632 10,339 11,670
All agesAll agesAll agesAll agesAll ages
Circulatory diseases 353 363 355 339 442 431Malignant neoplasms 75 106 92 117 112 153Accidents, injuries 19 74 13 46 15 53Other causes 148 188 141 162 178 211Total 595 731 601 664 747 848
.....continued
Source: Demographic Statistics, NSS of RA
26
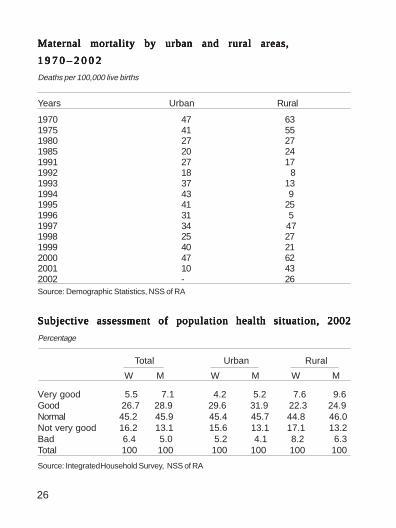
Subjective assessment of population health situation, 2002Subjective assessment of population health situation, 2002Subjective assessment of population health situation, 2002Subjective assessment of population health situation, 2002Subjective assessment of population health situation, 2002
Percentage
Total Urban Rural
W M W M W M
Very good 5.5 7.1 4.2 5.2 7.6 9.6Good 26.7 28.9 29.6 31.9 22.3 24.9Normal 45.2 45.9 45.4 45.7 44.8 46.0Not very good 16.2 13.1 15.6 13.1 17.1 13.2Bad 6.4 5.0 5.2 4.1 8.2 6.3Total 100 100 100 100 100 100
Maternal mortality by urban and rural areas,Maternal mortality by urban and rural areas,Maternal mortality by urban and rural areas,Maternal mortality by urban and rural areas,Maternal mortality by urban and rural areas,
1 9 7 0 – 2 0 0 21 9 7 0 – 2 0 0 21 9 7 0 – 2 0 0 21 9 7 0 – 2 0 0 21 9 7 0 – 2 0 0 2
Deaths per 100,000 live births
Years Urban Rural
1970 47 631975 41 551980 27 271985 20 241991 27 171992 18 81993 37 131994 43 91995 41 251996 31 51997 34 471998 25 271999 40 212000 47 622001 10 432002 - 26Source: Demographic Statistics, NSS of RA
Source: Integrated Household Survey, NSS of RA
27
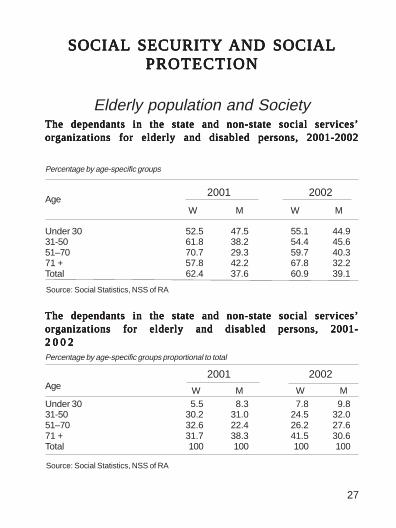
Age
Under 30 52.5 47.5 55.1 44.931-50 61.8 38.2 54.4 45.651–70 70.7 29.3 59.7 40.371 + 57.8 42.2 67.8 32.2Total 62.4 37.6 60.9 39.1
2001 2002
Source: Social Statistics, NSS of RA
Under 30 5.5 8.3 7.8 9.831-50 30.2 31.0 24.5 32.051–70 32.6 22.4 26.2 27.671 + 31.7 38.3 41.5 30.6Total 100 100 100 100
2001 2002
Percentage by age-specific groups proportional to total
W M W MAge
The dependants in the state and non-state social services’The dependants in the state and non-state social services’The dependants in the state and non-state social services’The dependants in the state and non-state social services’The dependants in the state and non-state social services’organizations for elderly and disabled persons, 2001-2002organizations for elderly and disabled persons, 2001-2002organizations for elderly and disabled persons, 2001-2002organizations for elderly and disabled persons, 2001-2002organizations for elderly and disabled persons, 2001-2002
W M W M
Source: Social Statistics, NSS of RA
SOCIALSOCIALSOCIALSOCIALSOCIAL SECURITY SECURITY SECURITY SECURITY SECURITY AND SOCIALAND SOCIALAND SOCIALAND SOCIALAND SOCIALPROTECTIONPROTECTIONPROTECTIONPROTECTIONPROTECTION
Elderly population and Society
The dependants in the state and non-state social services’The dependants in the state and non-state social services’The dependants in the state and non-state social services’The dependants in the state and non-state social services’The dependants in the state and non-state social services’organizations for elderly and disabled persons, 2001-organizations for elderly and disabled persons, 2001-organizations for elderly and disabled persons, 2001-organizations for elderly and disabled persons, 2001-organizations for elderly and disabled persons, 2001-2 0 0 22 0 0 22 0 0 22 0 0 22 0 0 2
Percentage by age-specific groups
28
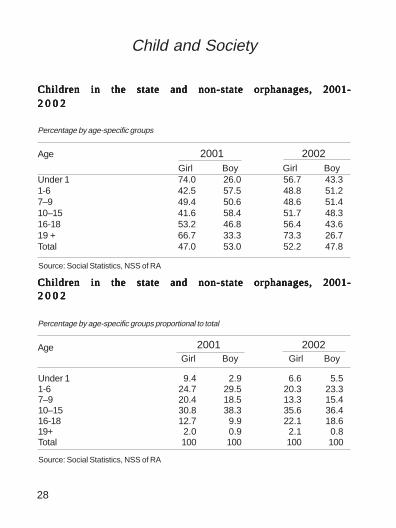
Children in the state and non-state orphanages, 2001-Children in the state and non-state orphanages, 2001-Children in the state and non-state orphanages, 2001-Children in the state and non-state orphanages, 2001-Children in the state and non-state orphanages, 2001-2 0 0 22 0 0 22 0 0 22 0 0 22 0 0 2
Under 1 74.0 26.0 56.7 43.31-6 42.5 57.5 48.8 51.27–9 49.4 50.6 48.6 51.410–15 41.6 58.4 51.7 48.316-18 53.2 46.8 56.4 43.619 + 66.7 33.3 73.3 26.7Total 47.0 53.0 52.2 47.8
Child and Society
Age 2001 2002 Girl Boy Girl Boy
Under 1 9.4 2.9 6.6 5.51-6 24.7 29.5 20.3 23.37–9 20.4 18.5 13.3 15.410–15 30.8 38.3 35.6 36.416-18 12.7 9.9 22.1 18.619+ 2.0 0.9 2.1 0.8Total 100 100 100 100
2001 2002 Girl Boy Girl Boy
Age
Percentage by age-specific groups proportional to total
Children in the state and non-state orphanages, 2001-Children in the state and non-state orphanages, 2001-Children in the state and non-state orphanages, 2001-Children in the state and non-state orphanages, 2001-Children in the state and non-state orphanages, 2001-2 0 0 22 0 0 22 0 0 22 0 0 22 0 0 2
Source: Social Statistics, NSS of RA
Source: Social Statistics, NSS of RA
Percentage by age-specific groups
29
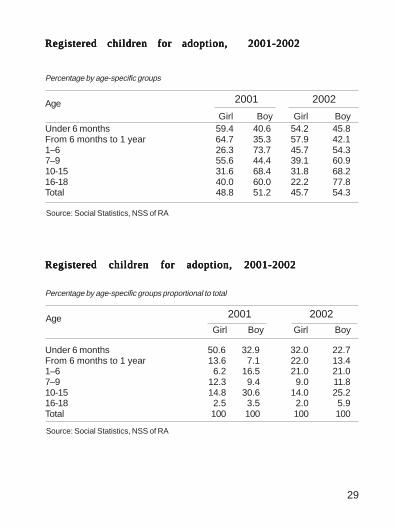
Registered children for adoption, 2001-2002Registered children for adoption, 2001-2002Registered children for adoption, 2001-2002Registered children for adoption, 2001-2002Registered children for adoption, 2001-2002
Under 6 months 59.4 40.6 54.2 45.8From 6 months to 1 year 64.7 35.3 57.9 42.11–6 26.3 73.7 45.7 54.37–9 55.6 44.4 39.1 60.910-15 31.6 68.4 31.8 68.216-18 40.0 60.0 22.2 77.8Total 48.8 51.2 45.7 54.3
2001 2002
Girl Boy Girl BoyAge
Registered children for adoption, 2001-2002Registered children for adoption, 2001-2002Registered children for adoption, 2001-2002Registered children for adoption, 2001-2002Registered children for adoption, 2001-2002
Under 6 months 50.6 32.9 32.0 22.7From 6 months to 1 year 13.6 7.1 22.0 13.41–6 6.2 16.5 21.0 21.07–9 12.3 9.4 9.0 11.810-15 14.8 30.6 14.0 25.216-18 2.5 3.5 2.0 5.9Total 100 100 100 100
2001 2002
Girl Boy Girl BoyAge
Percentage by age-specific groups proportional to total
Source: Social Statistics, NSS of RA
Source: Social Statistics, NSS of RA
Percentage by age-specific groups
30
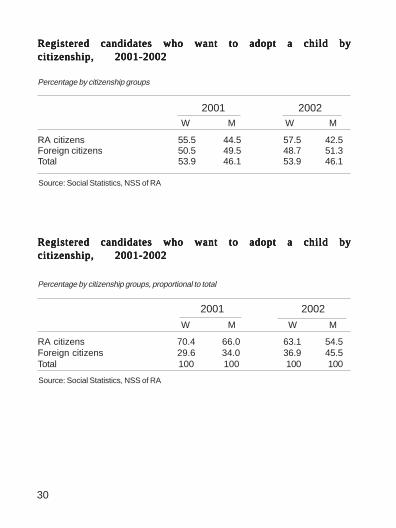
Registered candidates who want to adopt a child byRegistered candidates who want to adopt a child byRegistered candidates who want to adopt a child byRegistered candidates who want to adopt a child byRegistered candidates who want to adopt a child bycitizenship, 2001-2002citizenship, 2001-2002citizenship, 2001-2002citizenship, 2001-2002citizenship, 2001-2002
2001 2002 W M W M
RA citizens 55.5 44.5 57.5 42.5Foreign citizens 50.5 49.5 48.7 51.3Total 53.9 46.1 53.9 46.1
Registered candidates who want to adopt a child byRegistered candidates who want to adopt a child byRegistered candidates who want to adopt a child byRegistered candidates who want to adopt a child byRegistered candidates who want to adopt a child bycitizenship, 2001-2002citizenship, 2001-2002citizenship, 2001-2002citizenship, 2001-2002citizenship, 2001-2002
2001 2002
W M W M
RA citizens 70.4 66.0 63.1 54.5Foreign citizens 29.6 34.0 36.9 45.5Total 100 100 100 100
Percentage by citizenship groups
Percentage by citizenship groups, proportional to total
Source: Social Statistics, NSS of RA
Source: Social Statistics, NSS of RA
31
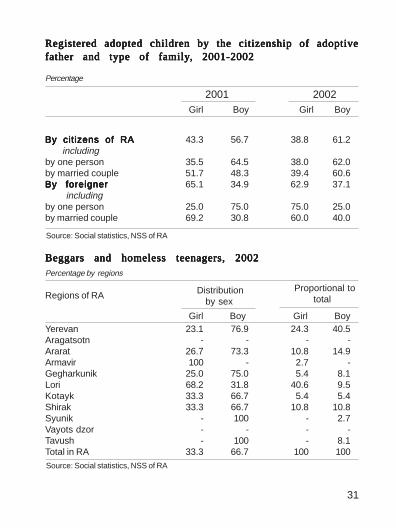
By citizens of RABy citizens of RABy citizens of RABy citizens of RABy citizens of RA 43.3 56.7 38.8 61.2 includingby one person 35.5 64.5 38.0 62.0by married couple 51.7 48.3 39.4 60.6By foreignerBy foreignerBy foreignerBy foreignerBy foreigner 65.1 34.9 62.9 37.1 includingby one person 25.0 75.0 75.0 25.0by married couple 69.2 30.8 60.0 40.0
Regions of RA
Yerevan 23.1 76.9 24.3 40.5Aragatsotn - - - -Ararat 26.7 73.3 10.8 14.9Armavir 100 - 2.7 -Gegharkunik 25.0 75.0 5.4 8.1Lori 68.2 31.8 40.6 9.5Kotayk 33.3 66.7 5.4 5.4Shirak 33.3 66.7 10.8 10.8Syunik - 100 - 2.7Vayots dzor - - - -Tavush - 100 - 8.1Total in RA 33.3 66.7 100 100
Proportional to total
Girl Boy Girl Boy
Source: Social statistics, NSS of RA
Girl Boy Girl Boy
Registered adopted children by the citizenship of adoptiveRegistered adopted children by the citizenship of adoptiveRegistered adopted children by the citizenship of adoptiveRegistered adopted children by the citizenship of adoptiveRegistered adopted children by the citizenship of adoptivefather and type of familyfather and type of familyfather and type of familyfather and type of familyfather and type of family, 2001-2002, 2001-2002, 2001-2002, 2001-2002, 2001-2002
Percentage
2001 2002
Beggars and homeless teenagers, 2002Beggars and homeless teenagers, 2002Beggars and homeless teenagers, 2002Beggars and homeless teenagers, 2002Beggars and homeless teenagers, 2002Percentage by regions
Distribution by sex
Source: Social statistics, NSS of RA
32
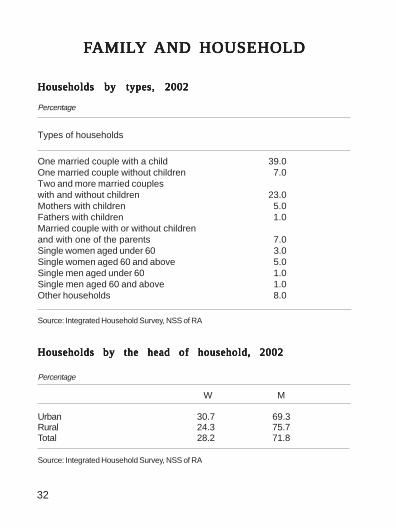
W M
Urban 30.7 69.3Rural 24.3 75.7Total 28.2 71.8
Source: Integrated Household Survey, NSS of RA
Percentage
Households by the head of household, 2002Households by the head of household, 2002Households by the head of household, 2002Households by the head of household, 2002Households by the head of household, 2002
Types of households
One married couple with a child 39.0One married couple without children 7.0Two and more married coupleswith and without children 23.0Mothers with children 5.0Fathers with children 1.0Married couple with or without childrenand with one of the parents 7.0Single women aged under 60 3.0Single women aged 60 and above 5.0Single men aged under 60 1.0Single men aged 60 and above 1.0Other households 8.0
FFFFFAMILAMILAMILAMILAMILYYYYY AND HOUSEHOLDAND HOUSEHOLDAND HOUSEHOLDAND HOUSEHOLDAND HOUSEHOLD
Households by types, 2002Households by types, 2002Households by types, 2002Households by types, 2002Households by types, 2002
Percentage
Source: Integrated Household Survey, NSS of RA
33
Source: Integrated Household Survey, NSS of RA
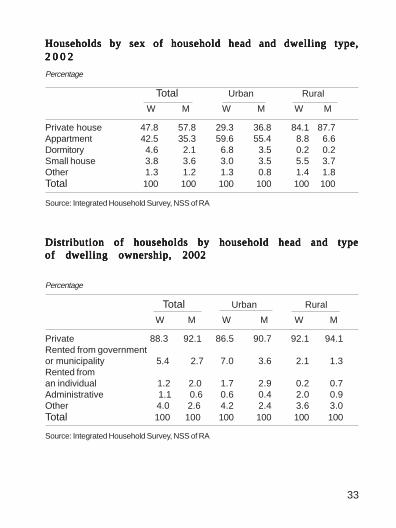
Distribution of households by household head and typeDistribution of households by household head and typeDistribution of households by household head and typeDistribution of households by household head and typeDistribution of households by household head and typeof dwelling ownership, 2002of dwelling ownership, 2002of dwelling ownership, 2002of dwelling ownership, 2002of dwelling ownership, 2002
Total Urban Rural
W M W M W M
Private 88.3 92.1 86.5 90.7 92.1 94.1Rented from governmentor municipality 5.4 2.7 7.0 3.6 2.1 1.3Rented froman individual 1.2 2.0 1.7 2.9 0.2 0.7Administrative 1.1 0.6 0.6 0.4 2.0 0.9Other 4.0 2.6 4.2 2.4 3.6 3.0Total 100 100 100 100 100 100
Households by sex of household head and dwelling type,Households by sex of household head and dwelling type,Households by sex of household head and dwelling type,Households by sex of household head and dwelling type,Households by sex of household head and dwelling type,2 0 0 22 0 0 22 0 0 22 0 0 22 0 0 2
Percentage
Total Urban Rural
W M W M W M
Private house 47.8 57.8 29.3 36.8 84.1 87.7Appartment 42.5 35.3 59.6 55.4 8.8 6.6Dormitory 4.6 2.1 6.8 3.5 0.2 0.2Small house 3.8 3.6 3.0 3.5 5.5 3.7Other 1.3 1.2 1.3 0.8 1.4 1.8Total 100 100 100 100 100 100
Source: Integrated Household Survey, NSS of RA
Percentage
34
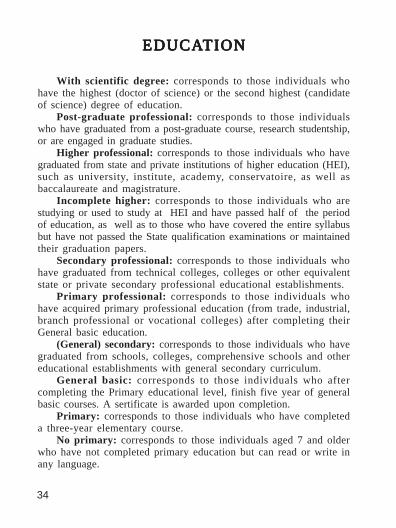
With scientific degree: corresponds to those individuals whohave the highest (doctor of science) or the second highest (candidateof science) degree of education.
Post-graduate professional: corresponds to those individualswho have graduated from a post-graduate course, research studentship,or are engaged in graduate studies.
Higher professional: corresponds to those individuals who havegraduated from state and private institutions of higher education (HEI),such as university, institute, academy, conservatoire, as well asbaccalaureate and magistrature.
Incomplete higher: corresponds to those individuals who arestudying or used to study at HEI and have passed half of the periodof education, as well as to those who have covered the entire syllabusbut have not passed the State qualification examinations or maintainedtheir graduation papers.
Secondary professional: corresponds to those individuals whohave graduated from technical colleges, colleges or other equivalentstate or private secondary professional educational establishments.
Primary professional: corresponds to those individuals whohave acquired primary professional education (from trade, industrial,branch professional or vocational colleges) after completing theirGeneral basic education.
(General) secondary: corresponds to those individuals who havegraduated from schools, colleges, comprehensive schools and othereducational establishments with general secondary curriculum.
General basic: corresponds to those individuals who aftercompleting the Primary educational level, finish five year of generalbasic courses. A sertificate is awarded upon completion.
Primary: corresponds to those individuals who have completeda three-year elementary course.
No primary: corresponds to those individuals aged 7 and olderwho have not completed primary education but can read or write inany language.
EDUCAEDUCAEDUCAEDUCAEDUCATIONTIONTIONTIONTION
35
EDUCAEDUCAEDUCAEDUCAEDUCATIONTIONTIONTIONTION
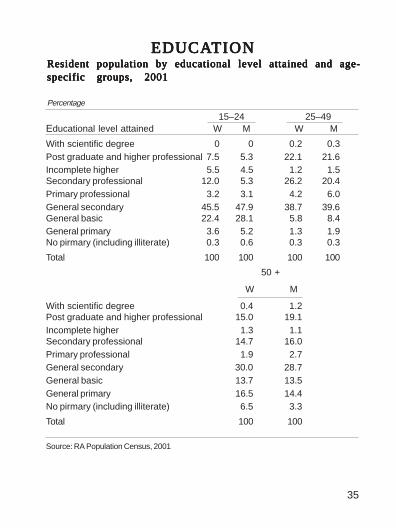
15–24 25–49Educational level attained W M W M
With scientific degree 0 0 0.2 0.3
Post graduate and higher professional 7.5 5.3 22.1 21.6Incomplete higher 5.5 4.5 1.2 1.5Secondary professional 12.0 5.3 26.2 20.4
Primary professional 3.2 3.1 4.2 6.0
General secondary 45.5 47.9 38.7 39.6General basic 22.4 28.1 5.8 8.4General primary 3.6 5.2 1.3 1.9No pirmary (including illiterate) 0.3 0.6 0.3 0.3
Total 100 100 100 100
50 +
W M
With scientific degree 0.4 1.2Post graduate and higher professional 15.0 19.1
Incomplete higher 1.3 1.1Secondary professional 14.7 16.0
Primary professional 1.9 2.7General secondary 30.0 28.7
General basic 13.7 13.5
General primary 16.5 14.4No pirmary (including illiterate) 6.5 3.3
Total 100 100
Resident population by educational level attained and age-Resident population by educational level attained and age-Resident population by educational level attained and age-Resident population by educational level attained and age-Resident population by educational level attained and age-specific groups, 2001specific groups, 2001specific groups, 2001specific groups, 2001specific groups, 2001
Percentage
Source: RA Population Census, 2001
36
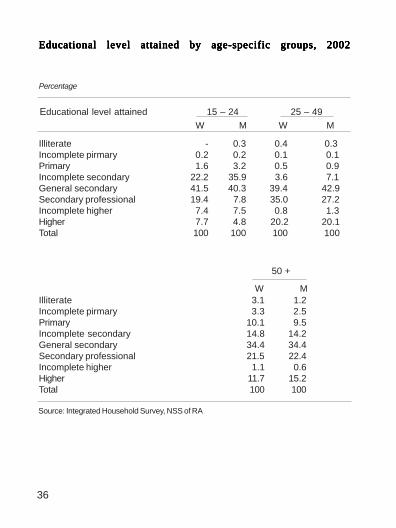
Source: Integrated Household Survey, NSS of RA
Educational level attained by age-specific groups, 2002Educational level attained by age-specific groups, 2002Educational level attained by age-specific groups, 2002Educational level attained by age-specific groups, 2002Educational level attained by age-specific groups, 2002
Percentage
Illiterate - 0.3 0.4 0.3Incomplete pirmary 0.2 0.2 0.1 0.1Primary 1.6 3.2 0.5 0.9Incomplete secondary 22.2 35.9 3.6 7.1General secondary 41.5 40.3 39.4 42.9Secondary professional 19.4 7.8 35.0 27.2Incomplete higher 7.4 7.5 0.8 1.3Higher 7.7 4.8 20.2 20.1Total 100 100 100 100
Illiterate 3.1 1.2Incomplete pirmary 3.3 2.5Primary 10.1 9.5Incomplete secondary 14.8 14.2General secondary 34.4 34.4Secondary professional 21.5 22.4Incomplete higher 1.1 0.6Higher 11.7 15.2Total 100 100
Educational level attained 15 – 24 25 – 49
W M W M
W M
50 +
37
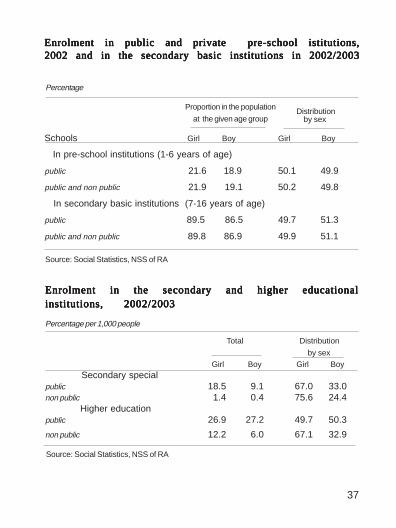
Enrolment in public and private pre-school istitutions,Enrolment in public and private pre-school istitutions,Enrolment in public and private pre-school istitutions,Enrolment in public and private pre-school istitutions,Enrolment in public and private pre-school istitutions,2002 and in the secondary basic institutions in 2002/20032002 and in the secondary basic institutions in 2002/20032002 and in the secondary basic institutions in 2002/20032002 and in the secondary basic institutions in 2002/20032002 and in the secondary basic institutions in 2002/2003
Schools Girl Boy Girl Boy
In pre-school institutions (1-6 years of age)
public 21.6 18.9 50.1 49.9
public and non public 21.9 19.1 50.2 49.8
In secondary basic institutions (7-16 years of age)
public 89.5 86.5 49.7 51.3
public and non public 89.8 86.9 49.9 51.1
Enrolment in the secondary and higher educationalEnrolment in the secondary and higher educationalEnrolment in the secondary and higher educationalEnrolment in the secondary and higher educationalEnrolment in the secondary and higher educationalinstitutions, 2002/2003institutions, 2002/2003institutions, 2002/2003institutions, 2002/2003institutions, 2002/2003
Percentage per 1,000 people
Total Distribution
by sex
Girl Boy Girl Boy
Secondary specialpublic 18.5 9.1 67.0 33.0non public 1.4 0.4 75.6 24.4 Higher educationpublic 26.9 27.2 49.7 50.3
non public 12.2 6.0 67.1 32.9
Percentage
Distribution by sex
Source: Social Statistics, NSS of RA
Source: Social Statistics, NSS of RA
Proportion in the population
at the given age group
38
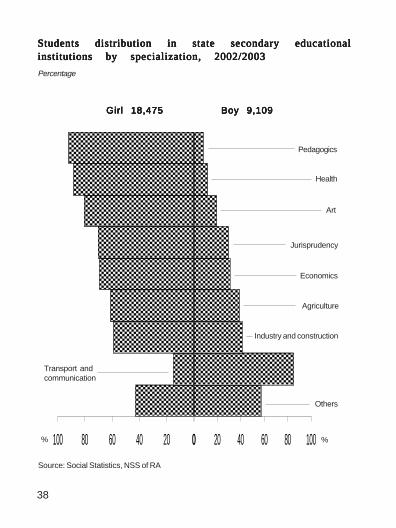
Girl 18,475Girl 18,475Girl 18,475Girl 18,475Girl 18,475 Boy 9,109Boy 9,109Boy 9,109Boy 9,109Boy 9,109
Pedagogics
Health
Economics
Industry and construction
Students distribution in state secondary educationalStudents distribution in state secondary educationalStudents distribution in state secondary educationalStudents distribution in state secondary educationalStudents distribution in state secondary educationalinstitutions by specialization, 2002/2003institutions by specialization, 2002/2003institutions by specialization, 2002/2003institutions by specialization, 2002/2003institutions by specialization, 2002/2003
Percentage
%%
Art
Agriculture
Transport andcommunication
Others
Source: Social Statistics, NSS of RA
Jurisprudency
������������������������������������������������������������������������
���������������������������
������������������������������������������������������������������������������������������������
���������������������������������������������������������������������������������������������������
������������������������������������������������������������������������������������������������������������������
������������������������������������������������������������������������������������������������������������������
������������������������������������������������������������������������������������������������������������������������������������
������������������������������������������������������������������������������������������������������������������������������������������������
������������������������������������������������������������������������������������������������������������������������������������������������������
020406080100
������������������������������������������������������������������������������������
������������������������������������������������������������������������������������������������������������������������
������������������������������������������������������������
���������������������������������������������������������
���������������������������������������������
���������������������������������������������
������������������������������
���������������������
���������������
0 20 40 60 80 100
39
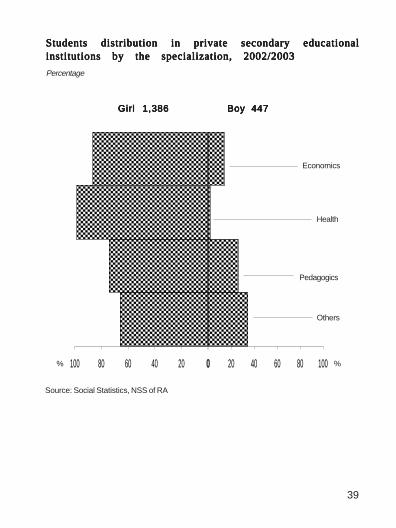
Girl 1,386Girl 1,386Girl 1,386Girl 1,386Girl 1,386 Boy 447Boy 447Boy 447Boy 447Boy 447
Pedagogics
Health
Economics
Students distribution in private secondary educationalStudents distribution in private secondary educationalStudents distribution in private secondary educationalStudents distribution in private secondary educationalStudents distribution in private secondary educationalinstitutions by the specialization, 2002/2003institutions by the specialization, 2002/2003institutions by the specialization, 2002/2003institutions by the specialization, 2002/2003institutions by the specialization, 2002/2003
Percentage
%
Others
������������������������������������������������������������������������������������������������������������������������������������������������
��������������������������������������������������������������������������������������������������������������������������������������������������������������������������������������������������������
��������������������������������������������������������������������������������������������������������������������������������������������������������������������������������������������������������������������
����������������������������������������������������������������������������������������������������������������������������������������������������������������������������������������
020406080100
����������������������������������������������������������������
�����������������������������������������������������������������
��������
����������������������������
0 20 40 60 80 100 %
Source: Social Statistics, NSS of RA
40
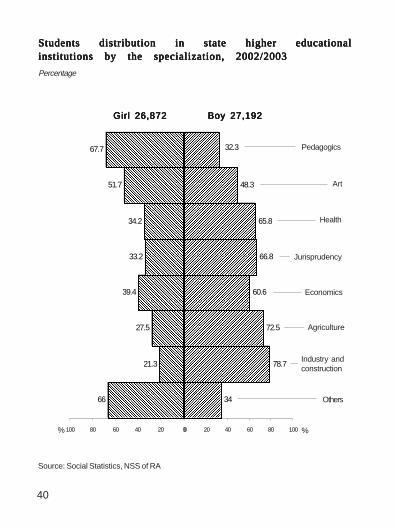
Students distribution in state higher educationalStudents distribution in state higher educationalStudents distribution in state higher educationalStudents distribution in state higher educationalStudents distribution in state higher educationalinstitutions by the specialization, 2002/2003institutions by the specialization, 2002/2003institutions by the specialization, 2002/2003institutions by the specialization, 2002/2003institutions by the specialization, 2002/2003
Percentage
Source: Social Statistics, NSS of RA
Girl 26,872 Boy 27,192Girl 26,872 Boy 27,192Girl 26,872 Boy 27,192Girl 26,872 Boy 27,192Girl 26,872 Boy 27,192
%%
Pedagogics
Art
Health
Jurisprudency
Economics
Agriculture
Industry andconstruction
Others
���������������������������������������������
����������������������������������������������������������������������������������������������������������������������������������������
���������������������������������������������������������������������������������������������
������������������������������������������������������������������������������
���������������������������������������������������������������������������������������
����������������������������������������������������������������������������������������������������������������
���������������������������������������������������������������
��������������������������������������������������������
34
78.7
72.5
60.6
66.8
65.8
48.3
32.3
0 20 40 60 80 100
������������������������������������������������������������������������������������������
����������������������������������������
���������������������������������������
������������������������������������������������������
������������������������������������������������
����������������������������������������������������������������
������������������������������������������������������������������������
����������������������������������������������������������������������������������������������������������������������������
66
21.3
27.5
39.4
33.2
34.2
51.7
67.7
020406080100
41
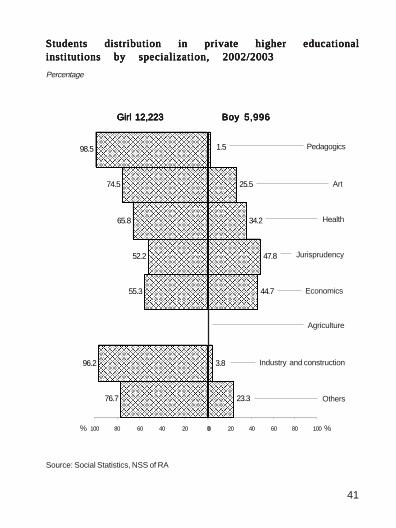
Students distribution in private higher educationalStudents distribution in private higher educationalStudents distribution in private higher educationalStudents distribution in private higher educationalStudents distribution in private higher educationalinstitutions by specialization, 2002/2003institutions by specialization, 2002/2003institutions by specialization, 2002/2003institutions by specialization, 2002/2003institutions by specialization, 2002/2003
Percentage
Girl 12,223 Girl 12,223 Girl 12,223 Girl 12,223 Girl 12,223 Boy 5,996 Boy 5,996 Boy 5,996 Boy 5,996 Boy 5,996
Pedagogics
Art
Health
Jurisprudency
Economics
Agriculture
Industry and construction
Others
% %
Source: Social Statistics, NSS of RA
���������������������������������
��������
������������������������������������������������������������
������������������������������������������������������������������������������������
������������������������������������������������
������������������������������������
��������
23.3
3.8
44.7
47.8
34.2
25.5
1.5
0 20 40 60 80 100
���������������������������������������������������������������������������������������������������������
��������������������������������������������������������������������������������������������������������������������������������������������������������������������������������
������������������������������������������������������������������������������
����������������������������������������������������������������������������������������������������
���������������������������������������������������������������������������������������������
���������������������������������������������������������������������������������������������������������
������������������������������������������������������������������������������������������������������������������������������������������������������������������������������������
76.7
96.2
55.3
52.2
65.8
74.5
98.5
020406080100
42
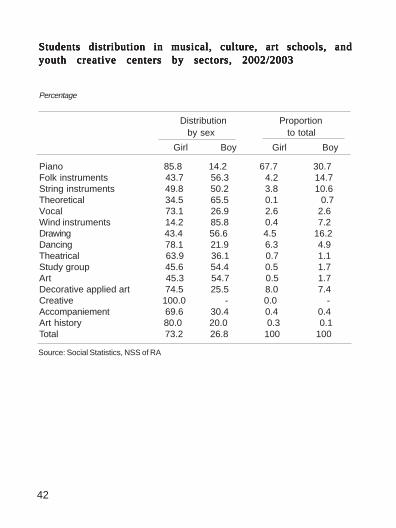
Students distribution in musical, culture, art schools, Students distribution in musical, culture, art schools, Students distribution in musical, culture, art schools, Students distribution in musical, culture, art schools, Students distribution in musical, culture, art schools, andandandandandyouth creative centers by sectors, youth creative centers by sectors, youth creative centers by sectors, youth creative centers by sectors, youth creative centers by sectors, 2002/20032002/20032002/20032002/20032002/2003
Distribution Proportion by sex to total
Girl Boy Girl Boy
Piano 85.8 14.2 67.7 30.7Folk instruments 43.7 56.3 4.2 14.7String instruments 49.8 50.2 3.8 10.6Theoretical 34.5 65.5 0.1 0.7Vocal 73.1 26.9 2.6 2.6Wind instruments 14.2 85.8 0.4 7.2Drawing 43.4 56.6 4.5 16.2Dancing 78.1 21.9 6.3 4.9Theatrical 63.9 36.1 0.7 1.1Study group 45.6 54.4 0.5 1.7Art 45.3 54.7 0.5 1.7Decorative applied art 74.5 25.5 8.0 7.4Creative 100.0 - 0.0 -Accompaniement 69.6 30.4 0.4 0.4Art history 80.0 20.0 0.3 0.1Total 73.2 26.8 100 100
Percentage
Source: Social Statistics, NSS of RA
43
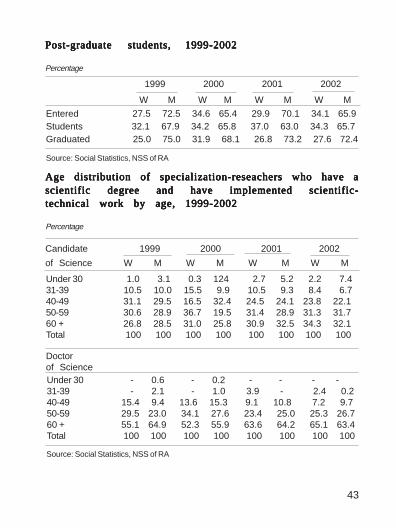
Post-graduate students,Post-graduate students,Post-graduate students,Post-graduate students,Post-graduate students, 1999-20021999-20021999-20021999-20021999-2002
1999 2000 2001 2002
W M W M W M W M
Entered 27.5 72.5 34.6 65.4 29.9 70.1 34.1 65.9Students 32.1 67.9 34.2 65.8 37.0 63.0 34.3 65.7Graduated 25.0 75.0 31.9 68.1 26.8 73.2 27.6 72.4
Age distribution of specialization-reseachers who have aAge distribution of specialization-reseachers who have aAge distribution of specialization-reseachers who have aAge distribution of specialization-reseachers who have aAge distribution of specialization-reseachers who have ascientific degree and have implemented scientific-scientific degree and have implemented scientific-scientific degree and have implemented scientific-scientific degree and have implemented scientific-scientific degree and have implemented scientific-technical work by age, 1999-2002technical work by age, 1999-2002technical work by age, 1999-2002technical work by age, 1999-2002technical work by age, 1999-2002
Percentage
Candidate 1999 2000 2001 2002
of Science W M W M W M W M
Under 30 - 0.6 - 0.2 - - - -31-39 - 2.1 - 1.0 3.9 - 2.4 0.240-49 15.4 9.4 13.6 15.3 9.1 10.8 7.2 9.750-59 29.5 23.0 34.1 27.6 23.4 25.0 25.3 26.760 + 55.1 64.9 52.3 55.9 63.6 64.2 65.1 63.4Total 100 100 100 100 100 100 100 100
Percentage
Source: Social Statistics, NSS of RA
Under 30 1.0 3.1 0.3 124 2.7 5.2 2.2 7.431-39 10.5 10.0 15.5 9.9 10.5 9.3 8.4 6.740-49 31.1 29.5 16.5 32.4 24.5 24.1 23.8 22.150-59 30.6 28.9 36.7 19.5 31.4 28.9 31.3 31.760 + 26.8 28.5 31.0 25.8 30.9 32.5 34.3 32.1Total 100 100 100 100 100 100 100 100
Doctorof Science
Source: Social Statistics, NSS of RA
44
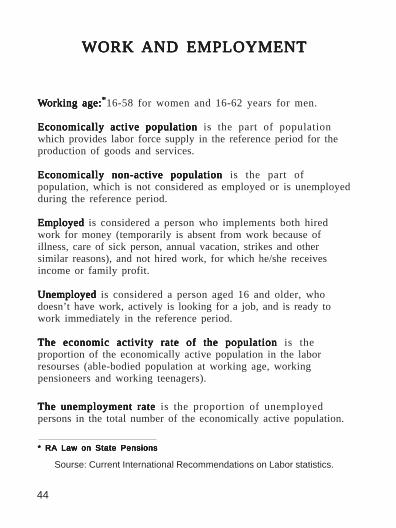
WORK WORK WORK WORK WORK AND EMPLOYMENTAND EMPLOYMENTAND EMPLOYMENTAND EMPLOYMENTAND EMPLOYMENT
WWWWWorking age:orking age:orking age:orking age:orking age: 16-58 for women and 16-62 years for men.
Economically active populationEconomically active populationEconomically active populationEconomically active populationEconomically active population is the part of populationwhich provides labor force supply in the reference period for theproduction of goods and services.
Economically non-active populationEconomically non-active populationEconomically non-active populationEconomically non-active populationEconomically non-active population is the part ofpopulation, which is not considered as employed or is unemployedduring the reference period.
EmployedEmployedEmployedEmployedEmployed is considered a person who implements both hiredwork for money (temporarily is absent from work because ofillness, care of sick person, annual vacation, strikes and othersimilar reasons), and not hired work, for which he/she receivesincome or family profit.
UnemployedUnemployedUnemployedUnemployedUnemployed is considered a person aged 16 and older, whodoesn’t have work, actively is looking for a job, and is ready towork immediately in the reference period.
The economic activity rate of the populationThe economic activity rate of the populationThe economic activity rate of the populationThe economic activity rate of the populationThe economic activity rate of the population is theproportion of the economically active population in the laborresourses (able-bodied population at working age, workingpensioneers and working teenagers).
The unemployment rateThe unemployment rateThe unemployment rateThe unemployment rateThe unemployment rate is the proportion of unemployedpersons in the total number of the economically active population.
* RA Law on State Pensions* RA Law on State Pensions* RA Law on State Pensions* RA Law on State Pensions* RA Law on State Pensions
*****
Sourse: Current International Recommendations on Labor statistics.
45
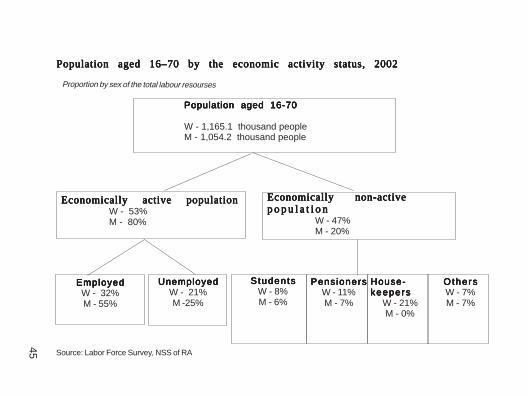
Population aged 16-70Population aged 16-70Population aged 16-70Population aged 16-70Population aged 16-70
W - 1,165.1 thousand peopleM - 1,054.2 thousand people
Studen tsStuden tsStuden tsStuden tsStuden tsW - 8%M - 6%
UnemployedUnemployedUnemployedUnemployedUnemployedW - 21%M -25%
Economically active populationEconomically active populationEconomically active populationEconomically active populationEconomically active populationW - 53%M - 80%
Economically non-activeEconomically non-activeEconomically non-activeEconomically non-activeEconomically non-activep o p u l a t i o np o p u l a t i o np o p u l a t i o np o p u l a t i o np o p u l a t i o n
W - 47%M - 20%
EmployedEmployedEmployedEmployedEmployedW - 32%M - 55%
PensionersPensionersPensionersPensionersPensionersW - 11%M - 7%
House-House-House-House-House-keeperskeeperskeeperskeeperskeepers
W - 21%M - 0%
OthersOthersOthersOthersOthersW - 7%M - 7%
Source: Labor Force Survey, NSS of RA
Population aged 16–70 by the economic activity status, 2002Population aged 16–70 by the economic activity status, 2002Population aged 16–70 by the economic activity status, 2002Population aged 16–70 by the economic activity status, 2002Population aged 16–70 by the economic activity status, 2002
Proportion by sex of the total labour resourses
46
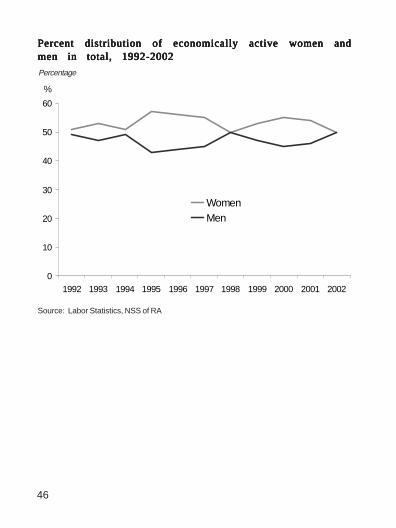
Percent distribution of economically active women andPercent distribution of economically active women andPercent distribution of economically active women andPercent distribution of economically active women andPercent distribution of economically active women andmen in total, 1992-2002men in total, 1992-2002men in total, 1992-2002men in total, 1992-2002men in total, 1992-2002
Source: Labor Statistics, NSS of RA
%
0
10
20
30
40
50
60
1992 1993 1994 1995 1996 1997 1998 1999 2000 2001 2002
Women
Men
Percentage
47
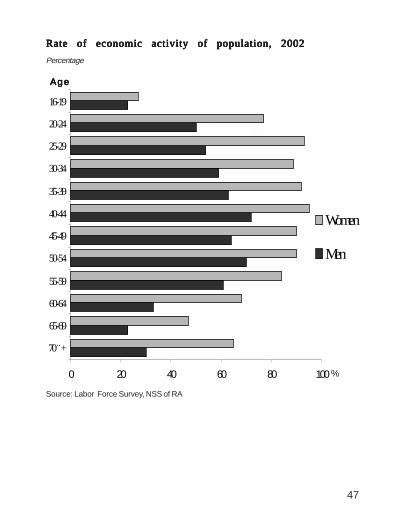
Rate of economic activity of population, 2002Rate of economic activity of population, 2002Rate of economic activity of population, 2002Rate of economic activity of population, 2002Rate of economic activity of population, 2002
Percentage
AgeAgeAgeAgeAge
%
Source: Labor Force Survey, NSS of RA
0 20 40 60 80 100
70 ̈ +
65-69
60-64
55-59
50-54
45-49
40-44
35-39
30-34
25-29
20-24
16-19
Women
Men
48
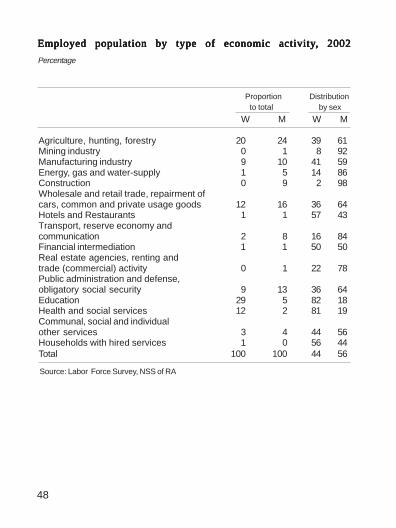
Employed population by type of economic activityEmployed population by type of economic activityEmployed population by type of economic activityEmployed population by type of economic activityEmployed population by type of economic activity, 2002, 2002, 2002, 2002, 2002
Percentage
Proportion Distribution to total by sex
W M W M
Agriculture, hunting, forestry 20 24 39 61Mining industry 0 1 8 92Manufacturing industry 9 10 41 59Energy, gas and water-supply 1 5 14 86Construction 0 9 2 98Wholesale and retail trade, repairment ofcars, common and private usage goods 12 16 36 64Hotels and Restaurants 1 1 57 43Transport, reserve economy andcommunication 2 8 16 84Financial intermediation 1 1 50 50Real estate agencies, renting andtrade (commercial) activity 0 1 22 78Public administration and defense,obligatory social security 9 13 36 64Education 29 5 82 18Health and social services 12 2 81 19Communal, social and individualother services 3 4 44 56Households with hired services 1 0 56 44Total 100 100 44 56
Source: Labor Force Survey, NSS of RA
49
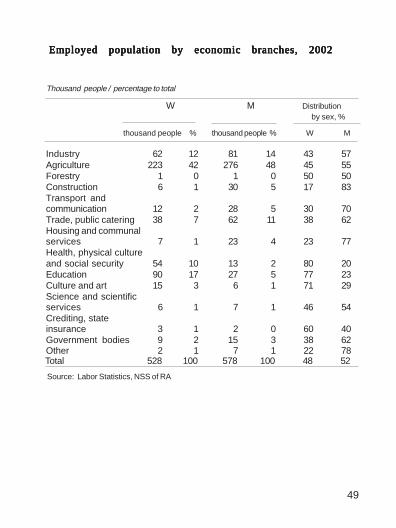
W M Distribution by sex, %
thousand people % thousand people % W M
Industry 62 12 81 14 43 57Agriculture 223 42 276 48 45 55Forestry 1 0 1 0 50 50Construction 6 1 30 5 17 83Transport andcommunication 12 2 28 5 30 70Trade, public catering 38 7 62 11 38 62Housing and communalservices 7 1 23 4 23 77Health, physical cultureand social security 54 10 13 2 80 20Education 90 17 27 5 77 23Culture and art 15 3 6 1 71 29Science and scientificservices 6 1 7 1 46 54Crediting, stateinsurance 3 1 2 0 60 40Government bodies 9 2 15 3 38 62Other 2 1 7 1 22 78
Source: Labor Statistics, NSS of RA
Total 528 100 578 100 48 52
Employed population by economic branches, 2002Employed population by economic branches, 2002Employed population by economic branches, 2002Employed population by economic branches, 2002Employed population by economic branches, 2002
Thousand people / percentage to total
50
Distribution of employed population by the 20 largestDistribution of employed population by the 20 largestDistribution of employed population by the 20 largestDistribution of employed population by the 20 largestDistribution of employed population by the 20 largestoccupational groups, 2002occupational groups, 2002occupational groups, 2002occupational groups, 2002occupational groups, 2002Percentage
Source: Labor Force Survey, NSS of RA
Qualified workers of agric. goods
production, forestry and fishery
����������������������������
������������������������������������������
������������������������������������������������������������
����������
����������������������
������������������������������������������
������������������������������������������
��������������������������������
��������������������������������������������������������������������
������������������������������������������������������������
��������������������������������������
������������������������������������������������������������
������������������������������������
������������������������������������������
����
���������������������������������������������������
��������������
����������������������������������������������
���������������������������������������������������������������������
��������������
����������������������������������������������������������������
����������������������������������������������������
��������������������������������
��������������������������������
������������������������������������������
������
��������������
������������������������������������
��������������
��������������������������������������
��������������������������������
����������������������������������������������������������������������
������������������������������������������������������������
������������������������������������������������������������������������
������������������������������������������������������������
������������������������������������������������������������������������
������������������������������������������������������������������������
-100-50050100
-100 -50 0 50 100
Other qualified professions of industrial big
and small organizationsUnqualified workers for all branches of
economyUnqualified workers of services,housing-communal, trade andother activities
Machineoperators and
industrialequipment
mechanicsWorkers in the control equipmentand tools preparation fields
Workers of metal-workingindustryWork providing personal
services, defence of citizens andtheir property Officers dealing with data
processing, documentationand registrationAverage staff of finance-
economy, administrative andsocial activities fields
Specialists with averagequalification in the field of
educationSpecialists withaverage qualification ofnatural sciences andhealth and auxilarystaff
Specialists withaverage qualification inthe field of physics and
architectureHighly qualified otherspecialists
Specialists in biological,agricultural sciences and health
Specialists ofnatural and
engineeringsciences fieldManagers of small institutions and
organizationsHighly qualified
specialists in thefield of education
Workers in mining industry,building and assembly jobs
WomenWomenWomenWomenWomen M e nM e nM e nM e nM e n
Sellers, presenters ofgoods and clothes
%
%
51
Employed population distribution by reasons for notEmployed population distribution by reasons for notEmployed population distribution by reasons for notEmployed population distribution by reasons for notEmployed population distribution by reasons for notworking a full working dayworking a full working dayworking a full working dayworking a full working dayworking a full working day, 2002, 2002, 2002, 2002, 2002
Percentage
Proportion Distribution to total by sex
W M W M
Doesn’t like to work a full day 21 22 46 54No opportunity to work full day 20 18 52 48Couldn’t find a full day job 40 55 41 59Administratively-set work day 19 5 79 21Total 100 100 49 51
Source: Labor Force Survey, NSS of RA
Economically active population by marital status, 2002Economically active population by marital status, 2002Economically active population by marital status, 2002Economically active population by marital status, 2002Economically active population by marital status, 2002
W M
Single 53 47Married 40 60Divorced 88 12Widowed 89 11
Total 47 53
Percentage
Source: Labour Force Sample Survey, NSS of RA
52
Employed population by marital status and actual hoursEmployed population by marital status and actual hoursEmployed population by marital status and actual hoursEmployed population by marital status and actual hoursEmployed population by marital status and actual hoursworked per week, 2002worked per week, 2002worked per week, 2002worked per week, 2002worked per week, 2002
W M W M W M
Full day 60 40 40 60 85 15Not full day 43 57 43 57 97 3More than full day 36 64 21 79 70 30Total 51 49 37 63 87 13
Widowed TotalW M W M
Full day 88 12 48 52Not full day 95 5 49 51More than full day 76 24 27 73Total 89 11 44 56
Source: Labor Force Survey, NSS of RA
Single Married Divorced
Percentage
53
Unemployment rate by sex, 1992–2002Unemployment rate by sex, 1992–2002Unemployment rate by sex, 1992–2002Unemployment rate by sex, 1992–2002Unemployment rate by sex, 1992–2002
Source: Labor Statistics, NSS of RA
Percentage
%
Women
Men
0
5
10
15
20
25
1992 1993 1994 1995 1996 1997 1998 1999 2000 2001 2002
The indicator of unemployment rate of 2002 is not comparable with previous indicators, since it wasrecalculated based on the RA Population Census data of 2001.
54
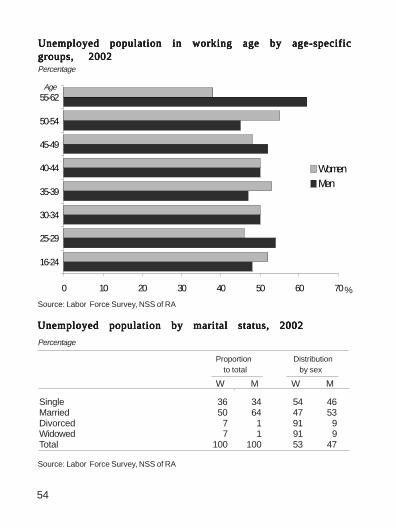
Unemployed population in working age by age-specificUnemployed population in working age by age-specificUnemployed population in working age by age-specificUnemployed population in working age by age-specificUnemployed population in working age by age-specificgroups, 2002groups, 2002groups, 2002groups, 2002groups, 2002
Unemployed population by marital status, 2002Unemployed population by marital status, 2002Unemployed population by marital status, 2002Unemployed population by marital status, 2002Unemployed population by marital status, 2002
Proportion Distribution to total by sex
W M W M
Single 36 34 54 46Married 50 64 47 53Divorced 7 1 91 9Widowed 7 1 91 9Total 100 100 53 47
Age
%
Percentage
Source: Labor Force Survey, NSS of RA
Source: Labor Force Survey, NSS of RA
0 10 20 30 40 50 60 70
16-24
25-29
30-34
35-39
40-44
45-49
50-54
55-62
WomenMen
Percentage
55
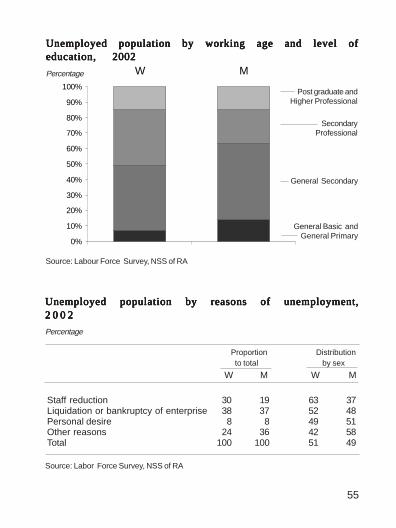
Unemployed population by working age and level ofUnemployed population by working age and level ofUnemployed population by working age and level ofUnemployed population by working age and level ofUnemployed population by working age and level ofeducation, 2002education, 2002education, 2002education, 2002education, 2002
Percentage
Unemployed population by reasons of unemployment,Unemployed population by reasons of unemployment,Unemployed population by reasons of unemployment,Unemployed population by reasons of unemployment,Unemployed population by reasons of unemployment,2 0 0 22 0 0 22 0 0 22 0 0 22 0 0 2
Proportion Distribution to total by sex
W M W M
Staff reduction 30 19 63 37Liquidation or bankruptcy of enterprise 38 37 52 48Personal desire 8 8 49 51Other reasons 24 36 42 58Total 100 100 51 49
Percentage
Source: Labour Force Survey, NSS of RA
Source: Labor Force Survey, NSS of RA
0%
10%
20%
30%
40%
50%
60%
70%
80%
90%
100%
W M
Post graduate andHigher Professional
SecondaryProfessional
General Secondary
General Basic andGeneral Primary
56
TTTTTemporary employed population by employment status,emporary employed population by employment status,emporary employed population by employment status,emporary employed population by employment status,emporary employed population by employment status,2 0 0 22 0 0 22 0 0 22 0 0 22 0 0 2
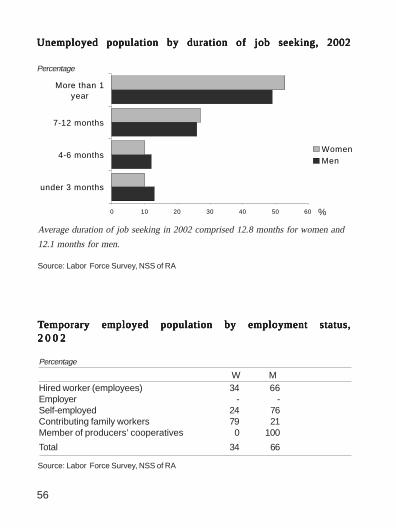
Unemployed population by duration of job seeking, 2002Unemployed population by duration of job seeking, 2002Unemployed population by duration of job seeking, 2002Unemployed population by duration of job seeking, 2002Unemployed population by duration of job seeking, 2002
%
Average duration of job seeking in 2002 comprised 12.8 months for women and
12.1 months for men.
Percentage
Hired worker (employees) 34 66Employer - -Self-employed 24 76Contributing family workers 79 21Member of producers’ cooperatives 0 100
Total 34 66
0 10 20 30 40 50 60
under 3 months
4-6 months
7-12 months
More than 1year
Women
Men
Percentage
Source: Labor Force Survey, NSS of RA
Source: Labor Force Survey, NSS of RA
W M
57
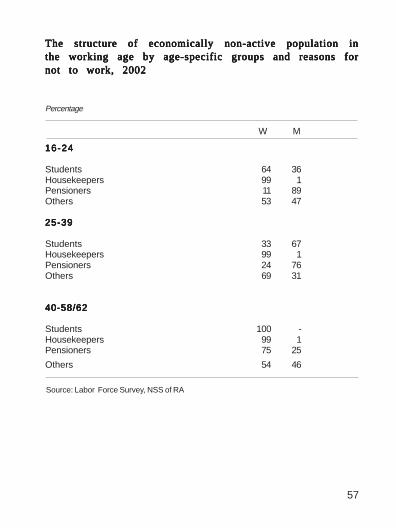
The structure of economically non-active population inThe structure of economically non-active population inThe structure of economically non-active population inThe structure of economically non-active population inThe structure of economically non-active population inthe working age by age-specific groups and reasons forthe working age by age-specific groups and reasons forthe working age by age-specific groups and reasons forthe working age by age-specific groups and reasons forthe working age by age-specific groups and reasons fornot to work, 2002not to work, 2002not to work, 2002not to work, 2002not to work, 2002
16-2416-2416-2416-2416-24
Students 64 36Housekeepers 99 1Pensioners 11 89Others 53 47
25-3925-3925-3925-3925-39
Students 33 67Housekeepers 99 1Pensioners 24 76Others 69 31
40-58/6240-58/6240-58/6240-58/6240-58/62
Students 100 -Housekeepers 99 1Pensioners 75 25
Others 54 46
Source: Labor Force Survey, NSS of RA
Percentage
W M
58
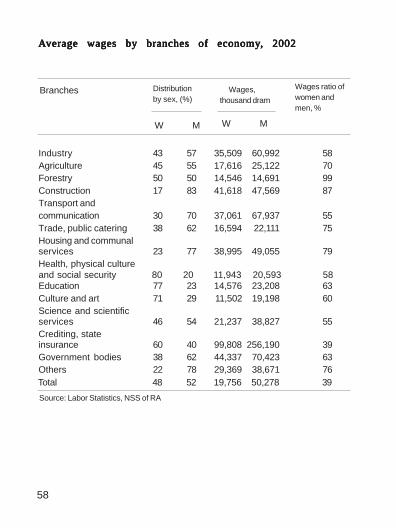
AAAAAverage wages by branches of economyverage wages by branches of economyverage wages by branches of economyverage wages by branches of economyverage wages by branches of economy, 2002, 2002, 2002, 2002, 2002
Industry 43 57 35,509 60,992 58Agriculture 45 55 17,616 25,122 70Forestry 50 50 14,546 14,691 99Construction 17 83 41,618 47,569 87Transport andcommunication 30 70 37,061 67,937 55Trade, public catering 38 62 16,594 22,111 75Housing and communalservices 23 77 38,995 49,055 79Health, physical cultureand social security 80 20 11,943 20,593 58Education 77 23 14,576 23,208 63Culture and art 71 29 11,502 19,198 60Science and scientificservices 46 54 21,237 38,827 55Crediting, stateinsurance 60 40 99,808 256,190 39Government bodies 38 62 44,337 70,423 63Others 22 78 29,369 38,671 76
Branches Wages,thousand dram
Distributionby sex, (%)
Wages ratio ofwomen andmen, %
W M W M
Source: Labor Statistics, NSS of RA
Total 48 52 19,756 50,278 39
59
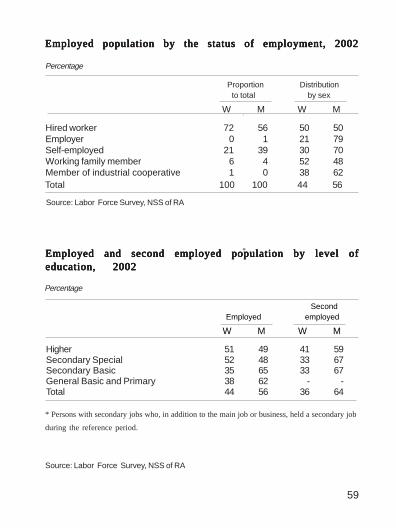
Proportion Distribution to total by sex
W M W M
Hired worker 72 56 50 50Employer 0 1 21 79Self-employed 21 39 30 70Working family member 6 4 52 48Member of industrial cooperative 1 0 38 62
Source: Labor Force Survey, NSS of RA
Total 100 100 44 56
Employed population by the status of employment, 2002Employed population by the status of employment, 2002Employed population by the status of employment, 2002Employed population by the status of employment, 2002Employed population by the status of employment, 2002
Percentage
Employed and second employed population by level ofEmployed and second employed population by level ofEmployed and second employed population by level ofEmployed and second employed population by level ofEmployed and second employed population by level ofeducation, 2002education, 2002education, 2002education, 2002education, 2002
Second Employed employed
W M W M
Higher 51 49 41 59Secondary Special 52 48 33 67Secondary Basic 35 65 33 67General Basic and Primary 38 62 - -Total 44 56 36 64
Percentage
Source: Labor Force Survey, NSS of RA
* Persons with secondary jobs who, in addition to the main job or business, held a secondary job
during the reference period.
*
60
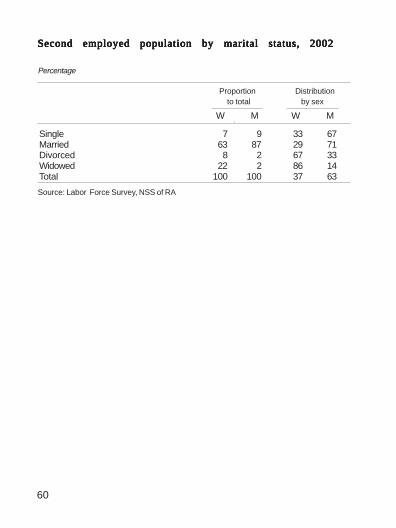
Second employedSecond employedSecond employedSecond employedSecond employed population by marital status, 2002population by marital status, 2002population by marital status, 2002population by marital status, 2002population by marital status, 2002
Proportion Distribution to total by sex
W M W M
Single 7 9 33 67Married 63 87 29 71Divorced 8 2 67 33Widowed 22 2 86 14Total 100 100 37 63
Percentage
Source: Labor Force Survey, NSS of RA
61
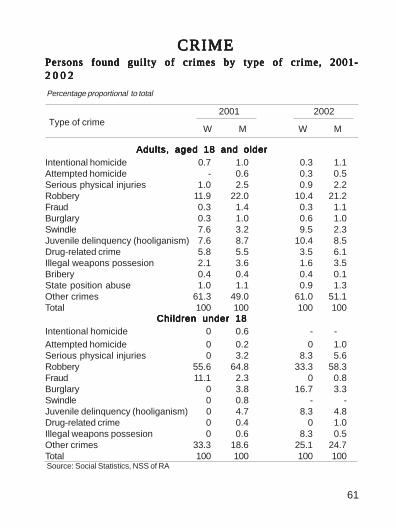
Type of crime
Adults, aged 18 and olderAdults, aged 18 and olderAdults, aged 18 and olderAdults, aged 18 and olderAdults, aged 18 and olderIntentional homicide 0.7 1.0 0.3 1.1Attempted homicide - 0.6 0.3 0.5Serious physical injuries 1.0 2.5 0.9 2.2Robbery 11.9 22.0 10.4 21.2Fraud 0.3 1.4 0.3 1.1Burglary 0.3 1.0 0.6 1.0Swindle 7.6 3.2 9.5 2.3Juvenile delinquency (hooliganism) 7.6 8.7 10.4 8.5Drug-related crime 5.8 5.5 3.5 6.1Illegal weapons possesion 2.1 3.6 1.6 3.5Bribery 0.4 0.4 0.4 0.1State position abuse 1.0 1.1 0.9 1.3Other crimes 61.3 49.0 61.0 51.1Total 100 100 100 100
Children under 18Children under 18Children under 18Children under 18Children under 18Intentional homicide 0 0.6 - -
Attempted homicide 0 0.2 0 1.0Serious physical injuries 0 3.2 8.3 5.6Robbery 55.6 64.8 33.3 58.3Fraud 11.1 2.3 0 0.8Burglary 0 3.8 16.7 3.3Swindle 0 0.8 - -Juvenile delinquency (hooliganism) 0 4.7 8.3 4.8Drug-related crime 0 0.4 0 1.0Illegal weapons possesion 0 0.6 8.3 0.5Other crimes 33.3 18.6 25.1 24.7Total 100 100 100 100Source: Social Statistics, NSS of RA
Persons found guilty of crimes by type of crime, 2001-Persons found guilty of crimes by type of crime, 2001-Persons found guilty of crimes by type of crime, 2001-Persons found guilty of crimes by type of crime, 2001-Persons found guilty of crimes by type of crime, 2001-2 0 0 22 0 0 22 0 0 22 0 0 22 0 0 2
2001 2002
CRIMECRIMECRIMECRIMECRIME
Percentage proportional to total
W M W M
62
Type of crime
Adults, aged 18 and olderAdults, aged 18 and olderAdults, aged 18 and olderAdults, aged 18 and olderAdults, aged 18 and older
Intentional homicide 6.3 93.7 2.8 97.2Attempt of homicide - 100 6.1 93.9Serious physical injuries 3.9 96.1 4.0 96.0Robbery 4.9 95.1 5.0 95.0Fraud 2.0 98.0 2.6 97.4Burglary 3.1 96.9 6.0 94.0Swindle 18.2 81.8 30.2 69.8Juvenile delinquency (hooliganism) 7.7 92.3 11.5 88.5Drug-related crime 9.1 90.9 5.8 94.2Illegal weapons possesion 5.2 94.8 4.7 95.3Bribery 9.1 90.9 27.3 72.7Abuse of state position 8.5 91.5 6.8 93.2Other crimes 10.7 89.3 11.3 88.7Total 8.7 91.3 9.6 90.4
Children under 18Children under 18Children under 18Children under 18Children under 18Intentional homicide 0 100 - -Attempted homicide 0 100 0 100Serious physical injuries 0 100 4.3 95.7Robbery 1.4 98.6 1.7 98.3Fraud 7.7 92.3 0 100Burglary 0 100 13.3 86.7Swindle 0 100 - -Juvenile delinquency (hooliganism) 0 100 5.0 95.0Drug-related crime 0 100 0 100Illegal weapons possesion 5.2 94.8 2.9 97.1Other crimes 2.9 97.1 3.0 97.0Total 1.7 98.3 2.9 97.1
Source: Social Statistics, NSS of RA
Persons found guilty of crimes by type, 2001-2002Persons found guilty of crimes by type, 2001-2002Persons found guilty of crimes by type, 2001-2002Persons found guilty of crimes by type, 2001-2002Persons found guilty of crimes by type, 2001-2002
2001 2002
Percentage distribution by sex
W M W M
63
Type of crime
W M W M
Adults, aged 18 and olderAdults, aged 18 and olderAdults, aged 18 and olderAdults, aged 18 and olderAdults, aged 18 and older
Intentional homicide 0.6 1.2 1.2 1.3Serious physical injuries 2.5 2.6 2.2 2.3Stealing of property, 29.4 24.8 20.3 21.4 including by robbery 15.1 18.7 10.5 15.8Juvenile delinquency (hooliganism) 6.0 6.7 6.5 6.3Drug-related crime 8.8 6.8 8.0 6.5Other crimes 52.7 57.9 61.8 62.2Total 100 100 100 100Number of convicted adults 317 4924 325 4295
Children under 18Children under 18Children under 18Children under 18Children under 18
Intentional homicides - - - 0.5Stealing of property, 100 71.9 50.0 54.3 including by robbery 100 65.5 - 47.7 by fraud - 4.8 50.0 6.1 by burglary - 1.2 - - by swindle - 0.4 - 0.5Juvenile delinquency (hooliganism) - 1.2 - 2.5Drug-related crime - - - 1,1Other crimes - 26.9 50.0 41.6Total 100 100 100 100Number of convicted children 2 249 4 197
Source: Social Statistics, NSS of RA
Convicted persons by type of crime, 2001-2002Convicted persons by type of crime, 2001-2002Convicted persons by type of crime, 2001-2002Convicted persons by type of crime, 2001-2002Convicted persons by type of crime, 2001-2002
2001 2002
Percentage proportional to total
64
Type of crime
W M W M
Adults, aged 18 and olderAdults, aged 18 and olderAdults, aged 18 and olderAdults, aged 18 and olderAdults, aged 18 and older
Intentional homicide 3.3 96.7 6.5 93.5Serious physical injuries 5.9 94.1 6.7 93.3Stealing of property, 7.1 92.9 6.7 93.3 including by robbery 4.9 95.1 4.8 95.2Juvenile delinquency (hooliganism) 5.4 94.6 7.2 92.8Drug-related crime 7.7 92.3 8.5 91.5Other crimes 5.2 94.8 7.0 93.0Total 6.0 94.0 7.0 93.0Number of convicted adults 317 4,924 325 4,295
Children under 18Children under 18Children under 18Children under 18Children under 18
Intentional homicide - - - 100Stealing of property, 1.1 98.9 1.8 98.2 including by robbery 1.2 98.8 - 100 by fraud - 100 14.3 85.7 by burglary - 100 - - by swindle - 100 - 100Juvenile delinquency (hooliganism) - 100 - 100Drug-related crime - - - 100Other crimes - 100 2.4 97.6Total 0.8 99.2 2.0 98.0Number of convicted children 2 249 4 197
Source: Social Statistics, NSS of RA
Percentage distribution by sex
Convicted persons by type of crime, 2001-2002Convicted persons by type of crime, 2001-2002Convicted persons by type of crime, 2001-2002Convicted persons by type of crime, 2001-2002Convicted persons by type of crime, 2001-2002
2001 2002
65
Special staff in reformatories
Special staff in colonized places 27.6 29.3 3.0 97.0 27.6 32.0 2.4 97.6
Total 63.2 52.5 3.9 96.1 65.8 50.2 3.6 96.4including teenagers - 62.1 - 100 - 60.4 - 100
Special staff in reformatorycolony-settlements
Proportional
to total
W M
Distribution
by sex
20022001
Proportional
to total
Distribution by sex
W M W M W M
Total 9.2 18.2 1.7 98.3 6.6 17.8 1.0 99.0including teenagers - 37.9 - 100 - 39.6 - 100
Total, 100 100 3.2 96.8 100 100 2.8 97.2including teenagers - 100 - 100 100 100 - 100
Percentage
Special staff in criminal services’ institutions, 2001-2002Special staff in criminal services’ institutions, 2001-2002Special staff in criminal services’ institutions, 2001-2002Special staff in criminal services’ institutions, 2001-2002Special staff in criminal services’ institutions, 2001-2002
Source: Social Statistics, NSS of RA
66
GOVERNANCE GOVERNANCE GOVERNANCE GOVERNANCE GOVERNANCE AND INFLUENCEAND INFLUENCEAND INFLUENCEAND INFLUENCEAND INFLUENCE
The number of Deputies in the National The number of Deputies in the National The number of Deputies in the National The number of Deputies in the National The number of Deputies in the National Assembly of RAAssembly of RAAssembly of RAAssembly of RAAssembly of RAby factions and deputy groups, end of year 2002by factions and deputy groups, end of year 2002by factions and deputy groups, end of year 2002by factions and deputy groups, end of year 2002by factions and deputy groups, end of year 2002
Source: National Assembly of RA
Numbers Percentage
W M W M
§Miasnutyun¦ Faction 1 36 3 97
§Communist Party of Armenia¦ Faction - 8 - 100
§Iravunq yev Miabanutyun¦ Faction 1 7 13 87
§Hay Heghapokhakan
Dashnakcutyun¦ Faction 1 9 10 90
§Orinats Erkir¦ Faction - 5 - 100
§Azgayin Zhoghovrdavarakan
Miutyun¦ Faction - 4 - 100
§Agroardyunaberakan
Zhoghovrdakan Miavorum¦
Deputy Group - 10 - 100
§Hayastan¦ Deputy Group - 12 - 100
§Zhoghovrdakan Patgamavor¦
Deputy Group 1 15 6 94
§Zhoghovurdi dzayn¦ Deputy Group 1 9 10 90
Independent Deputies - 11 - 100
Total 5 126 3 97
Factions and deputy groups
Numbers/ percentage
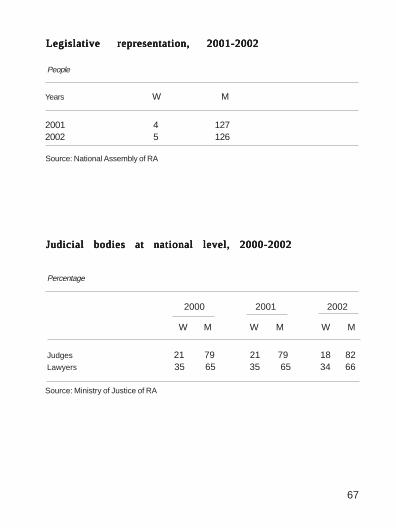
67
Source: National Assembly of RA
Years W M
2001 4 1272002 5 126
Judicial bodies at national level, 2000-2002Judicial bodies at national level, 2000-2002Judicial bodies at national level, 2000-2002Judicial bodies at national level, 2000-2002Judicial bodies at national level, 2000-2002
Judges 21 79 21 79 18 82Lawyers 35 65 35 65 34 66
Source: Ministry of Justice of RA
2000 2001 2002
W M W M W M
Legislative representation, 2001-2002Legislative representation, 2001-2002Legislative representation, 2001-2002Legislative representation, 2001-2002Legislative representation, 2001-2002
Percentage
People
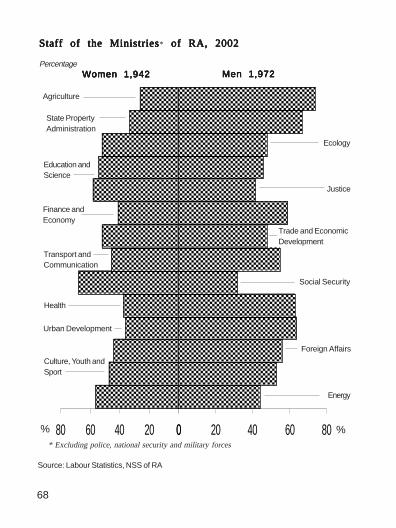
68
Source: Labour Statistics, NSS of RA
���������������������������������������������������������������������������������������������������
������������������������������������������������������������������������������������
����������������������������������������������������
��������������������������������������������
������������������������������������������������������������������
��������������������������������������������������������������������������������
���������������������������������������������������������������������������������
��������������������������������������������������������������
������������������������������������������������������������������������
��������������������������������������������������������������������
������������������������������������������������������������������������������������������������
��������������������������������������������������������������
������������������������������������������������������������
��������������������������������
020406080
���������������������������������������������������������������������������������������������������
������������������������������������������������������������������������������������������������������������������������
������������������������������������������������������������������������������������
����������������������������������������������������������������������������������������������
���������������������������������������������������������������������������������������������������������������������������������������������
������������������������������������������������
���������������������������������������������������������������������������������������������������������������������������
������������������������������������������������������������������������
������������������������������������������������������������������������������������������������������������������������������������
��������������������������������������������������������������
������������������������������������������������������������������������������������������������������
������������������������������������������������������������������������
������������������������������������������������������������������������������������������������������������������������������������������������������
��������������������������������������������������������������������������������������������������������������
0 20 40 60 80
Staff of the MinistriesStaff of the MinistriesStaff of the MinistriesStaff of the MinistriesStaff of the Ministries* of RA, 2002 of RA, 2002 of RA, 2002 of RA, 2002 of RA, 2002
PercentageWomen 1,942Women 1,942Women 1,942Women 1,942Women 1,942 Men 1,972Men 1,972Men 1,972Men 1,972Men 1,972
Energy
Culture, Youth andSport
Foreign Affairs
Urban Development
Health
Social Security
Transport andCommunication
Trade and EconomicDevelopment
Finance andEconomy
Justice
Education andScience
Ecology
State PropertyAdministration
Agriculture
% %* Excluding police, national security and military forces
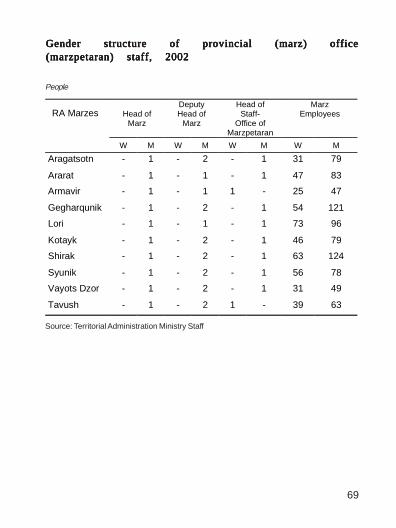
69
Gender structure of provincial (marz) officeGender structure of provincial (marz) officeGender structure of provincial (marz) officeGender structure of provincial (marz) officeGender structure of provincial (marz) office(marzpetaran) staff, 2002(marzpetaran) staff, 2002(marzpetaran) staff, 2002(marzpetaran) staff, 2002(marzpetaran) staff, 2002
Source: Territorial Administration Ministry Staff
Head of
Marz
Deputy Head of
Marz
Head of Staff-
Office of Marzpetaran
Marz Employees
RA Marzes W M W M W M W M
Aragatsotn - 1 - 2 - 1 31 79
Ararat - 1 - 1 - 1 47 83
Armavir - 1 - 1 1 - 25 47
Gegharqunik - 1 - 2 - 1 54 121
Lori - 1 - 1 - 1 73 96
Kotayk - 1 - 2 - 1 46 79
Shirak - 1 - 2 - 1 63 124
Syunik - 1 - 2 - 1 56 78
Vayots Dzor - 1 - 2 - 1 31 49
Tavush - 1 - 2 1 - 39 63
People
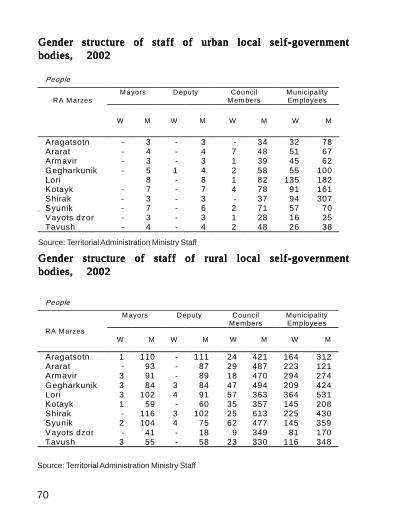
70
People
Mayors Deputy
Council Members
Municipality Employees
RA Marzes
W M W M W M W M
Aragatsotn - 3 - 3 - 34 32 78 Ararat - 4 - 4 7 48 51 67 Armavir - 3 - 3 1 39 45 62 Gegharkunik - 5 1 4 2 58 55 100 Lori 8 - 8 1 82 135 182 Kotayk - 7 - 7 4 78 91 161 Shirak - 3 - 3 - 37 94 307 Syunik - 7 - 6 2 71 57 70 Vayots dzor - 3 - 3 1 28 16 25 Tavush - 4 - 4 2 48 26 38
People
Mayors Deputy Council Members
Municipality Employees
RA Marzes
W M W M W M W M
Aragatsotn 1 110 - 111 24 421 164 312 Ararat - 93 - 87 29 487 223 121 Armavir 3 91 - 89 18 470 294 274 Gegharkunik 3 84 3 84 47 494 209 424 Lori 3 102 4 91 57 363 364 531 Kotayk 1 59 - 60 35 357 145 208 Shirak - 116 3 102 25 613 225 430 Syunik 2 104 4 75 62 477 145 359 Vayots dzor - 41 - 18 9 349 81 170 Tavush 3 55 - 58 23 330 116 348
Gender structure of staff of urban local self-governmentGender structure of staff of urban local self-governmentGender structure of staff of urban local self-governmentGender structure of staff of urban local self-governmentGender structure of staff of urban local self-governmentbodies, 2002bodies, 2002bodies, 2002bodies, 2002bodies, 2002
Gender structure of staff of rural local self-governmentGender structure of staff of rural local self-governmentGender structure of staff of rural local self-governmentGender structure of staff of rural local self-governmentGender structure of staff of rural local self-governmentbodies, 2002bodies, 2002bodies, 2002bodies, 2002bodies, 2002
Source: Territorial Administration Ministry Staff
Source: Territorial Administration Ministry Staff
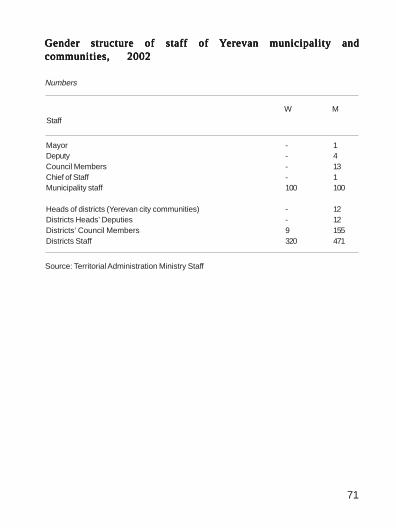
71
Gender structure of stafGender structure of stafGender structure of stafGender structure of stafGender structure of staff of f of f of f of f of YYYYYerevan municipality anderevan municipality anderevan municipality anderevan municipality anderevan municipality andcommunities, 2002communities, 2002communities, 2002communities, 2002communities, 2002
Numbers
W M
Staff
Mayor - 1Deputy - 4Council Members - 13Chief of Staff - 1Municipality staff 100 100
Heads of districts (Yerevan city communities) - 12Districts Heads’ Deputies - 12Districts’ Council Members 9 155Districts Staff 320 471
Source: Territorial Administration Ministry Staff
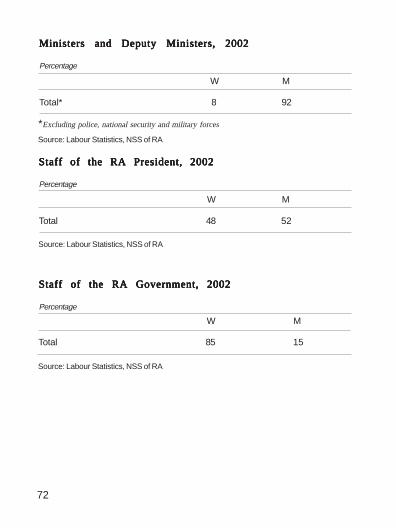
72
W M
Total* 8 92
Ministers and Deputy Ministers, 2002Ministers and Deputy Ministers, 2002Ministers and Deputy Ministers, 2002Ministers and Deputy Ministers, 2002Ministers and Deputy Ministers, 2002
Percentage
W M
Total 48 52
Staff of the RA President, 2002Staff of the RA President, 2002Staff of the RA President, 2002Staff of the RA President, 2002Staff of the RA President, 2002
Percentage
W M
Total 85 15
Staff of the RA Government, 2002Staff of the RA Government, 2002Staff of the RA Government, 2002Staff of the RA Government, 2002Staff of the RA Government, 2002
Percentage
Source: Labour Statistics, NSS of RA
Source: Labour Statistics, NSS of RA
Source: Labour Statistics, NSS of RA
*Excluding police, national security and military forces
WWWWWomen and Men in omen and Men in omen and Men in omen and Men in omen and Men in ArmeniaArmeniaArmeniaArmeniaArmeniaA Statistical Booklet
The Booklet materials were prepared under the supervision ofMr. Hrachya Petrosyan, Member of the State Council on Statistics
Persons responsible for the Booklet chapters:Tel:
Nelli Baghdasaryan 524-514 Julietta Maglouchants 524-326 Karine Kuyumjyan 523-356 Lusine Kalantaryan 587-829 Susanna Gharibyan 523-356
Responsible for publication: Narine Musheghyan,Chief, Division on Summary Statistics, Publications and Marketing
Translator: Anna Hovhannisyan
Proof Editor: Nick Wagner
Computer Designer: Gohar Nshanyan
Artist: Tigran Matulyan
The painting on the cover page illustrates Millenium DevelopmentGoals (MDG) 3, “Promote Gender Equality and Empower Women”,and is a part of the MDG campaign in Armenia.
Printed by: “Printmaster” Publishing HousePaper: offset 1. Edition: 1000 copies