Embed Size (px)
Citation preview
WOODWARD ROAD
TRAFFIC OPERATIONS ANALYSIS
i
TABLE OF CONTENTS
EXECUTIVE SUMMARY .......................................................................................................ES-1
1.0 INTRODUCTION ...............................................................................................................1
2.0 EXISTING CONDITIONS ..................................................................................................2
3.0 FUTURE TRAFFIC VOLUMES ........................................................................................2
4.0 COLLISION DATA ............................................................................................................3
5.0 ROADWAY TRAFFIC OPERATION FOR 2015 BUILD SCENARIO............................3
6.0 ROADWAY TRAFFIC OPERATION FOR 2035 BUILD SCENARIO............................4
7.0 WOODWARD ROAD TYPICAL CROSS SECTION .......................................................5
8.0 TRAFFIC SIGNAL WARRANT ANALYSIS — INTERSECTION OF WOODWARD
ROAD/2ND
STREET ..........................................................................................................10
9.0 INTERSECTION TRAFFIC OPERATION FOR 2015 BUILD SCENARIO/MINIMUM
ROADWAY IMPROVEMENTS ......................................................................................13
10.0 INTERSECTION TRAFFIC OPERATION FOR 2035 BUILD AND NO BUILD
SCENARIOS (SUNPORT/BROADWAY/WOODWARD) .............................................16
11.0 RECOMMENDATIONS ...................................................................................................16
LIST OF FIGURES
Figure 1: Study Area ....................................................................................................................... 1 Figure 2: Woodward Road Typical Sections .................................................................................. 7
Figure 3a: Ultimate Woodward Road Improvements (4-Lane Major Collector) ........................... 8 Figure 3b: Ultimate Woodward Road Improvements (4-Lane Major Collector) ........................... 9 Figure 4: Woodward Road/2
nd Street – Minimum Intersection Improvements ............................ 15
LIST OF TABLES
Table 1: Projected Traffic Volumes – 2015 Build Scenario ........................................................... 3
Table 2: Projected Traffic Volumes – 2035 Build Scenario ........................................................... 3 Table 3: Traffic Signal Warrant Screening Based on Projected Future ADT .............................. 11
Table 4: Traffic Signal Warrant Screening Based on Projected Future ADT .............................. 12
WOODWARD ROAD
TRAFFIC OPERATIONS ANALYSIS
ii
LIST OF APPENDICES
Appendix A Map of Current Roadway Functional Classification (MRCOG)
Appendix B 2015 and 2035 Forecast Traffic Volumes (AM, PM, Daily) (MRCOG)
Appendix C Excerpt from Development Process Manual (COA)
Appendix D Construction Cost Estimates—Woodward Road Ultimate and Minimum
Improvements
Appendix E Intersection Operational Analyses—Synchro Output for Woodward/2nd
Alternatives (2015 Build)
Appendix F Intersection Operational Analyses—Synchro Output for Woodward/Broadway/
Sunport (2035 Build and 2035 No Build)
Appendix G Turning Volume Calculations
WOODWARD ROAD
TRAFFIC OPERATIONS ANALYSIS
iii
ACRONYMS
ADT Average Daily Traffic
DOT department of transportation
DPM Development Process Manual
HCM Highway Capacity Manual 2010
LOS level of service
mph miles per hour
MRCOG Mid Region of Council of Governments
MTP Metropolitan Transportation Plan
MUTCD Manual on Uniform Traffic Control Devices
NMRX New Mexico Rail Runner Express
PHV Peak Hour Volume
ROW right of way
vpd vehicles per day
WOODWARD ROAD
TRAFFIC OPERATIONS ANALYSIS
ES-1
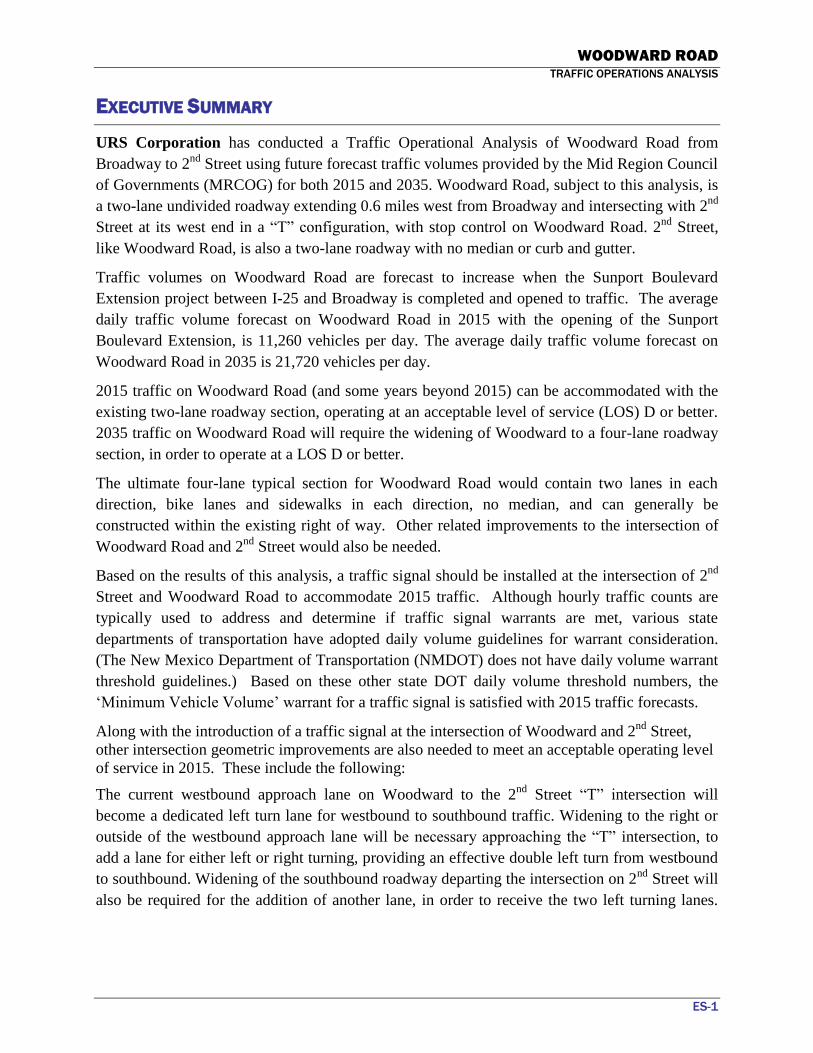
EXECUTIVE SUMMARY
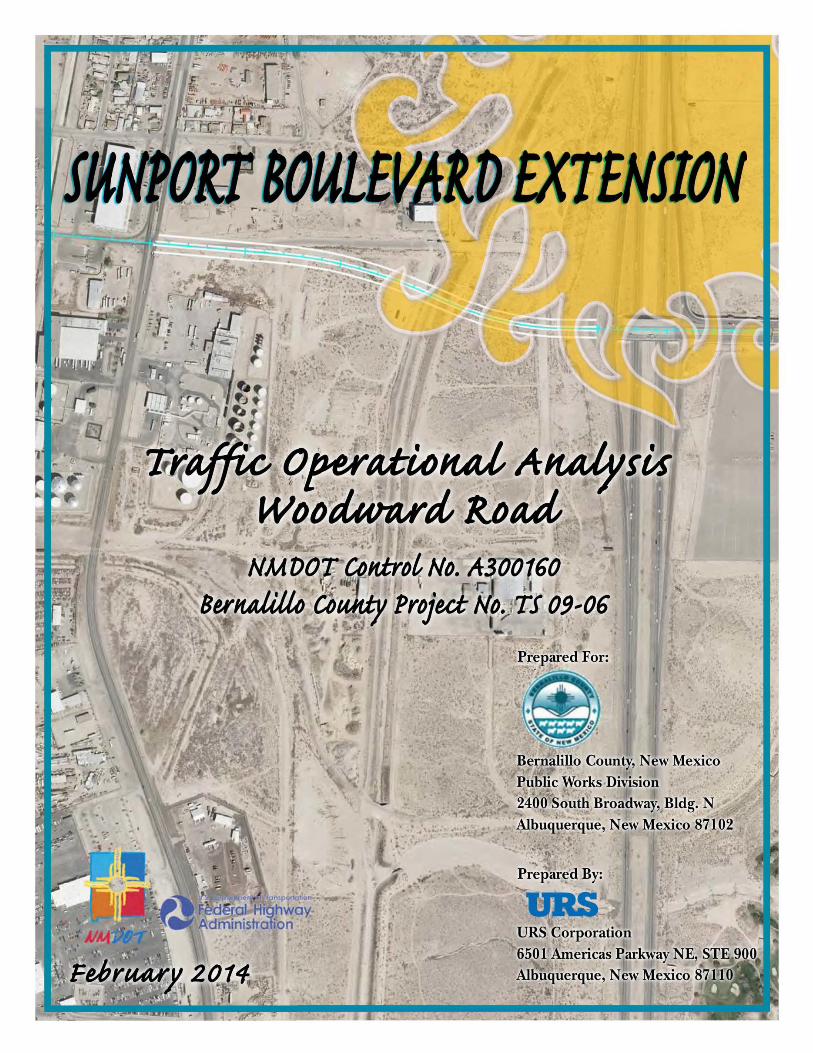
URS Corporation has conducted a Traffic Operational Analysis of Woodward Road from
Broadway to 2nd
Street using future forecast traffic volumes provided by the Mid Region Council
of Governments (MRCOG) for both 2015 and 2035. Woodward Road, subject to this analysis, is
a two-lane undivided roadway extending 0.6 miles west from Broadway and intersecting with 2nd
Street at its west end in a ―T‖ configuration, with stop control on Woodward Road. 2nd
Street,
like Woodward Road, is also a two-lane roadway with no median or curb and gutter.
Traffic volumes on Woodward Road are forecast to increase when the Sunport Boulevard
Extension project between I-25 and Broadway is completed and opened to traffic. The average
daily traffic volume forecast on Woodward Road in 2015 with the opening of the Sunport
Boulevard Extension, is 11,260 vehicles per day. The average daily traffic volume forecast on
Woodward Road in 2035 is 21,720 vehicles per day.
2015 traffic on Woodward Road (and some years beyond 2015) can be accommodated with the
existing two-lane roadway section, operating at an acceptable level of service (LOS) D or better.
2035 traffic on Woodward Road will require the widening of Woodward to a four-lane roadway
section, in order to operate at a LOS D or better.
The ultimate four-lane typical section for Woodward Road would contain two lanes in each
direction, bike lanes and sidewalks in each direction, no median, and can generally be
constructed within the existing right of way. Other related improvements to the intersection of
Woodward Road and 2nd
Street would also be needed.
Based on the results of this analysis, a traffic signal should be installed at the intersection of 2nd
Street and Woodward Road to accommodate 2015 traffic. Although hourly traffic counts are
typically used to address and determine if traffic signal warrants are met, various state
departments of transportation have adopted daily volume guidelines for warrant consideration.
(The New Mexico Department of Transportation (NMDOT) does not have daily volume warrant
threshold guidelines.) Based on these other state DOT daily volume threshold numbers, the
‗Minimum Vehicle Volume‘ warrant for a traffic signal is satisfied with 2015 traffic forecasts.
Along with the introduction of a traffic signal at the intersection of Woodward and 2nd
Street,
other intersection geometric improvements are also needed to meet an acceptable operating level
of service in 2015. These include the following:
The current westbound approach lane on Woodward to the 2nd
Street ―T‖ intersection will
become a dedicated left turn lane for westbound to southbound traffic. Widening to the right or
outside of the westbound approach lane will be necessary approaching the ―T‖ intersection, to
add a lane for either left or right turning, providing an effective double left turn from westbound
to southbound. Widening of the southbound roadway departing the intersection on 2nd
Street will
also be required for the addition of another lane, in order to receive the two left turning lanes.
WOODWARD ROAD
TRAFFIC OPERATIONS ANALYSIS
1
1.0 INTRODUCTION
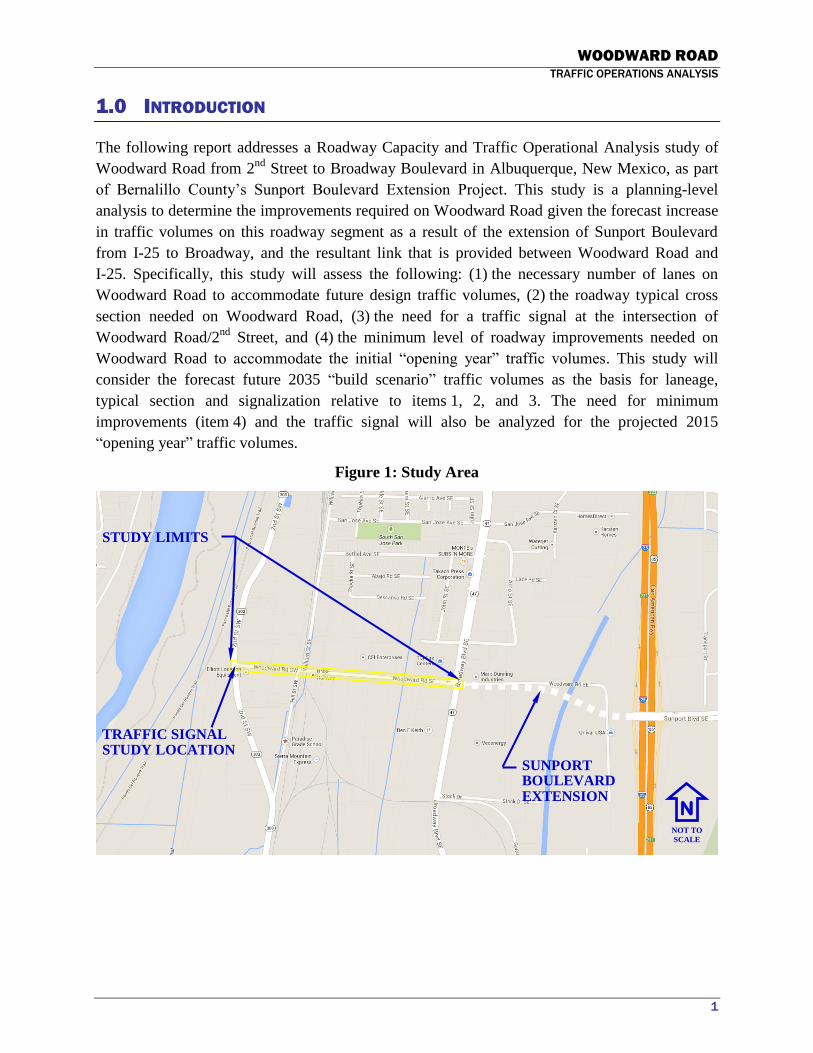
The following report addresses a Roadway Capacity and Traffic Operational Analysis study of
Woodward Road from 2nd
Street to Broadway Boulevard in Albuquerque, New Mexico, as part
of Bernalillo County‘s Sunport Boulevard Extension Project. This study is a planning-level
analysis to determine the improvements required on Woodward Road given the forecast increase
in traffic volumes on this roadway segment as a result of the extension of Sunport Boulevard
from I-25 to Broadway, and the resultant link that is provided between Woodward Road and
I-25. Specifically, this study will assess the following: (1) the necessary number of lanes on
Woodward Road to accommodate future design traffic volumes, (2) the roadway typical cross
section needed on Woodward Road, (3) the need for a traffic signal at the intersection of
Woodward Road/2nd
Street, and (4) the minimum level of roadway improvements needed on
Woodward Road to accommodate the initial ―opening year‖ traffic volumes. This study will
consider the forecast future 2035 ―build scenario‖ traffic volumes as the basis for laneage,
typical section and signalization relative to items 1, 2, and 3. The need for minimum
improvements (item 4) and the traffic signal will also be analyzed for the projected 2015
―opening year‖ traffic volumes.
Figure 1: Study Area
N NOT TO
SCALE
STUDY LIMITS
TRAFFIC SIGNAL STUDY LOCATION
SUNPORT BOULEVARD EXTENSION
WOODWARD ROAD
TRAFFIC OPERATIONS ANALYSIS
2
2.0 EXISTING CONDITIONS
The study segment of Woodward Road extends from the STOP controlled ―T‖-intersection at 2nd
Street approximately 0.6 mile east on a tangent alignment to the signalized intersection at
Broadway Boulevard. This segment lies entirely within the Albuquerque city limits. It currently
consists of two 12-foot lanes and variable width shoulders, which are generally paved as part of
the several adjacent business frontages. A 125-foot long raised median island exists on
Woodward Road at the Broadway Boulevard intersection. Otherwise there is no curb, gutter,
median, or storm drainage system on Woodward Road. The regulatory speed is posted at
30 miles per hour (mph) in the westbound direction just west of Broadway Boulevard. No
regulatory speed is currently posted on the eastbound direction. 2nd
Street is posted at 35 mph in
both directions. There is currently no street lighting on either street. Based on review of
Bernalillo County GIS and assessors data, the apparent right of way (ROW) width on Woodward
Road is 80 feet.
There is an at-grade mainline railroad crossing on Woodward Road located approximately
900 feet to the east of 2nd
Street. The four tracks at the crossing include one mainline track
operated by the New Mexico Rail Runner Express (NMRX), two siding tracks, and one
industrial spur track. There are currently 16 NMRX and two Amtrak train movements at this
crossing each day. BNSF also operates some freight trains on these tracks.
The existing (2012) Average Daily Traffic (ADT) volume on Woodward Road is 5,900 vehicles
per day (vpd) according to the MRCOG 2012 Traffic Flow Map for the Greater Albuquerque
Area. This same map shows that the existing traffic volumes on 2nd
Street are 4,600 vpd north of
Woodward Road and 8,000 vpd south of Woodward Road. The MRCOG Current Roadway
Functional Classification System for the Albuquerque Metropolitan Planning Area dated
March 25, 2010 classifies Woodward Road as an Urban Collector. 2nd
Street is classified as an
Urban Minor Arterial. (Refer to Appendix A for MRCOG‘s map of Current Roadway Functional
Classifications.)
There are no sidewalks or bicycle facilities on Woodward Road. Bernalillo County is currently
constructing a multi-use ped/bike trail connection just west of the intersection of Woodward
Road/2nd
Street. This trail is expected to be opened later this year (2014) and will provide a direct
connection between the north-south Paseo del Bosque Trail and Woodward Road.
3.0 FUTURE TRAFFIC VOLUMES
Projected future traffic volume information was provided by MRCOG (refer to Appendix B).
These data were obtained from MRCOG‘s 2035 Metropolitan Transportation Plan (MTP) travel
demand model. (Previous traffic analysis work done on the Sunport Boulevard Extension and
documented in the Alignment Study NMDOT Combined Phase A/B Report [URS, 2010] utilized
traffic forecasts for the design year of 2030, based on MRCOG‘s 2030 MTP travel demand
WOODWARD ROAD
TRAFFIC OPERATIONS ANALYSIS
3
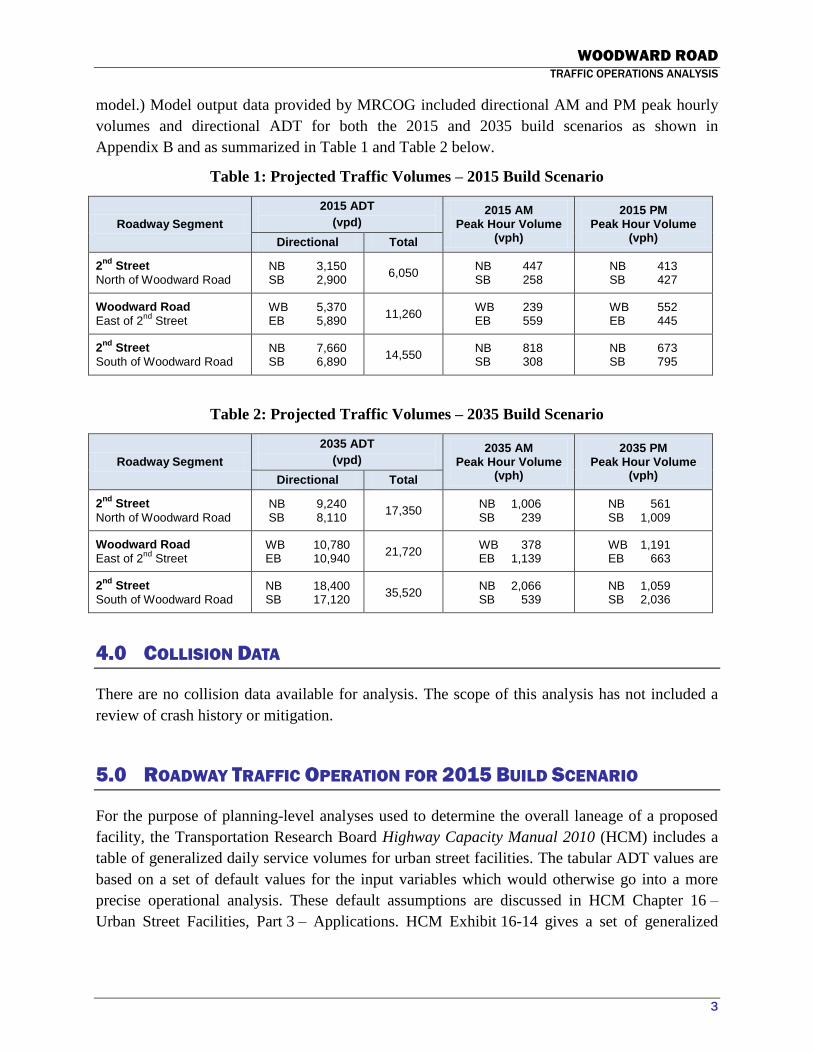
model.) Model output data provided by MRCOG included directional AM and PM peak hourly
volumes and directional ADT for both the 2015 and 2035 build scenarios as shown in
Appendix B and as summarized in Table 1 and Table 2 below.
Table 1: Projected Traffic Volumes – 2015 Build Scenario
Roadway Segment
2015 ADT
(vpd) 2015 AM
Peak Hour Volume (vph)
2015 PM Peak Hour Volume
(vph) Directional Total
2nd
Street
North of Woodward Road NB 3,150 SB 2,900
6,050 NB 447 SB 258
NB 413 SB 427
Woodward Road
East of 2nd
Street WB 5,370 EB 5,890
11,260 WB 239 EB 559
WB 552 EB 445
2nd
Street
South of Woodward Road NB 7,660 SB 6,890
14,550 NB 818 SB 308
NB 673 SB 795
Table 2: Projected Traffic Volumes – 2035 Build Scenario
Roadway Segment
2035 ADT
(vpd) 2035 AM
Peak Hour Volume (vph)
2035 PM Peak Hour Volume
(vph) Directional Total
2nd
Street
North of Woodward Road NB 9,240 SB 8,110
17,350 NB 1,006 SB 239
NB 561 SB 1,009
Woodward Road
East of 2nd
Street WB 10,780 EB 10,940
21,720 WB 378 EB 1,139
WB 1,191 EB 663
2nd
Street
South of Woodward Road NB 18,400 SB 17,120
35,520 NB 2,066 SB 539
NB 1,059 SB 2,036
4.0 COLLISION DATA
There are no collision data available for analysis. The scope of this analysis has not included a
review of crash history or mitigation.
5.0 ROADWAY TRAFFIC OPERATION FOR 2015 BUILD SCENARIO
For the purpose of planning-level analyses used to determine the overall laneage of a proposed
facility, the Transportation Research Board Highway Capacity Manual 2010 (HCM) includes a
table of generalized daily service volumes for urban street facilities. The tabular ADT values are
based on a set of default values for the input variables which would otherwise go into a more
precise operational analysis. These default assumptions are discussed in HCM Chapter 16 –
Urban Street Facilities, Part 3 – Applications. HCM Exhibit 16-14 gives a set of generalized
WOODWARD ROAD
TRAFFIC OPERATIONS ANALYSIS
4
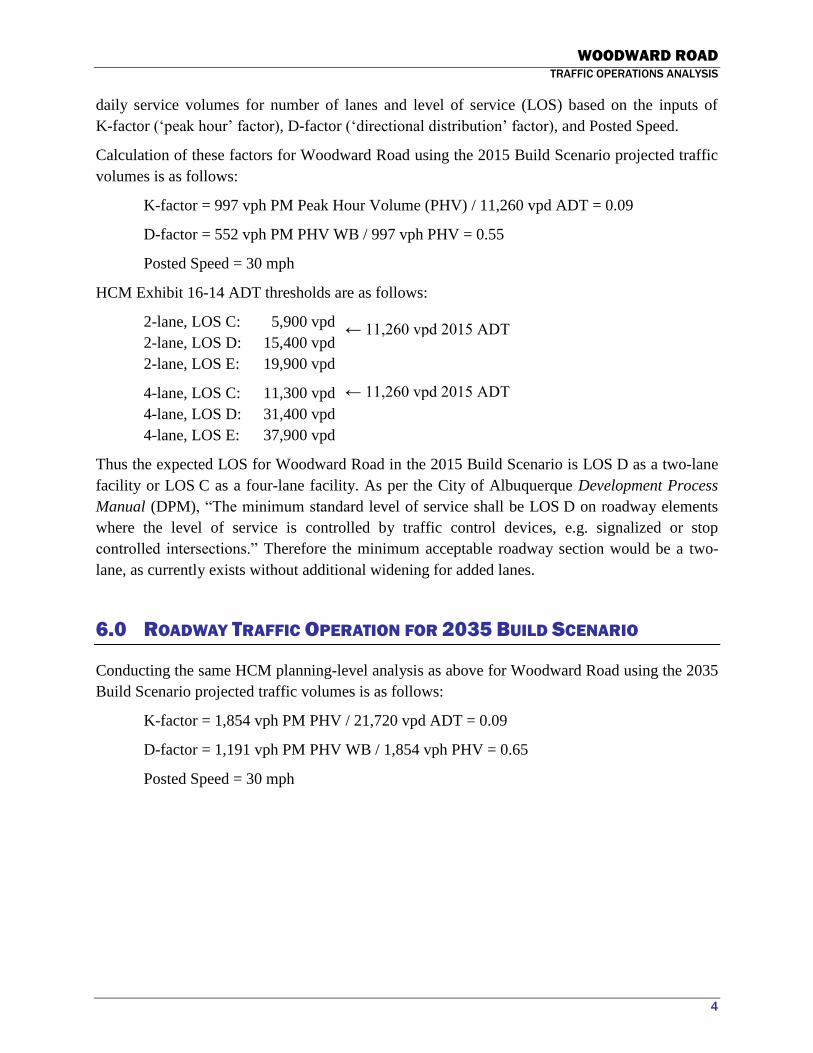
daily service volumes for number of lanes and level of service (LOS) based on the inputs of
K-factor (‗peak hour‘ factor), D-factor (‗directional distribution‘ factor), and Posted Speed.
Calculation of these factors for Woodward Road using the 2015 Build Scenario projected traffic
volumes is as follows:
K-factor = 997 vph PM Peak Hour Volume (PHV) / 11,260 vpd ADT = 0.09
D-factor = 552 vph PM PHV WB / 997 vph PHV = 0.55
Posted Speed = 30 mph
HCM Exhibit 16-14 ADT thresholds are as follows:
2-lane, LOS C: 5,900 vpd
2-lane, LOS D: 15,400 vpd
2-lane, LOS E: 19,900 vpd
4-lane, LOS C: 11,300 vpd
4-lane, LOS D: 31,400 vpd
4-lane, LOS E: 37,900 vpd
Thus the expected LOS for Woodward Road in the 2015 Build Scenario is LOS D as a two-lane
facility or LOS C as a four-lane facility. As per the City of Albuquerque Development Process
Manual (DPM), ―The minimum standard level of service shall be LOS D on roadway elements
where the level of service is controlled by traffic control devices, e.g. signalized or stop
controlled intersections.‖ Therefore the minimum acceptable roadway section would be a two-
lane, as currently exists without additional widening for added lanes.
6.0 ROADWAY TRAFFIC OPERATION FOR 2035 BUILD SCENARIO
Conducting the same HCM planning-level analysis as above for Woodward Road using the 2035
Build Scenario projected traffic volumes is as follows:
K-factor = 1,854 vph PM PHV / 21,720 vpd ADT = 0.09
D-factor = 1,191 vph PM PHV WB / 1,854 vph PHV = 0.65
Posted Speed = 30 mph
← 11,260 vpd 2015 ADT
← 11,260 vpd 2015 ADT
WOODWARD ROAD
TRAFFIC OPERATIONS ANALYSIS
5
HCM Exhibit 16-14 ADT thresholds are as follows:
2-lane, LOS C: 5,400 vpd
2-lane, LOS D: 14,100 vpd
2-lane, LOS E: 18,300 vpd
4-lane, LOS C: 10,300 vpd
4-lane, LOS D: 28,800 vpd
4-lane, LOS E: 34,800 vpd
Thus the expected LOS for Woodward Road in the 2035 Build Scenario is LOS F as a two-lane
facility or LOS D as a four-lane facility. Based on this forecast traffic volume and the
aforementioned DPM reference, roadway widening from the present two lanes to a four-lane
section is necessary to meet the minimum level of service requirement, a LOS D.
7.0 WOODWARD ROAD TYPICAL CROSS SECTION
Based on the above analysis, Woodward Road should be widened to a four-lane cross section to
meet traffic demand forecasts for 2035. The DPM defines the minimum requirements for the
roadway cross sectional elements. An excerpt from the DPM is included in Appendix C.
ROW Width: For a Collector roadway, the DPM requires 73 feet of ROW, or in cases where the
roadway in question is on the City‘s bikeway system, an additional width of 12 feet is required
for bike lanes in both directions. Since Woodward is included on the bikeway system, this would
result in a minimum ROW width of 85 feet. The existing ROW width has been estimated from
available mapping obtained from Bernalillo County. Although not definitive, the ROW width
appears to be approximately 80 to 82 feet. Since the purchase of sliver strips of ROW for
widening from 80 to 85 feet is not cost effective and is problematic relative to acquisition times
and project schedules, the existing and future ROW for Woodward Road will be assumed to
remain as 80 feet. The actual monumented and surveyed width would have to be verified as part
of the development of any future design project.
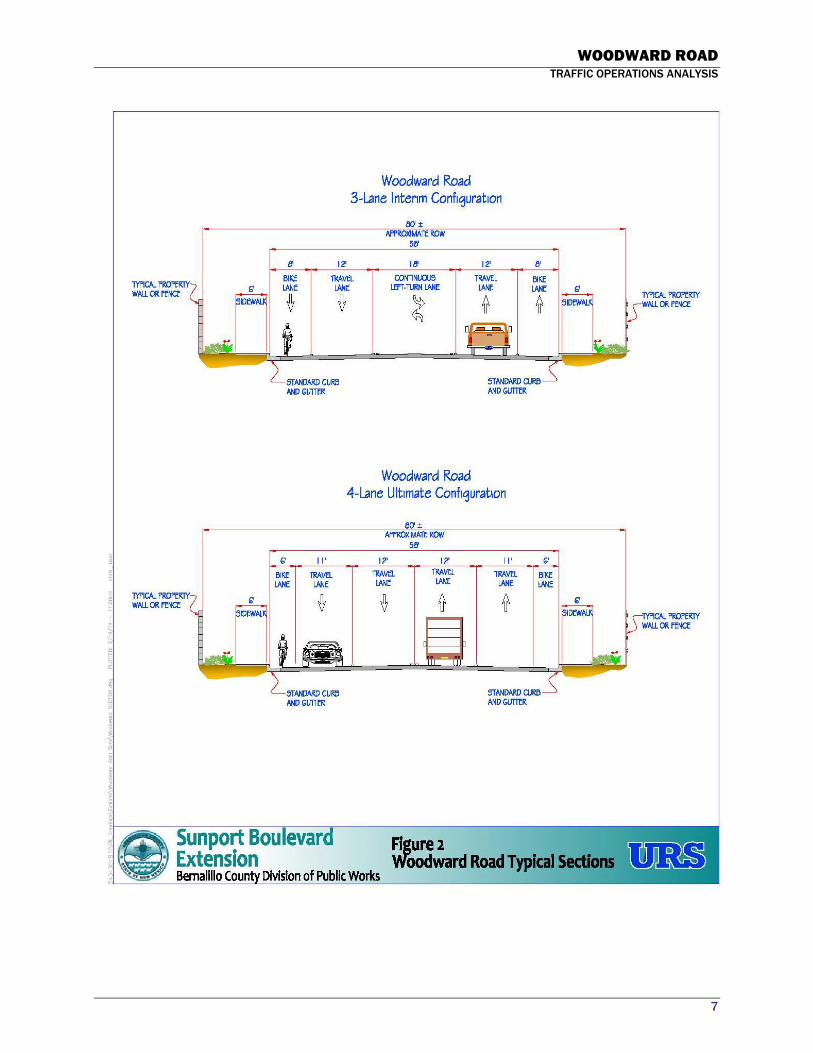
Bike Facility: For a Collector roadway, the DPM requires a 6-foot bike lane or 4-foot paved
shoulder bikeway (minimum). Six-foot bike lanes have been included in the conceptual layout
for the Woodward Road four-lane Ultimate Configuration typical section (refer to Figure 2).
Minimum Required Sidewalk: For a Collector roadway, the DPM requires a 6-foot sidewalk
with a 6-foot setback from back of curb. Six-foot sidewalks have been included in the conceptual
layout for Woodward Road; however, there is inadequate width within the existing 80-foot ROW
to provide for a 6-foot buffer. Since the construction of this new roadway section will also
require the adjustments (possible reconstruction) of walls and fences along the ROW line, and
some tapering of areas behind the sidewalk to blend with existing features and topography, the
sidewalk has been shown as adjacent to the roadway curb, buffered from the travel way only by
← 21,720 vpd 2035 ADT
← 21,720 vpd 2035 ADT
WOODWARD ROAD
TRAFFIC OPERATIONS ANALYSIS
6
the bike lane. If during future design surveys, the existing ROW proves to be wider than 80 feet,
a buffer may be considered.
Required Pavement Width: For a Collector roadway, the DPM requires 48 feet of pavement
width, flowline to flowline. With a four-lane section, two lanes at 11 feet and two lanes at
12 feet, the traveled way width would be 46 feet. With the additional pavement provided for the
bike lanes, the overall roadway width, flowline to flowline, included in the conceptual layout is
58 feet.
The conceptual Ultimate Configuration typical section shown in Figure 2 therefore meets the
general intent of the DPM, but diverges from it in minor ways considered as acceptable and
appropriate in the consideration that this is a reconstructed rather than new section, is located in a
developed area, and it avoids the need for additional ROW acquisition. Since traffic volumes at
the time of the Sunport Boulevard construction (refer to 2015 traffic volumes shown in Table 1)
do not yet warrant the ultimate four-lane section, an alternative three-lane Interim Configuration
has also been depicted for information. This three-lane section consists of an initial approach to
the pavement marking that would utilize the ultimate constructed widths for the four-lane
section. The three-lane section would have a continuous median left turn lane for local access,
and wider bike lanes, while being constructed to the same roadway width, 58 feet, as needed for
the Ultimate four-lane section.
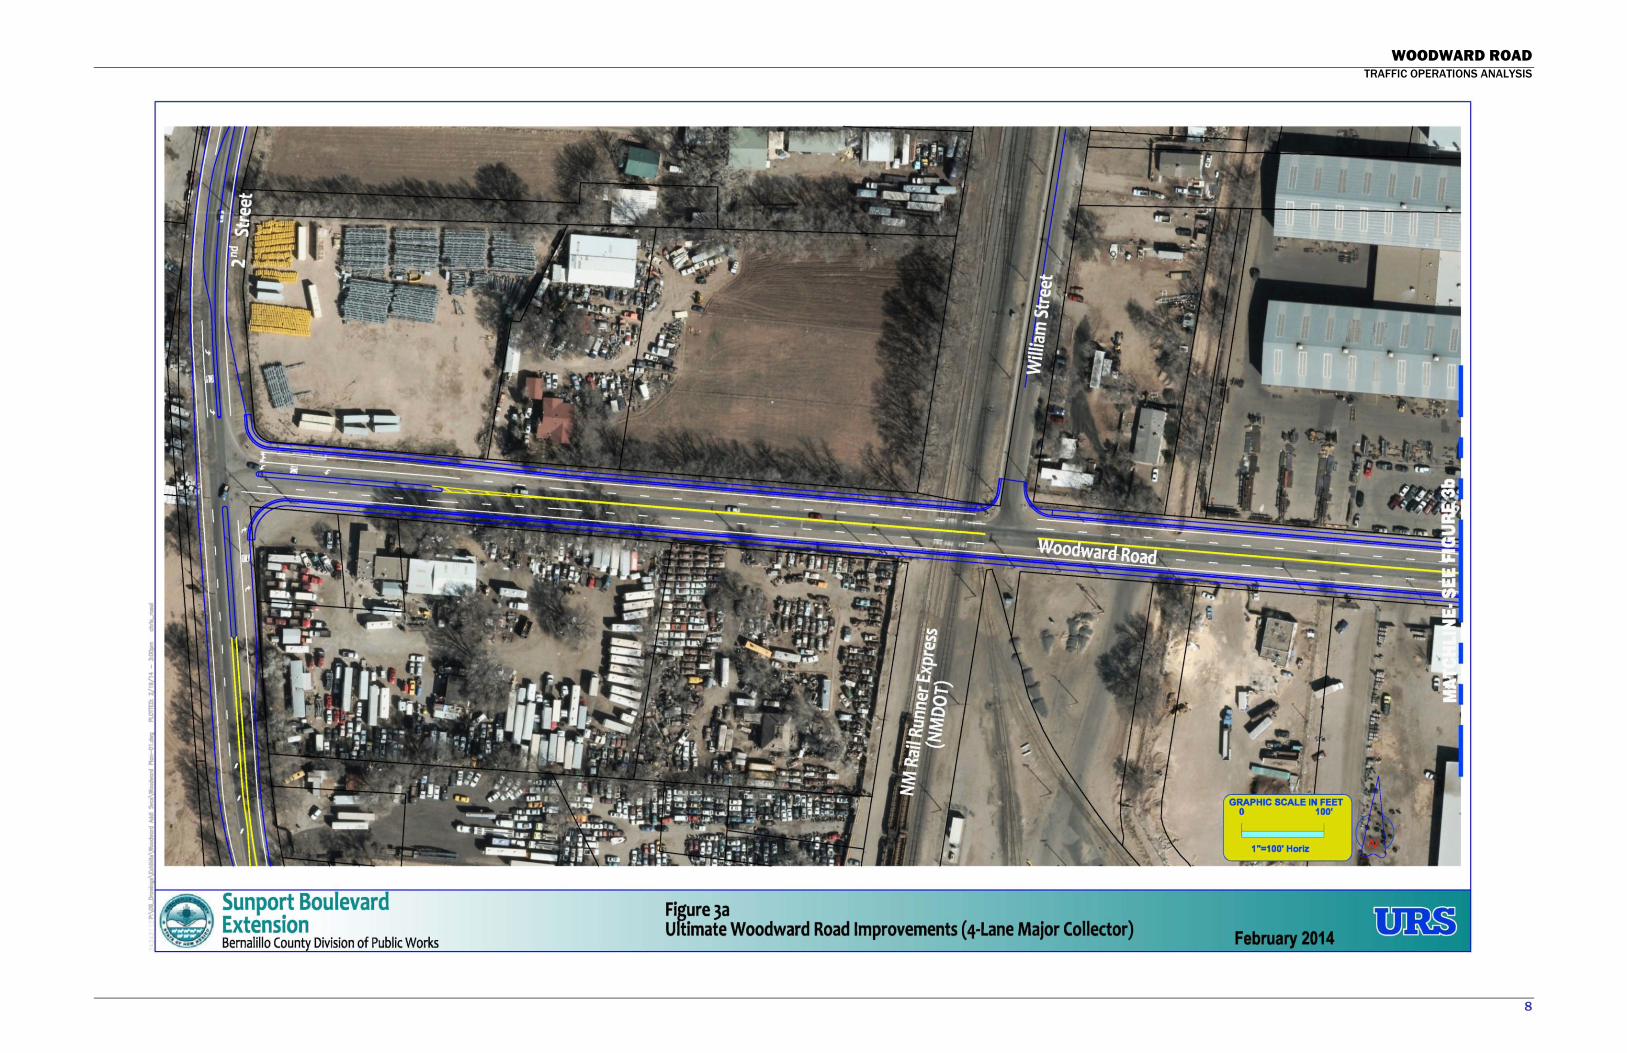
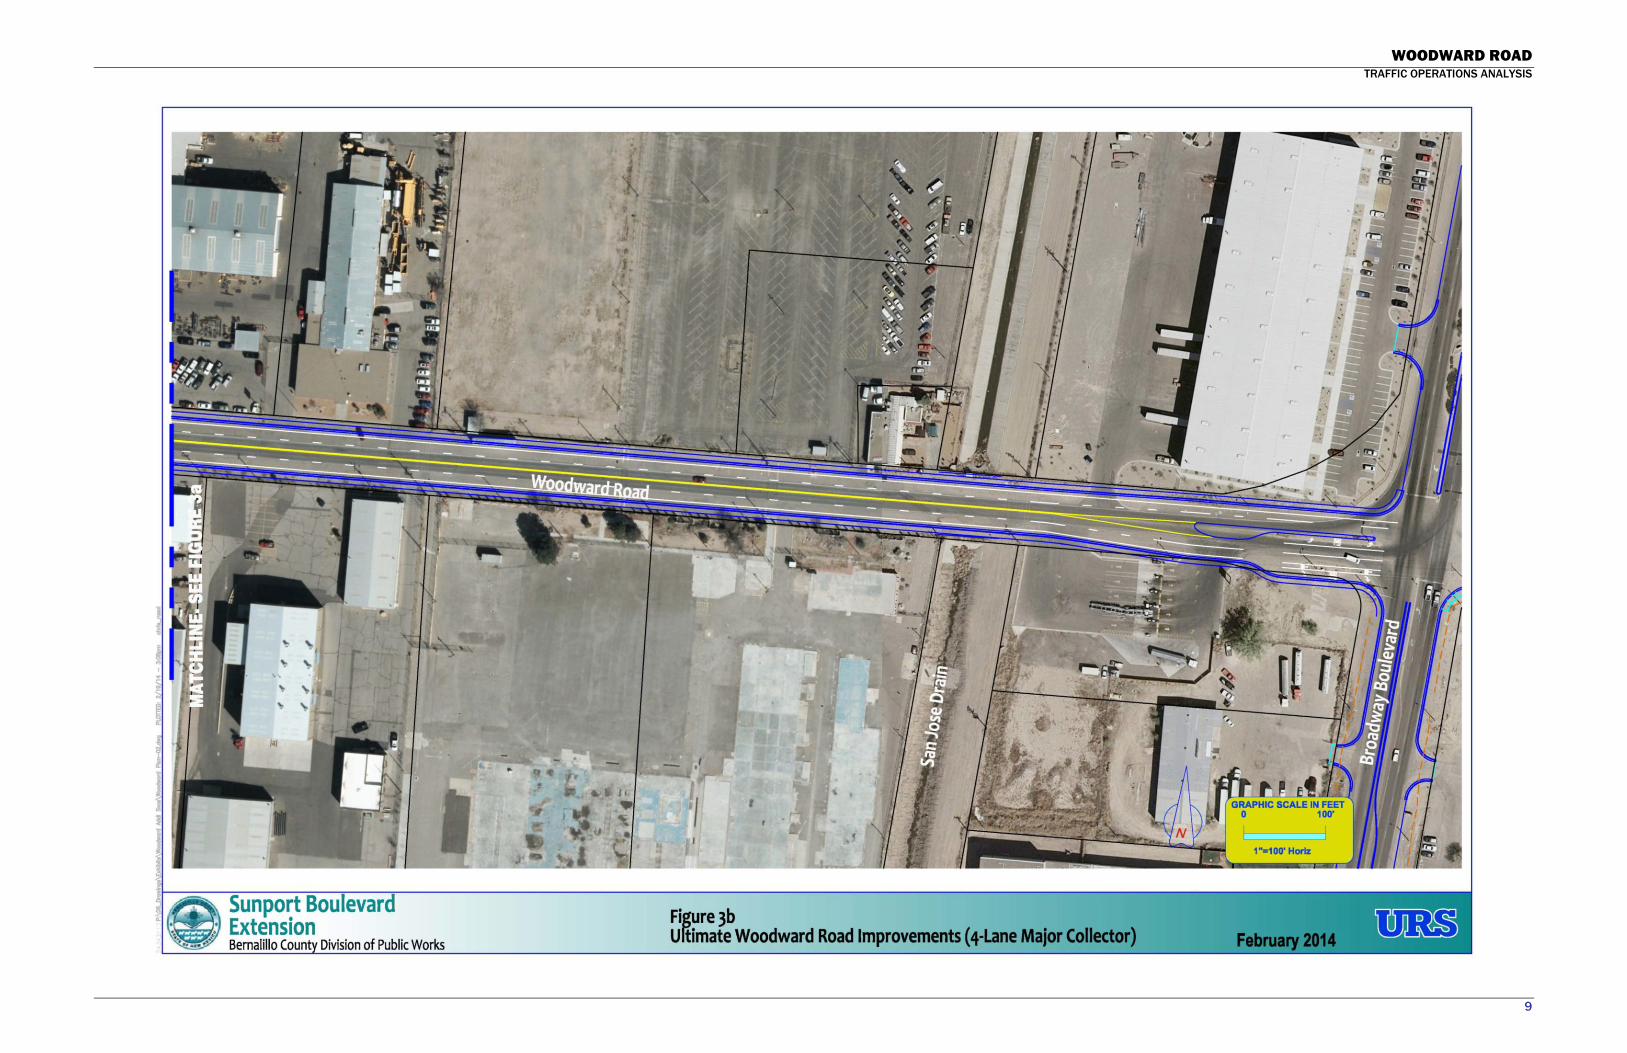
A plan view layout depicting the four-lane widening of Woodward Road is included in Figure 3.
A construction cost estimate of the four-lane widening of Woodward Road has been developed
and is included in Appendix D.
WOODWARD ROAD
TRAFFIC OPERATIONS ANALYSIS
7
Figure 2: Woodward Road Typical Sections
WOODWARD ROAD
TRAFFIC OPERATIONS ANALYSIS
8
Figure 3a: Ultimate Woodward Road Improvements (4-Lane Major Collector
WOODWARD ROAD
TRAFFIC OPERATIONS ANALYSIS
9
Figure 3b: Ultimate Woodward Road Improvements (4-Lane Major Collector)
WOODWARD ROAD
TRAFFIC OPERATIONS ANALYSIS
10
8.0 TRAFFIC SIGNAL WARRANT ANALYSIS — INTERSECTION OF
WOODWARD ROAD/2ND STREET
The 2009 Federal Highway Administration Manual on Uniform Traffic Control Devices
(MUTCD) defines nine Warrants for determining whether the installation of a traffic signal is
justified at a particular location. The first of these warrants, Warrant 1 – Eight Hour Vehicular
Volume, considers the highest eight traffic volume hours of an average day, based on counts of
existing vehicular traffic volume. However, for the Woodward Road / 2nd
Street intersection,
while the future ADTs and peak hour volumes have been forecast, the actual volume numbers
cannot be counted at this time since the present traffic volumes, before the opening of the
Sunport Boulevard Extension, are not expected to be close to the warrant threshold numbers.
Therefore, the hourly distribution of traffic volumes is unknown.
Neither the City of Albuquerque Development Process Manual nor the New Mexico State
Access Management Manual offer guidelines for assessing future-year traffic signal warrants
based on ADT projections. However, several other state departments of transportation (DOTs)
do have criteria for the purpose of assessing signal Warrant 1 based on projected future ADT.
The following Tables 3 and 4 compare the projected ADTs for the 2nd
Street / Woodward Road
intersection versus the criteria collected from several states.
The laneage assumed at the intersection includes both the existing two-lane section and the
future four-lane section on Woodward Road (defined as the minor street) as supported by the
analysis above. 2nd
Street (classified as the major street) is also assumed to be improved to two
lanes in each direction on each approach. This is consistent with the MRCOG 2035 MTP, which
includes widening of 2nd
Street south of Woodward Road from two to four lanes. The warrant
volumes in the following tables can also be viewed in the current condition, with the single
approach lanes as well.
WOODWARD ROAD
TRAFFIC OPERATIONS ANALYSIS
11
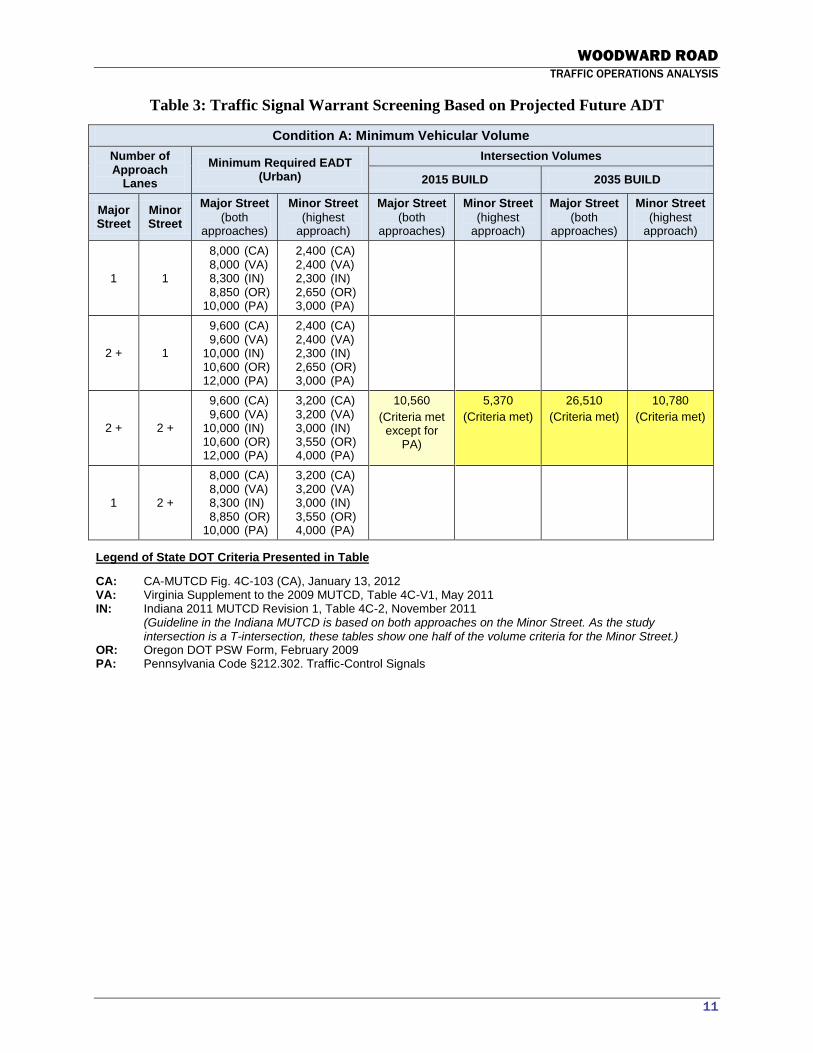
Table 3: Traffic Signal Warrant Screening Based on Projected Future ADT
Condition A: Minimum Vehicular Volume
Number of Approach
Lanes
Minimum Required EADT (Urban)
Intersection Volumes
2015 BUILD 2035 BUILD
Major Street
Minor Street
Major Street
(both approaches)
Minor Street
(highest approach)
Major Street
(both approaches)
Minor Street
(highest approach)
Major Street
(both approaches)
Minor Street
(highest approach)
1 1
8,000 (CA) 8,000 (VA) 8,300 (IN) 8,850 (OR) 10,000 (PA)
2,400 (CA) 2,400 (VA) 2,300 (IN) 2,650 (OR) 3,000 (PA)
2 + 1
9,600 (CA) 9,600 (VA) 10,000 (IN) 10,600 (OR) 12,000 (PA)
2,400 (CA) 2,400 (VA) 2,300 (IN) 2,650 (OR) 3,000 (PA)
2 + 2 +
9,600 (CA) 9,600 (VA) 10,000 (IN) 10,600 (OR) 12,000 (PA)
3,200 (CA) 3,200 (VA) 3,000 (IN) 3,550 (OR) 4,000 (PA)
10,560
(Criteria met except for
PA)
5,370
(Criteria met)
26,510
(Criteria met)
10,780
(Criteria met)
1 2 +
8,000 (CA) 8,000 (VA) 8,300 (IN) 8,850 (OR) 10,000 (PA)
3,200 (CA) 3,200 (VA) 3,000 (IN) 3,550 (OR) 4,000 (PA)
Legend of State DOT Criteria Presented in Table
CA: CA-MUTCD Fig. 4C-103 (CA), January 13, 2012 VA: Virginia Supplement to the 2009 MUTCD, Table 4C-V1, May 2011 IN: Indiana 2011 MUTCD Revision 1, Table 4C-2, November 2011
(Guideline in the Indiana MUTCD is based on both approaches on the Minor Street. As the study intersection is a T-intersection, these tables show one half of the volume criteria for the Minor Street.)
OR: Oregon DOT PSW Form, February 2009 PA: Pennsylvania Code §212.302. Traffic-Control Signals
WOODWARD ROAD
TRAFFIC OPERATIONS ANALYSIS
12
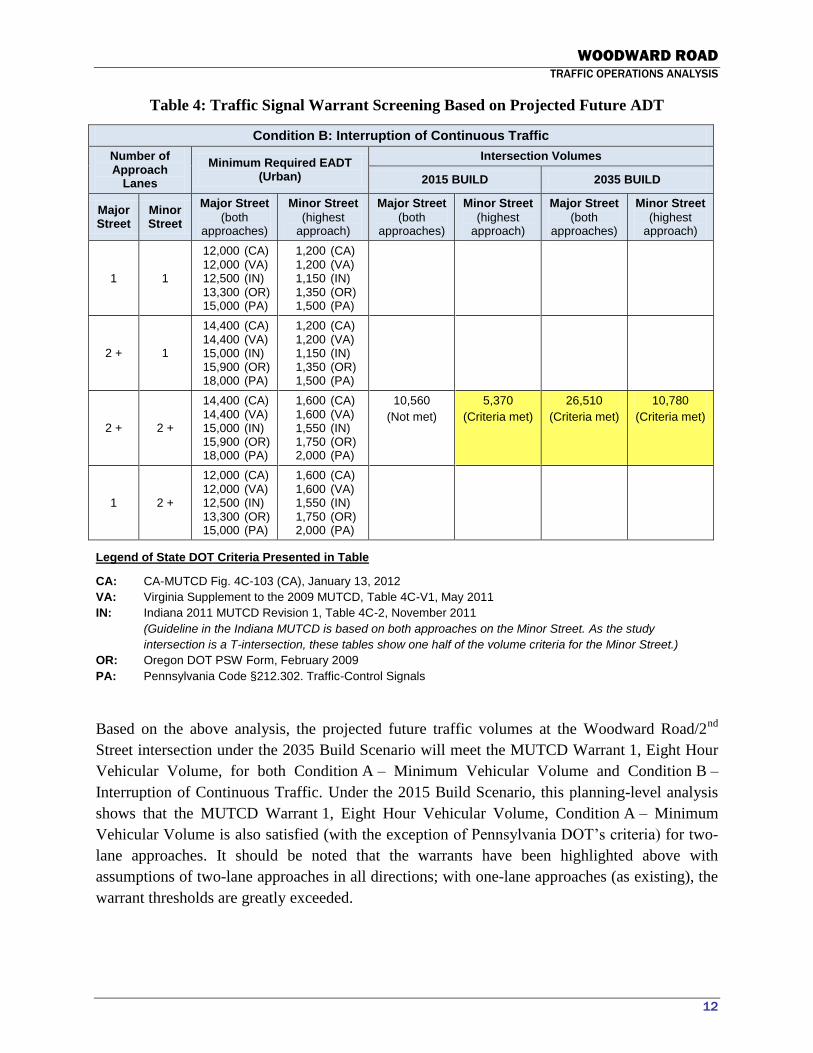
Table 4: Traffic Signal Warrant Screening Based on Projected Future ADT
Condition B: Interruption of Continuous Traffic
Number of Approach
Lanes
Minimum Required EADT (Urban)
Intersection Volumes
2015 BUILD 2035 BUILD
Major Street
Minor Street
Major Street
(both approaches)
Minor Street
(highest approach)
Major Street
(both approaches)
Minor Street
(highest approach)
Major Street
(both approaches)
Minor Street
(highest approach)
1 1
12,000 (CA) 12,000 (VA) 12,500 (IN) 13,300 (OR) 15,000 (PA)
1,200 (CA) 1,200 (VA) 1,150 (IN) 1,350 (OR) 1,500 (PA)
2 + 1
14,400 (CA) 14,400 (VA) 15,000 (IN) 15,900 (OR) 18,000 (PA)
1,200 (CA) 1,200 (VA) 1,150 (IN) 1,350 (OR) 1,500 (PA)
2 + 2 +
14,400 (CA) 14,400 (VA) 15,000 (IN) 15,900 (OR) 18,000 (PA)
1,600 (CA) 1,600 (VA) 1,550 (IN) 1,750 (OR) 2,000 (PA)
10,560
(Not met)
5,370
(Criteria met)
26,510
(Criteria met)
10,780
(Criteria met)
1 2 +
12,000 (CA) 12,000 (VA) 12,500 (IN) 13,300 (OR) 15,000 (PA)
1,600 (CA) 1,600 (VA) 1,550 (IN) 1,750 (OR) 2,000 (PA)
Legend of State DOT Criteria Presented in Table
CA: CA-MUTCD Fig. 4C-103 (CA), January 13, 2012
VA: Virginia Supplement to the 2009 MUTCD, Table 4C-V1, May 2011
IN: Indiana 2011 MUTCD Revision 1, Table 4C-2, November 2011
(Guideline in the Indiana MUTCD is based on both approaches on the Minor Street. As the study
intersection is a T-intersection, these tables show one half of the volume criteria for the Minor Street.)
OR: Oregon DOT PSW Form, February 2009
PA: Pennsylvania Code §212.302. Traffic-Control Signals
Based on the above analysis, the projected future traffic volumes at the Woodward Road/2nd
Street intersection under the 2035 Build Scenario will meet the MUTCD Warrant 1, Eight Hour
Vehicular Volume, for both Condition A – Minimum Vehicular Volume and Condition B –
Interruption of Continuous Traffic. Under the 2015 Build Scenario, this planning-level analysis
shows that the MUTCD Warrant 1, Eight Hour Vehicular Volume, Condition A – Minimum
Vehicular Volume is also satisfied (with the exception of Pennsylvania DOT‘s criteria) for two-
lane approaches. It should be noted that the warrants have been highlighted above with
assumptions of two-lane approaches in all directions; with one-lane approaches (as existing), the
warrant thresholds are greatly exceeded.
WOODWARD ROAD
TRAFFIC OPERATIONS ANALYSIS
13
9.0 INTERSECTION TRAFFIC OPERATION FOR 2015 BUILD SCENARIO/
MINIMUM ROADWAY IMPROVEMENTS
Traffic volumes using the intersection of Woodward Road/2nd
Street in the Build scenario in
2015 have been forecast by MRCOG and are shown in Table 1. Bernalillo County has requested
that the minimum required improvements to Woodward Road be identified in addition to the
ultimate improvements. In order to accommodate these forecast traffic volumes with an
acceptable level of service, i.e., at least a LOS D, the following minimum geometric
improvements are needed at the intersection, in addition to the traffic signal:
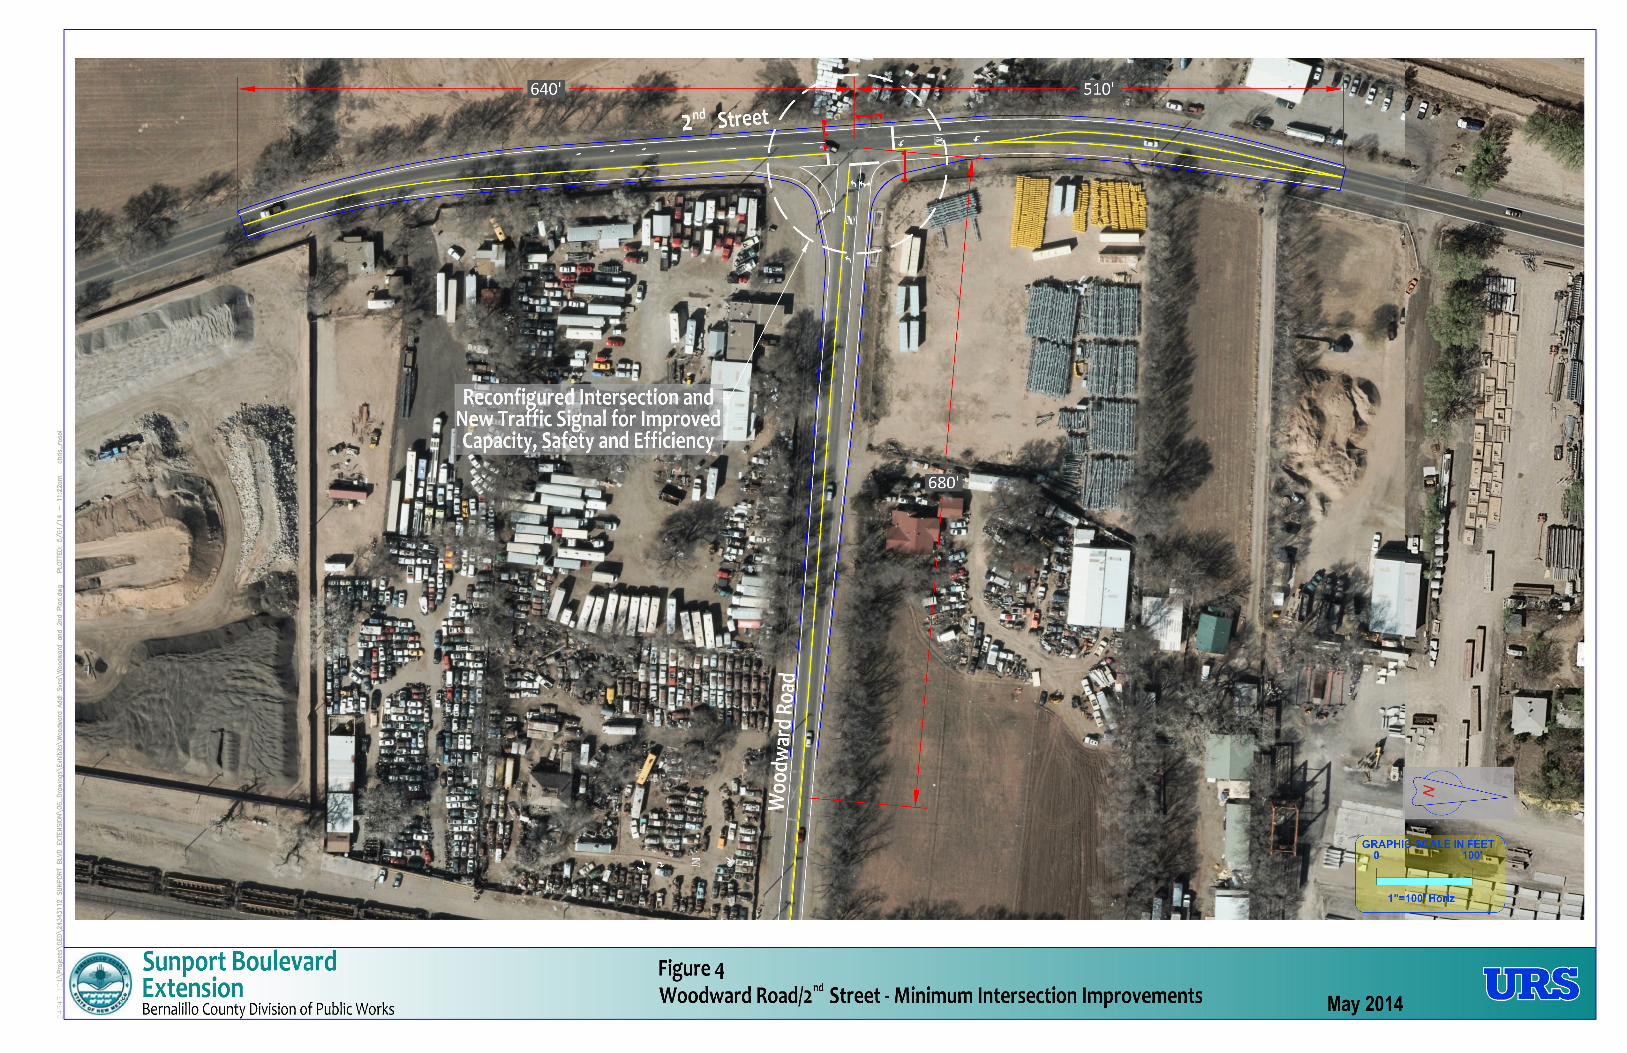
The current westbound approach lane on Woodward to this ―T‖ intersection will become a
dedicated left turn lane for westbound to southbound traffic. In the PM Peak, this movement
consists of the heaviest volume (452 vph) of any approach leg or direction.
Widening to the right or outside of the westbound approach lane will be necessary
approaching the ―T‖-intersection, to add a lane for either left or right turning, providing an
effective double left turn from westbound to southbound. (This configuration, widening to
the outside or north side of existing Woodward, will provide a more direct westbound to
southbound movement to accommodate the heaviest intersection movement.)
Widening of the southbound roadway departing the intersection on 2nd
Street for the addition
of another lane, in order to receive the two left turning lanes. This will enhance intersection
operation, but will require a southbound merge at the end of the dual southbound lanes.
With the widening of the southbound departing roadway described above, the north side leg
of the intersection, i.e. for the southbound approach, would also be widened in order to
accommodate the proper alignment of thru lanes across the intersection. With this widening,
a southbound to eastbound left turn lane can be developed, separating left turning traffic from
the thru traffic in the southbound direction.
With the above improvements, the overall intersection has been analyzed to operate at a LOS B.
Output from the Synchro 8 software analyses are included in Appendix E. (Refer to ‗2015 PM
Peak_Build Option 4 in Appendix E.) A review of the operation of each individual leg of the
intersection shows the worst leg being the westbound left turn, operating at LOS C. Other legs
operate at LOS A or LOS B. It should be noted that this level of operation is representative of a
two-phase traffic signal operation. In other words, the southbound left turn (88 vph in the PM
Peak Hour) would not be allocated a separate left turning phase. Left turning traffic would have
to turn when gaps are present in the northbound traffic. This situation is best observed over time
as traffic volumes develop and increase in the future. At some point in the future, an additional
southbound left turn phase would be warranted. With the introduction of this third phase, taking
time away from the other phases, the overall level of service will deteriorate to a LOS C (still
considered to be a good operating condtion). The geometric improvements described above are
illustrated on Figure 4.
WOODWARD ROAD
TRAFFIC OPERATIONS ANALYSIS
14
Prior to arriving at the above conclusions, other lesser alternatives were also analyzed for this
location. The introduction of a traffic signal alone was considered with the existing roadway
laneage remaining as is. With the heavy volume of westbound to southbound left turning traffic
(452 vph PM Peak), this movement is at capacity without geometric improvements. The overall
intersection operates at LOS D; however, the left turn movement operates at LOS E (volume /
capacity = 1.0). (Refer to ‗2015 PM Peak_Build Option 1‘ Synchro output in Appendix E for
analysis details.)
In addition, another alternative was also considered, that of adding a right turn lane for
westbound to northbound traffic, thus separating the left turning traffic and the right turning
traffic. Although this addition was found to improve the situation and the overall intersection
operates at LOS C, the westbound to southbound movement continues to operate at LOS E,
considered unacceptable since LOS D is the DPM‘s minimum design level. (Refer to ‗2015 PM
Peak_Build Option 2‘ Synchro output in Appendix E for analysis details.)
Another scenario for the operation of the Woodward / 2nd
Street Intersection was also modeled
with 2015 traffic volumes. The scenario, labeled as ‗2015 PM Peak_Build Option 3‘, consists of
the same general layout as described above as the Option 4 scenario, but without developing the
southbound to eastbound separate left turn lane. In this scenario, left turning traffic remains
mixed with the thru traffic. An overall LOS B is achieved, with all approach movements at LOS
B or C, therefore the southbound left turn lane could be considered as optional or unnecessary,
however, as stated above, the widening of the median area is required regardless, for the
alignment of the thru lanes.
For comparison purposes, a scenario labeled as ‗2015 PM Peak_Build_Option 4 with SB Left
Turn Phase‘ has also been modeled, to test the operation of the recommended concept with the
addition of the third signal phase. With this added phase, the overall intersection level of service
drops from B to C. This is also a good operating condition, and this phasing could be considered
for initial implementation.
A construction cost estimate of these improvements, i.e., the minimum geometric improvements,
has been developed and is included in Appendix D, along with the construction cost estimate for
the Ultimate four-lane configuration the right or outside westbound approach lane on Woodward.
WOODWARD ROAD
TRAFFIC OPERATIONS ANALYSIS
16
10.0 INTERSECTION TRAFFIC OPERATION FOR 2035 BUILD AND NO BUILD
SCENARIOS (SUNPORT/BROADWAY/WOODWARD)
Intersection traffic operations have also been modeled using Synchro software for the
intersection of Sunport Boulevard / Broadway Boulevard / Woodward Road for purposes of air
quality ―hot spot‖ analysis. For this air quality impact assessment being developed by others,
both the Build and No Build scenarios, with future forecast 2035 traffic volumes, have been
modeled. The Build scenario represents the future intersection as carrying two through lanes in
each direction (each intersecting roadway being a four-lane roadway), and double left turn lanes
in the westbound to southbound, northbound to westbound, and southbound to eastbound
directions. The No Build scenario represents the continuation of existing geometric configuration
of the intersection, with future 2035 traffic on the existing laneage.
The overall intersection level of service with 2035 forecast traffic volumes and the No Build
configuration (as currently exists) is LOS D. Within this overall operation, there are some
failing movements however. The eastbound thru lane operates at a LOS F, the northbound to
westbound left turn lane also operates at a LOS F, while the southbound thru lane on Broadway
operates at a LOS E.
In the future Build configuration with 2035 forecast traffic volumes, the intersection operates at a
LOS D overall. Within this overall operation, there remain some less than desired movements
operating at LOS E. A key assumption in this analysis has included 11% trucks with the mix of
traffic. This high percentage trucks does have a significant impact on operation, since a default
value of 2% trucks was also investigated, resulting in no movement being less than LOS D. A
general update to design traffic volumes, including obtaining existing vehicle counts, should be
considered during the final design of this intersection, with consideration for traffic type and
classification, intersection geometry, and signal timing and progression. Results of this modeling
are shown in Appendix F.
11.0 RECOMMENDATIONS
Based on the results of this Traffic Operational Analysis, MRCOG‘s future traffic volume
forecasts, field observations, and engineering judgment, the following improvements for
Woodward Road are recommended:
1. In order to address the immediate impact of traffic volume increase that is forecast in the
theoretical ―opening year‖ (2015) of the Sunport Boulevard Extension, certain minimum
improvements are required to facilitate acceptable levels of service. Although the existing
two-lane roadway is adequate to accommodate the forecast volumes for 2015, the
intersection of Woodward Road/2nd
Street is inadequate. Improvements to the
intersection are necessary. These improvements would consist of signalization and
widening of the westbound approach and the southbound exit (and southbound entrance)
from the intersection as described previously.
WOODWARD ROAD
TRAFFIC OPERATIONS ANALYSIS
17
2. As the 2035 projected future volumes will clearly warrant a traffic signal at the
intersection of Woodward Road/2nd
Street, but the satisfaction of MUTCD warrants are
probable but should be confirmed for the 2015 opening year, design should proceed for a
traffic signal at this location. The intersection improvements constructed should include
the infrastructure for the traffic signal (conduits and foundations, poles and mastarms).
Once the Sunport Boulevard extension is opened to traffic, new traffic counts at
Woodward Road and 2nd
Street should be collected to determine if and when the
MUTCD traffic signal warrants are satisfied and the signal should be activated and put
into operation. The traffic counts for the detailed warrant analysis should include trucks,
bicycles, and pedestrians. Signal phasing can also be determined, with regard to the
benefits of including the third phase for the southbound to eastbound movement.
3. When funding for longer term improvements to address 20-year design volumes becomes
available, design and construction of Woodward Road from 2nd
Street to Broadway
should proceed in order to implement the ultimate four-lane roadway section that would
provide at least LOS D in the 2035 design year.