Embed Size (px)
Citation preview

Wool and Related Animal Hair
USITC Publication 3145December 1998
OFFICE OF INDUSTRIESU.S. International Trade CommissionWashington, DC 20436

UNITED STATES INTERNATIONAL TRADE COMMISSION
This report was prepared principally by
Rose Steller
Animal and Forest Products BranchAgriculture and Forest Products Division
Director of IndustriesVern Simpson
Director of OperationsRobert A. Rogowsky
COMMISSIONERS
Address all communications toSecretary to the Commission
United States International Trade CommissionWashington, DC 20436
Marcia E. Miller, Vice Chairman
Lynn M. Bragg, Chairman
Carol T. CrawfordJennifer A. Hillman
Stephen KoplanThelma J. Askey

The information and analysis provided in this report are for the purposes of this report only. 1
Nothing in this report should be construed to indicate how the Commission would find in aninvestigation conducted under statutory authority covering the same or similar subject matter.
i
PREFACE
In 1991 the United States International Trade Commission initiated its current Industry andTrade Summary series of informational reports on the thousands of products imported into andexported from the United States. Each summary addresses a different commodity/ industry areaand contains information on product uses, U.S. and foreign producers, and customs treatment.Also included is an analysis of the basic factors affecting trends in consumption, production,and trade of the commodity, as well as those bearing on the competitiveness of U.S. industriesin domestic and foreign markets.1
This report on wool and related animal hair covers the period 1993-97. Listed below are theindividual summary reports published to date on the agriculture and forest product sectors.
USITCpublication Publicationnumber date Title
2459 November 1991 . . . . . . . . . . . . Live Sheep and Meat of Sheep2462 November 1991 . . . . . . . . . . . . Cigarettes2477 January 1992 . . . . . . . . . . . . . . Dairy Produce2478 January 1992 . . . . . . . . . . . . . . Oilseeds2511 March 1992 . . . . . . . . . . . . . . . Live Swine and Fresh, Chilled, or Frozen
Pork2520 June 1992 . . . . . . . . . . . . . . . . . Poultry2544 August 1992 . . . . . . . . . . . . . . . Fresh or Frozen Fish2545 November 1992 . . . . . . . . . . . . Natural Sweeteners2551 November 1992 . . . . . . . . . . . . Newsprint2612 March 1993 . . . . . . . . . . . . . . . Wood Pulp and Waste Paper2615 March 1993 . . . . . . . . . . . . . . . Citrus Fruit2625 April 1993 . . . . . . . . . . . . . . . . Live Cattle and Fresh, Chilled, or Frozen
Beef and Veal2631 May 1993 . . . . . . . . . . . . . . . . . Animal and Vegetable Fats and Oils2635 June 1993 . . . . . . . . . . . . . . . . . Cocoa, Chocolate, and Confectionery2636 May 1993 . . . . . . . . . . . . . . . . . Olives2639 June 1993 . . . . . . . . . . . . . . . . . Wine and Certain Fermented Beverages2693 October 1993 . . . . . . . . . . . . . . Printing and Writing Paper2702 November 1993 . . . . . . . . . . . . Fur Goods2726 January 1994 . . . . . . . . . . . . . . Furskins2737 March 1994 . . . . . . . . . . . . . . . Cut Flowers2749 March 1994 . . . . . . . . . . . . . . . Paper Boxes and Bags2762 April 1994 . . . . . . . . . . . . . . . . Coffee and Tea2859 May 1995 . . . . . . . . . . . . . . . . . Seeds

ii
PREFACE—Continued
USITCpublication Publicationnumber date Title
2865 April 1995 . . . . . . . . . . . . . . . . Malt Beverages2875 May 1995 . . . . . . . . . . . . . . . . . Certain Fresh Deciduous Fruits2898 June 1995 . . . . . . . . . . . . . . . . . Certain Miscellaneous Vegetable
Substances and Products2917 October 1995 . . . . . . . . . . . . . . Lumber, Flooring, and Siding2918 August 1995 . . . . . . . . . . . . . . . Printed Matter2928 November 1995 . . . . . . . . . . . . Processed Vegetables3015 February 1997 . . . . . . . . . . . . . Hides, Skins, and Leather3020 March 1997 . . . . . . . . . . . . . . . Nonalcoholic Beverages3022 April 1997 . . . . . . . . . . . . . . . . Industrial Papers and Paperboards3080 January 1998 . . . . . . . . . . . . . . Dairy Products3083 February 1998 . . . . . . . . . . . . . Canned Fish, Except Shellfish3095 March 1998 . . . . . . . . . . . . . . . Milled Grains, Malts, and Starches3096 April 1998 . . . . . . . . . . . . . . . . Millwork3148 December 1998 . . . . . . . . . . . . . Poultry
iii
CONTENTS
Page
Preface . . . . . . . . . . . . . . . . . . . . . . . . . . . . . . . . . . . . . . . . . . . . . . . . . . . . . . . . . . . . . . . . . . . . . i
Abbreviations and acronyms . . . . . . . . . . . . . . . . . . . . . . . . . . . . . . . . . . . . . . vi
Abstract . . . . . . . . . . . . . . . . . . . . . . . . . . . . . . . . . . . . . . . . . . . . . . . . . . . . . . . . . . . . . . . . . . . 1
Introduction . . . . . . . . . . . . . . . . . . . . . . . . . . . . . . . . . . . . . . . . . . . . . . . . . . . . . . . . . . . . . . 3
Wool . . . . . . . . . . . . . . . . . . . . . . . . . . . . . . . . . . . . . . . . . . . . . . . . . . . . . . . . . . . . . . . . . . . . . 3Mohair . . . . . . . . . . . . . . . . . . . . . . . . . . . . . . . . . . . . . . . . . . . . . . . . . . . . . . . . . . . . . . . . . . . 6Cashmere . . . . . . . . . . . . . . . . . . . . . . . . . . . . . . . . . . . . . . . . . . . . . . . . . . . . . . . . . . . . . . . . . 7
U.S. industry profile . . . . . . . . . . . . . . . . . . . . . . . . . . . . . . . . . . . . . . . . . . . . . . . . . . 7
Number of firms and geographic distribution . . . . . . . . . . . . . . . . . . . . . . . . . . . . . . . . . . . . . 7Wool . . . . . . . . . . . . . . . . . . . . . . . . . . . . . . . . . . . . . . . . . . . . . . . . . . . . . . . . . . . . . . . . . 7Mohair . . . . . . . . . . . . . . . . . . . . . . . . . . . . . . . . . . . . . . . . . . . . . . . . . . . . . . . . . . . . . . . . 9
Special considerations . . . . . . . . . . . . . . . . . . . . . . . . . . . . . . . . . . . . . . . . . . . . . . . . . . . . . . . 9Wool . . . . . . . . . . . . . . . . . . . . . . . . . . . . . . . . . . . . . . . . . . . . . . . . . . . . . . . . . . . . . . . . . 9Mohair . . . . . . . . . . . . . . . . . . . . . . . . . . . . . . . . . . . . . . . . . . . . . . . . . . . . . . . . . . . . . . . . 10
Marketing methods . . . . . . . . . . . . . . . . . . . . . . . . . . . . . . . . . . . . . . . . . . . . . . . . . . . . . . . . . 11Wool . . . . . . . . . . . . . . . . . . . . . . . . . . . . . . . . . . . . . . . . . . . . . . . . . . . . . . . . . . . . . . . . . 11Mohair . . . . . . . . . . . . . . . . . . . . . . . . . . . . . . . . . . . . . . . . . . . . . . . . . . . . . . . . . . . . . . . . 11
Prices . . . . . . . . . . . . . . . . . . . . . . . . . . . . . . . . . . . . . . . . . . . . . . . . . . . . . . . . . . . . . . . . . . . . 12U.S. Government programs . . . . . . . . . . . . . . . . . . . . . . . . . . . . . . . . . . . . . . . . . . . . . . . . . . . 13
U.S. market . . . . . . . . . . . . . . . . . . . . . . . . . . . . . . . . . . . . . . . . . . . . . . . . . . . . . . . . . . . . . . . 14
Consumption . . . . . . . . . . . . . . . . . . . . . . . . . . . . . . . . . . . . . . . . . . . . . . . . . . . . . . . . . . . . . . 14Production . . . . . . . . . . . . . . . . . . . . . . . . . . . . . . . . . . . . . . . . . . . . . . . . . . . . . . . . . . . . . . . . 15
Wool . . . . . . . . . . . . . . . . . . . . . . . . . . . . . . . . . . . . . . . . . . . . . . . . . . . . . . . . . . . . . . . . . 15Mohair . . . . . . . . . . . . . . . . . . . . . . . . . . . . . . . . . . . . . . . . . . . . . . . . . . . . . . . . . . . . . . . . 16
iv
CONTENTS—Continued
Page
U.S. trade . . . . . . . . . . . . . . . . . . . . . . . . . . . . . . . . . . . . . . . . . . . . . . . . . . . . . . . . . . . . . . . . . 16
Overview . . . . . . . . . . . . . . . . . . . . . . . . . . . . . . . . . . . . . . . . . . . . . . . . . . . . . . . . . . . . . . . . . 16U.S. imports . . . . . . . . . . . . . . . . . . . . . . . . . . . . . . . . . . . . . . . . . . . . . . . . . . . . . . . . . . . . . . . 17
Wool . . . . . . . . . . . . . . . . . . . . . . . . . . . . . . . . . . . . . . . . . . . . . . . . . . . . . . . . . . . . . . . . . 17Products imported . . . . . . . . . . . . . . . . . . . . . . . . . . . . . . . . . . . . . . . . . . . . . . . . . . . . 17Levels and trends . . . . . . . . . . . . . . . . . . . . . . . . . . . . . . . . . . . . . . . . . . . . . . . . . . . . 17Principal suppliers . . . . . . . . . . . . . . . . . . . . . . . . . . . . . . . . . . . . . . . . . . . . . . . . . . . 18
Related animal hair . . . . . . . . . . . . . . . . . . . . . . . . . . . . . . . . . . . . . . . . . . . . . . . . . . . . . . 18Mohair . . . . . . . . . . . . . . . . . . . . . . . . . . . . . . . . . . . . . . . . . . . . . . . . . . . . . . . . . . . . . . . . 18U.S. trade measures . . . . . . . . . . . . . . . . . . . . . . . . . . . . . . . . . . . . . . . . . . . . . . . . . . . . . . 18
Tariff measures . . . . . . . . . . . . . . . . . . . . . . . . . . . . . . . . . . . . . . . . . . . . . . . . . . . . . 18Nontariff measures . . . . . . . . . . . . . . . . . . . . . . . . . . . . . . . . . . . . . . . . . . . . . . . . . . . 19U.S. Government trade-related investigations . . . . . . . . . . . . . . . . . . . . . . . . . . . . . . 19
U.S. exports . . . . . . . . . . . . . . . . . . . . . . . . . . . . . . . . . . . . . . . . . . . . . . . . . . . . . . . . . . . . . . . 20Export levels and trends . . . . . . . . . . . . . . . . . . . . . . . . . . . . . . . . . . . . . . . . . . . . . . . . . . 20
Wool . . . . . . . . . . . . . . . . . . . . . . . . . . . . . . . . . . . . . . . . . . . . . . . . . . . . . . . . . . . . . . 20 Mohair . . . . . . . . . . . . . . . . . . . . . . . . . . . . . . . . . . . . . . . . . . . . . . . . . . . . . . . . . . . . 21 Related animal hair . . . . . . . . . . . . . . . . . . . . . . . . . . . . . . . . . . . . . . . . . . . . . . . . . . . 21
Foreign trade measures . . . . . . . . . . . . . . . . . . . . . . . . . . . . . . . . . . . . . . . . . . . . . . . . . . . 21 Tariff measures . . . . . . . . . . . . . . . . . . . . . . . . . . . . . . . . . . . . . . . . . . . . . . . . . . . . . . 21 Nontariff measures . . . . . . . . . . . . . . . . . . . . . . . . . . . . . . . . . . . . . . . . . . . . . . . . . . . 21
Foreign industry profile . . . . . . . . . . . . . . . . . . . . . . . . . . . . . . . . . . . . . . . . . . . . . 22
Australia . . . . . . . . . . . . . . . . . . . . . . . . . . . . . . . . . . . . . . . . . . . . . . . . . . . . . . . . . . . . . . . . . . 23Prices . . . . . . . . . . . . . . . . . . . . . . . . . . . . . . . . . . . . . . . . . . . . . . . . . . . . . . . . . . . . . . . . . 24Marketing . . . . . . . . . . . . . . . . . . . . . . . . . . . . . . . . . . . . . . . . . . . . . . . . . . . . . . . . . . . . . 25
New Zealand . . . . . . . . . . . . . . . . . . . . . . . . . . . . . . . . . . . . . . . . . . . . . . . . . . . . . . . . . . . . . . . 26China . . . . . . . . . . . . . . . . . . . . . . . . . . . . . . . . . . . . . . . . . . . . . . . . . . . . . . . . . . . . . . . . . . . . 27Commonwealth of Independent States . . . . . . . . . . . . . . . . . . . . . . . . . . . . . . . . . . . . . . . . . . 28Uruguay . . . . . . . . . . . . . . . . . . . . . . . . . . . . . . . . . . . . . . . . . . . . . . . . . . . . . . . . . . . . . . . . . . 29Argentina . . . . . . . . . . . . . . . . . . . . . . . . . . . . . . . . . . . . . . . . . . . . . . . . . . . . . . . . . . . . . . . . . 29South Africa . . . . . . . . . . . . . . . . . . . . . . . . . . . . . . . . . . . . . . . . . . . . . . . . . . . . . . . . . . . . . . . 30

v
CONTENTS—Continued
Page
Appendix
A. Statistical tables . . . . . . . . . . . . . . . . . . . . . . . . . . . . . . . . . . . . . . . . . . . . . . . . . . . . . . . . . . . . A-1B. United States Standards for Grades of Wool . . . . . . . . . . . . . . . . . . . . . . . . . . . . . . . . . . . . . . B-1C. Explanation of tariff and trade agreement terms . . . . . . . . . . . . . . . . . . . . . . . . . . . . . . . . . . . C-1D. U.S. base rate and bound rate of duty . . . . . . . . . . . . . . . . . . . . . . . . . . . . . . . . . . . . . . . . . . . D-1
Figures
1. Wool: Structure of the U.S. industry . . . . . . . . . . . . . . . . . . . . . . . . . . . . . . . . . . . . . . . . . . . . 82. Wool: U.S. production, imports, and apparent consumption, 1993-97 . . . . . . . . . . . . . . . . . 15
Tables
A-1. Wool grades based on the American blood count, English spinning count,and the micron system; and breeds of sheep that produce these grades . . . . . . . . . . . . . . . A-2
A-2. Wool: Value of shorn wool grown, U.S. Federal Government payments, and average price received by producer, 1993-97 . . . . . . . . . . . . . . . . . . . . . . . . . . . . . . . . A-2
A-3. Mohair: Value of mohair grown, U.S. Federal Government payments, and average price received by producer, 1993-97 . . . . . . . . . . . . . . . . . . . . . . . . . . . . . . . . . . . A-2
A-4. Wool: U.S. beginning stocks, production, imports, supply, consumption,exports, total use, and ending stocks, 1993-97 . . . . . . . . . . . . . . . . . . . . . . . . . . . . . . . . . . A-3
A-5. U.S. Angora goat inventory and mohair production, 1993-97 . . . . . . . . . . . . . . . . . . . . . . . . . A-3A-6. Wool and related animal hair: U.S. exports of domestic merchandise,
imports for consumption, and merchandise trade balance, by selectedcountries, and country groups, 1993-97 . . . . . . . . . . . . . . . . . . . . . . . . . . . . . . . . . . . . . . . . A-4
A-7. Wool and related animal hair: U.S. imports by type, 1993-97 . . . . . . . . . . . . . . . . . . . . . . . . . A-5A-8. Wool: U.S. imports by principal suppliers, 1993-97 . . . . . . . . . . . . . . . . . . . . . . . . . . . . . . . . A-5A-9. Wool: U.S. imports, dutiable and duty-free, 1993-97 . . . . . . . . . . . . . . . . . . . . . . . . . . . . . . . A-6A-10. Wool and related animal hair: Harmonized Tariff Schedule subheading;
description; U.S. col. 1 and special rates of duty as of Jan. 1, 1998; U.S.exports, 1997; and U.S. imports, 1997 . . . . . . . . . . . . . . . . . . . . . . . . . . . . . . . . . . . . . . . . A-7
A-11. Wool and related animal hair: U.S. exports by type, 1993-97 . . . . . . . . . . . . . . . . . . . . . . . . . A-10A-12. Wool: U.S. exports by major markets, 1993-97 . . . . . . . . . . . . . . . . . . . . . . . . . . . . . . . . . . . . A-10A-13. Wool: U.S. exports by type, 1993-97 . . . . . . . . . . . . . . . . . . . . . . . . . . . . . . . . . . . . . . . . . . . . A-11A-14. Wool: Production and exports by major foreign producing countries,
1992/93-1996/97 . . . . . . . . . . . . . . . . . . . . . . . . . . . . . . . . . . . . . . . . . . . . . . . . . . . . . . . . . A-11

vi
ABBREVIATIONS AND ACRONYMS
ABARE Australian Bureau of Agricultural and Resource EconomicsABS Australian Bureau of StatisticsAMS Agricultural Marketing Service of the U.S. Department of AgricultureASI American Sheep Industry Association, Inc.AWC Australian Wool CorporationBOARD South African Wool BoardCOMMERCE U.S. Department of CommerceCCC Commodity Credit Corporation of the U.S. Department of AgricultureCIS Commonwealth of Independent StatesCVD Countervailing dutyERS Economic Research Service of the U.S. Department of AgricultureEU European UnionFAS Foreign Agricultural Service of the U.S. Department of AgricultureFSA Farm Service Agency of the U.S. Department of AgricultureFMD Foreign Market Development Cooperator Program of the U.S. Department
of AgricultureHTS Harmonized Tariff Schedule of the United StatesIWS International Wool SecretariatKG KilogramMAF Ministry of Agriculture and Forestry, New ZealandMAP Market Access Program of the U.S. Department of AgricultureNAFTA North American Free Trade AgreementNASS National Agricultural Statistics Service of the U.S. Department of AgricultureNWGA National Woolgrowers Association of South AfricaNZEC New Zealand Meat and Wool Board’s Economic ServiceNZWB New Zealand Wool BoardRPS Reserve price schemeSFE Sydney Futures ExchangeSID Sheep Industry Development Program, Inc.SONZA Situation and Outlook for New Zealand AgricultureUMS MicronsURA Uruguay Round AgreementUSDA U.S. Department of AgricultureUSITC U.S. International Trade CommissionWOOL ACT National Wool Act of 1954

1
ABSTRACT
This report addresses trade and industry conditions for the wool and relatedanimal hair industry for the period 1993-97.
• World wool production declined by 15 percent during 1993-97 from3.8 billion pounds to 3.2 billion pounds, reflecting the decline in theglobal sheep population. Australia is the leading producer andexporter of wool, accounting for over 30 percent of world productionand over 65 percent of world exports. However, over the last 5 years,wool production in Australia declined by 21 percent and the sheeppopulation declined by 11 percent.
• The United States primarily produces “medium coarseness” wool, butonly limited quantities of the “fine” wool that is used to make high-priced apparel. U.S. producers of wool have become increasinglycompetitive in foreign markets as the share of production exportedrose from 6 percent in 1993 to 17 percent in 1997. However, theUnited States accounted for less than 1 percent of world woolproduction (by quantity) in 1997.
• Wool production in the United States declined steadily during 1993-97, totaling 28 million pounds in the latter year. Imports accountedfor over 60 percent of U.S. consumption, with about 38 percentcoming from Australia. Other important suppliers included NewZealand and Uruguay. The top export markets included Mexico,Germany, and the United Kingdom.
• The U.S. duty rates for all wool and related animal hair included inthis summary range from free to 25.8¢/kg as of January 1, 1998. Theaggregate trade-weighted average rate of duty for all such productswas 3.9 percent ad valorem in 1997.
• The primary U.S. consumers of wool and related animal hair aretextile manufacturers. Fibers from sheep, goats, and other animals areprocessed into apparel and nonapparel items, such as suits, sweaters,blankets, and carpets.

2

Processed fibers and yarns of wool and related animal hair are not included in this summary.1
Harmonized Tariff Schedule of the United States (1998) (HTS), Note, ch. 51, Wool, Fine or2
Coarse Animal Hair; Horsehair Yarn and Woven Fabric. Based on the value of U.S. wool and mohair production in 1997.3
Sheep Industry Development Program, Inc. (SID), Sheep Production Handbook, Oct. 1988, p.4
WOOL-13. SID is part of the American Sheep Industry Association, Inc. (ASI), a producer-drivenfederation of State organizations dedicated to promoting the well-being and profitability of the U.S.sheep industry. USITC Lamb Meat: Competitive Conditions Affecting the U.S. and Foreign Lamb Industries,5
Investigation No. 332-357, USITC publication 2915, Aug. 1995, p. x. USITC Lamb Meat: Competitive Conditions Affecting the U.S. and Foreign Lamb Industries,6
Investigation No. 332-357, USITC publication 2915, Aug. 1995, p. 2-26.
3
INTRODUCTION
This summary profiles the U.S. and major foreign wool and related animal hair industries,1
provides information on tariff and nontariff measures in domestic and foreign markets for theseproducts, and analyzes the performance of the U.S. industry in domestic and foreign markets.It also provides data on domestic and foreign production and trade for 1993-97.
The Harmonized Tariff Schedule of the United States (HTS) defines wool as the natural fibergrown by sheep or lambs. The term “fine animal hair” refers to the hair of alpaca, llama, vicuna,camel, yak, Angora, Tibetan, Kashmir or similar goats (but not common goats), rabbit(including Angora rabbit), hare, beaver, nutria or muskrat. “Coarse animal hair” means the hairof animals not mentioned above, excluding brush-making hair and bristles.2
Wool accounts for approximately 74 percent of the value of U.S. production of the itemsincluded in this summary. Other major fibers included in this summary include mohair and3
cashmere. Fibers from sheep, goats, and other animals are used in making both apparel andnonapparel articles such as carpets.
Wool
Most sheep breeds produce wool. However, each breed’s wool fibers are unique with respectto diameter, length of staple, strength, color, and density. Even within a single fleece, there canbe variations depending on the area from which the wool was sheared—such as the side, belly,or back. Average fiber diameter is the most important wool fiber property in terms of qualityand value. Length of staple and strength are additional measurements by which to determine4
the value of wool fibers. The Merino sheep breed, raised specifically for wool, produces themost valuable and finest wools, although there are other sheep breeds that produce fine wools,including the Rambouillet and Delaine. The remaining breeds produce medium or coarser fibers.
In the United States, most sheep are meat-type animals kept mainly for the production of lambsfor meat, or are dual-purpose breeds kept both for the production of wool and for the productionof lambs for meat. U.S. sheep producers’ gross receipts are derived mainly from lamb meat,5
not wool; the share of cash returns accounted for by wool was 12 percent in 1994 . In 1997, the6
USDA, ERS, Cotton and Wool Yearbook—Summary, Nov. 21, 1997.7
USITC Lamb Meat: Competitive Conditions Affecting the U.S. and Foreign Lamb Industries,8
Investigation No. 332-357, USITC publication 2915, Aug. 1995, p. 3-2. This system measures fiber diameter in microns. A micron is one-millionth of a meter (1/25,4009
of an inch). Statistical tables are in appendix A.10
A hank is 560 yards of yarn. Robert E. Taylor, Scientific Farm Animal Production: An11
Introduction to Animal Science, 4th ed., (New York: Macmillan Publishing Co., 1992), p. 599. For a description of the American blood count and the English spinning count system, see12
Robert E. Taylor, Scientific Farm Animal Production: An Introduction to Animal Science, 4th ed,(New York: Macmillan Publishing Co., 1992), p. 132. SID, p. WOOL-13.13
See appendix B for USDA specifications for grades of wool.14
USDA, Agricultural Marketing Service (AMS), United States Standards for Grades of Wool,15
effective Dec. 21, 1968. When used to quantify yarn count, the number and letter “s” represent the number of 560 yard16
lengths of yarn that can be spun from one pound of top. Sheep Production Handbook, WOOL-13.
4
United States accounted for less than 1 percent of the world’s sheep population and less than1 percent of world wool production.7
Australia is the world’s largest volume wool producer. In Australia, about 70 percent of thesheep are maintained for the production of wool, and the Australian Merino breed accounts forvirtually all of Australia’s wool-type sheep. The Merino is generally recognized as efficient inthe production of very high-quality wool; however, it is generally recognized as relativelyinefficient in the production of lamb meat. Other major wool producers include New Zealand,8
China, the Commonwealth of Independent States (CIS, or the former Soviet Union), Uruguay,Argentina, and the Republic of South Africa (South Africa). Major wool-exporting countriesinclude Australia, New Zealand, and South Africa.
The “grade” of wool refers to the quality or relative fineness of the wool. Fineness refers to thethickness (diameter) of individual wool fibers and ranges from fine to coarse. There are threemethods used to report wool grades—the American blood count system, the English spinningcount system, and the micron system. The micron system is the most accurate measure fordetermining the grade of wool. 9
Table A-1 shows certain sheep breeds and the grades of wool fiber they typically produce, asrated under the three systems noted above. A wool graded ½ blood under the American blood10
count system would yield 60 to 62 hanks of yarn from 1 pound of clean wool under the English11
spinning count system and would have a fiber diameter of 22.05 to 24.94 microns (ums) underthe micron system. The Corriedale and Columbia are two sheep breeds that typically producesuch grades of wool. The use of the American blood count system and the English spinningcount system in production, marketing, and manufacturing has declined in internationalmarkets, and is being replaced by a measurement of diameter (in microns) and variability12
(standard deviation). 13
In the United States, wool is graded according to specifications developed by the U.S.Department of Agriculture (USDA). There are 16 grades specified by USDA and for each14
grade a range is specified for average diameter and a maximum standard deviation. The15
numbers used by USDA to express wool grade are the same as those used in the Englishworsted yarn count system. Grade may be determined by inspection, usually by comparison16

Sheep Production Handbook, p. WOOL-13.17
According to the American Sheep Industry Association (ASI) vegetable matter is extraneous18
materials found in wool and can range from burrs and seeds to leaves and other similar plant debris.Sheep Production Handbook, p. WOOL-39. When fleeces are grouped according to fineness, the process is called grading. Typical19
combinations for fine wool fleeces are 70s/64s/62s or 64s/62s/60s. Coarser fleeces averaging 58s orcoarser are generally limited to only two grades. Sheep Production Handbook, p. 1143. Grease wool or raw wool signifies wool in its natural state, as it comes off the sheep with grease20
and other impurities attached to it. Clean yield refers to the percentage of clean wool fibers (absent ofgrease) present in a given fleece; generally fine fleeces (small fiber diameter) will have lower yieldsthan coarse fleeces. Sheep Production Handbook, pp. WOOL-70 and WOOL-12. ASI, “Code of Practice for the Preparation of Wool Clips in the United States,” found at Internet21
address http://www.sheepusa.org/fsearch.htm, retrieved Oct. 9, 1997. Sheep Production Handbook, p. WOOL-40.22
USITC staff phone interview with an official of the ASI, May 19, 1998.23
Wool that contains an excessive amount of vegetable material is carbonized using an aqueous24
acid treatment followed by heating, which converts the cellulose defect into carbon. Sheep ProductionHandbook, p. WOOL-45.
5
of the fiber diameters of the wool being graded with the fiber diameters of samplesrepresentative of standards; grading can also involve measuring a prescribed number of fibersfrom a sample, calculating the average and standard deviation of fiber diameter and comparingthe average and standard deviation with the diameter specifications for grades of wool.17
Wool is usually harvested by one of two methods—shearing or pulling. Shearing wool is themethod most commonly used in the United States and involves clipping wool from the sheep.The clipped wool from one sheep holds together (as one piece) and is referred to as “fleece.”In the United States, sheep are generally clipped once a year by professional shearers, and eachsheep produces from 3 to 10 pounds of fleece. Pulled wool is wool removed mechanically fromthe skins of slaughtered sheep or lambs.
Once removed from the sheep, the fleece is placed on a skirting table where it is examined. Ina process referred to as skirting, undesirable wool is removed (i.e., wool with clumpy vegetablematter, stains, or other contaminants), and head, lower leg, and belly wool are separated from18
the fleece. Basically, all wool that does not match the bulk of the fleece is removed and sortedseparately. After skirting, the fleeces are classed according to fineness, yield (percentage of19
clean wool obtained from a definite quantity of raw or grease wool), length of fiber, strength,20
color, and style. The fleece is then placed in a plastic or a burlap bag along with 20 to 40 other21
similarly classed fleeces. Each bag identifies the grower or official brand and is numbered andmarked as to its contents. In general, the use of burlap bags by the U.S. wool industry is beingreplaced by plastic bales, because nonwool fibers from the burlap can mix with wool fibersresulting in defective yarn or fabric. The plastic bales can hold between 400-450 pounds of22
wool and conform with international regulations that require wool-packaging materials to befully recyclable. 23
The wool is then generally transported to private or cooperative warehouses for preparation andmarketing to textile mills. At the mill the raw wool is scoured (washed), which removes greaseas well as vegetable and other matter. A byproduct of the washing process is lanolin, which isprocessed into such goods as creams, soaps, ointments, and steroid drugs. Some vegetablematter may remain after washing, in which case the wool is washed in a sulfuric acid solution,a process referred to as “carbonizing.” The wool is then dried, carded (disentagles wool24
fibers), combed, and finished into yarn.
Sheep Production Handbook, p. WOOL-73.25
“All About Wool,” found at Internet address http://www.woolmark.com/glossary.html#W-Z,26
retrieved Oct. 9, 1997. Ibid.27
USITC staff interview with Dr. Chris J. Lupton, professor Animal Science, Texas A&M Univ.,28
Agricultural Research and Extension Center, San Angelo, TX, Apr. 16, 1998. Ibid. Kid mohair is defined as that fiber produced from the first two clippings; young goat29
mohair is that fiber produced from the third and sometimes fourth clipping; and adult mohair consistof that fiber produced from the fourth and subsequent clippings. Kemp is a coarse, brittle, chalky white hair which sometimes occurs in the fleece. Cloths made30
with these fibers dye improperly and are highly undesirable. Angora Goats, Goat Handbook, USDA, Oct. 1993.31
Lupton, Texas A&M, Apr. 16, 1998.32
6
There are many end uses for wool. Wool is generally classified as that used for apparel ornonapparel. Apparel wools can be further divided into woolens and worsted yarns used in themanufacture of woven and knit fabrics. Woolen yarns are made from short fibers (1 to 3 inches)that are criss-crossed and do not lie in any general order, giving the yarn its characteristicfuzziness. Fabrics made from woolen yarns include flannels, tweeds, and meltons, and are25
usually associated with fall and winter garments. Worsted yarns are made from longer fibers26
of 3 to 6 inches, which are combed to lie parallel to each other and produce a smooth, cleanlook. Fabrics made from worsted yarns are smooth and cool to wear; these fabrics, such asgabardines, crepes, tropicals and suitings, can be worn comfortably in moderately warm weatherand climates. In addition, wool fibers are often blended with other fibers and synthetics.27
Manufactured wool carpets and furniture upholstery are examples of uses of nonapparel wools.
Mohair
Mohair is a wool-like hair obtained from Angora goats. The United States and South Africa arethe world’s largest producers of mohair. In the United States, Angora goats are generallysheared (clipped) twice a year. Mohair derived from kids and young goats is finer than thatderived from adult goats and commands higher prices, as such fibers are highly desired by thefashion industry. Mohair is graded by its width in microns. The fiber diameter of kid mohair28
is 23 to 29 microns, that of young goats is 30 to 36 microns, and the diameter of adult fibers is34 to 40 plus microns. Fiber diameter, length of fiber (minimum 4 inches), and fleeces free of29
kemp are the most desirable characteristics.30 31
Kid and young goat mohair generally is processed into worsted apparel for men’s and women’ssuits. There are many uses for adult mohair, including the manufacture of fuzzy cardigans,carpets, and blankets.32

Cashmere and Camel Hair Manufacturers Institute, “Cashmere and Camel Hair Fact Sheet,”33
found at Internet address http://www.cashmere.org, retrieved Oct. 7, 1997. Oklahoma State Univ., Department of Animal Science, Stillwater, OK, “Breeds of Livestock,”34
found at Internet address http://www.ansi.okstate.edu/breeds/goats, retrieved June 17, 1998. Pierce Miller, president ASI transcript of ITC hearing on investigation 332-357: Lamb Meat: 35
Competitive Conditions Affecting the U.S. and Foreign Lamb Meat Industries,” Apr. 6, 1995, pp. 52-53. According to the USDA, “an operation is any place that has one or more sheep on hand at any36
time during the year.” USDA, National Agricultural Statistics Service (NASS), Sheep and Goats, Jan. 30, 1998.37
7
Cashmere
Cashmere is a highly desirable and valuable fiber derived from cashmere goats. China is theworld’s largest producer of cashmere. Other producers of cashmere include Mongolia, Turkey,Afghanistan, Iraq, Iran, India, Pakistan, Australia, and New Zealand. In China, the fine, softundercoat or underlayer of hair is removed with a coarse comb by hand. The animals are shearedin Afghanistan, Iran, New Zealand, and Australia. Raising cashmere goats in the United States33
is a relatively new industry; the first cashmere goats were imported from Australia and NewZealand in the late 1980s. In the United States the cashmere is obtained by shearing the34
animals once a year. End uses for cashmere include men’s and women’s coats, hosiery, sweaters,gloves, and robes.
U.S. INDUSTRY PROFILEThe structure of the raw wool industry in the United States is illustrated in figure 1. Wool andrelated animal hair are classified under Standard Industrial Classification 2299, a category fortextile goods, not elsewhere classified.
Number of Firms and Geographic Distribution
Wool
Wool is grown throughout the United States, but the majority of U.S. wool is produced in thewestern United States. In many regions of the western United States, forage is the only suitableagricultural crop because of topography, rainfall, and soils, and the only practical use for theforage is as a feed for ruminant animals, such as sheep and goats. 35
The number of operations with sheep provides an estimate of the number of firms producingwool. The number of sheep-raising operations in the United States declined steadily from36
87,150 in 1994 to 74,710 in 1997, a decline of 14 percent. The number of sheep and lambs37
in the United States totaled 7.62 million animals on January 1, 1998, with Texas

8
Figure 1Wool: Structure of the U.S. industry
Sheep/lamb growers
Meat packer
Farmed sheared wool Pulled wool
Bales of grease wool
Grower owned Wool co-ops and warehouses exports
`
Wool Textile/fabricKnit apparel mills imports mills
(hats, scarfs, hosiery)
Apparel Nonapparel yarn andmanufacturers manufacturers fabric
Wool
exports
Source: Derived by USITC staff.
Sheep and Goats, Jan. 30, 1998.38
USITC, Lamb Meat: Competitive Conditions Affecting the U.S. and Foreign Lamb Industries,39
Investigation No. 332-357, USITC publication 2915, Aug. 1995, p. 2-41. Testimony of Steve Raftopoulos, on behalf of the ASI, for the Subcommittee on Livestock, Dairy40
and Poultry, U.S. Congress, Committee on Agriculture, Washington, DC, Feb. 26, 1998. USDA, NASS, Sheep and Goats Predator Loss, Apr. 27, 1995.41
9
accounting for 1.5 million, or 18 percent of the total sheep inventory. Other major sheep-38
raising States include California, Wyoming, Colorado, Montana, and South Dakota.
Wool production is concentrated where sheep and lamb production is concentrated. TwelveStates accounted for over 80 percent of U.S. wool production in 1997. Texas accounted for 11.0million pounds, or 20 percent of total U.S. wool production in 1997. Wyoming was the second-largest wool producer with 5.5 million pounds (10 percent), and California was the third-largestwool producer with 4.4 million pounds, or 8 percent.
Mohair
Although Angora goats can adapt to many conditions, they are particularly suited to the aridclimate of the Southwestern States. Texas (mainly the Edwards Plateau in Southcentral Texas)has the largest Angora goat inventory and produces over 90 percent of U.S. mohair. Otherproducing States include Arizona, Oklahoma, and New Mexico.
Special Considerations
Wool
U.S. lamb meat production generates most of the receipts for sheep growers; thus, factors thataffect lamb meat production ultimately affect wool production. The U.S. sheep industry hasbeen in a long-term decline. Factors contributing to the decline include labor shortages, deathlosses of sheep and lambs from disease and predators, and market infrastructure problems. In39
addition, some domestic interests contend that increased imports of lamb meat have alsoadversely affected the domestic sheep industry.40
Many sheep growers report that they are unable to hire competent domestic sheep herders.Growers report that recent modifications in migrant labor laws and regulations have improvedthe labor situation somewhat; however, nearly all express dissatisfaction with the difficulty insatisfying the requirements of these laws and regulations. Death losses of sheep and lambs aregenerally higher than those of other livestock, primarily because sheep are highly susceptibleto disease and are easily attacked by predators. USDA reports that in 1994, a total of 368,050sheep and lambs, valued at $17.7 million and accounting for 4 percent of the 1994 inventory,were killed by predators. Ultimately, the lack of competent sheep herders and loss of sheep to41
predators results in fewer sheep and less wool production.
Sheep Production Handbook, p. WOOL-29.42
John Etchepare, president, Warren Live Stock Co., interviewed by USITC staff, Cheyenne, WY,43
Oct. 13, 1994. Sheep Production Handbook, p. WOOL-37.44
Ernest E. Davis, Texas A&M Univ., Glen Whipple, Univ. of WY, and David P. Anderson,45
Livestock Marketing Information Center, Wool and Mohair Policy. USDA, NASS, Sheep and Goats Predator Loss, Apr. 27, 1995.46
USDA, National Agricultural Library, Extension Goat Handbook, Angora Goat Production,47
June 1992, found at Internet address http://agweb.tamu.edu/, retrieved Oct. 2, 1997. Ibid.48
ASI Inc., Sheep Industry News, “Mohair Combing Facility to Close,” Mar. 1998, Vol. 2, No. 3,49
p. 2.
10
In the United States, sheep are generally sheared once a year in the spring. A good shearer canclip at least 125 sheep a day. It is important to employ a skilled shearer because the value ofthe wool clip can be reduced by 25 percent or more as a result of improper shearing.42
Reportedly, there is a shortage of sheep shearers in the United States; consequently, many sheepin the United States are sheared by crews from Australia and New Zealand. Graders and43
sorters of wool also require specialized knowledge and training.44
As the number of producers and sheep flocks decline, there is a corresponding decline ininfrastructure, such as the number of shepherds and shearers and the number of slaughteringplants. With the decline in the number of slaughtering plants, growers’ opportunities to markettheir lambs become more limited. 45
Mohair
Mohair producers face many of the same problems sheep growers face, including the lack ofskilled laborers, goat death loss due to predators, and a decline in infrastructure. In 1994, mohairproducers experienced a loss to predators of 140,000 goats, valued at $5.5 million. Unlike46
sheep producers, whose income is derived primarily from lamb meat, Angora goat producersreceive most of their income from the sale of mohair, not goat meat. A high proportion of the47
Angora goats’ nutrient intake is expended for fiber production, so they are relatively poor meator milk producers. There are few mohair processors left in the United States. For example, one48
processing plant closed in March 1998, citing declining production and a sporadic mohairmarket.49

The information in this section on marketing methods is adapted from ASI, Fact50
Sheet—American Wool Market, found at Internet addresshttp://www.sheepusa.org/resource/fswmarke.htm, retrieved Oct. 2, 1997, unless otherwise stated. Introductory Animal Science, pp. 604-605.51
Mohair Council of America, San Angelo, TX, About Fiber Goats, found at Internet address 52
http://www.goatweb.com/angoras.htm, retrieved Aug. 22, 1997. North Dakota State Univ., NDSU Extension Service, Angora Goat, Jan. 1993, found at Internet53
address http://ndsuext.nodak.edu, retrieved Oct. 2, 1997. Lupton, Texas A&M, Apr. 16, 1998.54
Wool Record, “South Africans Try to Rekindle Interest in Adult Mohair Fibre,” World Textile55
Publications Ltd., Bradford, West Yorkshire, England, Mar. 1998, p. 45.
11
Marketing Methods
Wool50
Most wool is sold by description with measurements for fiber diameter and yield (see systemsdescribed earlier). The majority of wool is marketed through wool pools, warehouses, directmarketing, dealers, and brokers. In the eastern two-thirds of the United States, most woolgrowers produce small volumes that preclude efficient handling. Thus, wool growers in thisregion market their wool through warehouses or pools, whereby the wool is brought to thewarehouse, graded, and put into packages for the wool trade. Individual wool growers pool theirwool to improve the marketability of the wool through larger lot size. Grower-ownedcooperatives pool the wool of their members to aid in keeping the cost of marketing low and tosecure the full market price for the wool. There are over 100 wool pools throughout the United51
States.
In the Western States wool growers also use warehouses and pools to market their wool. Thereare over 40 wool warehouses in the United States, with most of them concentrated in Texas andNew Mexico. Nearly 100 percent of the wool grown in these two States is marketed throughwarehouses. The majority of wool is taken on consignment and marketed on behalf of thegrower, although some warehouses buy wool directly. Dealers and brokers purchase wooldirectly from the grower, or deal directly with warehouse operators. There are over 30dealers/brokers of wool in the United States.
Mohair
The marketing of mohair is similar to that of wool. Mohair is marketed through warehouses, andthe bulk of U.S. mohair production is loaded into containers each holding 35,000 poundquantities for export. Kid and young goat mohair are more valuable than adult mohair and thus52
are separated from the adult mohair, as the former will command a higher price. The market53
value of mohair (especially adult mohair) fluctuates more than that of wool. In recent years,demand for adult mohair has declined primarily as a result of changes in fashion. However,54
it is reported that high import tariffs and quotas in India and the devaluation of the currenciesin various Asian country markets also have contributed to the weakened demand.55

Public Law 83-690, 68 Stat. 910, Aug. 28, 1954.56
National Wool Act Programs 1954-1995, compiled by Janise Zygmont, agricultural economist,57
USDA, Farm Service Agency, Fibers Analysis Division. Ibid.58
The Farm Service Agency (FSA), formerly Agricultural Stabilization and Conservation Service.59
National Wool Act Programs 1954-1995, p. 3.60
Ibid., pp. 16-17.61
Ibid., p. 1.62
Signed into law Nov. 1, 1993.63
12
Prices
The price U.S. wool growers received for their wool during 1993-95 was partly derived fromFederal incentive payments made available under the National Wool Act of 1954 (Wool Act),56
an incentive that was repealed effective as of December 31, 1995. The purpose of the formerWool Act, the value of incentive payments received by wool and mohair producers, and marketprices are discussed below.
The Wool Act was enacted to encourage a greater level of self-sufficiency in wool productionbecause the United States was a deficit wool producer. It also sought to encourage producers57
to use good management and handling practices to minimize contamination of their clips andto employ certain marketing practices to improve the quality, which in turn increases the valueof the raw fiber. 58
The Wool Act provided for incentive payments for shorn wool, mohair, and unshorn lambs. Theincentive payments, administered by the USDA’s Farm Service Agency, were funded through59
the Commodity Credit Corporation (CCC). Another provision of the Wool Act authorized theSecretary of Agriculture to enter into agreements with sheep/wool and mohair organizations tocarry out promotions in the United States. During 1993-95, $20.5 million was collected from60
wool and mohair producers for promotional purposes.61
In administering the Wool Act incentive payments, a support price was determined and incentivepayments were made based on the percentage needed to bring the average return (market price+ payment) received by all wool growers up to the determined support level. The wool supportprice was determined by a formula set forth in the Wool Act, and the market price received byall growers was calculated on the basis of actual returns received by growers. The mohairsupport price was set at a level between 85 and 115 percent of the percentage of parity at whichshorn wool was supported.62
The Omnibus Budget Reconciliation Act of 1993, Public Law 103-130, provided for a phase63
out of the incentive payments over the marketing years 1994/95 and repealed the Wool Acteffective as of December 31, 1995. For the marketing year 1994 (payments made April 1995),producers received only 75 percent of their calculated payment, and for the marketing year 1995(payments made April 1996), they received only 50 percent.
The value of shorn wool marketed, Federal incentive payments (including unshorn lambpayments and promotion deductions), and the average price received by producers are shownin table A-2. USDA estimates that U.S. wool producers would have received an additional

National Wool Act Programs 1954-1995, p. 5.64
Ibid.65
15 U.S.C. 70.66
15 U.S.C. 68. 67
U.S. Federal Trade Commission, Rules and Regulations under the Wool Products Labeling Act68
of 1939, effective July 15, 1941, as amended July 9, 1986 and 63 F.R., Feb. 13, 1998, Rules andRegulations under the Textile Fiber Products Identification Act, the Wool Products Labeling Act,and the Fur Products Labeling Act. The MAP was authorized by Section 244 of the Federal Agricultural Improvement and Reform69
Act of 1996 and is administered by USDA Foreign Agricultural Service (FAS). It replaced USDA’sMarket Promotion Program. USDA, FAS, “Market Access Program,” found at Internet address70
http://www.fas.usda.gov/exprograms.html, retrieved May 12, 1998. Ibid.71
Ibid.72
13
$60 million in payments over the 1994/95 marketing years had there not been a reduction inincentive payments during the phase-out period. 64
U.S. producers of mohair also received incentive payments. The value of mohair marketed,Federal incentive payments (including promotion deductions), and the average price receivedby producers are shown in table A-3. USDA estimates that U.S. mohair producers would havereceived an additional $25 million in payments over the 1994/95 marketing years had the phaseout not occurred. 65
U.S. Government Programs
The Textile Fiber Products Identification Act and the Wool Products Labeling Act of 193966 67
require marketers of subject textiles and wool products to mark each item with the genericnames and percentages by weight of the constituent fibers present in the product, in the orderof predominance by weight. In addition, the name of the country where the product wasprocessed or manufactured must be identified. The Wool Products Labeling Act also requires68
that each label state whether the wool used in a textile item is new or virgin (never before usedin cloth) or recycled (includes fibers recovered from previously manufactured new or usedcloth).
U.S. wool and mohair exports receive assistance from USDA’s Market Access Program(MAP) and USDA’s Foreign Market Development Cooperator Program (FMD). The MAP69
uses funds from the CCC to help U.S. producers, exporters, and other trade organizationsfinance promotional activities for U.S. agricultural products, including wool and mohair. Such70
funds are used to partially reimburse program participants conducting foreign marketdevelopment projects in specified countries. The FMD is provided to encourage the71
development, maintenance, and expansion of long-term export markets for agriculturalcommodities through cost-share assistance to eligible trade organizations.72

Wool on a clean basis refers to wool that has been scoured. The quantity and value of wool in73
this summary are reported on a clean basis unless otherwise stated. USDA, ERS, Cotton and Wool Yearbook, Nov. 24, 1995.74
USDA, ERS, Cotton and Wool Yearbook—Summary, Nov. 21, 1996.75
Data for Jan.-June 1997, Cotton and Wool Yearbook—Summary, Nov. 1997.76
14
U.S. MARKET
Consumption
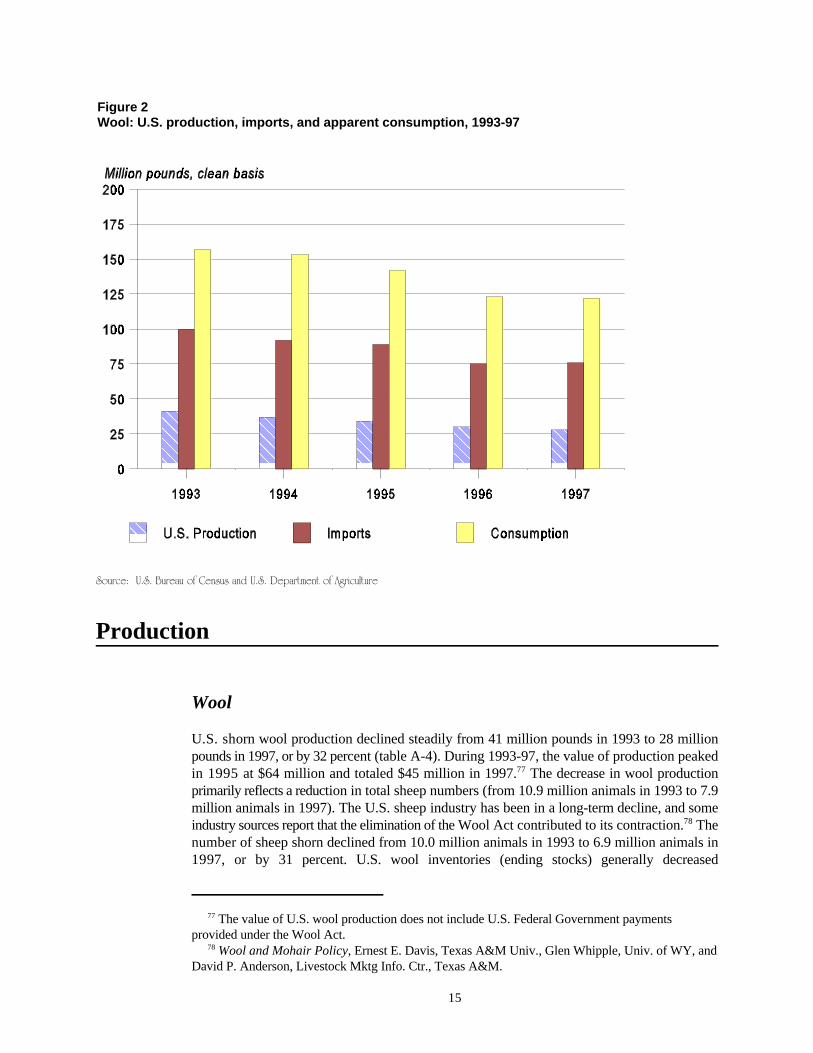
Apparent consumption of raw wool by U.S. textile mills decreased steadily from 157 millionpounds in 1993 to 122 million pounds (clean basis) in 1997, as shown in table A-4 and figure73
2. The share of consumption accounted for by imports remained fairly stable during 1993-97,totaling 63 percent of consumption in 1997. The decline in wool consumption generally reflectsa decline in retail sales of apparel made from wool, several relatively mild winters, and theimportation of low-priced wool coats. The decline in consumption during 1996 and 1997 also74
resulted in weaker mill demand. Consumption of wool in the United States is small when75
compared to cotton and manufactured fibers (synthetics). Wool accounted for less than 1percent of end-use fiber consumption in the United States in 1997. 76
The following tabulation shows U.S. mill consumption of apparel and carpet wool, 1993-97(USDA, ERS Cotton and Wool Yearbook, Nov. 1997):
Year Apparel Carpet Total ))))))))))))) Thousand pounds )))))))))))))
1993 . . . . . . . . . 141,380 15,431 156,8111994 . . . . . . . . . 138,563 14,739 153,3021995 . . . . . . . . . 129,299 12,667 141,9661996 . . . . . . . . . 110,986 12,311 123,2971997 . . . . . . . . . ( ) ( ) 121,9001 1
Not available.1
During this period, approximately 90 percent of wool consumed by U.S. textile mills wasapparel wool and 10 percent was carpet wool. About 54 percent of the total quantity of apparelwool consumed by U.S. textile mills annually during 1993-97 consisted of worsted wool (fibers3 to 6 inches in length); woolen wool (shorter fibers, 1 to 3 inches long) accounted for 46percent.
The value of U.S. wool production does not include U.S. Federal Government payments77
provided under the Wool Act. Wool and Mohair Policy, Ernest E. Davis, Texas A&M Univ., Glen Whipple, Univ. of WY, and78
David P. Anderson, Livestock Mktg Info. Ctr., Texas A&M.
15
Figure 2Wool: U.S. production, imports, and apparent consumption, 1993-97
Source: U.S. Bureau of Census and U.S. Department of Agriculture
Production
Wool
U.S. shorn wool production declined steadily from 41 million pounds in 1993 to 28 millionpounds in 1997, or by 32 percent (table A-4). During 1993-97, the value of production peakedin 1995 at $64 million and totaled $45 million in 1997. The decrease in wool production77
primarily reflects a reduction in total sheep numbers (from 10.9 million animals in 1993 to 7.9million animals in 1997). The U.S. sheep industry has been in a long-term decline, and someindustry sources report that the elimination of the Wool Act contributed to its contraction. The78
number of sheep shorn declined from 10.0 million animals in 1993 to 6.9 million animals in1997, or by 31 percent. U.S. wool inventories (ending stocks) generally decreased

Approximately 10 to 20 percent of U.S. mohair production consists of kid/young goat mohair.79
The value of U.S. mohair production does not include U.S. Federal Government payments80
provided under the Wool Act. USDA, NASS, Wool and Mohair, various issues.81
The average clip per goat was 7.3 pounds in 1997, up from 6.7 pounds in 1996.82
Lupton, Texas A&M, Apr. 16, 1998.83
16
during 1993-97, from a high of 52 million pounds in 1994 to 46 million pounds in 1997 (tableA-4). In 1997, ending stocks were about 7 percent above the January 1, 1997 stock level.
Mohair
U.S. mohair production declined from 14.8 million pounds in 1993 to 6.9 million pounds in79
1997, or by 53 percent (table A-5). During 1993-97, the value of U.S. mohair production80
peaked at $32 million in 1994, then fell irregularly to $16 million in 1997. The decrease in81
production was a reflection of a 37 percent drop in the Angora goat inventory during 1993-97.The number of goats clipped also declined from 2.1 million animals in 1993 to 0.95 millionanimals in 1997. Poor returns (sometimes not enough to break even), reduced demand for82
adult mohair, and the elimination of the Wool Act caused many producers to exit the industryand further contributed to the reduction in mohair production.83
U.S. TRADE
Overview
The United States registered a substantial trade deficit in wool and other related animal hair inevery year during 1993-97 (table A-6). The deficit peaked in 1995 at $179 million and totaled$162 million in 1997. Imports of wool accounted for 86 to 92 percent of total wool and relatedanimal hair imports during 1993-97. As stated earlier, the United States is not a major woolproducer, accounting for less than 1 percent of world production. Exports of wool and relatedanimal hair rose from $14 million in 1993 to $36 million in 1994, then declined to $17 millionin 1997.
Most of the unimproved wools are specifically named and the others are provided for in the HTS84
as “similar” wools. The names generally reflect the area or country of origin, such as Arabian,Bagdad, and Indian. HTS, Additional U.S. Notes, ch. 51, Wool, Fine or Coarse Animal Hair;Horsehair Yarn and Woven Fabric, p. 51-2. American Textile Manufacturers Institute facsimile transmission to the USITC, Apr. 16, 1993. 85
Includes approximately 3 percent by value and quantity of U.S. imports of wool other than clean86
yield. USDA, ERS, Cotton and Wool Yearbook, Nov. 27, 1996.87
USDA, ERS, Cotton and Wool Yearbook, Nov. 24, 1995.88
17
U.S. Imports
The quantity of imports of wool and related animal hair declined irregularly from 106 millionpounds in 1993 to 80 million pounds in 1997 (table A-7). The value of such imports peaked at$214 million in 1995 and totaled $179 million in 1997. Wool accounted for over 95 percent ofthe quantity imported in 1997; related animal hair accounted for 4 percent, and mohairaccounted for less than 0.05 percent. In value terms, wool accounted for over 85 percent, relatedanimal hair for 14 percent, and mohair for less than 0.05 percent.
Wool
Products imported
During 1993-97, U.S. imports of wool not finer than 46s (often referred to as unimprovedwools) accounted for between 22 and 33 percent of the quantity and between 15 and 24 percentof the value of U.S. wool imports. These coarse wool fibers generally range from 5 to 15 inchesin length and from 33 to 70 microns in diameter, and are not commercially produced in theUnited States. U.S. textile mills import such wool for use in their production of carpets,84
upholstery, industrial felts, knitting yarns, and certain fabrics. U.S. imports of wool finer than85
46s accounted for the remainder and are generally used in the production of wearing apparel.
Levels and trends
U.S. imports of wool declined steadily from 100 million pounds in 1993 to 75 million poundsin 1996, then rose slightly to 76 million pounds in 1997 (table A-8). The value of such imports86
declined by 2 percent to $149 million during 1993-94, rose to $197 million in 1995, thendeclined by 22 percent to $154 million in 1997. The average unit price declined from a high of$2.20 per pound in 1995 to $2.02 per pound in 1996-97. The decline in U.S. wool importsreflects relatively mild winters and changing fashion trends. Wool also competes with cotton andsynthetic fibers, the prices of which have declined relative to that of wool. Also, with the87
introduction of “casual” office dress codes, apparel made from cotton and manmade fibers hasdisplaced wool apparel.88
18
During 1993-97, about 20 percent (by value) of U.S. wool imports entered the United Statesfree of duty. Duty-free imports consist primarily of unimproved wools or other wools gradednot finer than 46s. Table A-9 shows U.S. dutiable wool imports and duty-free wool imports for1993-97.
Principal suppliers
During 1993-97, Australia was the principal supplier of wool to the United States, accountingfor about 70 percent of U.S. wool imports in value terms. New Zealand was the second-largestU.S. supplier, supplying about 18 percent of the value annually during the period. New Zealandand the United Kingdom were the principal suppliers of unimproved wools, accounting for 78and 15 percent, respectively, of the quantity and value imported in 1997. Wool mill processors,dealers, and brokers are the major importers of wool.
Related animal hair
Imports of related animal hair declined from 6 million pounds in 1993 to 3 million pounds in1997 (table A-7). The value of such imports fluctuated during the period and totaled $25 millionin 1997. Processed cashmere and camel hair are believed to have accounted for most of thevalue of the products imported in this category. During 1993-97, the major suppliers of relatedanimal hair were China, Mongolia, and Afghanistan.
Mohair
Mohair imports, though relatively small when compared with imports of wool and relatedanimal hair, declined from a high of 194,000 pounds in 1994 to 4,000 pounds in 1997 (tableA-7). The value of mohair imports peaked in 1995 at $501,000 as the price of mohair perpound rose from $1.15 in 1994 to $3.50 in 1995. Australia was the principal supplier in 1997,accounting for 76 percent of the quantity imported.
U.S. Trade Measures
Tariff measures
Table A-10 shows the column 1 rate of duty as of January 1, 1998 for the articles included inthis summary (including both general and special rates of duty) and U.S. exports and importsfor 1997. An explanation of tariff and trade agreement terms is set forth in appendix C. Theaggregate trade-weighted average rate of duty for all imports of wool and related animal hairincluded in this summary was 3.9 percent ad valorem in 1997, and the aggregate trade-weightedaverage rate of duty only for dutiable wool and related animal hair was 4.2 percent ad valorem.

Rinderpest and foot-and-mouth diseases are highly contagious, infectious diseases that can afflict89
cloven-footed animals (such as sheep). Because the diseases are easily transmitted and debilitating,they are an ever-present threat to the U.S. livestock industry. Consequently, U.S. imports of livesheep and meat of sheep are generally limited to countries that have been declared free of thesediseases by the U.S. Secretary of Agriculture. 9 CFR Ch. 1 (1-1-98 Edition).90
48 F.R. 14423 (April 4, 1983).91
For background information on the history of this order and reasons of Commerce revoking it,92
see explanation in Commerce’s Aug. 1, 1997, notice (62 F.R. 41361).
19
The aggregate trade-weighted average rate of duty for wool (not including related animal hair)included in this summary was 3.1 percent ad valorem in 1997, and the aggregate trade-weightedaverage rate of duty for dutiable wool products was 4.1 percent ad valorem. U.S. tariff ratesapplicable to wool are to be reduced in stages under the Uruguay Round Agreements (URA).The duties are shown in appendix D. Provisions of the URA required elimination of duties oncertain wools (wools not finer than 46s) effective January 1, 1995. However, these wools havereceived temporary duty suspensions since 1977; thus, the provisions did not significantly affectU.S. trade. The current duties on wool range from free for wool classified as not finer than 46sto 22.5¢ per clean kilogram (kg) for wool classified as finer than 46s.
Nontariff measures
Certain sanitary and phytosanitary regulations with respect to U.S. imports of wool and hair areadministered by the USDA. For example, no bloodstained wool or hair is permitted to beimported under any condition. Wool and animal hair may be imported from a region notdeclared by the U.S. Secretary of Agriculture to be free of foot-and-mouth disease or rinderpestbecause these diseases are not transmitted by wool or hair. Wool or hair clipped from live89
animals or pulled wool or hair may be imported without other restriction if the wool or hair isreasonably free from animal manure.90
U.S. Government trade-related investigations
U.S. imports of wool finer than 44s from Argentina, provided for under HTS subheadings5101.11.60, 5101.19.60, 5101.21.40, and 5101.29.40, were the subject of a countervailing duty(CVD) order effective April 4, 1983. The order was issued by the U.S. Department of91
Commerce (Commerce) pursuant to section 303 of the Tariff Act of 1930. Effective Aug. 1,1997, after completing a “changed circumstances” review, Commerce revoked the order withrespect to all unliquidated entries occurring on or after Sept. 20, 1991.92

USITC staff interview with official from ASI, May 19, 1998.93
Ibid.94
20
U.S. Exports
U.S. exports of wool, mohair, and other related animal hair rose from 12 million pounds, valuedat $14 million, in 1993 to 16 million pounds, valued at $36 million, in 1994 before decliningto 7 million pounds, valued at $17 million, in 1997 (table A-11). Exports of mohair rose by over200 percent during 1993-94 (from $7 million to $23 million), contributing to the increase inexports of these fibers during 1994; however, such exports declined to $5 million in 1997. Woolexports accounted for 50 percent of the total exports of these fibers (in value terms), mohairaccounted for 33 percent, and other related animal hair accounted for 17 percent in 1997.
During 1993-97, the European Union was the largest export market for wool, mohair, and otherrelated animal hair (in value terms). Mohair was the principal product exported to the EU during1993-97; however, such exports as a share of the total exports of these fibers declined from66 percent in 1994 to 38 percent in 1997. U.S. mohair exports declined from a high of$23 million in 1994 to $8 million in 1996 and $5 million in 1997, reflecting in part a reductionin U.S. mohair production and reduced mill demand for adult mohair. U.S. exports of wool tothe EU rose steadily from $1 million in 1993 to $3 million in 1997, and exports of relatedanimal hair totaled $2 million in 1997.
Export Levels and Trends
Wool
U.S. wool exports rose steadily from 2.5 million pounds, valued at $3.3 million, in 1993 to6.0 million pounds, valued at $12.6 million, in 1995 (table A-12). Such exports declined to 5.7million pounds, valued at $9.1 million, in 1996 and declined further to 4.7 million pounds,valued at $8.3 million, in 1997. Factors contributing to the overall increase in U.S. wool exportsinclude industry and government programs to promote U.S. wool sales to foreign markets.93
Mexico was the largest U.S. export market for wool, accounting for 39 percent of the quantityin 1997. Other important markets included Germany, the United Kingdom, and Belgium;accounting for 20, 14, and 7 percent, respectively, of the quantity exported during 1997. Theratio of U.S. wool exports to production generally increased from 6 percent in 1993 to 18percent in 1997 (table A-4).
Shorn wool accounted for 56 percent of the quantity of U.S. wool exports in 1997, carbonizedwool accounted for 37 percent, and pulled wool accounted for 6 percent (table A-13). Closureof wool scouring and or carbonizing facilities in Mexico resulted in an increase in U.S.carbonized wool exports to Mexico during 1995-97. 94

USDA, ERS, Cotton and Wool Yearbook, Nov. 27, 1996.95
Does not include U.S. mohair exports. 96
USDA, FAS, Agricultural Import Barriers, IN6072, Aug. 6, 1996, p. 18.97
21
Mohair
U.S. exports of mohair rose from 6.7 million pounds, valued at $7.5 million, in 1993 to8.7 million pounds, valued at $23.0 million, in 1994, then declined steadily to 1.9 millionpounds, valued at $5.4 million, in 1997 (table A-11). The United Kingdom, South Africa, andIndia were the destinations for most of these exports, accounting for over 85 percent in quantityterms in 1997. Other markets include China and Belgium. Factors contributing to the declinein mohair exports included reduced mill use, resulting from weak retail sales of mohair appareland textiles, and slower economic activity abroad. In addition, as the unit value of mohair95
declines, many producers have historically placed it in storage until prices return to a moreprofitable level.
Related animal hair96
Exports of other related animal hair peaked in 1994 at 4.1 million pounds, valued at $9.2million, then declined to 0.8 million pounds, valued at $2.9 million, in 1997 (table A-11).Exports of other animal hair were composed primarily of cashmere and other fine animal fiberswhich were imported, cleaned, and dehaired in the United States, and later reexported. TheUnited Kingdom, Japan, Belgium, and Canada were the destinations for most of these exports,accounting for over 80 percent of other related animal hair in 1997.
Foreign Trade Measures
Tariff measures
U.S. exports of wool and related animal hair go largely to the European Union and Mexico. TheEU does not impose duties on wool imports. U.S. exports of wool to Mexico receive duty-freestatus under the North American Free Trade Agreement (NAFTA).
China and India are major world wool importers. Tariffs on wool and animal hair imports intoChina are fairly high, 15 percent and 9 percent ad valorem respectively, for goods from MFNnations (1996). Duties on wool imported into India range from 25 to 50 percent ad valorem,except wool imported by India’s craft industry, which receives a rate of duty of free. 97
Nontariff measures
A variety of domestic policies and import restrictions are employed to protect foreign woolsectors. The EU provides benefits to sheep growers in the form of “ewe premium payments.”When the market price of sheep meat drops below a “basic price,” growers receive a payment(ewe premium payment) equal to the difference between the basic price and the market price.

With exchange rate in effect on June 8, 1998; 1 ECU = US$1.11020.98
Agra Europe Ltd, (London), No 1769, Oct. 17, 1997, Sheepmeat, p. P/iii.99
Agra Europe Ltd, (London), No 1769, Oct. 17, 1997, Projected EAGGF Guarantee Fund100
Spending in 1998, p. P/3. USDA, FAS, The Australian Budget and Agriculture, AS6071, Aug. 29, 1996, p. 1.101
USDA, FAS, Wool Credits in Export Model, AS6094, Dec. 20, 1996, p. 1.102
USDA, FAS, Agricultural Import Barriers, IN6072, Aug. 6, 1996, p. 6.103
July-June marketing year.104
22
The 1997 ewe premium was set at the equivalent of US$15.77 (14.206 ECU) per animal for98
heavy lambs and US$12.62 (11.365 ECU) per animal for light lambs. In 1997, the European99
Agricultural Guidance and Guarantee Fund contributed approximately US$2.24 billion forsheep meat.100
The Australian Government provides assistance to the wool industry for research and promotionand price support arrangements. A total of $113.3 million (US$89.2 million) was budgeted forthe wool industry in the 1996/97 marketing year. In addition, a program to encourage101
Australian wool exports to China was announced in December 1996. Under this program, woolexporters receive payments from the Australian government at the time of export whereasChinese buyers have up to 6 months to pay the amount due and receive favorable interest rates.Credit of up to US$250 million was to be available every 6 months. A reexport program in102
India allows exporters to obtain licenses to import raw materials such as wool free of duty andproduce finished products for re-export with a value added requirement. In addition, many103
foreign governments provide reduced interest rate loans to sheep producers.
FOREIGN INDUSTRY PROFILEMajor world producers of wool include Australia, New Zealand, China, the Commonwealth ofIndependent States (the former Soviet Union), Uruguay, Argentina, and South Africa. Australiais by far the largest producer and exporter of wool. World wool production decreased steadilyfrom 3.8 billion pounds in 1992/93 to 3.2 billion pounds in 1996/97 (table A-14). The104
decrease in wool production generally reflects the decline in the global sheep population, whichfell from 1.068 billion animals as of January 1, 1993 to 1.009 billion animals as of January 1,1997. During this period, sheep numbers fell in most major sheep-producing countries,reflecting poor pasture conditions caused by drought, depressed wool prices, and a general shiftaway from sheep raising toward more profitable agricultural enterprises. Profiles of some of theworld’s leading wool producers and exporters follow.

Ibid.105
The Australian Meat and Livestock Industry, “Livestock Production Sheep,” found at Internet106
address http://www.amlc.com.au/industry/overview/sheep.htm, retrieved Oct. 2, 1997. A.H. Hides and Skins Australia Party, Ltd., “Sheepskins and Lambskins,” found at Internet107
address http://www/ozemail.com.au, retrieved Oct. 14, 1997. USDA, FAS, Agricultural Situation Annual, Australia, AGR No. AS5093, Sept. 1995.108
International Wool Textile Organization in Succession to the Commonwealth Secretariat as109
reported in USDA, ERS, Cotton and Wool Situation and Outlook Report, Nov. 1997, app. table 42. Australian Bureau of Statistics (ABS), Value of Agricultural Commodities Produced, Australia110
(7503.0); Livestock and Livestock Products, Australia (7215.0), Shearing, Wool, Production andValue, found at Internet address http://www.statistics.gov.au, retrieved Aug. 22, 1997. Ibid.111
Ibid.112
23
Australia
Australia, the world’s largest producer and exporter of wool, accounted for 31 percent of worldproduction and 64 percent of world exports in 1997. The three major groups of sheep breeds105
in Australia are those bred for the production of fine wool, those grown primarily for theproduction of meat, and the remainder that are dual-purpose sheep grown for both wool andmeat. Approximately 70 percent of Australia’s sheep are purebred Merinos bred for the106
production of fine wool, about 25 percent are of fine to medium wool crossbred types, and 5percent are coarse wool crossbred types. Sheep are kept and wool is produced throughoutAustralia; however, sheep are concentrated in the States of New South Wales, WesternAustralia, and Victoria. 107
The Australian sheep population totaled 123 million animals in 1996/97, down by 11 percentfrom 1992/93. The decline in sheep numbers reflects primarily a persistent drought in sheep-grazing areas of Eastern and Southern Australia. Drier than normal conditions existed in muchof Eastern and Southern Australia during 1994/95, with some areas in Queensland and northernNew South Wales suffering from unfavorable weather during the past 4 years. 108
Wool production declined steadily from 1.3 billion pounds in 1992/93 to 1.0 billion pounds in1996/97, or by 21 percent (table A-14), reflecting the reduction in the number of sheep as109
well as a drought-induced decline in average fleece weights (i.e., lower yields). The average110
fleece weight declined by 3 percent from 4.49 kg (9.89 pounds) in 1993/94 to 4.37kg (9.63pounds) in 1994/95. The value of wool production rose from US$1.7 billion (AUS$2.4111
billion) in 1993/94 to US$2.4 billion (AUS$3.3 billion) in 1994/95, then declined to US$2.0billion (AUS$2.7 billion) in 1995/96. 112
Most of the wool produced in Australia is exported. As reflected in table A-14, exports wereequivalent to between 85 percent and 95 percent of production (quantity) during 1993/97.Exports are mainly in the raw or grease form, although an increasing proportion of the clip ispartly processed (31 percent in 1994/95).
During 1993-97, Australian wool exports peaked at 1.1 billion pounds in marketing year1993/94 and then declined steadily to 0.834 billion pounds in 1995/96 (table A-14). Suchexports rose to 0.94 billion pounds in 1996/97. The decline in exports during 1994/95 and1995/96 reflects declining demand in many traditional export markets like Western Europe(Germany, Italy, and France) and Japan. Exports rose in 1996/97, reflecting higher export

The Sydney Morning Herald, Wool disaster now a bonanza, June 21, 1997, found at Internet113
address http://www.smh.com.au/daily/content/970621, retrieved Oct. 2, 1997. Embassy of Australia, “Sheep,” found at Internet address114
http://www.aust.emb.nw.dc.us/agricult.htm#Sheep, retrieved Oct. 2, 1997. Australia supplied approximately 40 percent of the raw wool consumed in the United States in115
1997. The Australian Wool Commission, predecessor to the Australian Wool Corp., introduced the116
flexible reserve price scheme at wool auctions. The Australian Wool Corp. was formed in 1973 withthe amalgamation of the Australian Wool Board and the Australian Wool Commission. USITC, Monthly Import/Business Review, “Wool: Reduced Demand and Increased Supply in117
the Australian Market May Offer Some Price Relief to U.S. Mills,” Dec. 1989, p. 8. Australian wool market indicator - weighted average across all wool types sold by auction;118
USDA, FAS, Annual Livestock Report, AGR No. AS7052, Aug. 1, 1997, p. 25. USITC, Monthly Import/Business Review, “Wool: Lower Floor Price in Australia Fails to119
Restore Market Confidence,” Aug. 1990, p. 4. Ibid.120
Ibid.121
24
demand in Europe and the rest of the northern hemisphere. Other important export markets113
include China and the Republic of Korea.114
Prices
As a result of Australia’s dominance in wool production and trade, the price of wool in marketsworldwide, including the United States, is influenced heavily by the price of wool in Australia.115
The United States is especially dependent on Australia for the finer grades of wool, which arenot produced in commercial quantities in the United States.
The Australian wool market operated under a Reserve Price Scheme (RPS) controlled by theAustralian Wool Corp. (AWC) during 1971-91. By setting a floor under which prices could116
not fall, the system was designed to create a degree of price stability in the market. 117
During 1987/88, global demand for wool was high, the average price paid for Australian woolpeaked at US$3.32/lb (AUS$10.03/kg), and the volume of wool reserves held by AWC was118
virtually nil. Wool prices begin to decline in May 1988 as global demand for wool dropped119
sharply. The AWC raised the floor rate in an effort to stabilize prices at a higher level,120
however reduced demand, coupled with increased production, resulted in a soft market thatcould not support Australia’s higher floor price. By the end of June 1990, AWC’s purchasesof wool reached an unprecedented 3 million bales (1 bale = 170kg).121

USITC, Monthly Import/Business Review, “Wool: Suspension of Price Supports in Australia122
and New Zealand Shakes Industry,” July 1991, p. 5. USDA, FAS, Annual Livestock Report, AS7052, Aug. 1, 1997, p. 25.123
Australian Bureau of Agricultural and Resource Economics (ABARE), “ABARE Research124
Agriculture,” found at Internet address http://www.abare.gov.au, retrieved Oct. 9, 1997.
25
In February 1991, the Australian Government suspended the RPS by which floor prices weremaintained. From a support price level of US$2.50 per pound in early February 1991, theAustralian market indicator price (based on a group of various types of wool) plunged toUS$1.52 per pound by early March—a decline of 39 percent. 122
Following the suspension of the RPS, Australian wool prices have fluctuated widely as shownin the following tabulation (Source: Australian Wool Corp):
Year (clean) per pound
Australia centsper kilogram U.S. dollars
1
1990/91 . . . . . . . . . . . . . . . . . . . . 657 2.341991/92 . . . . . . . . . . . . . . . . . . . . 557 1.951992/93 . . . . . . . . . . . . . . . . . . . . 519 1.651993/94 . . . . . . . . . . . . . . . . . . . . 547 1.721994/95 . . . . . . . . . . . . . . . . . . . . 788 2.651995/96 . . . . . . . . . . . . . . . . . . . .2 619 2.131996/97 . . . . . . . . . . . . . . . . . . . .2 610 2.171997/98 . . . . . . . . . . . . . . . . . . . .3 650 2.03
Converted to U.S. dollars per pound using average exchange rates in 1
effect (July-June in corresponding years). Estimated by the Australian Wool Corp.2
Forecast by the Australian Wool Corp. 3
Note.—Year equals July-June financial year.
The wool stockpile which peaked at 4.7 million bales in 1991 declined to 1.6 million bales in1997. Increased demand for Australian wool in export markets, coupled with relatively staticsupply, is expected to result in an increase in the average market price received by Australianwool growers to AUS$6.50kg in 1997/98.123
Marketing
Wool is marketed through public auctions, futures contracts, forward contracts, options, andprivate sales. Most shorn wool in Australia is sold by public auction with Adelaide, Fremantle,Geelong, Goulburn, Launceston, Melbourne, Newcastle, and Sydney the main selling centers.Prices of wool lots offered for sale are determined by the buyers on the day the wools areauctioned. Buyers use visual along with subjective and objective measures to assess the qualityand thus the value of the wool.124
As Australian wool producers no longer have the floor price that they had when the RPS wasin effect, they face two primary sources of income risk—uncertainty about the levels and qualityof future production and uncertainty about future prices. This uncertainty, together with thecurrent volatility of wool prices, has led to an increase in the use of forward contracts, wool

ABARE, “Wool futures: price risk management for Australian wool growers,” found at Internet125
address http://www.abare.gov.au/service/publications..., retrieved Feb. 10, 1998. Sidney Futures Exchange (SFE), “Wheat and Wool Futures Surge in 1997,” found at Internet126
address http://www.sfe.com.au..., retrieved Jan. 13, 1998. Ibid.127
Statistics New Zealand, “Sheep Breeds - 1996, Changing Profile of NZ Sheep Breeds,” found128
at Internet address http://www.stats.govt.nz/statsweb.nsf, retrieved Oct. 9, 1997. July/June marketing year.129
NZ Meat & Wool Board’s Economic Service (NZEC), Annual Review of the New Zealand130
Sheep and Beef Industry, 1996-97, p. 5. Ibid.131
Ibid., p. 35.132
Ministry of Agriculture and Forestry, New Zealand (MAF), Situation and Outlook for New133
Zealand Agriculture, 1997 (SONZA 1997), found at Internet address http://www.maf.govt.nz,retrieved June 26, 1997.
26
futures contracts, and their derivatives to help manage price risk. The Sydney Futures125
Exchange (SFE) reported that the volume of contracts traded of 21 micron Greasy Wool Futuresexceeded 10,100 in 1997, up 34 percent and equivalent to 25 million kilograms (55 millionpounds) of grease wool. In addition, two new Wool Futures contracts (19 micron and 23126
micron) were made available in January 1998 to provide market participants with a greaternumber of choices to manage their wool price risk.127
New Zealand
Sheep are raised throughout New Zealand, and producers benefit from nearly ideal climatic andgrazing conditions. Many of New Zealand’s sheep are dual-purpose breeds, producing bothmeat and wool. The most common breed of sheep is the Romney, accounting for about 58percent of the total sheep inventory (June 1996). Other important breeds include the128
Coopworth, Merino, Perendale, Corriedale, and Halfbred.
New Zealand is the world’s second-largest wool producer, accounting for 14 percent of worldproduction in marketing year 1997. During 1993-97, production peaked at 472 million129
pounds in 1994/94, declined to 439 million pounds in 1995/96, then rose slightly to 448 millionpounds in 1996/97 (table A-14). The decline in wool production reflects a decline in total130
sheep numbers. In 1993, New Zealand was especially affected by unfavorable weather thatresulted in high death rates for wool-type sheep and low per-head wool production. The sheepinventory in New Zealand declined from 53 million animals in 1993 to 47 million animals in1997, a decrease of 10 percent, reflecting in part lower wool prices and the continuedmovement, especially in northern regions, away from sheep raising and toward dairyproduction. Wool production increased in 1997, despite the decline in sheep inventory, due131
to an increase in the average shorn wool produced per animal. Shorn wool produced per animalrose by 4 percent in 1997 to 4.97 kg (11 pounds).132
Most wool produced in New Zealand has a fiber diameter greater than 30 microns. Such woolis used primarily for carpet/rug manufacture, though some is used for blankets, upholstery,outerwear, and knitwear. Wool derived from Merino sheep comprise about 5 percent of totalNew Zealand wool production (18-24 microns) and is generally used for wearing apparel.133
Wool is sold at auctions or by private sales. During the 1996/97 marketing year, 60 percent of

NZEC, Annual Review of the New Zealand Sheep and Beef Industry, 1996-97, p. 31. 134
Trade New Zealand, “New Zealand Exports,” found at Internet address135
http://www.tradenz.govt.nz/exports, retrieved Oct. 2, 1997. NZEC, Annual Review of the New Zealand Sheep and Beef Industry, 1996-97, p. 36.136
NZEC, Annual Review of the New Zealand Sheep and Beef Industry, 1995-96, p. 36. 137
NZEC, Annual Review of the New Zealand Sheep and Beef Industry, 1996-97, p. 36.138
Wool stocks held by the New Zealand Wool Board (NZWB) reached a high of 558,000 bales in139
1990/91. MAF, Situation and Outlook for New Zealand Agriculture, 1997 (SONZA 1997), found at140
Internet address http://www.maf.govt.nz, retrieved June 26, 1997. SONZA, 1997.141
"New Acts for the Meat, Wool and Pork Industry Boards,” found at Internet address142
http://www.maf.govt.nz/MAFnet/publications/sonzaf98/sonza103.htm., retrieved Sept. 22, 1998. USDA, ERS, Cotton and Wool Yearbook, app. table 37—Sheep population, wool production,143
and exports, major producing foreign countries, 1990/91-1996/97, Jan. 1998. Wool Record, “Overcapacity and low quality mar home market,” World Textile Publications,144
Ltd., Bradford, West Yorkshire, England, Apr. 1998, p. 54.
27
the wool produced was sold at auction, and the remainder was sold at private sales. About134
88 percent of New Zealand’s wool clip is exported in its raw form, the rest is processeddomestically into intermediate products such as carpet yarn and tops, or finished carpets andapparel. China (including Hong Kong), the United Kingdom, India, and Germany were the135
leading export markets for New Zealand wool, accounting for about 54 percent of the totalquantity exported during 1996/97. Other leading markets included Japan, Australia, and theUnited States.136
During 1993-97, exports of New Zealand wool reached a high of 480 million pounds in 1994,declined to 387 million pounds in 1996, and then rose slightly to 416 million pounds in 1997.Exports to China declined from 148 million pounds in 1996 to 110 million pounds in 1997,137 138
a decrease of 26 percent. The general decline in exports reflects reduced demand, lowerproduction, and the elimination of wool stocks in 1995/96. Increased competition from139 140
acrylic in the hand-knitting segment of the Chinese market and contractual problems betweenNew Zealand exporters and Chinese importers contributed to the decline in exports to China.141
The New Zealand Wool Board (NZWB), a statutory organization representing wool growers,was governed by the Wool Industry Act (1977) until its repeal by the Producer Board ActsReform Bill (Reform Bill) in December 1997. Many of the NZWB powers were repealed withthe enactment of the Reform Bill, including its power to acquire the wool clip, to negotiatefreight rates, and to license wool exporters. However, the Reform Bill provided for the directelection of directors and generally enhanced performance and accountability measures.142
China
China was the world’s third-largest wool producer in 1997, with production totaling 337 millionpounds in 1996/97, up by 29 percent from 1993 (table A-14). China’s sheep populationincreased to 140 million animals in 1997, up from 110 million animals in 1993. Over 25143
percent of China’s wool is produced in the Inner Mongolia Autonomous Region. Wool is144
classified into three grades in China: fine, semifine, and rough.
USDA, ERS, Cotton and Wool Yearbook, Nov. 1997, app. table 38—World wool trade by145
major importing and exporting countries, 1990/91-1996/97. Ibid.146
The CIS consist of the independent states of Armenia, Azerbaijan, Byelorus, Estonia, Georgia,147
Kazakhstan, Kyrgysia, Latvia, Lithuania, Moldova, Russian Federation, Tadjikistan, Turkmenistan,Ukraine, and Uzbekistan. Most sheep in the CIS are raised primarily for wool, not meat production.148
USITC staff estimate based on data from USDA, FAS attache reports.149
USDA, FAS, 1995-1996 Livestock Situation Report, Russia, RS6071, Sept. 3, 1996, p. 36,150
and USDA, FAS, Livestock Voluntary Report, KZ8003, April 8, 1998, p. 11. USDA, FAS, 1995-1996 Livestock Situation Report, Russia, RS6071, Sept. 3, 1996, p. 36.151
Ibid.152
28
Despite sizable domestic production, China is the world’s largest importer of wool. In 1997,China accounted for 17 percent of world imports, which supplied 66 percent of China’s wool145
consumption. Australia was the leading wool supplier, accounting for 57 percent, followed byNew Zealand and Uruguay, which accounted for 13 percent and 9 percent, respectively. U.S.146
wool exports to China were negligible.
China is the world’s largest producer of cashmere, with production totaling about 7 millionpounds annually and China accounts for about 60 percent of the world’s supply. The climateand geography in China are conducive for herding cashmere goats that produce high-qualitycashmere. Europe, Japan, and the United States are major export markets for Chinese cashmere.
Commonwealth of Independent States
Wool production in the Commonwealth of Independent States (CIS) declined from 456147
million pounds in 1992/93 to 220 million pounds in 1996/97, a decrease of 52 percent (tableA-14). Contributing to this decline was a near parallel decrease in the sheep population, which148
fell from 122 million in 1993 to 64 million in 1997. Main sheep-raising states include Russia,Kazakhstan, Ukraine, and Uzbekistan, accounting for over 70 percent of the CIS sheeppopulation in 1997. 149
Many factors contributed to the decline in wool production, including reduced governmentsupport, poor quality pastures, inadequate feed supplies, and reduced demand in domestic andforeign markets. According to Ovtseprom, Russia’s national sheep farming association, the150
quality of wool produced in Russia is considered inferior and cannot compete with woolproduced by other major world producers. As a result, the price received for wool is less than151
the average world price. For example, the average world price of wool is about $5.50-6.00 akilogram, but the average price per kilogram of Russian wool is about $2.00 (excludingsubsidies and compensations). 152

USDA, FAS, Livestock Annual Report, Russia, 1996, RS6065, Aug. 12, 1996, p. 4.153
USDA, FAS, 1995-1996 Livestock Situation Report, Russia, RS6071, Sept. 3, 1996, p. 37.154
USDA, FAS, Livestock Voluntary Report, KZ8003, Apr. 8, 1998, p. 11. 155
USDA, FAS, Livestock Annual Report, Buenos Aires, UY7003, June 6, 1997, p. 5.156
USDA, FAS, Livestock Annual Report, Buenos Aires, Argentina AR6050, Aug. 8, 1996, p.8.157
USDA, FAS, Livestock Annual Report, AR6050, Aug. 8, 1996, p. 10.158
29
Russia accounted for approximately 40 percent of the CIS sheep population during 1993-97.In Russia, government purchases of wool declined from 243 million pounds in 1990 to 115million pounds in 1995 and continued to decline in 1996-97. Some producers were unable tosell their remaining wool at prices high enough to cover their costs and exited the industry,resulting in a decline in sheep population. 153
In the CIS there has been a shift to private ownership of sheep from state/collective enterprises.In Russia, the number of sheep raised by state/collective enterprises declined from 64 percentof the total sheep inventory in 1993 to 48 percent in 1996. Conversely, the number of sheepraised by the private sector rose from 36 percent to 52 percent during the period. In the154
Republic of Kazakhstan, 75 percent of the sheep inventory was raised by state/collectiveenterprises and 25 percent raised by the private sector in 1992; however, by 1997 the privatesector accounted for 58 percent of the sheep inventory. 155
Uruguay
In Uruguay, many farmers raise both cattle and sheep, with the latter kept primarily for theproduction of wool. The sheep population in Uruguay declined steadily during 1993-97, from24 million animals to 20 million animals. Wool production declined from 141 million pounds1992/93 to 123 million pounds in 1995/96, then rose 12 percent to 138 million pounds in1996/97 (table A-14). The overall decline in sheep and wool production reflects the generallydepressed world wool market. In addition, returns from cattle production remain more attractivethan those from sheep and wool, encouraging some producers to reduce their investment insheep and to increase their investment in cattle. China and the European Union (Germany and156
the United Kingdom) are the primary markets for Uruguay’s wool; other markets include Braziland the United States.
Argentina
Wool production in Argentina declined steadily from 132 million pounds in 1992/93 to 90million pounds in 1996/97 (table A-14). Depressed international wool prices and depressedworldwide demand reportedly are the main factors contributing to the decline in Argentine woolproduction. 157
Sheep numbers in Argentina declined from 26 million animals in 1993 to 19 million animalsin 1996, then rose slightly to 20 million animals in 1997 as some producers started to rebuildtheir flocks. The Patagonian region accounts for approximately 60 percent of the Argentinesheep flock, the Buenos Aires region for 15 percent, and the Mesopotamia region (Entre Riosand Corrientes) for 11 percent. Unfavorable weather in Patagonia during 1995-97 resulted158

USDA, FAS, Argentine Sheep Losses, AR5057, Aug. 25, 1995, p. 2.159
USDA, FAS, Livestock Annual Report, AR7065, July 30, 1997, p. 8.160
See U.S. Government trade-related investigations described earlier in this summary.161
USDA, FAS, Livestock Annual Report, AR7065, July 30, 1997, p. 10.162
This section is adapted from International Wool Secretariat (IWS), “Wool production in South163
Africa,” found at Internet address http://www.wool.com.au.growers/sa/product/middle.html, retrievedNov. 21, 1997, unless otherwise noted.
30
in lower wool production and losses of large numbers of sheep. Severe snow storms during thewinter of 1995 led to the death of over 500,000 sheep, while drought, coupled with pasture159
overgrazing and a growing fox population (a lamb predator), contributed to the decline in sheepnumbers during 1996 and the first half of 1997. Argentine sheep are kept primarily for the160
production of wool; however, some producers raise dual purpose breeds, such as Corriedales.Wool breeds include Merino, crossbreds, Lincoln, and Criolla. Such breeds produce wools withfiber diameters ranging from fine to coarse. The majority of Argentine wool is exported, and theEU, China, CIS, and India are the primary markets.
On August 1, 1997 the U.S. Department of Commerce revoked a countervailing duty orderimposed on certain wools from Argentina. Exporters of wool from Patagonian ports receive161
small rebates to encourage processing and trade from this region; however, these rebates arebeing phased out and are expected to be eliminated in a few years.162
South Africa163
Sheep in South Africa are raised primarily for wool and mutton production. Most sheep arepurebred Merinos or dual-purpose Merino strains, including Dohne Merino, the South AfricanMutton Merino, and the Letelle. The dual-purpose breed results in an animal with a longer bodyframe that produces slightly less wool per kilogram of body weight than the Merino. Using dual-purpose breeds maximizes the income of growers as there is little difference between the qualityof the wool derived from South African dual-purpose breeds and that of wool derived frompurebred Merinos. The average Merino fleece varies depending on the region in which the sheepwas raised—4-5 kgs (9-11 pounds) from sheep raised in semi-arid regions, and up to 8 kg (18pounds) from sheep grazing on cultivated pastures. Although the South African wool clip ispredominantly a Merino clip, other breeds produce coarse and colored fibers that are alsoproduced and marketed on a limited scale. The fiber diameter ranges from 18 to 27 microns,with over 80 percent of the clip finer than 24 microns.
Wool is produced throughout most of South Africa, with the Free State and eastern States ofKwazulu Natal and Eastern Cape each accounting for 26 percent of total wool production. TheWestern Cape accounts for 19 percent of wool production, followed by the Northern Cape area(11 percent), Eastern Transvaal (9 percent) and the remaining areas (9 percent). The generictrade term for all wool produced in South Africa is “Cape Wool.”
USDA, FAS, Livestock and Meat, Pretoria, Republic of South Africa, SF6021, Aug. 1, 1996,164
p. 22 and USDA, FAS, Livestock and Meat, SF7020, June 13, 1997, p. 18. International Wool Secretariat (IWS), “Structure of the South African Wool Industry,” found at165
Internet address http://www.wool.com.au/growers/sa/structure/middle.html, retrieved Nov. 21, 1997. IWS, “Cape Wools,” found at Internet address166
http://www.wool.com.au/growers/sa/cape/middle/html, retrieved Nov. 21, 1997. Wool Record, “South Africans try to Rekindle Interest in Adult Mohair Fibre,” World Textile167
Publications, Ltd., Bradford, West Yorkshire, England, Mar. 1998, p. 45. Ibid.168
Cape Mohair and Wool, Mohair Market, Sept. 30, 1997, found at Internet address169
http://www.pe.co.za/mohair, retrieved Nov. 21, 1997.
31
Wool production in South Africa declined from 97 million pounds in 1992/93 to 82 millionpounds in 1996/97, reflecting lower sheep inventory (table A-14). The sheep populationdeclined from 21 million animals in 1992/93 to 16 million animals in 1995/96, beforeincreasing to 19 million animals in 1996/97. Drought contributed to the overall decline in thesheep inventory, and low wool prices created little incentive to expand wool production at theexpense of mutton. 164
The South African Wool Board (Board), an agricultural marketing board, represented the SouthAfrican wool industry until August 29, 1997. The Agricultural Products Marketing Act165
required the phasing out of all agricultural marketing boards; thus, the Board was replaced witha nonprofit organization: Cape Wools SA (Cape Wools). The principal functions of Cape Woolsinclude generic Cape Wool promotion, global product development and promotion, research anddevelopment, and education and training including shearer training. South African wool growersare represented by the National Woolgrowers Association of South Africa (NWGA). TheNWGA controls the majority of the seats in Cape Wools and determines the overall strategy andpolicy for implementation by the Cape Wools.
While wool in South Africa may be marketed through private agreements, the largest share ofthe clip is sold through auctions. Because much of South Africa’s wool production is exported,wool is stored in warehouses located in four major ports, Port Elizabeth, Cape Town, EastLondon, and Durban. From these ports, wool is exported to Europe, America, and the FarEast.166
South Africa is the world’s largest mohair producer, accounting for about 53 percent of theworld’s total in 1997. Such production has remained fairly constant in recent years at 12 millionpounds annually. Approximately 75 percent of South African mohair exports consist of167
semiprocessed fibers. Demand for adult mohair weakened during 1994-97, but demand for168
kid and young goat mohair remained fairly strong.169


APPENDIX ASTATISTICAL TABLES

A-2
Table A-1Wool grades based on the American blood count, English spinning count, and the micronsystem; and breeds of sheep that produce these grades
American blood count from 1 lb) Micron system (microns) Breeds
English (Bradford)spinning count (hanks
1
Fine wool . . . . . . . . . . . . 80 17.70-19.14 MerinoFine . . . . . . . . . . . . . . . . 70 19.15-20.59 RambouilletFine . . . . . . . . . . . . . . . . 64 20.60-22.04 Targhee, SouthdownHalf blood . . . . . . . . . . . . 60 to 62 22.05 to 24.94 Corriedale, ColumbiaThree-eights blood . . . . . 56 to 58 24.95 to 27.84 Panama, RomeldaleOne-fourth blood . . . . . . 50 to 54 27.85 to 30.99 Suffolk, Dorset, HampshireLow one-fourth . . . . . . . . 46 to 48 31.00 to 34.39 RomneyCommon . . . . . . . . . . . . 44 to 40 34.40 to 36.19 Cotswold, LincolnBraid . . . . . . . . . . . . . . . . 40 to 36 36.20 to 40.20 Cotswold, Lincoln
Breeds according to average grades.1
Source: This table is derived from information published by Dr. Glen Spurlock and Dr. Vern B. Swanson asreported by Texas A&M, Wool and Mohair Policy paper; and from Scientific Farm Animal Production, p. 133.
Table A-2Wool: Value of shorn wool marketed, U.S. Federal Government payments, and average pricereceived by producer, 1993-97
Year wool grown payments Total payments producerValue of shorn government government received by
U.S. Federal U.S. Federal Average price
Share of woolincome from
)))))))))))) Millions of dollars )))))))))))))) –– Percentage –– poundCents per
1993 . . . . . . . . . . . 39.1 132.9 172.0 77 0.511994 . . . . . . . . . . . 52.4 75.3 127.7 59 0.781995 . . . . . . . . . . . 64.3 36.3 100.6 36 1.041996 . . . . . . . . . . . 39.7 0.0 39.7 0 0.701997 . . . . . . . . . . . 45.2 0.0 45.2 0 0.84
Source: National Wool Act Programs 1954-1995, Fibers Analysis Div., FSA, USDA.
Table A-3Mohair: Value of mohair grown, U.S. Federal Government payments, and average price receivedby producer, 1993-97
Year mohair grown payments Total payments producerValue of shorn Government government received by
U.S. Federal U.S. Federal Average price
Share of mohairincome from
))))))))) Millions of dollars ))))))))))) )) Percentage )) poundCents per
1993 . . . . . . . . . . . 12.1 68.9 81.0 85 0.821994 . . . . . . . . . . . 32.2 21.9 54.1 40 2.561995 . . . . . . . . . . . 22.1 18.4 40.5 45 1.841996 . . . . . . . . . . . 15.5 0.0 15.5 0 1.921997 . . . . . . . . . . . 15.6 0.0 15.6 0 2.25
Source: National Wool Act Programs 1954-1995, Fibers Analysis Div., FSA, USDA.

A-3
Table A-4Wool: U.S. beginning stocks, production, imports, supply, consumption, exports, total use, and ending stocks, 1993-97
(Millions of pounds, clean basis)
Year Jan. 1 Production Imports Other supply Consumption Exports use Dec. 31 consumption production
Beginning Ending Ratio Ratiostocks Total Total stocks imports to exports to
1 2
1993 . . . . . 48.0 41.2 100.3 7.0 196.5 156.8 2.5 159.3 37.2 64 6
1994 . . . . . 37.2 36.5 91.7 42.5 207.9 153.3 2.9 156.2 51.7 60 8
1995 . . . . . 51.7 33.7 88.8 20.0 194.2 142.0 6.0 148.0 46.2 63 18
1996 . . . . . 46.2 30.0 75.4 20.0 171.6 123.3 5.7 129.0 42.6 61 19
1997 . . . . . 42.6 28.0 76.4 25.4 172.4 121.9 4.7 126.6 45.8 63 17
Other represents wool lost or in transit as estimated by the USDA.1
Imports for consumption include entries for immediate consumption and warehouse withdrawals for consumption.2
Note.—Data in this table may differ from other tables in this summary as this table includes imports from warehouse withdrawals and other woollost or in transit.
Sources: U.S. Department of Commerce, Bureau of Census and USDA, ERS, Cotton and Wool Outlook, various issues.
Table A-5U.S. Angora goat inventory and mohair production, 1993-97
Category 1993 1994 1995 1996 1997
Goat inventory (1,000 animals) . . . . . . . . . . . . . . . . . . . . . . . . . . . . . . . . . . . . . . 1,798 1,722 1,250 1,400 1,127
Mohair production:
Quantity (1,000 pounds) . . . . . . . . . . . . . . . . . . . . . . . . . . . . . . . . . . . . . . . 14,847 12,608 12,019 8,045 6,929
Value (1,000 dollars) . . . . . . . . . . . . . . . . . . . . . . . . . . . . . . . . . . . . . . . . . . . 12,066 32,247 22,089 15,486 15,563
Note.—Data are for the four major producing states (Arizona, New Mexico, Oklahoma, and Texas).
Source: Compiled from official statistics of the USDA, NASS, Wool and Mohair, and Sheep and Goats, various issues.

A-4
Table A-6Wool and related animal hair: U.S. exports of domestic merchandise, imports forconsumption, and merchandise trade balance, by selected countries and country groups,1993-971
(Million dollars)1993 1994 1995 1996 1997
U.S. exports of domestic merchandise:Australia . . . . . . . . . . . . . . . . . . . . . . . . . . . . ( ) 0 ( ) ( ) ( )2 2 2 2
New Zealand . . . . . . . . . . . . . . . . . . . . . . . . ( ) ( ) ( ) ( ) ( )2 2 2 2 2
China . . . . . . . . . . . . . . . . . . . . . . . . . . . . . . 1 1 1 1 ( )2
United Kingdom . . . . . . . . . . . . . . . . . . . . . . 7 22 14 5 5Mongolia . . . . . . . . . . . . . . . . . . . . . . . . . . . 0 0 0 0 0Uruguay . . . . . . . . . . . . . . . . . . . . . . . . . . . . 0 0 ( ) 1 02
Republic of South Africa . . . . . . . . . . . . . . . ( ) 1 ( ) 2 22 2
Canada . . . . . . . . . . . . . . . . . . . . . . . . . . . . 1 1 1 ( ) 12
Spain . . . . . . . . . . . . . . . . . . . . . . . . . . . . . . ( ) 0 ( ) ( ) ( )2 2 2 2
Italy . . . . . . . . . . . . . . . . . . . . . . . . . . . . . . . . 1 ( ) 1 1 ( )2 2
Mexico . . . . . . . . . . . . . . . . . . . . . . . . . . . . . ( ) 1 5 4 52
All other . . . . . . . . . . . . . . . . . . . . . . . . . . . . 4 10 13 6 4Total . . . . . . . . . . . . . . . . . . . . . . . . . . . . . 14 36 35 20 17
EU15 . . . . . . . . . . . . . . . . . . . . . . . . . . . . . . 9 27 20 8 8U.S. imports for consumption:
Australia . . . . . . . . . . . . . . . . . . . . . . . . . . . . 111 99 136 107 104New Zealand . . . . . . . . . . . . . . . . . . . . . . . . 22 29 35 30 33China . . . . . . . . . . . . . . . . . . . . . . . . . . . . . . 9 10 6 12 15United Kingdom . . . . . . . . . . . . . . . . . . . . . . 7 8 11 6 7Mongolia . . . . . . . . . . . . . . . . . . . . . . . . . . . 5 4 1 4 6Uruguay . . . . . . . . . . . . . . . . . . . . . . . . . . . . 8 7 5 3 4Republic of South Africa . . . . . . . . . . . . . . . 2 2 2 2 3Canada . . . . . . . . . . . . . . . . . . . . . . . . . . . . 1 1 2 2 1Spain . . . . . . . . . . . . . . . . . . . . . . . . . . . . . . ( ) ( ) 0 0 12 2
Italy . . . . . . . . . . . . . . . . . . . . . . . . . . . . . . . . ( ) 1 1 ( ) 12 2
Mexico . . . . . . . . . . . . . . . . . . . . . . . . . . . . . ( ) ( ) 1 ( ) ( )2 2 2 2
All other . . . . . . . . . . . . . . . . . . . . . . . . . . . . 9 11 13 8 5Total . . . . . . . . . . . . . . . . . . . . . . . . . . . . . 175 173 214 173 179
EU15 . . . . . . . . . . . . . . . . . . . . . . . . . . . . . . 10 12 16 9 11U.S. merchandise trade balance:
Australia . . . . . . . . . . . . . . . . . . . . . . . . . . . . -111 -99 -136 -107 -104New Zealand . . . . . . . . . . . . . . . . . . . . . . . . -22 -29 -35 -30 -33China . . . . . . . . . . . . . . . . . . . . . . . . . . . . . . -8 -9 -5 -11 -15United Kingdom . . . . . . . . . . . . . . . . . . . . . . 0 14 3 -1 -2Mongolia . . . . . . . . . . . . . . . . . . . . . . . . . . . -5 -4 -1 -4 -6Uruguay . . . . . . . . . . . . . . . . . . . . . . . . . . . . -8 -7 -5 -2 -4Republic of South Africa . . . . . . . . . . . . . . . -2 -1 -2 0 -1Canada . . . . . . . . . . . . . . . . . . . . . . . . . . . . 0 0 -1 -2 0Spain . . . . . . . . . . . . . . . . . . . . . . . . . . . . . . 0 0 0 0 -1Italy . . . . . . . . . . . . . . . . . . . . . . . . . . . . . . . . 1 -1 0 1 -1Mexico . . . . . . . . . . . . . . . . . . . . . . . . . . . . . 0 1 4 4 5All other . . . . . . . . . . . . . . . . . . . . . . . . . . . . -5 -1 0 -2 -1
Total . . . . . . . . . . . . . . . . . . . . . . . . . . . . . -161 -137 -179 -153 -162EU15 . . . . . . . . . . . . . . . . . . . . . . . . . . . . . . -1 15 4 -1 -3 Import values are based on customs value; export values are base on f.a.s. value, U.S. port of export.1
Less than $500,000.2
Source: Compiled from official statistics of the U.S. Department of Commerce.

A-5
Table A-7 Wool and related animal hair: U.S. imports by type, 1993-97 Type 1993 1994 1995 1996 1997
Quantity (1,000 pounds)Wool . . . . . . . . . . . . . . . . . . . . . . . . . 100,310 91,717 89,693 75,369 76,445Related animal hair . . . . . . . . . . . . . 5,875 5,020 3,181 3,056 3,355Mohair . . . . . . . . . . . . . . . . . . . . . . . 13 194 143 42 4
Total . . . . . . . . . . . . . . . . . . . 106,198 96,931 93,017 78,467 79,804Value (1,000 dollars)
Wool . . . . . . . . . . . . . . . . . . . . . . . . . 152,496 148,698 197,119 151,934 154,133Related animal hair . . . . . . . . . . . . . 22,897 23,907 16,501 21,412 24,895Mohair . . . . . . . . . . . . . . . . . . . . . . . 10 224 501 77 37
Total . . . . . . . . . . . . . . . . . . . 175,403 172,829 214,121 173,423 179,065Unit value (dollars per pound)
Wool . . . . . . . . . . . . . . . . . . . . . . . . . 1.52 1.62 2.20 2.02 2.02Related animal hair . . . . . . . . . . . . . 3.90 4.76 5.19 7.01 7.42Mohair . . . . . . . . . . . . . . . . . . . . . . . 0.77 1.15 3.50 1.83 9.25
Average . . . . . . . . . . . . . . . . . 1.65 1.78 2.30 2.21 2.24Source: Compiled from official statistics of the U.S. Department of Commerce.
Table A-8Wool: U.S. imports by principal suppliers, 1993-97Source 1993 1994 1995 1996 1997
Quantity (1,000 pounds)Australia . . . . . . . . . . . . . . . . . . . . . . 65,155 53,566 51,890 47,503 44,370New Zealand . . . . . . . . . . . . . . . . . . 19,240 21,676 20,137 17,727 21,131United Kingdom . . . . . . . . . . . . . . . . 5,046 6,343 7,209 3,904 3,988Uruguay . . . . . . . . . . . . . . . . . . . . . . 5,924 5,536 2,513 1,554 2,130South Africa . . . . . . . . . . . . . . . . . . . 1,292 915 891 805 1,257Canada . . . . . . . . . . . . . . . . . . . . . . . 1,312 880 1,680 1,290 1,041All other . . . . . . . . . . . . . . . . . . . . . . 2,341 2,802 5,373 2,586 2,529
Total . . . . . . . . . . . . . . . . . . . . . . 100,310 91,717 89,693 75,369 76,445Value (1,000 dollars)
Australia . . . . . . . . . . . . . . . . . . . . . . 111,347 98,793 136,075 106,518 104,143New Zealand . . . . . . . . . . . . . . . . . . 22,441 28,368 34,216 29,970 32,437United Kingdom . . . . . . . . . . . . . . . . 4,799 7,635 10,203 5,720 6,015Uruguay . . . . . . . . . . . . . . . . . . . . . . 8,123 7,462 5,262 3,093 3,921South Africa . . . . . . . . . . . . . . . . . . . 2,282 1,847 2,156 1,858 2,976Canada . . . . . . . . . . . . . . . . . . . . . . . 1,067 1,037 2,322 1,647 1,283All other . . . . . . . . . . . . . . . . . . . . . . 2,437 3,556 6,885 3,128 3,358
Total . . . . . . . . . . . . . . . . . . . . . . 152,496 148,698 197,119 151,934 154,133Unit value (dollars per pound)
Australia . . . . . . . . . . . . . . . . . . . . . . 1.71 1.84 2.62 2.24 2.35New Zealand . . . . . . . . . . . . . . . . . . 1.17 1.31 1.70 1.69 1.54United Kingdom . . . . . . . . . . . . . . . . 0.95 1.20 1.42 1.47 1.51Uruguay . . . . . . . . . . . . . . . . . . . . . . 1.37 1.35 2.09 1.99 1.84South Africa . . . . . . . . . . . . . . . . . . . 1.77 2.02 2.42 2.31 2.37Canada . . . . . . . . . . . . . . . . . . . . . . . 0.81 1.18 1.38 1.28 1.23All other . . . . . . . . . . . . . . . . . . . . . . 1.04 1.27 1.28 1.21 1.33
Average . . . . . . . . . . . . . . . . . . . 1.52 1.62 2.20 2.02 2.02Source: Compiled from official statistics of the U.S. Department of Commerce.
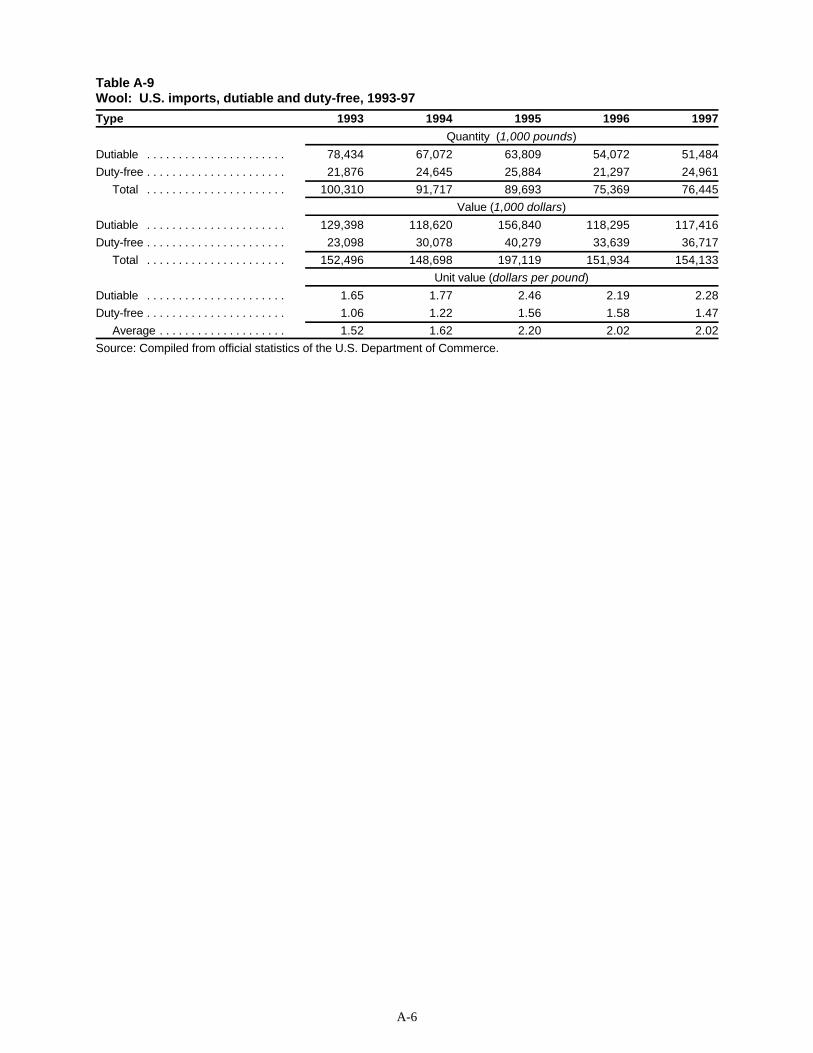
A-6
Table A-9Wool: U.S. imports, dutiable and duty-free, 1993-97
Type 1993 1994 1995 1996 1997
Quantity (1,000 pounds)
Dutiable . . . . . . . . . . . . . . . . . . . . . . 78,434 67,072 63,809 54,072 51,484
Duty-free . . . . . . . . . . . . . . . . . . . . . . 21,876 24,645 25,884 21,297 24,961
Total . . . . . . . . . . . . . . . . . . . . . . 100,310 91,717 89,693 75,369 76,445
Value (1,000 dollars)
Dutiable . . . . . . . . . . . . . . . . . . . . . . 129,398 118,620 156,840 118,295 117,416
Duty-free . . . . . . . . . . . . . . . . . . . . . . 23,098 30,078 40,279 33,639 36,717
Total . . . . . . . . . . . . . . . . . . . . . . 152,496 148,698 197,119 151,934 154,133
Unit value (dollars per pound)
Dutiable . . . . . . . . . . . . . . . . . . . . . . 1.65 1.77 2.46 2.19 2.28
Duty-free . . . . . . . . . . . . . . . . . . . . . . 1.06 1.22 1.56 1.58 1.47
Average . . . . . . . . . . . . . . . . . . . . 1.52 1.62 2.20 2.02 2.02
Source: Compiled from official statistics of the U.S. Department of Commerce.

A-7
Table A-10Wool and related animal hair; Harmonized Tariff Schedule subheading; description; U.S. col. 1 and special rates of duty as of1
Jan. 1, 1998; U.S. exports, 1997; and U.S. imports, 1997 Col. 1 rate of duty U.S. U.S.as of Jan. 1, 1998 exports imports
HTSsubheading Description General Special 1997 19972
Thousand dollarsWool, not carded or combed:
5101.11.10 Unimproved wool and other wool, not finer than 46s, greasy, shornfor special uses . . . . . . . . . . . . . . . . . . . . . . . . . . . . . . . . . . . . . . . . . . . . . Free 3,046 1,2883
5101.11.20 Unimproved wool and other wool not finer than 40s, greasy, shorn . . . . . . Free ( ) 10,2423
5101.11.40 Unimproved wool, finer than 40s but not finer than 44s, greasy, shorn . . . . Free ( ) 2,7563
5101.11.50 Unimproved wool, finer than 44s but not finer than 46s, greasy, shorn . . . . Free ( ) 1,1283
5101.11.60 Wool, finer than 46s, greasy, shorn . . . . . . . . . . . . . . . . . . . . . . . . . . . . . . . . 19.8¢ clean kg Free (CA,E,IL,J,MX) ( ) 90,7643
5101.19.10 Unimproved wool; other wool not finer than 46s, greasy, not shorn,for special uses . . . . . . . . . . . . . . . . . . . . . . . . . . . . . . . . . . . . . . . . . . . . . Free 154 1314
5101.19.20 Unimproved wool; other wool not finer than 40s, greasy, not shorn . . . . . . Free ( ) 6614
5101.19.40 Unimproved wool; finer than 40s but not finer than 44s, greasy,not shorn . . . . . . . . . . . . . . . . . . . . . . . . . . . . . . . . . . . . . . . . . . . . . . . . . . Free ( ) 7834
5101.19.50 Unimproved wool; finer than 44s but not finer than 46s, greasy,not shorn . . . . . . . . . . . . . . . . . . . . . . . . . . . . . . . . . . . . . . . . . . . . . . . . . . Free ( ) 2214
5101.19.60 Wool, finer than 46s, greasy, not shorn . . . . . . . . . . . . . . . . . . . . . . . . . . . . 19.8¢ clean kg Free (CA,E,IL,J,MX) ( ) 5044
5101.21.10 Unimproved wool; other wool not finer than 46s, degreased, notcarbonized, shorn, for special uses . . . . . . . . . . . . . . . . . . . . . . . . . . . . . Free 388 2,4106
5101.21.15 Unimproved wool; other wool not finer than 40s, degreased, notcarbonized, shorn . . . . . . . . . . . . . . . . . . . . . . . . . . . . . . . . . . . . . . . . . . . Free ( ) 1,2165
5101.21.30 Other wool; finer than 40s but not finer than 44s, degreased,not carbonized, shorn . . . . . . . . . . . . . . . . . . . . . . . . . . . . . . . . . . . . . . . . . . Free ( ) 7,5835
5101.21.35 Other wool; finer than 44s but not finer than 46s, degreased,not carbonized, shorn . . . . . . . . . . . . . . . . . . . . . . . . . . . . . . . . . . . . . . . . Free ( ) 2,6925
5101.21.40 Wool, finer than 46s, degreased, not carbonized, shorn . . . . . . . . . . . . . . . 21.8¢ clean kg Free (CA,E,IL,J,MX,) ( ) 20,0205
5101.21.65 Unimproved wool; other wool, not finer than 46s, degreased, shorn,not carbonized . . . . . . . . . . . . . . . . . . . . . . . . . . . . . . . . . . . . . . . . . . . . . . Free ( ) 1,8245
5101.21.70 Other wool finer than 46s, degreased, shorn, not carbonized . . . . . . . . . 6.9¢/kg +5.6% Free (CA,IL,MX) ( ) 05
See footnotes at end of table.
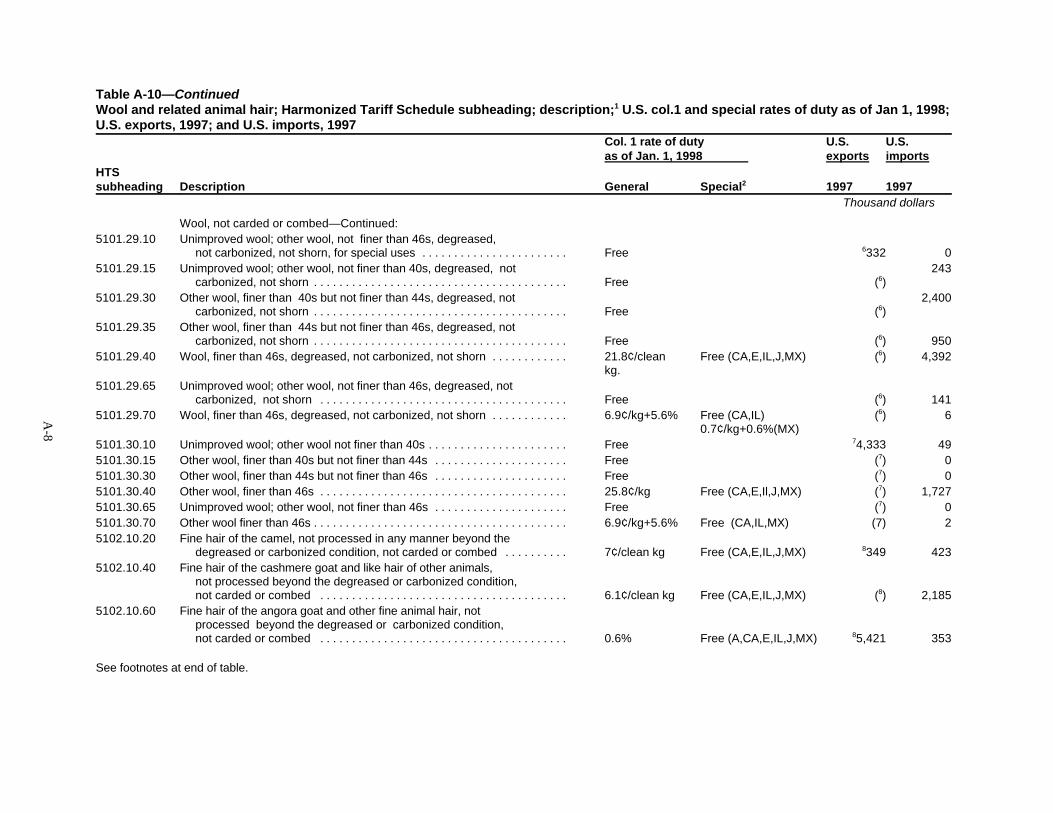
A-8
Table A-10—ContinuedWool and related animal hair; Harmonized Tariff Schedule subheading; description; U.S. col.1 and special rates of duty as of Jan 1, 1998;1
U.S. exports, 1997; and U.S. imports, 1997 Col. 1 rate of duty U.S. U.S.as of Jan. 1, 1998 exports imports
HTSsubheading Description General Special 1997 19972
Thousand dollars
Wool, not carded or combed—Continued:5101.29.10 Unimproved wool; other wool, not finer than 46s, degreased,
not carbonized, not shorn, for special uses . . . . . . . . . . . . . . . . . . . . . . . Free 332 06
5101.29.15 Unimproved wool; other wool, not finer than 40s, degreased, not 243carbonized, not shorn . . . . . . . . . . . . . . . . . . . . . . . . . . . . . . . . . . . . . . . . Free ( )6
5101.29.30 Other wool, finer than 40s but not finer than 44s, degreased, not 2,400carbonized, not shorn . . . . . . . . . . . . . . . . . . . . . . . . . . . . . . . . . . . . . . . . Free ( )6
5101.29.35 Other wool, finer than 44s but not finer than 46s, degreased, notcarbonized, not shorn . . . . . . . . . . . . . . . . . . . . . . . . . . . . . . . . . . . . . . . . Free ( ) 9506
5101.29.40 Wool, finer than 46s, degreased, not carbonized, not shorn . . . . . . . . . . . . 21.8¢/clean Free (CA,E,IL,J,MX) ( ) 4,392kg.
6
5101.29.65 Unimproved wool; other wool, not finer than 46s, degreased, notcarbonized, not shorn . . . . . . . . . . . . . . . . . . . . . . . . . . . . . . . . . . . . . . . Free ( ) 1416
5101.29.70 Wool, finer than 46s, degreased, not carbonized, not shorn . . . . . . . . . . . . 6.9¢/kg+5.6% Free (CA,IL) ( ) 60.7¢/kg+0.6%(MX)
6
5101.30.10 Unimproved wool; other wool not finer than 40s . . . . . . . . . . . . . . . . . . . . . . Free 4,333 497
5101.30.15 Other wool, finer than 40s but not finer than 44s . . . . . . . . . . . . . . . . . . . . . Free ( ) 07
5101.30.30 Other wool, finer than 44s but not finer than 46s . . . . . . . . . . . . . . . . . . . . . Free ( ) 07
5101.30.40 Other wool, finer than 46s . . . . . . . . . . . . . . . . . . . . . . . . . . . . . . . . . . . . . . . 25.8¢/kg Free (CA,E,Il,J,MX) ( ) 1,7277
5101.30.65 Unimproved wool; other wool, not finer than 46s . . . . . . . . . . . . . . . . . . . . . Free ( ) 07
5101.30.70 Other wool finer than 46s . . . . . . . . . . . . . . . . . . . . . . . . . . . . . . . . . . . . . . . . 6.9¢/kg+5.6% Free (CA,IL,MX) (7) 25102.10.20 Fine hair of the camel, not processed in any manner beyond the
degreased or carbonized condition, not carded or combed . . . . . . . . . . 7¢/clean kg Free (CA,E,IL,J,MX) 349 4238
5102.10.40 Fine hair of the cashmere goat and like hair of other animals,not processed beyond the degreased or carbonized condition,not carded or combed . . . . . . . . . . . . . . . . . . . . . . . . . . . . . . . . . . . . . . . 6.1¢/clean kg Free (CA,E,IL,J,MX) ( ) 2,1858
5102.10.60 Fine hair of the angora goat and other fine animal hair, notprocessed beyond the degreased or carbonized condition,not carded or combed . . . . . . . . . . . . . . . . . . . . . . . . . . . . . . . . . . . . . . . 0.6% Free (A,CA,E,IL,J,MX) 5,421 3538
See footnotes at end of table.

Table A-10—ContinuedWool and related animal hair; Harmonized Tariff Schedule subheading; description; U.S. col.1 and special rates of duty as of Jan 1, 1998;1
U.S. exports, 1997; and U.S. imports, 1997 Col. 1 rate of duty U.S. U.S.as of Jan. 1, 1998 exports imports
HTSsubheading Description General Special 1997 19972
Thousand dollars
A-9
Wool, not carded or combed--Continued:5102.10.80 Fur, prepared for hatters’ use, not carded or combed . . . . . . . . . . . . . . . . . Free 2,168 1,3329
5102.10.90 Fine animal hair, further processed, not carded or combed . . . . . . . . . . . . . 5.8¢/kg+4.8% Free (CA,IL,MX) ( ) 20,2159
5102.20.00 Coarse animal hair, not carded or combed . . . . . . . . . . . . . . . . . . . . . . . . . . Free 340 423 Some tariff descriptions have been condensed. For the precise legal tariff description see HTS Chapter 51.1
Programs under which special tariff treatment may be provided and the corresponding symbols for such programs as they are indicated in the “Special” subcolumn2
are as follows: Generalized System of Preferences (A); Goods of Canada pursuant to the NAFTA (CA); Caribbean Basin Economic Recovery Act (E); United States-Israel Free Trade Agreement (IL); Andean Trade Preference Act (J); Good of Mexico pursuant to the NAFTA (MX). Exports under Schedule B subheading 5101.11.10 are reported under the first relevant subheading in the table.3
Imports under HTS subheadings 5101.19.10, 5101.19.20, 5101.19.40, 5101.19.50, and 5101.19.60 correspond to exports under Schedule B subheading4
5101.19.00. Exports under Schedule B subheading 5101.19.00 are reported under the first relevant subheading in the table. Imports under HTS subheadings 5101.21.10, 5101.21.15, 5101.21.30, 5101.21.35, 5101.21.40, 5101.21.65, and 5101.21.70 correspond to exports under5
Schedule B subheading 5101.21.00. Exports under Schedule B subheading 5101.21.00 are reported under the first relevant subheading in the table. Imports under HTS subheadings 5101.29.10, 5101.29.15, 5101.29.30, 5101.29.35, 5101.29.40, 5101.29.65, and 5101.29.70 correspond to exports under6
Schedule B subheading 5101.29.00. Exports under Schedule B subheading 5101.29.00 are reported under the first relevant subheading in the table. Imports under HTS subheadings 5101.30.10, 5101.30.15, 5101.30.30, 5101.30.40, 5101.30.65, and 5101.30.70 correspond to exports under Schedule B7
subheading 5101.30.00. Exports under Schedule B subheading 5101.30.00 are reported under the first relevant subheading in the table. Imports under HTS subheadings 5102.10.20, 5102.10.40, and 5102.10.60 correspond to exports under Schedule B subheadings 5102.10.60.30 and8
5102.10.70.00. Exports under Schedule B subheadings 5102.10.60.30 and 5102.10.70.00 are reported under the first relevant subheading in the table. Imports under HTS subheadings 5102.10.80 and 5201.10.90 correspond to exports under Schedule B subheading 5102.10.85. Exports under Schedule B9
subheading 5102.10.85 are reported under the first relevant subheading in the table.
Source: U.S. exports and imports compiled from official statistics of the U.S. Department of Commerce.

A-10
Table A-11Wool and related animal hair: U.S. exports by type, 1993-97Type 1993 1994 1995 1996 1997
Quantity (1,000 pounds)Wool . . . . . . . . . . . . . . . . . . . . . . . . . . . . . . . . . 2,529 2,862 6,041 5,714 4,731Mohair . . . . . . . . . . . . . . . . . . . . . . . . . . . . . . . 6,671 8,735 4,870 3,538 1,889Related animal hair . . . . . . . . . . . . . . . . . . . . . 2,831 4,050 1,082 562 754
Total . . . . . . . . . . . . . . . . . . . . . . . . . . . . . 12,031 15,647 11,993 9,815 7,374Value (1,000 dollars)
Wool . . . . . . . . . . . . . . . . . . . . . . . . . . . . . . . . . 3,348 3,778 12,605 9,078 8,253Mohair . . . . . . . . . . . . . . . . . . . . . . . . . . . . . . . 7,452 22,999 15,937 8,090 5,421Related animal hair . . . . . . . . . . . . . . . . . . . . . 2,816 9,156 6,300 2,501 2,856
Total . . . . . . . . . . . . . . . . . . . . . . . . . . . . . 13,616 35,933 34,842 19,669 16,530Unit value (dollars per pound)
Wool . . . . . . . . . . . . . . . . . . . . . . . . . . . . . . . . . 1.32 1.32 2.09 1.59 1.74Mohair . . . . . . . . . . . . . . . . . . . . . . . . . . . . . . . 1.12 2.63 3.27 2.29 2.87Related animal hair . . . . . . . . . . . . . . . . . . . . . 0.99 2.26 5.82 4.45 3.79
Average . . . . . . . . . . . . . . . . . . . . . . . . . . . 1.13 2.30 2.91 2.00 2.24Source: Compiled from official statistics of the U.S. Department of Commerce.
Table A-12Wool: U.S. exports by major markets, 1993-97Country 1993 1994 1995 1996 1997
Quantity (1,000 pounds)Mexico . . . . . . . . . . . . . . . . . . . . . . . . . . . 9 699 1,773 1,861 1,863Germany . . . . . . . . . . . . . . . . . . . . . . . . . . 273 313 595 690 924United Kingdom . . . . . . . . . . . . . . . . . . . . 558 148 157 331 650Belgium . . . . . . . . . . . . . . . . . . . . . . . . . . 108 71 35 0 317Canada . . . . . . . . . . . . . . . . . . . . . . . . . . . 284 293 295 198 187Italy . . . . . . . . . . . . . . . . . . . . . . . . . . . . . . 172 223 190 864 243All other . . . . . . . . . . . . . . . . . . . . . . . . . . 1,125 1,115 2,996 1,770 547
Total . . . . . . . . . . . . . . . . . . . . . . . . . 2,529 2,862 6,041 5,714 4,731Value (1,000 dollars)
Mexico . . . . . . . . . . . . . . . . . . . . . . . . . . . 14 1,028 4,528 4,062 4,458Germany . . . . . . . . . . . . . . . . . . . . . . . . . . 209 332 735 754 1,060United Kingdom . . . . . . . . . . . . . . . . . . . . 621 197 239 476 891Belgium . . . . . . . . . . . . . . . . . . . . . . . . . . 134 112 61 0 404Canada . . . . . . . . . . . . . . . . . . . . . . . . . . . 486 497 494 334 318Italy . . . . . . . . . . . . . . . . . . . . . . . . . . . . . . 157 164 312 916 280All other . . . . . . . . . . . . . . . . . . . . . . . . . . 1,727 1,448 6,236 2,536 842
Total . . . . . . . . . . . . . . . . . . . . . . . . . 3,348 3,778 12,605 9,078 8,253Unit value (dollars per pound)
Mexico . . . . . . . . . . . . . . . . . . . . . . . . . . . 1.56 1.47 2.55 2.18 2.39Germany . . . . . . . . . . . . . . . . . . . . . . . . . . 0.77 1.06 1.24 1.09 1.15United Kingdom . . . . . . . . . . . . . . . . . . . . 1.11 1.33 1.52 1.44 1.37Belgium . . . . . . . . . . . . . . . . . . . . . . . . . . 1.24 1.58 1.74 0.00 1.27Canada . . . . . . . . . . . . . . . . . . . . . . . . . . . 1.71 1.70 1.67 1.69 1.70Italy . . . . . . . . . . . . . . . . . . . . . . . . . . . . . . 0.91 0.74 1.64 1.06 1.15All other . . . . . . . . . . . . . . . . . . . . . . . . . . 1.54 1.30 2.08 1.43 1.54
Average . . . . . . . . . . . . . . . . . . . . . . 1.32 1.32 2.09 1.59 1.74Source: Compiled from official statistics of the U.S. Department of Commerce.

A-11
Table A-13Wool: U.S. exports by type, 1993-97Type 1993 1994 1995 1996 1997
Quantity (1,000 pounds, clean basis)Carbonized . . . . . . . . . . . . . . . . . . . . . . . . 880 840 1,367 794 1,773Shorn . . . . . . . . . . . . . . . . . . . . . . . . . . . . 1,111 1,543 2,370 3,629 2,659Pulled . . . . . . . . . . . . . . . . . . . . . . . . . . . . 540 481 2,304 1,294 300 Total . . . . . . . . . . . . . . . . . . . . . . . . . . 2,531 2,864 6,041 5,714 4,731
Value (1,000 dollars)Carbonized . . . . . . . . . . . . . . . . . . . . . . . . 1,009 967 4,071 2,185 4,333Shorn . . . . . . . . . . . . . . . . . . . . . . . . . . . . 1,378 1,994 4,064 5,143 3,435Pulled . . . . . . . . . . . . . . . . . . . . . . . . . . . . 961 817 4,470 1,749 485 Total . . . . . . . . . . . . . . . . . . . . . . . . . . 3,348 3,778 12,605 9,078 8,253
Unit value (dollars per pound)Carbonized . . . . . . . . . . . . . . . . . . . . . . . . 1.15 1.15 2.97 2.75 2.44Shorn . . . . . . . . . . . . . . . . . . . . . . . . . . . . 1.24 1.29 1.71 1.42 1.29Pulled . . . . . . . . . . . . . . . . . . . . . . . . . . . . 1.78 1.70 1.94 1.35 1.62 Average . . . . . . . . . . . . . . . . . . . . . . . . 1.32 1.32 2.09 1.59 1.74Source: Compiled from official statistics of the U.S. Department of Commerce.
Table A-14Wool: Production and exports by major foreign producing countries 1992/93-1996/971
1992/93 1993/94 1994/95 1995/96 1996/97Wool production: (Million pounds, clean)
Australia . . . . . . . . . . . . . . . . . . . . . . . . . . . 1,263 1,199 1,043 996 994New Zealand . . . . . . . . . . . . . . . . . . . . . . . 426 472 470 439 448China . . . . . . . . . . . . . . . . . . . . . . . . . . . . . 262 265 282 306 337CIS . . . . . . . . . . . . . . . . . . . . . . . . . . . . . .2 456 425 346 273 220Uruguay . . . . . . . . . . . . . . . . . . . . . . . . . . . 141 146 132 123 138Argentina . . . . . . . . . . . . . . . . . . . . . . . . . . 132 115 106 95 90South Africa . . . . . . . . . . . . . . . . . . . . . . . . 97 95 84 86 82
World . . . . . . . . . . . . . . . . . . . . . . . 3,788 3,688 3,426 3,272 3,236Wool exports: (Million pounds, clean)
Australia . . . . . . . . . . . . . . . . . . . . . . . . . . . 1,069 1,083 916 834 940New Zealand . . . . . . . . . . . . . . . . . . . . . . . 383 480 451 387 416Argentina . . . . . . . . . . . . . . . . . . . . . . . . . . 64 91 73 48 50South Africa . . . . . . . . . . . . . . . . . . . . . . . . 42 45 38 42 30Uruguay . . . . . . . . . . . . . . . . . . . . . . . . . . . 40 59 28 26 29
Total . . . . . . . . . . . . . . . . . . . . . . . . 1,599 1,758 1,506 1,336 1,465 July-June marketing year.1
Commonwealth of Independent States, previously referred to as the Soviet Union.2
Source: International Wool Textile Organization in Succession to the Commonwealth Secretariat.


APPENDIX BUNITED STATES STANDARDS FORGRADES OF WOOL


APPENDIX CEXPLANATION OF TARIFF AND TRADEAGREEMENT TERMS

C-2
TARIFF AND TRADE AGREEMENTTERMS
In the Harmonized Tariff Schedule of the United States (HTS), chapters 1 through 97 coverall goods in trade and incorporate in the tariff nomenclature the internationally adoptedHarmonized Commodity Description and Coding System through the 6-digit level of productdescription. Subordinate 8-digit product subdivisions, either enacted by Congress or proclaimedby the President, allow more narrowly applicable duty rates; 10-digit administrative statisticalreporting numbers provide data of national interest. Chapters 98 and 99 contain special U.S.classifications and temporary rate provisions, respectively. The HTS replaced the TariffSchedules of the United States (TSUS) effective January 1, 1989.
Duty rates in the general subcolumn of HTS column 1 are most-favored-nation (now referredto as normal trade relations) rates, many of which have been eliminated or are being reduced asconcessions resulting from the Uruguay Round of Multilateral Trade Negotiations. Column 1-general duty rates apply to all countries except those listed in HTS general note 3(b)(Afghanistan, Cuba, Laos, North Korea, and Vietnam), which are subject to the statutory ratesset forth in column 2. Specified goods from designated general-rate countries may be eligiblefor reduced rates of duty or for duty-free entry under one or more preferential tariff programs.Such tariff treatment is set forth in the special subcolumn of HTS rate of duty column 1 or inthe general notes. If eligibility for special tariff rates is not claimed or established, goods aredutiable at column 1-general rates. The HTS does not enumerate those countries as to whicha total or partial embargo has been declared.
The Generalized System of Preferences (GSP) affords nonreciprocal tariff preferences todeveloping countries to aid their economic development and to diversify and expand theirproduction and exports. The U.S. GSP, enacted in title V of the Trade Act of 1974 for 10 yearsand extended several times thereafter, applies to merchandise imported on or after January 1,1976 and before the close of June 30, 1999. Indicated by the symbol "A", "A*", or "A+" in thespecial subcolumn, the GSP provides duty-free entry to eligible articles the product of andimported directly from designated beneficiary developing countries, as set forth in general note4 to the HTS.
The Caribbean Basin Economic Recovery Act (CBERA) affords nonreciprocal tariffpreferences to developing countries in the Caribbean Basin area to aid their economicdevelopment and to diversify and expand their production and exports. The CBERA, enactedin title II of Public Law 98-67, implemented by Presidential Proclamation 5133 of November30, 1983, and amended by the Customs and Trade Act of 1990, applies to merchandise entered,or withdrawn from warehouse for consumption, on or after January 1, 1984. Indicated by thesymbol "E" or "E*" in the special subcolumn, the CBERA provides duty-free entry to eligiblearticles, and reduced-duty treatment to certain other articles, which are the product of andimported directly from designated countries, as set forth in general note 7 to the HTS.

C-3
Free rates of duty in the special subcolumn followed by the symbol "IL" are applicable toproducts of Israel under the United States-Israel Free Trade Area Implementation Act of1985 (IFTA), as provided in general note 8 to the HTS.
Preferential nonreciprocal duty-free or reduced-duty treatment in the special subcolumnfollowed by the symbol "J" or "J*" in parentheses is afforded to eligible articles the product ofdesignated beneficiary countries under the Andean Trade Preference Act (ATPA), enacted astitle II of Public Law 102-182 and implemented by Presidential Proclamation 6455 of July 2,1992 (effective July 22, 1992), as set forth in general note 11 to the HTS.
Preferential free rates of duty in the special subcolumn followed by the symbol "CA" areapplicable to eligible goods of Canada, and rates followed by the symbol "MX" are applicableto eligible goods of Mexico, under the North American Free Trade Agreement, as providedin general note 12 to the HTS and implemented effective January 1, 1994 by PresidentialProclamation 6641 of December 15, 1993. Goods must originate in the NAFTA region underrules set forth in general note 12(t) and meet other requirements of the note and applicableregulations.
Other special tariff treatment applies to particular products of insular possessions (generalnote 3(a)(iv)), products of the West Bank and Gaza Strip (general note 3(a)(v)), goodscovered by the Automotive Products Trade Act (APTA) (general note 5) and the Agreementon Trade in Civil Aircraft (ATCA) (general note 6), articles imported from freely associatedstates (general note 10), pharmaceutical products (general note 13), and intermediatechemicals for dyes (general note 14).
The General Agreement on Tariffs and Trade 1994 (GATT 1994), pursuant to the AgreementEstablishing the World Trade Organization, is based upon the earlier GATT 1947 (61 Stat. (pt.5) A58; 8 UST (pt. 2) 1786) as the primary multilateral system of disciplines and principlesgoverning international trade. Signatories' obligations under both the 1994 and 1947agreements focus upon most-favored-nation treatment, the maintenance of scheduled concessionrates of duty, and national treatment for imported products; the GATT also provides the legalframework for customs valuation standards, "escape clause" (emergency) actions, antidumpingand countervailing duties, dispute settlement, and other measures. The results of the UruguayRound of multilateral tariff negotiations are set forth by way of separate schedules ofconcessions for each participating contracting party, with the U.S. schedule designated asSchedule XX. Pursuant to the Agreement on Textiles and Clothing (ATC) of the GATT 1994,member countries are phasing out restrictions on imports under the prior "ArrangementRegarding International Trade in Textiles" (known as the Multifiber Arrangement (MFA)).Under the MFA, which was a departure from GATT 1947 provisions, importing and exportingcountries negotiated bilateral agreements limiting textile and apparel shipments, and importingcountries could take unilateral action in the absence or violation of an agreement. Quantitativelimits had been established on imported textiles and apparel of cotton, other vegetable fibers,wool, man-made fibers or silk blends in an effort to prevent or limit market disruption in theimporting countries. The ATC establishes notification and safeguard procedures, along withother rules concerning the customs treatment of textile and apparel shipments, and calls for theeventual complete integration of this sector into the GATT 1994 over a ten-year period, or byJan. 1, 2005.


APPENDIX DU.S. BASE RATE AND BOUND RATE OFDUTY