Embed Size (px)
Citation preview

i | P a g e
Worcester Polytechnic Institute Mechanical Engineering Department
Major Qualifying Project
Final Report
Switch-Mode CVT: Torsion Spring
Thursday, April 28, 2011
Submitted by
____________________ ____________________ ____________________
Michael S. Collins Matthew A. Rotier Scott R. Woodnorth
Approved by
___________________________
Professor James D. Van de Ven

ii | P a g e
Abstract
A Switch-Mode Continuously Variable Transmission is the mechanical analog of a boost
converter circuit. The system uses a high-speed clutch to transfer packets of energy from a
flywheel to a torsion spring, which drives the output. This project focuses on the design of a
torsion spring, which can deflect 180 deg., has a linear spring rate, and fits into a car
transmission. It must also have low inertia, to ensure efficiency, and be back-drivable, for
regenerative braking. Two unique designs were prototyped then tested using a simulated drive-
train consisting of a flywheel input, an electromagnetic clutch, and a disc brake or flywheel. By
comparing qualitative and quantitative characteristics of each, the group chose one design
which was developed full-scale and tested.

iii | P a g e
Acknowledgements
The group would like to thank:
Professor Robert Norton (WPI)
Dr. Adriana Hera (WPI)
Neil Whitehouse (WPI)
Peter Lentros (Lentros Engineering Inc.)
Professor James Van de Ven (WPI Project Advisor)
David Collins (off campus machining)

iv | P a g e
Table of Contents
Abstract ............................................................................................................................................ii
Acknowledgements ......................................................................................................................... iii
Table of Contents ............................................................................................................................ iv
List of Figures ................................................................................................................................. vii
List of Tables .................................................................................................................................... x
Introduction .................................................................................................................................... 1
Background ..................................................................................................................................... 2
Hybrid Systems ............................................................................................................................ 4
CVT History .................................................................................................................................. 6
Switch-Mode PWM CVT Concept ................................................................................................ 7
Torsion Spring ............................................................................................................................ 10
Previous Research ..................................................................................................................... 10
Background Research ................................................................................................................ 11
Torsion Spring Background ....................................................................................................... 11
Patents....................................................................................................................................... 12
Helical Torsion Springs .............................................................................................................. 14
Cams .......................................................................................................................................... 15
Objectives...................................................................................................................................... 17
Design ............................................................................................................................................ 18
Initial Designs ............................................................................................................................ 18
Magnetic Damper .................................................................................................................. 18
Cam Separation Spring .......................................................................................................... 20
Magnetic Series Spring .......................................................................................................... 20
v | P a g e
Helical Spring ......................................................................................................................... 21
Wire Spring ............................................................................................................................ 22
Rotini Spring .......................................................................................................................... 22
Machined Spring .................................................................................................................... 23
Torsion Piston ........................................................................................................................ 24
Decision Matrix I .................................................................................................................... 24
Alpha Prototype Designs ........................................................................................................... 25
Cam Separation Spring .......................................................................................................... 25
Series Spring .......................................................................................................................... 28
Machined Spring .................................................................................................................... 33
Methodology ................................................................................................................................. 34
Testing System Fabrication ....................................................................................................... 34
Virtual Interface ........................................................................................................................ 39
System Control ...................................................................................................................... 40
Data Collection ...................................................................................................................... 42
Testing Procedure ......................................................................................................................... 44
Basic Procedures .................................................................................................................... 44
Series Spring .......................................................................................................................... 46
Cam Spring ............................................................................................................................. 46
Results ........................................................................................................................................... 47
Round 1 ..................................................................................................................................... 47
Qualitative Results ................................................................................................................. 47
Quantitative Results .............................................................................................................. 48
Round 2 ..................................................................................................................................... 52

vi | P a g e
Qualitative Results ................................................................................................................. 52
Quantitative Results .............................................................................................................. 52
Conclusions and Recommendations ............................................................................................. 54
References .................................................................................................................................... 57
Appendix ....................................................................................................................................... 59
Appendix A – Round 1 Plots ...................................................................................................... 59
Cam Spring ............................................................................................................................. 59
Series Spring .......................................................................................................................... 69
Appendix B – Round 2 Plots ...................................................................................................... 75
Appendix C – Photo Documentation ......................................................................................... 78

vii | P a g e
List of Figures
Figure 1: Energy Flow in the US, 2009. (Lawrence Livermore National Laboratories, US DOE) .... 3
Figure 2: Crude Oil Prices 1947-2009 (Williams, 2007) .................................................................. 3
Figure 3: Energy vs. Power Density of Various Technologies (Baseley et. al., 2007) ..................... 5
Figure 4: Toroidal Continuously Variable Transmission (Harris) .................................................... 6
Figure 5: Switch Mode PWM CVT Concept ..................................................................................... 7
Figure 6: Electrical Boost Converter Circuit .................................................................................... 8
Figure 7: Pulse-Width Modulation Signal (Anonymous, 2010) ...................................................... 9
Figure 8: PWM Signal of Switch-Mode CVT .................................................................................... 9
Figure 9: Switch-Mode CVT System and PWM Signal................................................................... 10
Figure 10: Original Torsion Spring Design (Morocco, Lambusta, DeMalia, & Araujo, 2009) ....... 11
Figure 11: Torsion Spring Type Damper Disc (Takeuchi, 1992) .................................................... 13
Figure 12: Torsion Spring Design (Jonsson, 1954) ........................................................................ 14
Figure 13: Rectangular Cross Section Spring Calculations (SAE International, 1996) .................. 15
Figure 14: Cam Face Force Diagram ............................................................................................. 16
Figure 15: Magnetic Damper Iteration 1 ...................................................................................... 19
Figure 16: Magnetic Damper Iteration 2 ...................................................................................... 19
Figure 17: Magnetic Damper Iteration 3 ...................................................................................... 19
Figure 18: Open face cam design .................................................................................................. 20
Figure 19: Magnetic Series Spring Design ..................................................................................... 21
Figure 20: Machined Spring .......................................................................................................... 23
Figure 21: Mirror Cam Assembly .................................................................................................. 26
Figure 22: Cam Spring Final Design ............................................................................................... 28
Figure 23: Torsion Spring Type Damper Disc (Takeuchi, 1992) .................................................... 29
Figure 24: Series Spring Conceptual Design.................................................................................. 30
Figure 25: Series Spring Iteration 2 ............................................................................................... 30
Figure 26: Series Spring Iteration 3 ............................................................................................... 31
Figure 27: Series Spring FEA Analysis ............................................................................................ 32
Figure 28: Series Spring Iteration 4 ............................................................................................... 32

viii | P a g e
Figure 29 - Testing Assembly with Cam Spring Prototype Installed ............................................. 35
Figure 30: Base of Test Assembly (Bottom Side) .......................................................................... 37
Figure 31: Safety Enclosure - Profile View .................................................................................... 38
Figure 32: Safety Enclosure with Test Stand ................................................................................. 38
Figure 33: Testing VI Block Diagram ............................................................................................. 40
Figure 34: Electromagnetic Clutch Control Circuit ....................................................................... 41
Figure 35: Testing VI Front Panel .................................................................................................. 42
Figure 36: Example Angular Displacement, Velocity, and Acceleration Curves (Cam Spring) ..... 50
Figure 37: Example Angular Displacement, Velocity, and Acceleration Curves (Series Spring) ... 50
Figure 38: Round 1 (left) and Round 2 (right) Results (600 RPMs and 50% Duty Cycle) .............. 53
Figure 39: Full Scale Cam Spring Prototype .................................................................................. 55
Figure 40: Cam Spring Data Set 1.1............................................................................................... 59
Figure 41: Cam Spring Data Set 1.2............................................................................................... 60
Figure 42: Cam Spring Data Set 1.3............................................................................................... 60
Figure 43: Cam Spring Data Set 1.4............................................................................................... 61
Figure 44: Cam Spring Data Set 1.5............................................................................................... 61
Figure 45: Cam Spring Data Set 1.6............................................................................................... 62
Figure 46: Cam Spring Data Set 1.7............................................................................................... 62
Figure 47: Cam Spring Data Set 1.8............................................................................................... 63
Figure 48: Cam Spring Data Set 1.9............................................................................................... 63
Figure 49: Cam Spring Data Set 1.10 ............................................................................................ 64
Figure 50: Cam Spring Data Set 1.11 ............................................................................................ 64
Figure 51: Cam Spring Data Set 1.12 ............................................................................................ 65
Figure 52: Cam Spring Data Set 1.13 ............................................................................................ 65
Figure 53: Cam Spring Data Set 1.14 ............................................................................................ 66
Figure 54: Cam Spring Data Set 1.15 ............................................................................................ 66
Figure 55: Cam Spring Data Set 1.16 ............................................................................................ 67
Figure 56: Cam Spring Data Set 1.17 ............................................................................................ 67
Figure 57: Cam Spring Data Set 1.18 ............................................................................................ 68

ix | P a g e
Figure 58: Cam Spring Data Set 1.19 ............................................................................................ 68
Figure 59: Series Spring Data Set 1.1 ............................................................................................ 69
Figure 60: Series Spring Data Set 1.2 ............................................................................................ 69
Figure 61: Series Spring Data Set 1.3 ............................................................................................ 70
Figure 62: Series Spring Data Set 1.4 ............................................................................................ 70
Figure 63: Series Spring Data Set 1.5 ............................................................................................ 71
Figure 64: Series Spring Data Set 1.6 ............................................................................................ 71
Figure 65: Series Spring Data Set 1.7 ............................................................................................ 72
Figure 66: Series Spring Data Set 1.8 ............................................................................................ 72
Figure 67: Series Spring Data Set 1.9 ............................................................................................ 73
Figure 68: Series Spring Data Set 1.10 .......................................................................................... 73
Figure 69: Series Spring Data Set 1.11 .......................................................................................... 74
Figure 70: Cam Spring Data Set 2.1............................................................................................... 75
Figure 71: Cam Spring Data Set 2.2............................................................................................... 76
Figure 72: Series Spring Data Set 2.3 ............................................................................................ 76
Figure 73: Cam Spring Data Set 2.4............................................................................................... 77
Figure 74: Cam Spring Data Set 2.5............................................................................................... 77
Figure 75: Cam Spring Data Set 2.6............................................................................................... 78
Figure 76: NI DAQ Pin Diagram ..................................................................................................... 79
Figure 77: Counter Pin Location List (Used to Wire encoders) ..................................................... 80
Figure 78: NI PCI-6220 Wiring Photo (Hall Effect Sensor) ............................................................ 81
Figure 79: NI PCI 6024E Wiring Photo (Encoders) ........................................................................ 82
Figure 80: Final Testing Assembly ................................................................................................. 83
x | P a g e
List of Tables
Table 1: Decision Matrix Round 1 ................................................................................................. 24
Table 2: Mirror Spring Rate Calculations ...................................................................................... 27
Table 3: Helical Torsion Spring Physical Characteristics ............................................................... 33
Table 4: List of Measurement Devices .......................................................................................... 35
Table 5: Flywheel Sizing Table ...................................................................................................... 36
Table 6: List of Tests Performed ................................................................................................... 44

1 | P a g e
Introduction
The energy consumption of the planet is currently at an all-time high; a large majority of
this energy comes from nonrenewable sources. The supply of these nonrenewable fuels such as
coal and oil is becoming too low to ignore which is why much research is currently being
conducted into making more energy efficient devices. Large improvements in energy
economies stand to be made in engine and transmission systems due to their high use and
relatively low efficiencies. The most common method for making these devices more efficient is
to couple them to an energy storage device and create a hybrid system. Hybrid systems provide
efficiency gains because the energy storage device in the assembly serves as a buffer between
the engine and the load which allows the engine to operate at peak economy for longer.
Standard energy storage technology for hybrid systems includes batteries, hydraulic and
pneumatic accumulators, and flywheels.
Flywheels show great potential for use as energy storage in hybrid systems because they
have energy density comparable to lithium ion batteries, which are commonly used in hybrid
systems, yet have power density which is orders of magnitude greater. Because of their large
potential to improve the capability of hybrid systems, flywheels as energy storage technologies
are currently being researched at Worcester Polytechnic Institute’s Mechanical Energy and
Power Systems laboratory.
The concept that this project worked to realize is a pulse-width modulated continuously
variable transmission (PWM, CVT) which will be able to efficiently use energy stored in a
flywheel. The transmission utilizes a high speed, low slip clutch to produce a PWM signal in an
output shaft. The extremely high speed at which the clutch operates, 100 Hz, allows the system
to precisely vary the percentage of energy which is being taken from the flywheel at any given
time without bringing the flywheel to a complete stop. An accepted effect of using PWM in a
mechanical system is that extremely high accelerations and jerks are created in the output shaft
by the clutch. These loads, if unchecked, will lead to early fatigue failure in the system. To
alleviate this problem, it is necessary to add a torsion spring to the system in order to reduce
the acceleration and jerk within the output shaft.

2 | P a g e
The goal of this project was to design, build, and test a torsion spring prototype for
implementation within the PWM CVT system. To achieve this goal, the spring must minimize
acceleration and jerk within the system during operation. The prototype must also exhibit high
deflection, low moment of inertia, and low energy loss during operation so as to increase
efficiency.
In the future, the spring prototype developed by the group will be connected into a
concept clutch developed in the MEPS lab and the efficiency of the entire system will be
investigated. Because of this, the spring prototype had to meet size and strength constraints as
defined by the clutch prototype. Additionally, the spring prototype must be easily scalable as
there are many areas of industry where the concept proves useful.
In this report, an overview of the concepts of the problem will be given so that the user
may fully understand the problem and concept. The background is followed by the task
specifications and subsequently by the methodology of the design, building, and testing
processes. The paper then finishes with a discussion of the results observed from testing as well
as a recommendations section which outlines areas in which progress could be made.
Background
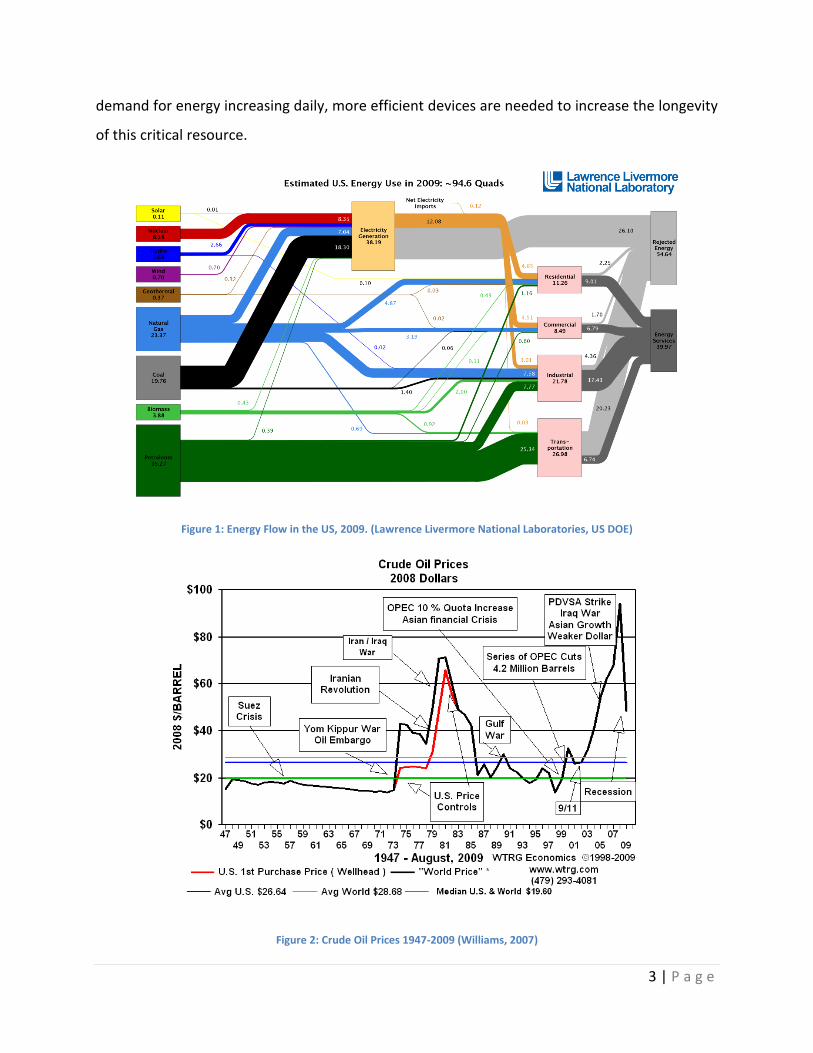
The modern world is one which is powered primarily with fossil fuels; America is
certainly no exception. According to the Lawrence Livermore National Laboratories, the US
consumed 78.4 quad btu’s of energy in 2009 which accounted for 82.8 percent of all energy
consumed during the year (Figure 1). The high use of fossil fuels is easy to explain; they all have
relatively high energy densities and are easy to extract. Unfortunately fossil fuels are, by
definition, nonrenewable and the world is running out of them. According to Professor Ibrahim
Nashawi of Kuwait University, humanity will likely reach a crude oil production limit by 2014
(Nashawi, 2010). The effects of the gasoline shortage have already begun as exhibited by the
rapid increase in the cost of crude oil. As Figure 2 shows, the price of crude oil has risen from
$20 to almost $100 over the last decade (Williams, 2007). With resources diminishing and the
3 | P a g e
demand for energy increasing daily, more efficient devices are needed to increase the longevity
of this critical resource.
Figure 1: Energy Flow in the US, 2009. (Lawrence Livermore National Laboratories, US DOE)
Figure 2: Crude Oil Prices 1947-2009 (Williams, 2007)

4 | P a g e
One simple method of quickly reducing oil consumption is to simply produce more
energy efficient devices. Machines which are energy efficient help reduce the demand on
current the current energy infrastructure in the US and also will help ensure that the clean
energy produced in the future is used well. One area where implementing more energy
economical systems can have an immediate, measureable benefit is mechanical transmissions.
Transmissions are used all across industry today anywhere that mechanical power produced by
an engine or motor needs to be formatted to work on a load. Current transmissions generally
rely on a complex system of gears and couplings in order to convey power but are limited in
that they must use finite, predetermined gear ratios during use. Having restricted gearing ratios
forces the engine to operate outside of its peak efficiency range often to account for load
changes which in turn increases fuel consumption. A simple route to increasing energy
efficiency within a system is therefore to produce a transmission system which allows the
engine to run in its peak efficiency range for longer. A common way to accomplish this is
through hybrid systems.
Hybrid Systems
A hybrid system is one in which an energy storage system is installed in parallel to a
standard transmission. The energy storage device increases system efficiency by acting as a
buffer between the engine and the load source. If energy demand in a hybrid system is low, the
engine can continue operating at a highly efficient rpm as unused energy is simply stored for
later. When demand is high, stored energy can be used to alleviate engine load. Further, during
braking, hybrid systems can recycle energy normally lost and save it for later. Common energy
storage devices used in hybrid systems include batteries, hydraulic accumulators, and
flywheels.
Flywheels have great potential for use in hybrid systems but are currently used only
sparingly. In terms of energy density, flywheels are orders of magnitude lower than standard
gasoline; what they lack in energy density however, flywheels make up for with power density
(Figure 3.) More important perhaps than how flywheels perform compared to gasoline, is how
they compare to battery energy storage. When compared to lithium ion batteries, the most
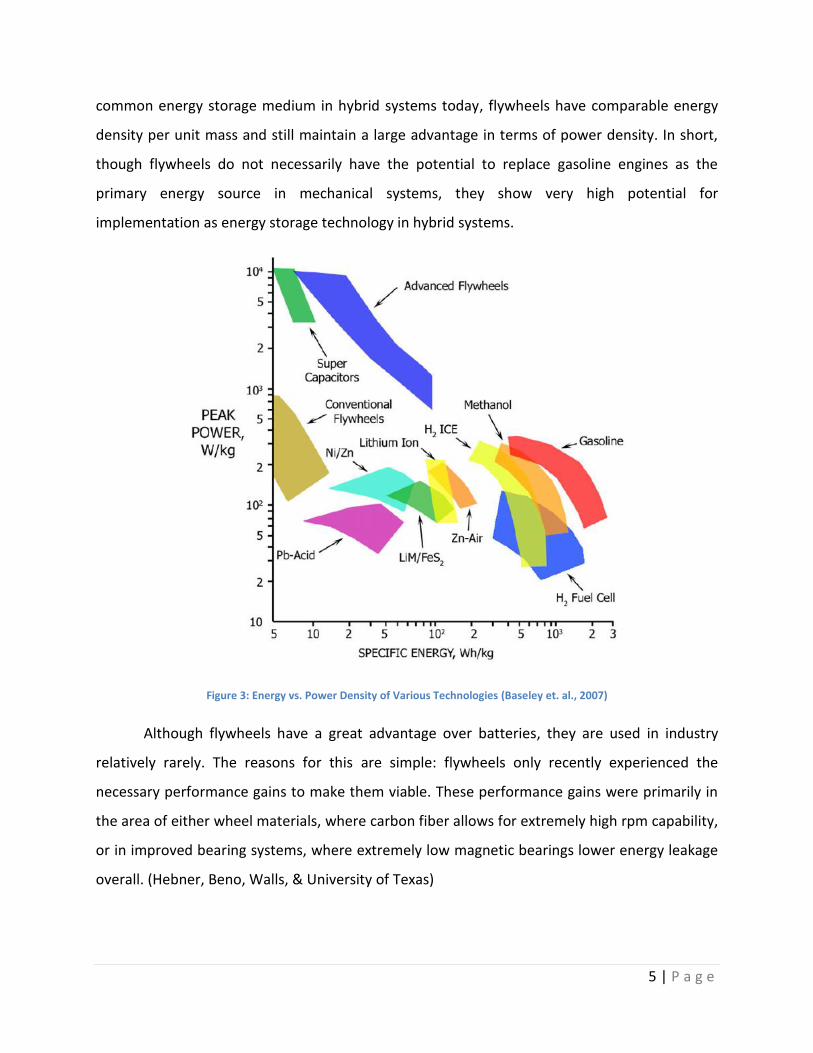
5 | P a g e
common energy storage medium in hybrid systems today, flywheels have comparable energy
density per unit mass and still maintain a large advantage in terms of power density. In short,
though flywheels do not necessarily have the potential to replace gasoline engines as the
primary energy source in mechanical systems, they show very high potential for
implementation as energy storage technology in hybrid systems.
Figure 3: Energy vs. Power Density of Various Technologies (Baseley et. al., 2007)
Although flywheels have a great advantage over batteries, they are used in industry
relatively rarely. The reasons for this are simple: flywheels only recently experienced the
necessary performance gains to make them viable. These performance gains were primarily in
the area of either wheel materials, where carbon fiber allows for extremely high rpm capability,
or in improved bearing systems, where extremely low magnetic bearings lower energy leakage
overall. (Hebner, Beno, Walls, & University of Texas)

6 | P a g e
A further reason for the relative rarity of flywheels is because they require complex
linkages to match their changing rpm’s to an output. Currently, the most common way to insert
a flywheel into a hybrid system is through a continuously variable transmission (CVT).
CVT History
Continuously Variable Transmissions (CVT) have been investigated as a means of
improving engine efficiency since the Industrial Revolution. The CVT was originally
conceptualized by Leonardo da Vinci in 1490 as a “stepless” transmission (Birch, 2010) and,
although it is an extremely old idea, still has large potential for growth. The adjective
“continuous” is derived from the “stepless” functionality proposed by da Vinci. Although
conceptualized early on, CVT’s were late to be put into practice. The first patent for a CVT was
issued to Daimler and Benz in 1886 for a toroidal CVT (Harris). A toroidal CVT, as shown in
Figure 4, consists of an input and an output disc which form an hourglass-like shape and two
rollers which rely on friction to transmit energy from one disc to another. By adjusting the angle
of the rollers, the input to output ratio of the gear train can be finely controlled which allows
drive shaft speed to be decoupled from engine speed, a major aid to overall system efficiency
(Harris).
Figure 4: Toroidal Continuously Variable Transmission (Harris)
Continuously variable transmissions are offer extreme flexibility in terms of gearing
ratios which makes them well suited to taking power from flywheels. The downside to current
7 | P a g e
CVT transmissions is their low efficiencies that arise as a result of their complex mechanical
systems. The low efficiencies in current transmission systems coupled with the high potential
for flywheel usage in energy storage systems leave a large area for progress to be made in this
subject area.
Switch-Mode PWM CVT Concept
The concept that our MQP team helped to realize with our project is aimed at providing
a unique, highly scalable mechanical transmission system which can use the energy within a
flywheel extremely efficiently. Research in the Mechanical Energy and Power Systems Lab at
WPI on what is officially titled the Switch-Mode Pulse-Width Modulated Continuously Variable
Transmission System began with graduate research in 2008 and at the time of this paper, has
progressed to the prototyping of the entire system with the end goal of a functioning proof of
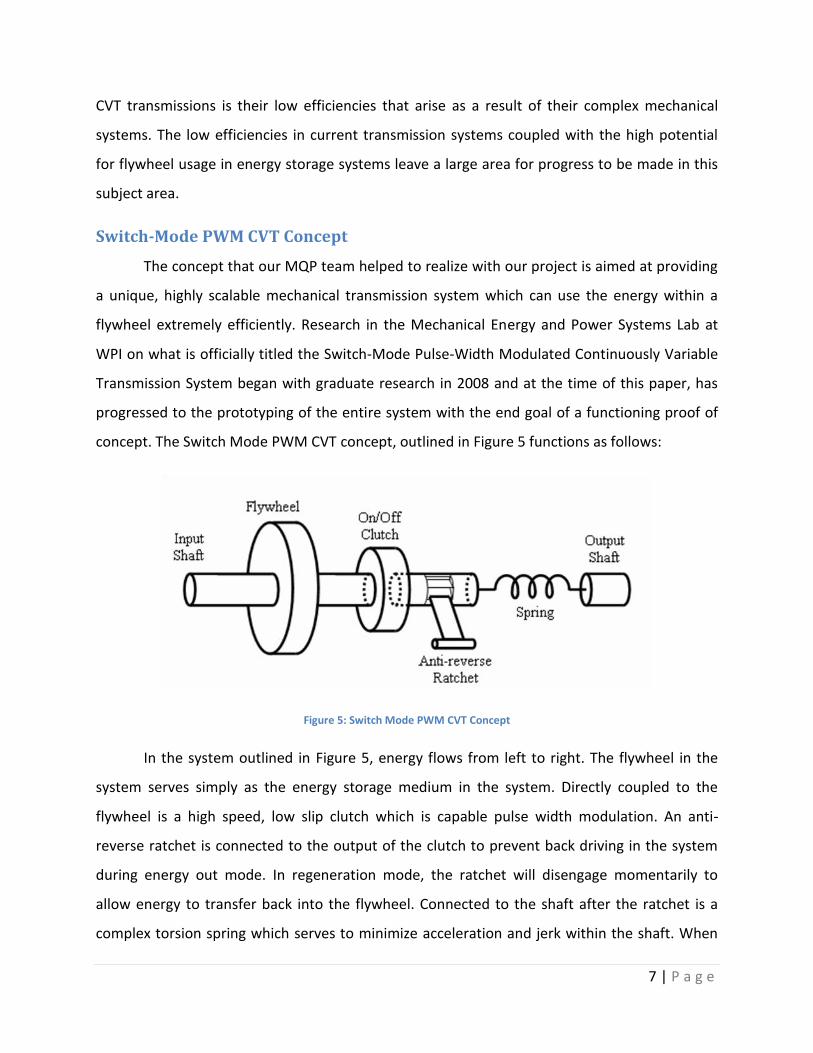
concept. The Switch Mode PWM CVT concept, outlined in Figure 5 functions as follows:
Figure 5: Switch Mode PWM CVT Concept
In the system outlined in Figure 5, energy flows from left to right. The flywheel in the
system serves simply as the energy storage medium in the system. Directly coupled to the
flywheel is a high speed, low slip clutch which is capable pulse width modulation. An anti-
reverse ratchet is connected to the output of the clutch to prevent back driving in the system
during energy out mode. In regeneration mode, the ratchet will disengage momentarily to
allow energy to transfer back into the flywheel. Connected to the shaft after the ratchet is a
complex torsion spring which serves to minimize acceleration and jerk within the shaft. When

8 | P a g e
functioning properly, this concept functions as a mechanical analogue to the electrical boost-
converter circuit shown in Figure 6. By engaging and disengaging the clutch extremely quickly as
well as by varying the duty ratio (the percent of time the clutch is engaged over its set period) a
pulse-width modulated, virtually continuously variable transmission may be achieved as the
amount of energy taken out of the flywheel can be very precisely controlled. The concept is
described in greater detail below.
Figure 6: Electrical Boost Converter Circuit
As mentioned previously, the continuously variable transmission concept takes
advantage of pulse width modulation to take energy out of a flywheel. A PWM signal is a square
waveform which operates at either a high or low value; the ratio of high value to low value can
change in order to vary the power flow through the circuit. A sample PWM signal may be seen
in Figure 7. Electrical engineers use PWM signals to control the output of a load in the circuit,
such as a light bulb. By rapidly varying the duty cycle, or the percentage of time spent at the
high value, a light bulb can be made to dim or brighten (Wolff). In reality, the circuit is simply
changing the percentage of the time the light is on over the course of a very short (so short the
human eye cannot discern the pulses) period.

9 | P a g e
Figure 7: Pulse-Width Modulation Signal (Anonymous, 2010)
In the mechanical equivalent of the boost converter circuit, the clutch is what serves as
the high speed switch. By rapidly engaging and disengaging the input shaft, the clutch takes
small amounts of energy out of the flywheel and transfers them to the output shaft. As with an
electrical circuit, in the energy output, the duty cycle can be varied, allowing the percentage of
energy transferred to the output to be easily controlled. Figure 8 shows how the energy is
distributed throughout the system. Currently the MEPS lab has developed a high speed, low slip
clutch which meets the Note the PWM signal carries through to the output, resulting in nearly
infinite spikes in acceleration and jerk in the output of the system.
Figure 8: PWM Signal of Switch-Mode CVT
10 | P a g e
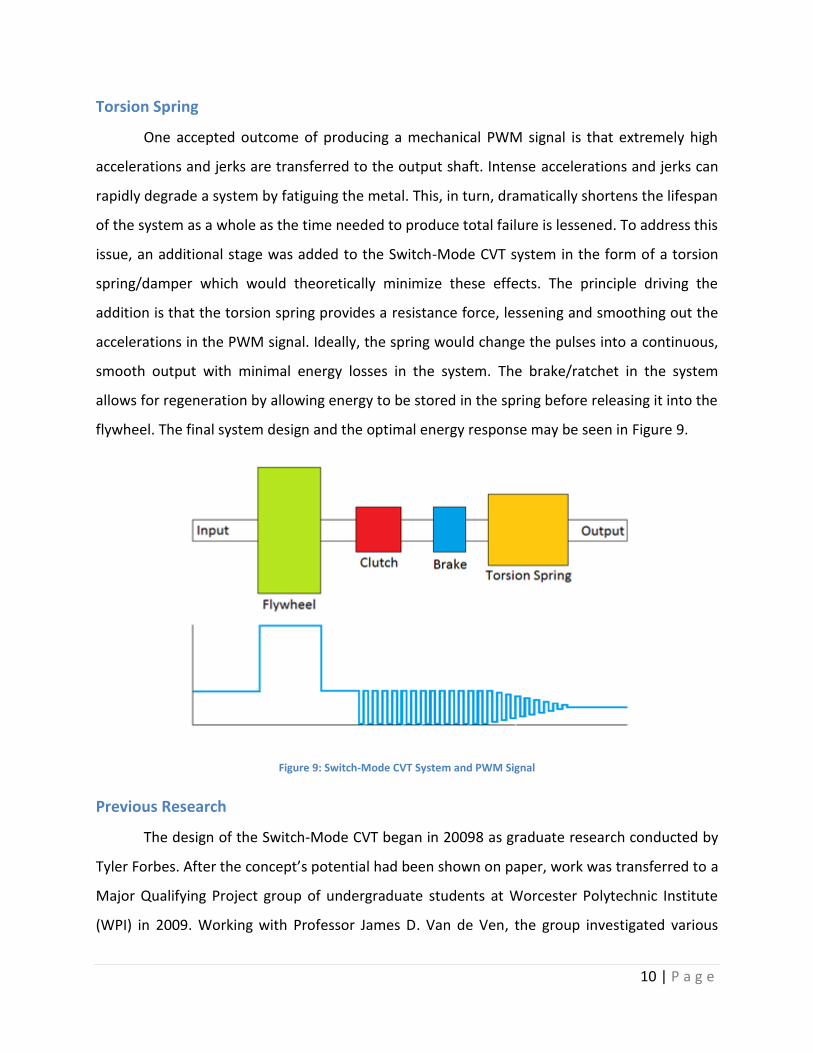
Torsion Spring
One accepted outcome of producing a mechanical PWM signal is that extremely high
accelerations and jerks are transferred to the output shaft. Intense accelerations and jerks can
rapidly degrade a system by fatiguing the metal. This, in turn, dramatically shortens the lifespan
of the system as a whole as the time needed to produce total failure is lessened. To address this
issue, an additional stage was added to the Switch-Mode CVT system in the form of a torsion
spring/damper which would theoretically minimize these effects. The principle driving the
addition is that the torsion spring provides a resistance force, lessening and smoothing out the
accelerations in the PWM signal. Ideally, the spring would change the pulses into a continuous,
smooth output with minimal energy losses in the system. The brake/ratchet in the system
allows for regeneration by allowing energy to be stored in the spring before releasing it into the
flywheel. The final system design and the optimal energy response may be seen in Figure 9.
Figure 9: Switch-Mode CVT System and PWM Signal
Previous Research
The design of the Switch-Mode CVT began in 20098 as graduate research conducted by
Tyler Forbes. After the concept’s potential had been shown on paper, work was transferred to a
Major Qualifying Project group of undergraduate students at Worcester Polytechnic Institute
(WPI) in 2009. Working with Professor James D. Van de Ven, the group investigated various
11 | P a g e
clutch, flywheel, and torsion spring designs and developed a scale model as a proof of concept.
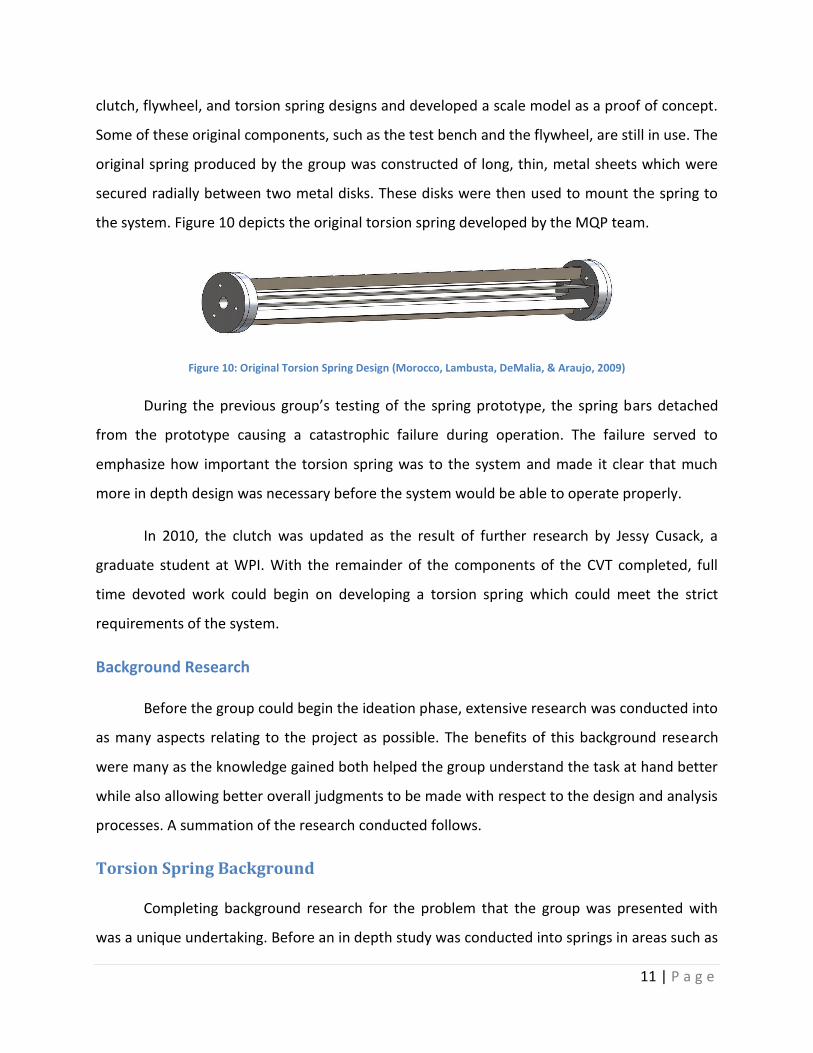
Some of these original components, such as the test bench and the flywheel, are still in use. The
original spring produced by the group was constructed of long, thin, metal sheets which were
secured radially between two metal disks. These disks were then used to mount the spring to
the system. Figure 10 depicts the original torsion spring developed by the MQP team.
Figure 10: Original Torsion Spring Design (Morocco, Lambusta, DeMalia, & Araujo, 2009)
During the previous group’s testing of the spring prototype, the spring bars detached
from the prototype causing a catastrophic failure during operation. The failure served to
emphasize how important the torsion spring was to the system and made it clear that much
more in depth design was necessary before the system would be able to operate properly.
In 2010, the clutch was updated as the result of further research by Jessy Cusack, a
graduate student at WPI. With the remainder of the components of the CVT completed, full
time devoted work could begin on developing a torsion spring which could meet the strict
requirements of the system.
Background Research
Before the group could begin the ideation phase, extensive research was conducted into
as many aspects relating to the project as possible. The benefits of this background research
were many as the knowledge gained both helped the group understand the task at hand better
while also allowing better overall judgments to be made with respect to the design and analysis
processes. A summation of the research conducted follows.
Torsion Spring Background
Completing background research for the problem that the group was presented with
was a unique undertaking. Before an in depth study was conducted into springs in areas such as
12 | P a g e
patents and internal stress calculations, the group made a brief investigation into existing
systems where torsion springs are used.
There are many applications where torsion springs are used but the most common
applications for torsion springs include vehicle suspension systems, garage door lifting devices,
and mechanical watch movements. Torsion springs are found in suspension systems for some
cars because they offer a cheap, simple alternative to more advanced systems. Torsion springs
used in this manner are essentially hollow bars and, while they do exhibit linear spring rates,
are extremely large. Torsion springs used in pickup truck suspensions for example, are regularly
the length of the entire truck bed. Clearly, the size of the spring disqualifies it from being a
viable option moving forward. The types of torsion springs used in watch movements and in
garage door openers both exhibit the quality of having a relatively constant spring rate
independent of deflection. When springs of this nature are wound, their resistance does not
increase until they near their maximum deflection; this is clearly not a suitable characteristic for
a spring to have if it is to be put to use in the group’s project.
A spring fitting the necessary criteria does not exist at present and as such there was
not much applicable research or physical examples for the group to draw from. Basic
background research into the theory behind spring forces and such was conducted however so
as to give the group a level of understanding appropriate for the task ahead.
Patents
The patent research conducted by the group, though generally unsuccessful, did provide
a few notable examples of ideas that the group was able to pull from for the ideation phase of
research. The first of these patents was titled “Torsion Spring Type Damper Disc” which consists
of two essentially flat cylinders that are attached to each other by springs mounted
circumferentially around the interacting faces of the cylinders. The device provides rotational
resistance by transferring rotational force into linear spring force (Takeuchi, 1992). The general
setup of the spring may be seen in Figure 11. This patent was important to the group’s research
as it proved the validity of using compression springs in this arrangement.
13 | P a g e
Figure 11: Torsion Spring Type Damper Disc (Takeuchi, 1992)
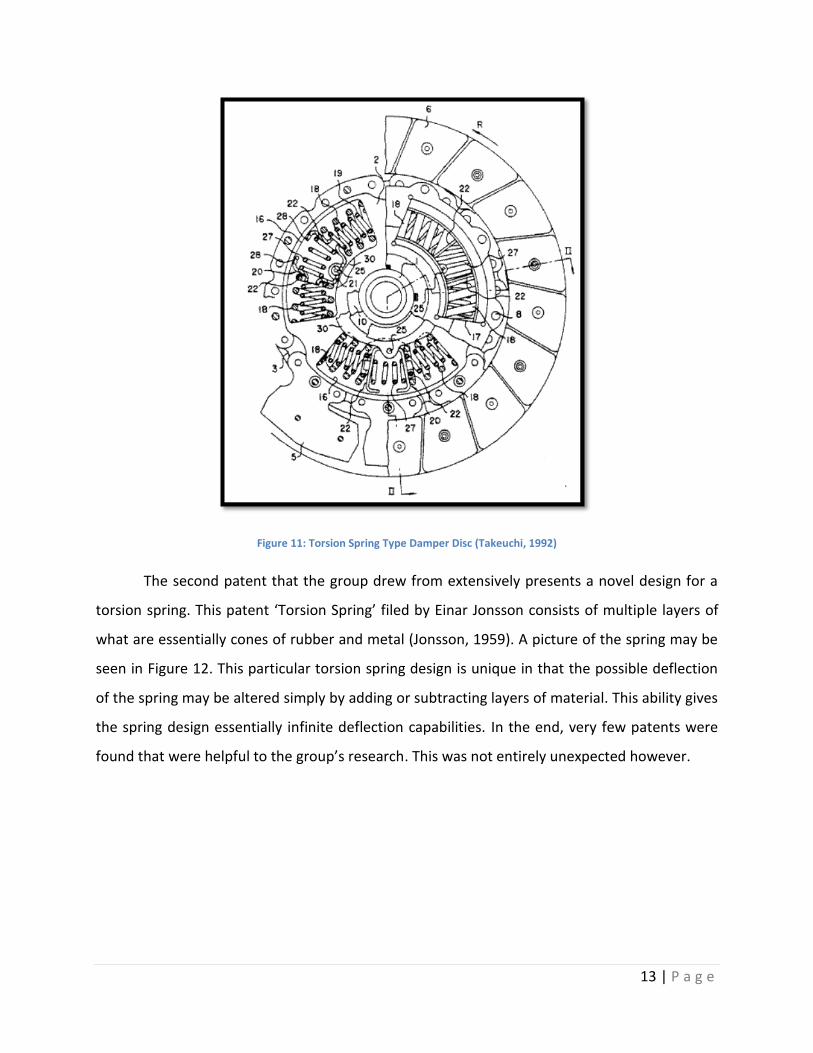
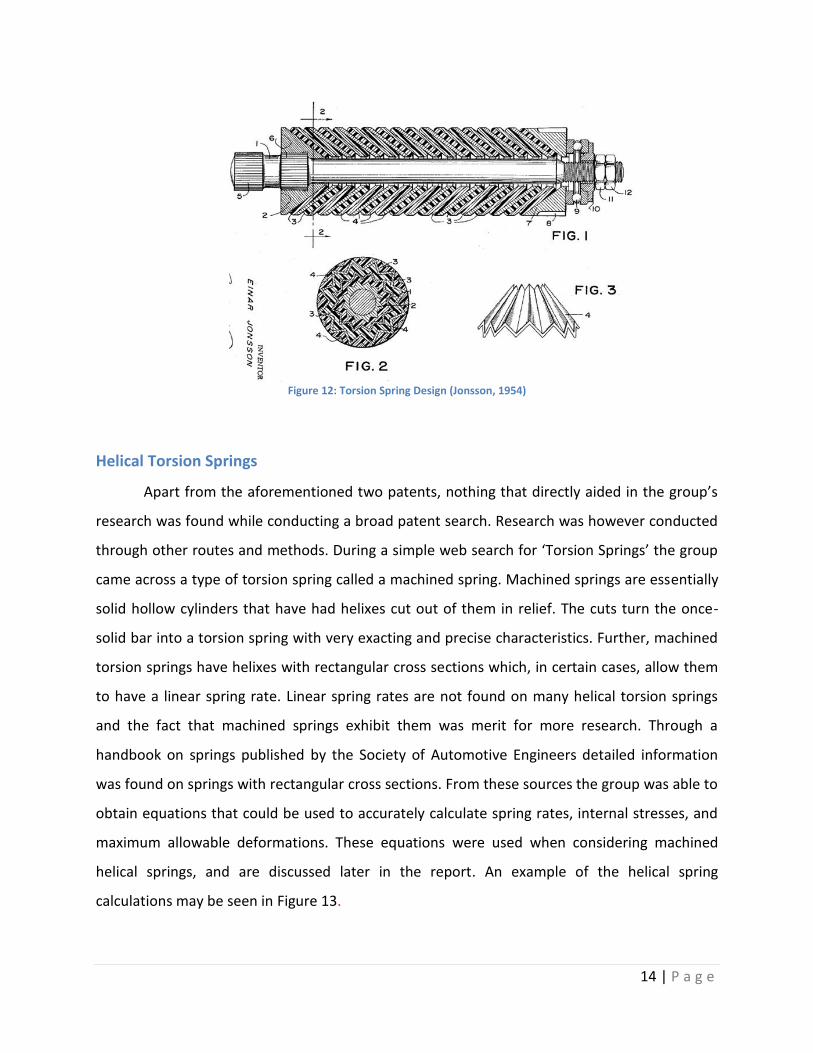
The second patent that the group drew from extensively presents a novel design for a
torsion spring. This patent ‘Torsion Spring’ filed by Einar Jonsson consists of multiple layers of
what are essentially cones of rubber and metal (Jonsson, 1959). A picture of the spring may be
seen in Figure 12. This particular torsion spring design is unique in that the possible deflection
of the spring may be altered simply by adding or subtracting layers of material. This ability gives
the spring design essentially infinite deflection capabilities. In the end, very few patents were
found that were helpful to the group’s research. This was not entirely unexpected however.
14 | P a g e
Figure 12: Torsion Spring Design (Jonsson, 1954)
Helical Torsion Springs
Apart from the aforementioned two patents, nothing that directly aided in the group’s
research was found while conducting a broad patent search. Research was however conducted
through other routes and methods. During a simple web search for ‘Torsion Springs’ the group
came across a type of torsion spring called a machined spring. Machined springs are essentially
solid hollow cylinders that have had helixes cut out of them in relief. The cuts turn the once-
solid bar into a torsion spring with very exacting and precise characteristics. Further, machined
torsion springs have helixes with rectangular cross sections which, in certain cases, allow them
to have a linear spring rate. Linear spring rates are not found on many helical torsion springs
and the fact that machined springs exhibit them was merit for more research. Through a
handbook on springs published by the Society of Automotive Engineers detailed information
was found on springs with rectangular cross sections. From these sources the group was able to
obtain equations that could be used to accurately calculate spring rates, internal stresses, and
maximum allowable deformations. These equations were used when considering machined
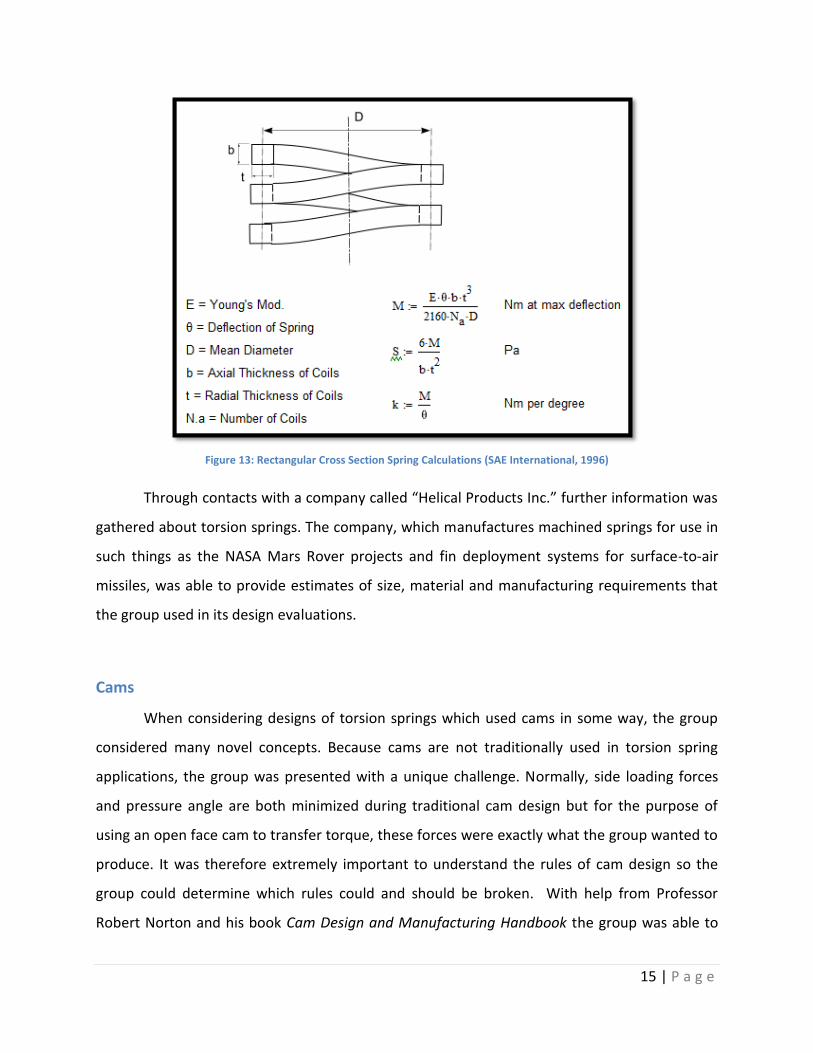
helical springs, and are discussed later in the report. An example of the helical spring
calculations may be seen in Figure 13.
15 | P a g e
Figure 13: Rectangular Cross Section Spring Calculations (SAE International, 1996)
Through contacts with a company called “Helical Products Inc.” further information was
gathered about torsion springs. The company, which manufactures machined springs for use in
such things as the NASA Mars Rover projects and fin deployment systems for surface-to-air
missiles, was able to provide estimates of size, material and manufacturing requirements that
the group used in its design evaluations.
Cams
When considering designs of torsion springs which used cams in some way, the group
considered many novel concepts. Because cams are not traditionally used in torsion spring
applications, the group was presented with a unique challenge. Normally, side loading forces
and pressure angle are both minimized during traditional cam design but for the purpose of
using an open face cam to transfer torque, these forces were exactly what the group wanted to
produce. It was therefore extremely important to understand the rules of cam design so the
group could determine which rules could and should be broken. With help from Professor
Robert Norton and his book Cam Design and Manufacturing Handbook the group was able to
16 | P a g e
learn key facts which helped in the cam design. One major fact of these deals with pressure
angles, or the angle at which force is transferred through the contact point of the followers on
the cam. The general rule of thumb for pressure angles is that they should not exceed 35
degrees, but this is not the case for this group’s purposes (Norton, Design of Machinery, 2010).
In order to transfer the rotational forces accurately, the group decided to raise this pressure
angle well over the recommended limit in order to help with torque transfer. Friction and side
loading were still major considerations for the group however as they cannot be ignored.
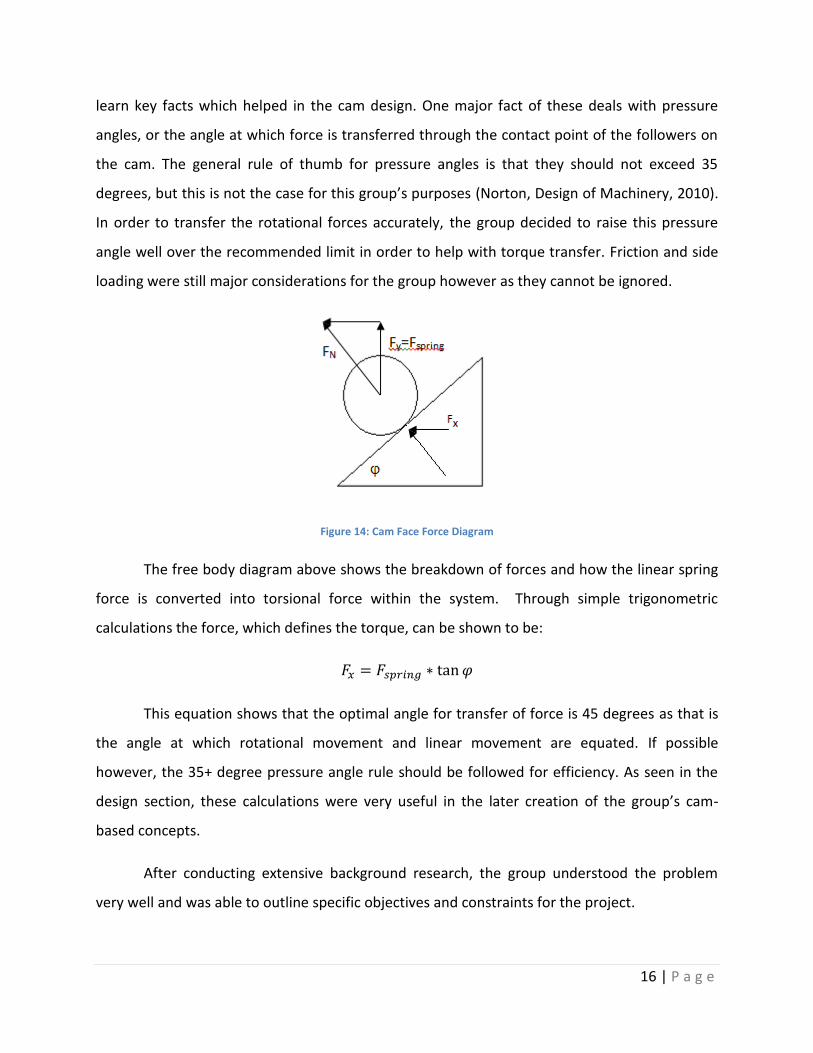
Figure 14: Cam Face Force Diagram
The free body diagram above shows the breakdown of forces and how the linear spring
force is converted into torsional force within the system. Through simple trigonometric
calculations the force, which defines the torque, can be shown to be:
This equation shows that the optimal angle for transfer of force is 45 degrees as that is
the angle at which rotational movement and linear movement are equated. If possible
however, the 35+ degree pressure angle rule should be followed for efficiency. As seen in the
design section, these calculations were very useful in the later creation of the group’s cam-
based concepts.
After conducting extensive background research, the group understood the problem
very well and was able to outline specific objectives and constraints for the project.

17 | P a g e
Objectives
The goal of this project is to design, build, and test a torsion spring design which exhibits
low energy loss, high deflection and low moment of inertia in order to efficiently transfer
energy from the flywheel to the drivetrain in the PWM CVT concept. The secondary objective of
the group’s project is to further the Mechanical Energy & Power Systems Laboratory’s
development of a fully-functional prototype of the Switch-Mode CVT.
In its design, the device is limited by a number of mechanical and physical factors which
are based on results from the previous groups’ work as well as Professor Van de Ven’s research.
The mechanical requirements of the system are:
The spring must be able to accommodate up to 70 Nm of
torque during use.
The spring’s inertial characteristics must be minimized in order
to reduce energy loss.
The spring must operate under both clockwise and counter-
clockwise motion equally well to allow for reverse and
regenerative breaking.
The spring must have nearly infinite life span
o 108 cycles for testing
The spring must effectively minimize acceleration and jerk at
the output.
The device must have a near-linear spring rate
Maximum spring length is 18 inches or 46 cm.
Maximum spring diameter is 12 inches or 30.5 cm.
Minimum spring deflection of 180° or π radians.
Must be scalable to work with standard vehicle energy and
power requirements.

18 | P a g e
Design
Initial Designs
After researching successes and failures and doing overall background research into
spring design characteristics the group sat down to begin the ideation process. Taking
modifications of designs from the past while also coming up with some brand new ideas left the
group with eight separate designs. Many of the concepts were extremely unique; some
involved magnets as spring replacements and while others transfer rotational torque into linear
springs. All of the designs did however show promise which is why the group discussed the
pros and cons of each extensively. The eight designs were the magnetic damper, a cam spring, a
magnetic series spring, helical spring, wire spring, rotini spring, machined spring, and a torsion
piston. Each design is explained below in the order that they were considered.
Magnetic Damper
The first design considered was the magnetic damper system. The basic idea behind the
device was to have input and output shafts completely unconnected from one another with a
transfer of the rotational movement through magnetic fields. The advantage of this design was
the small amount of losses because there are no physical contact points where frictional losses
could occur. Further, magnets, as opposed to springs, have a nearly infinite life where as
springs exhibit fatigue over time and lose their strength.
The major downfall of the magnetic damper system was the group’s limited
understanding of magnets and the magnetic fields created by the device. With the limited
understanding that the group had three iterations were completed that were all projected to
have the same performance characteristics.

19 | P a g e
Figure 15: Magnetic Damper Iteration 1
The first iteration has the input shaft inside of the output shaft with magnetic poles
arranged radially on the magnets and is shown in the cross section drawing above. This
iteration represents how the design was first imagined however due the direction of the
magnetic forces the design needed to be reformed.
Figure 16: Magnetic Damper Iteration 2
Knowing that magnetic force is felt most perpendicular to the axis of the poles, a second
iteration was created that had the input and output collinear to each other and mounted inside
a casing to keep them aligned. The problem with this design was the small size of the magnets
being used and the small torques they could therefore produce.
Figure 17: Magnetic Damper Iteration 3
In the third iteration the diameter of the magnets being used was increased in order to
get the force needed to handle the loading of the system. The downfall to larger magnets is
that they become almost like a flywheel and do not possess the low inertial qualities needed for
this application.
20 | P a g e
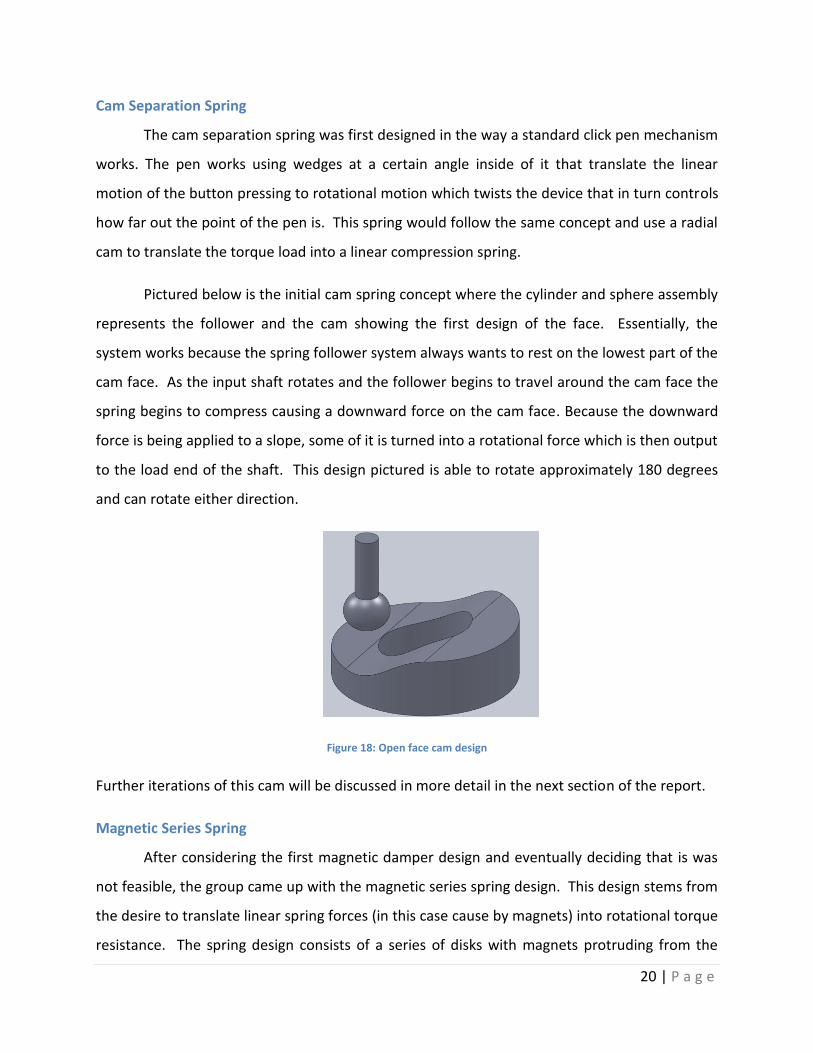
Cam Separation Spring
The cam separation spring was first designed in the way a standard click pen mechanism
works. The pen works using wedges at a certain angle inside of it that translate the linear
motion of the button pressing to rotational motion which twists the device that in turn controls
how far out the point of the pen is. This spring would follow the same concept and use a radial
cam to translate the torque load into a linear compression spring.
Pictured below is the initial cam spring concept where the cylinder and sphere assembly
represents the follower and the cam showing the first design of the face. Essentially, the
system works because the spring follower system always wants to rest on the lowest part of the
cam face. As the input shaft rotates and the follower begins to travel around the cam face the
spring begins to compress causing a downward force on the cam face. Because the downward
force is being applied to a slope, some of it is turned into a rotational force which is then output
to the load end of the shaft. This design pictured is able to rotate approximately 180 degrees
and can rotate either direction.
Figure 18: Open face cam design
Further iterations of this cam will be discussed in more detail in the next section of the report.
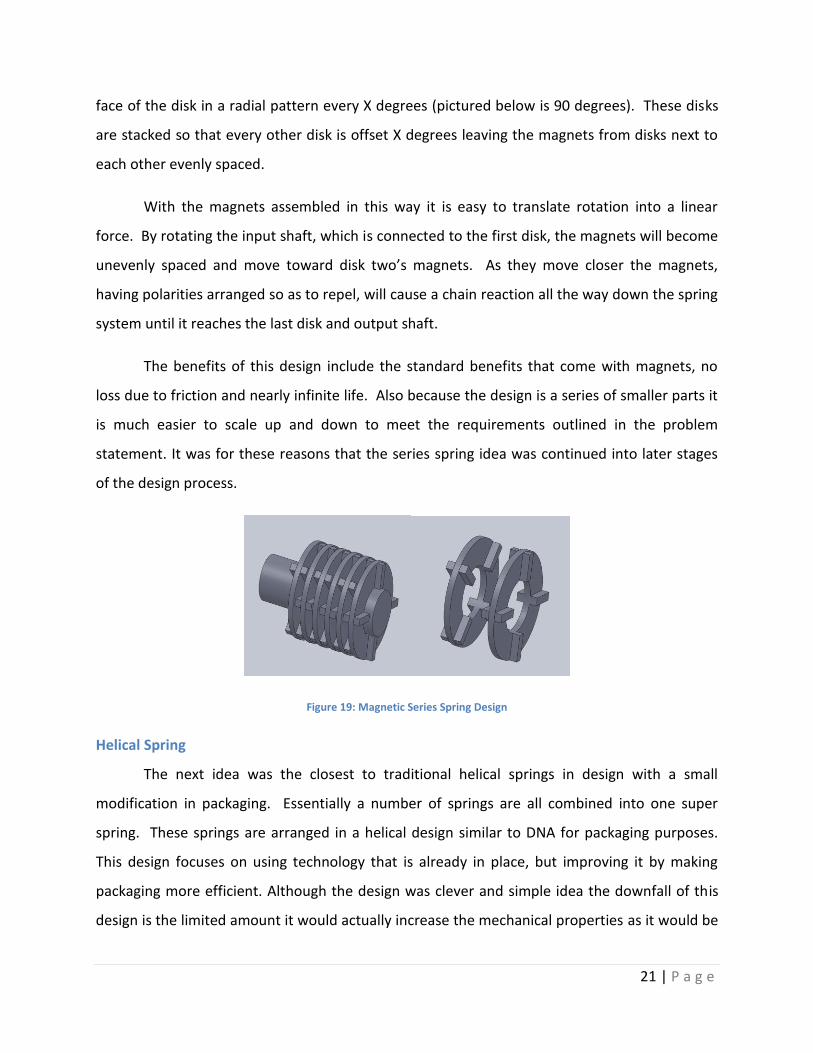
Magnetic Series Spring
After considering the first magnetic damper design and eventually deciding that is was
not feasible, the group came up with the magnetic series spring design. This design stems from
the desire to translate linear spring forces (in this case cause by magnets) into rotational torque
resistance. The spring design consists of a series of disks with magnets protruding from the
21 | P a g e
face of the disk in a radial pattern every X degrees (pictured below is 90 degrees). These disks
are stacked so that every other disk is offset X degrees leaving the magnets from disks next to
each other evenly spaced.
With the magnets assembled in this way it is easy to translate rotation into a linear
force. By rotating the input shaft, which is connected to the first disk, the magnets will become
unevenly spaced and move toward disk two’s magnets. As they move closer the magnets,
having polarities arranged so as to repel, will cause a chain reaction all the way down the spring
system until it reaches the last disk and output shaft.
The benefits of this design include the standard benefits that come with magnets, no
loss due to friction and nearly infinite life. Also because the design is a series of smaller parts it
is much easier to scale up and down to meet the requirements outlined in the problem
statement. It was for these reasons that the series spring idea was continued into later stages
of the design process.
Figure 19: Magnetic Series Spring Design
Helical Spring
The next idea was the closest to traditional helical springs in design with a small
modification in packaging. Essentially a number of springs are all combined into one super
spring. These springs are arranged in a helical design similar to DNA for packaging purposes.
This design focuses on using technology that is already in place, but improving it by making
packaging more efficient. Although the design was clever and simple idea the downfall of this
design is the limited amount it would actually increase the mechanical properties as it would be

22 | P a g e
hard to make the spring both strong and light enough to function well while at the same time
fitting it into the work envelope outlined in the objectives. Further, linear k rates would be hard
to achieve with such a setup.
Wire Spring
While doing research over the summer the group saw the design being considered by a
grad student in the MEPS lab and decided to include it in the original design consideration. This
design (as the group considered it) consisted of a bar connected to the input shaft. In this shaft
are holes, but these holes are not perfectly cylindrical. The holes have the smallest diameter in
the center of the bar and it increases as the hole pushes out toward the surface of the bar.
The purpose of these holes is to hold smaller wires/cables with springs attached to the
ends. When the bar rotates, the cables begin to wrap around it deflecting their springs. The
linear deflections of the springs that are attached to the cables provide the spring rate. The
rotational motion would be able to be output if the springs which the cables are attached to are
all attached to a separate output shaft which is concentric to the input.
This design has the major benefits of allowing the input shaft of the device to remain
extremely small. This gives the device very desirable inertial characteristics. The reasons that
the design did not make it past the initial stage of the group’s considerations are fairly
straightforward; first, the wires going through the center of the assembly will have largely
unknown frictional losses because of their winding about the shaft as well as because of
internal frictions present in the wires themselves. Second, the group was concerned about the
packaging of the device itself and the overall lifespan that it would exhibit. For these reasons
the device was discontinued from further consideration.
Rotini Spring
The Rotini Spring design is essentially a solid torsion spring that is shaped like rotini pasta. As
another explanation, the spring would look more or less like a twisted ribbon. The idea behind
the design is that the odd cross-section of the spirals lend themselves to having more resistance
to deflection while at the same time allowing for a higher maximum deflection to be achieved.
23 | P a g e
The major downfall of this design lay in its unorthodox shape presenting major barriers to force
calculation.
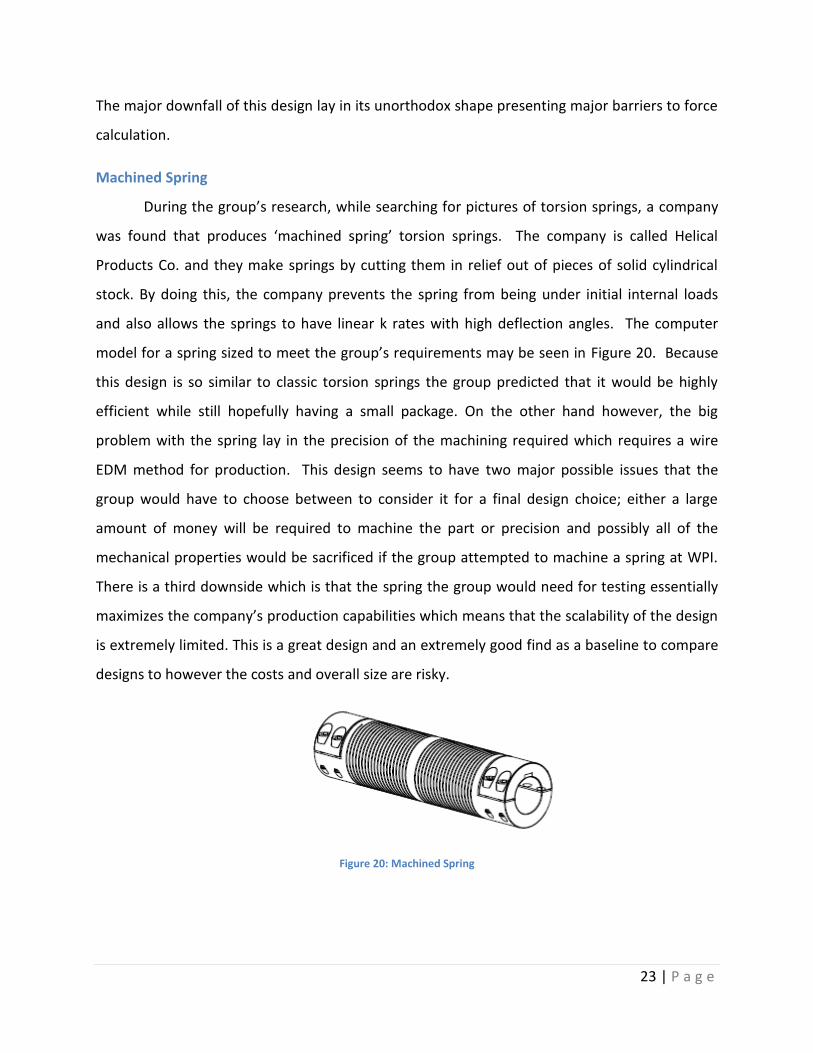
Machined Spring
During the group’s research, while searching for pictures of torsion springs, a company
was found that produces ‘machined spring’ torsion springs. The company is called Helical
Products Co. and they make springs by cutting them in relief out of pieces of solid cylindrical
stock. By doing this, the company prevents the spring from being under initial internal loads
and also allows the springs to have linear k rates with high deflection angles. The computer
model for a spring sized to meet the group’s requirements may be seen in Figure 20. Because
this design is so similar to classic torsion springs the group predicted that it would be highly
efficient while still hopefully having a small package. On the other hand however, the big
problem with the spring lay in the precision of the machining required which requires a wire
EDM method for production. This design seems to have two major possible issues that the
group would have to choose between to consider it for a final design choice; either a large
amount of money will be required to machine the part or precision and possibly all of the
mechanical properties would be sacrificed if the group attempted to machine a spring at WPI.
There is a third downside which is that the spring the group would need for testing essentially
maximizes the company’s production capabilities which means that the scalability of the design
is extremely limited. This is a great design and an extremely good find as a baseline to compare
designs to however the costs and overall size are risky.
Figure 20: Machined Spring

24 | P a g e
Torsion Piston
The torsion piston assembly again attempts to convert rotation into linear motion,
which can be controlled by a “spring.” In this case however the spring is a system with
resistance derived from a piston compressing gas. The entire system is made of two springs on
each end with the piston system in between the two. When the input shaft turns the first
spring would uncoil and begin to lengthen, pushing the piston and compressing the gas. As the
gas is compressed it pushes on the piston connected to the output spring. As the piston is
pushed it compresses and coils the spring as well and the spring, which tends towards its
unloaded equilibrium state, would uncoil and drive the output shaft. The foreseeable downfalls
of this design lie mainly in the substantial frictional losses that would be incurred as well as the
temperature variations that the gas in the piston would undergo.
Decision Matrix I
With eight designs and three group members, the designs needed to be reevaluated and
narrowed down to a number that could be focused on easily. The designs were ranked
according to the following ten categories in order of importance: efficiency, lifespan, reliability,
inertial qualities, regenerative abilities, cost, size, deflection possible, scalability, and ease of
assembly.
Table 1: Decision Matrix Round 1
Characteristics Weight Magnetic
Damper Cam
Separation Magnetic
Spring Helical
Spring Wire
Spring Rotini
Spring Machined
Spring Torsion
Piston
Efficiency 14% 2 3 4 5 3 5 5 3
Lifespan 13% 5 3 4 2 2 2 3 3
Reliability 13% 5 4 4.5 2 2 3 3 4
Inertial
Qualities 11% 4 4 3 4 5 2 3 4
Regenerative
Abilities 10% 4 4 4 4 4 4 4 3
Cost 9% 3 3 3 4 2 2 4 3
Size 8% 4 5 3 2 5 2 2 4
Deflection
Possible 8% 5 3 4 4 4 3 4 4

25 | P a g e
Scalability 7% 3 4 3 2 5 2 2 3
Ease of
Assembly 7% 2 4 3 5 3 5 5 3
100% 75% 73% 73% 68% 67% 61% 71% 68%
Knowing about each design and looking at the design matrix one can easily see where each
design is strong and weak. It is important to note that the three designs the group would
research more in depth were not picked because of any single category, but because of their
overall performance in the ranking system. The top three designs were the magnetic damper,
cam separation spring, and the magnetic series spring with the machined spring coming in a
close fourth. However, after looking closely at the magnetic damper and the large amount of
unknowns involved the group decided to discontinue consideration of that specific design and
decided to pursue the only three designs left: Cam separation spring, magnetic series spring,
and the machined spring.
Alpha Prototype Designs
Cam Separation Spring
Although the cam separation spring was selected as one of the final designs it still
needed a lot of refining to become feasible. The first issue that needed to be rectified was the
unbalanced parts on both the input and output shaft. The follower originally was only on one
side; however that could be simply counteracted by mounting a mass on the other side as a
counterbalance. The next issue presenting the group was balancing the cam, which, if
dynamically unbalanced, would create serious problems when the system is operating at its
functioning RPM. The modifications made to fix these problems were to change the cam face
so the cam would be balanced and have two high and two low points instead of one of each.
The latter change however, cut the possible deflection of the followers on the cam from 180
degrees to 90 degrees, which is below the project’s requirement. To counteract this the group
looked to putting the cams in series having two of these systems back to back which would
make the total possible deflection 180 degrees again.

26 | P a g e
After realizing that the cams needed to be in series, which would take up valuable space
in the overall system the group tried to save space by designing a cam with a symmetrical face
on both sides. The resulting design may be seen in Figure 21.
Figure 21: Mirror Cam Assembly
In this case the two followers are attached to both the input and output shaft
respectively. The cam rotates independent of the input and output shaft, governed entirely by
the follower forces. This assembly works the same way as two cam/spring assemblies in series
because when the input shaft rotates the followers will compress the springs and the cam will
begin to turn. When the cam turns, it will force the followers on the output shaft to turn as
well.
After running some initial calculations with this design it was not possible to get the
proper amount of torque necessary without extremely high pressure angles. Therefore, it
became necessary to change the placement of the spring to along the shaft and not on each
27 | P a g e
individual follower. By moving it, a bigger spring can be used and therefore more force and
torque can be generated.
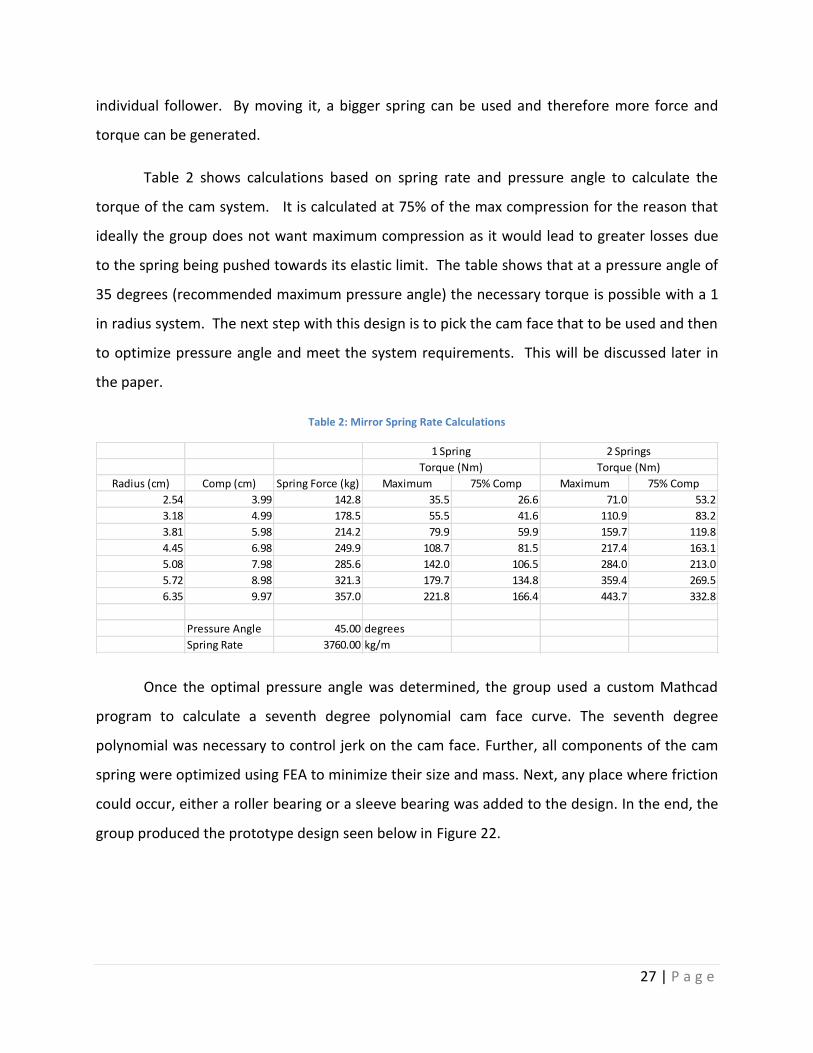
Table 2 shows calculations based on spring rate and pressure angle to calculate the
torque of the cam system. It is calculated at 75% of the max compression for the reason that
ideally the group does not want maximum compression as it would lead to greater losses due
to the spring being pushed towards its elastic limit. The table shows that at a pressure angle of
35 degrees (recommended maximum pressure angle) the necessary torque is possible with a 1
in radius system. The next step with this design is to pick the cam face that to be used and then
to optimize pressure angle and meet the system requirements. This will be discussed later in
the paper.
Table 2: Mirror Spring Rate Calculations
Once the optimal pressure angle was determined, the group used a custom Mathcad
program to calculate a seventh degree polynomial cam face curve. The seventh degree
polynomial was necessary to control jerk on the cam face. Further, all components of the cam
spring were optimized using FEA to minimize their size and mass. Next, any place where friction
could occur, either a roller bearing or a sleeve bearing was added to the design. In the end, the
group produced the prototype design seen below in Figure 22.
Radius (cm) Comp (cm) Spring Force (kg) Maximum 75% Comp Maximum 75% Comp
2.54 3.99 142.8 35.5 26.6 71.0 53.2
3.18 4.99 178.5 55.5 41.6 110.9 83.2
3.81 5.98 214.2 79.9 59.9 159.7 119.8
4.45 6.98 249.9 108.7 81.5 217.4 163.1
5.08 7.98 285.6 142.0 106.5 284.0 213.0
5.72 8.98 321.3 179.7 134.8 359.4 269.5
6.35 9.97 357.0 221.8 166.4 443.7 332.8
Pressure Angle 45.00 degrees
Spring Rate 3760.00 kg/m
Torque (Nm)Torque (Nm)
1 Spring 2 Springs

28 | P a g e
Figure 22: Cam Spring Final Design
Series Spring
The concept for using multiple springs in series originated from two patents. The first
patent was for a torsion spring in which small, linear compression springs are wrapped around a
shaft as to apply a rotational resistance. When the system is rotated, the springs are
compressed linearly which allows the system to exhibit a linear spring rate. Because the springs
used circumferentially are simple compression springs, this design allows for inexpensive
testing as most of the components can be purchased in bulk. Figure 23 shows the patent.

29 | P a g e
Figure 23: Torsion Spring Type Damper Disc (Takeuchi, 1992)
The second patent which was used in developing this design consists of a series of
stacked, jagged cones which alternated between rubber and metal. Although each cone and
rubber pair has a very limited maximum spring load, spring rate, and deflection, by placing
them in series, the much higher maximum, spring rate, and deflection can be achieved. From
this, the concept for using multiple small, linear springs wrapped around the shaft in series was
developed. Figure 24 shows an early conceptual design of the system.

30 | P a g e
Figure 24: Series Spring Conceptual Design
With this conceptual design complete, equations were developed to describe the
system. With these calculations, the diameter of the disc, the number of springs per disc, the
spring rate of each spring, and the number of discs were determined. Our final design calls for
eight springs per disc, a spring rate above 13 N/mm, a 50.8 mm diameter disc, and ten discs. The
two major factors in this decision were availability of springs and inertial characteristics.
The next step was to develop a detailed model of the design using these values. This
design served mainly as a proof of concept to show that the diameter could be reduced to 50.8
mm. Figure 25 shows the proof of concept model that was developed.
Figure 25: Series Spring Iteration 2
31 | P a g e
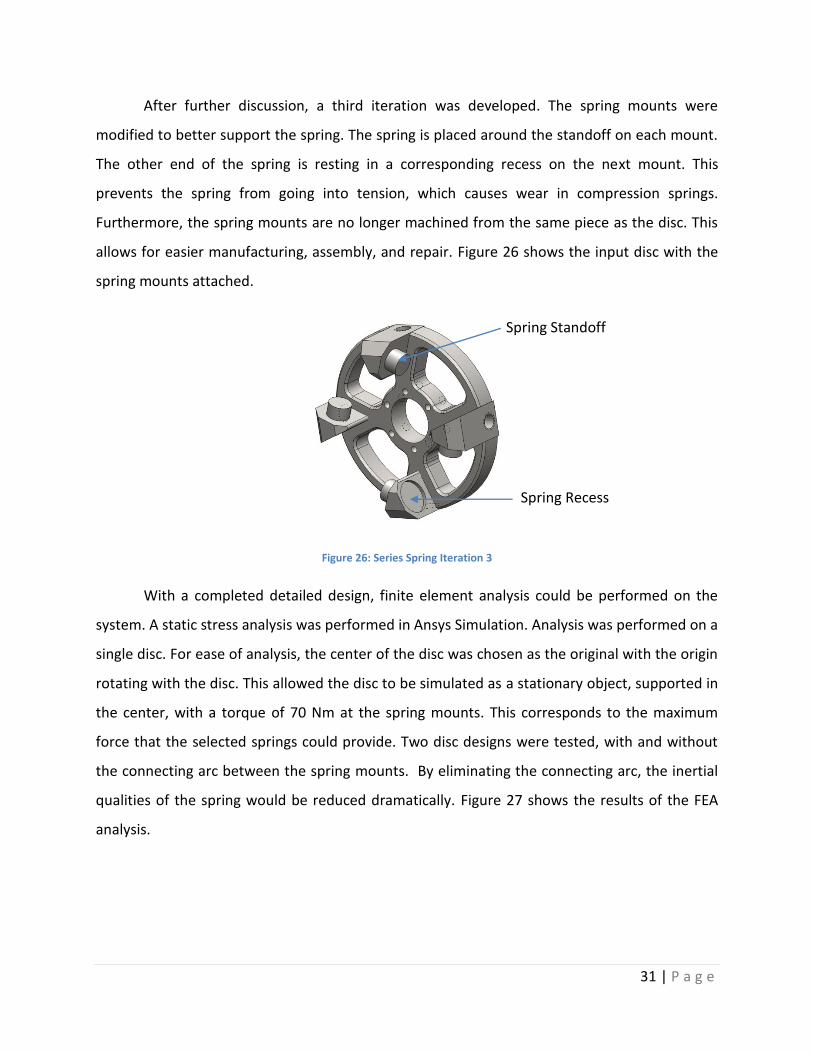
After further discussion, a third iteration was developed. The spring mounts were
modified to better support the spring. The spring is placed around the standoff on each mount.
The other end of the spring is resting in a corresponding recess on the next mount. This
prevents the spring from going into tension, which causes wear in compression springs.
Furthermore, the spring mounts are no longer machined from the same piece as the disc. This
allows for easier manufacturing, assembly, and repair. Figure 26 shows the input disc with the
spring mounts attached.
Figure 26: Series Spring Iteration 3
With a completed detailed design, finite element analysis could be performed on the
system. A static stress analysis was performed in Ansys Simulation. Analysis was performed on a
single disc. For ease of analysis, the center of the disc was chosen as the original with the origin
rotating with the disc. This allowed the disc to be simulated as a stationary object, supported in
the center, with a torque of 70 Nm at the spring mounts. This corresponds to the maximum
force that the selected springs could provide. Two disc designs were tested, with and without
the connecting arc between the spring mounts. By eliminating the connecting arc, the inertial
qualities of the spring would be reduced dramatically. Figure 27 shows the results of the FEA
analysis.
Spring Standoff
Spring Recess

32 | P a g e
Figure 27: Series Spring FEA Analysis
The FEA analysis clearly shows that the connecting arc has very little effect on the
stresses in the system. Furthermore, by increasing the thickness of the supports at the center of
the disc, the maximum shear stress in the system was reduced to 7.26 MPa. This is well below
the yield strength of carbon steel, which is typically around 200 MPa. With this data, a fourth
iteration was developed which will be used for small scale testing. Figure 28 depicts the fourth
iteration.
Figure 28: Series Spring Iteration 4
33 | P a g e
Machined Spring
The machined helical spring was chosen for further consideration because of a few
select characteristics. First, the machined spring was the simplest design that the group was
considering. As such it had very good theoretical efficiency statistics. Because there are no
moving parts in the spring, the only losses that would be seen during the spring’s use would
stem from internal material damping. Second, the spring, if built from the right materials
(superalloys), has the capability of fitting into a relatively small package. Finally, the spring does
not suffer from some of the failure possibilities seen in the other two designs, namely the
bottoming out possible in the series spring design and the side-load losses seen in the cam
design.
In order to go about determining the performance characteristics of the spring itself, the
group consulted a firm called “Helical Products Inc.” as well as a manual published by the
Society of Automotive Engineers to get a better idea of the spring dimensions necessary to
fulfill the design requirements. In conversing with a representative from Helical Products Inc.
the group was able to get estimated design characteristics for a spring that produced up to 80
NM of torque at 180 degrees of deflection. Further, the group used equations from the SAE
manual (seen in Figure 13) to provide a ‘secondary opinion’ on the size of the spring. In the end,
both methods of sizing the spring concluded that a spring with the characteristics seen in Table
3 would be optimal for the desired performance parameters. During spring size optimization
calculations, emphasis was put on achieving the necessary deflection and spring rate while at
the same time minimizing size and moment of inertia. For example, the overall spring rate is a
cubic relation to the radial thickness of the spring coils which means that, where possible, the
thickness was increased before the radius, number of coils or axial length of the coils.
Table 3: Helical Torsion Spring Physical Characteristics

34 | P a g e
In the end, the consideration of this spring design was stopped for two major reasons.
First, the machined helix spring has a mass that is very large compared to series spring and
mirror cam designs. Second, the size of the spring was given as “right at the manufacturing
capabilities” of Helical Products Inc. which means that the spring would be very expensive to
machine as well as very tough to scale up without paying an additional premium. For the
aforementioned reasons, the helical spring design was eliminated from the considerations
indefinitely.
Methodology
Testing System Fabrication
Once the two designs for the torsion spring had been determined, the group set about
designing and building a testing rig capable of accommodating both prototypes. The testing rig
design was centered about a few necessary facets and constraints. First, the rig needed to be
able to contain a flywheel used for energy storage, a clutch, a one-way locking bearing, and an
output assembly consisting of either a flywheel or a brake. Second, the assembly needed to be
adjustable to hold multiple spring prototypes of differing sizes. Finally, the testing rig needed to
be instrumented with multiple sensors for data acquisition. Ideally, the rig design would also
incorporate as little internal friction as possible to aid in providing accurate test data.
By adhering to the system requirements and by recycling components and ideas from
previous group’s designs, the group was able to construct a testing assembly without having to
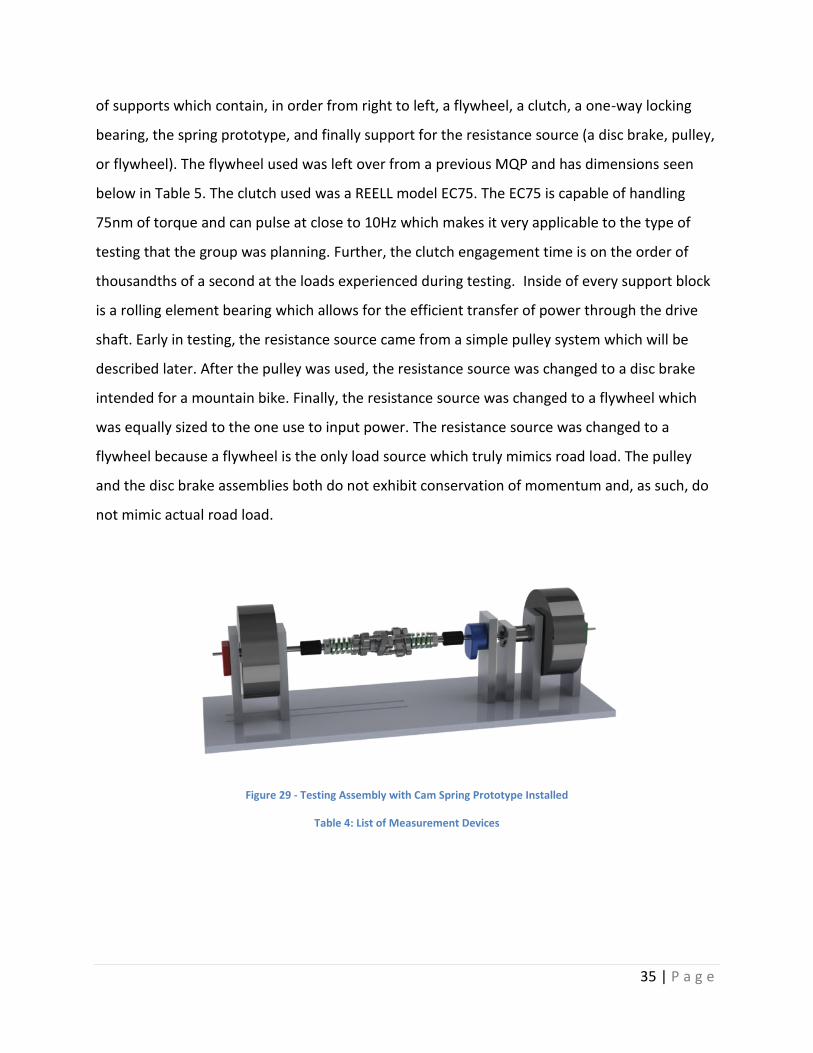
buy very many new parts. The testing assembly may be seen in Figure 29 and consists of a set
Helical Spring Optimal Design
Length 12in
Outer Dia. 3.5in
Inner Dia. 2.25in
Number of Coils 40
Thickness of Coils .0787in
Mass of Spring 9.6055lb
Inertia of Spring 4.3158 lb*in²
Material 17-4 PH Steel
35 | P a g e
of supports which contain, in order from right to left, a flywheel, a clutch, a one-way locking
bearing, the spring prototype, and finally support for the resistance source (a disc brake, pulley,
or flywheel). The flywheel used was left over from a previous MQP and has dimensions seen
below in Table 5. The clutch used was a REELL model EC75. The EC75 is capable of handling
75nm of torque and can pulse at close to 10Hz which makes it very applicable to the type of
testing that the group was planning. Further, the clutch engagement time is on the order of
thousandths of a second at the loads experienced during testing. Inside of every support block
is a rolling element bearing which allows for the efficient transfer of power through the drive
shaft. Early in testing, the resistance source came from a simple pulley system which will be
described later. After the pulley was used, the resistance source was changed to a disc brake
intended for a mountain bike. Finally, the resistance source was changed to a flywheel which
was equally sized to the one use to input power. The resistance source was changed to a
flywheel because a flywheel is the only load source which truly mimics road load. The pulley
and the disc brake assemblies both do not exhibit conservation of momentum and, as such, do
not mimic actual road load.
Figure 29 - Testing Assembly with Cam Spring Prototype Installed
Table 4: List of Measurement Devices

36 | P a g e
Table 5: Flywheel Sizing Table
In designing the new test stand, there were some improvements that the group was
able to make which helped with efficiency and ease overall ease of use during testing. Perhaps
the most major of these changes was the fact that the group designed the new testing rig with
an output assembly which was able to slide back and forth along the base. The ability of the
supports to slide was facilitated by cutting two parallel slots in the test base (See Figure 30) and
was extremely beneficial to the group’s testing as it meant that little work was required in
order to install a spring prototype with different dimensions. Other improvements to the rig,
such as boring out the support block which held the clutch in place were also quite beneficial in
aiding the overall efficiency of the system.
Device Data
Number
Used Model Name
Electronic Clutch
75 Nm Max Torque,
10 Hz Max Freq. 1 EC75 REELL
Rotary Encoder (1/4" bore) 48 to 2048 PPR 2 Amt 102, CUI inc
Rotary Encoder (1/2" bore) 1800 PPR 1 HB6M, US Digital
Hall Effect Sensor 1 Cherry 1013 Series Sensor

37 | P a g e
Figure 30: Base of Test Assembly (Bottom Side)
As mentioned before, the efficiency of the trial rig was paramount to the success of the
overall testing. In order to minimize internal resistance within the testing assembly, the group
was very methodical. First, all moving components in the test stand were given a liberal coating
of molybdenum grease to help eliminate friction. Second, each time a new support block was
installed in the assembly, its alignment was checked using a pair of calipers to measure the
spacing in between the supports on either side in order to ensure the utmost accuracy in the
system. If the support was found to be out of parallel by more than a few thousandths of an
inch, a plastic mallet was used to tap the system back into alignment. Finally, after each support
was installed and aligned, the group rotated the flywheel and shaft within the system to make
sure that everything still operated smoothly. This last step was crucial in helping the group
determine where key sources of friction were occurring in the system during the early build
stages.
Once the testing rig was assembled, the group began to build the safety enclosure with
which to encase the rig. The safety enclosure was designed as a large rectangular box and was
constructed out of materials strong enough to absorb much of the energy of a catastrophic
failure of the rig in the event that one should occur. The group chose half inch plywood to use
as the sidewalls and back of the enclosure because of its low cost and relatively high durability.
For the top and front side of the box, the group chose to use quarter inch thick Lexan sheeting.
Lexan is an extremely durable, optical quality polycarbonate plastic which allows for safe
viewing during testing. For additional safety, the vertical joints of the box were secured using
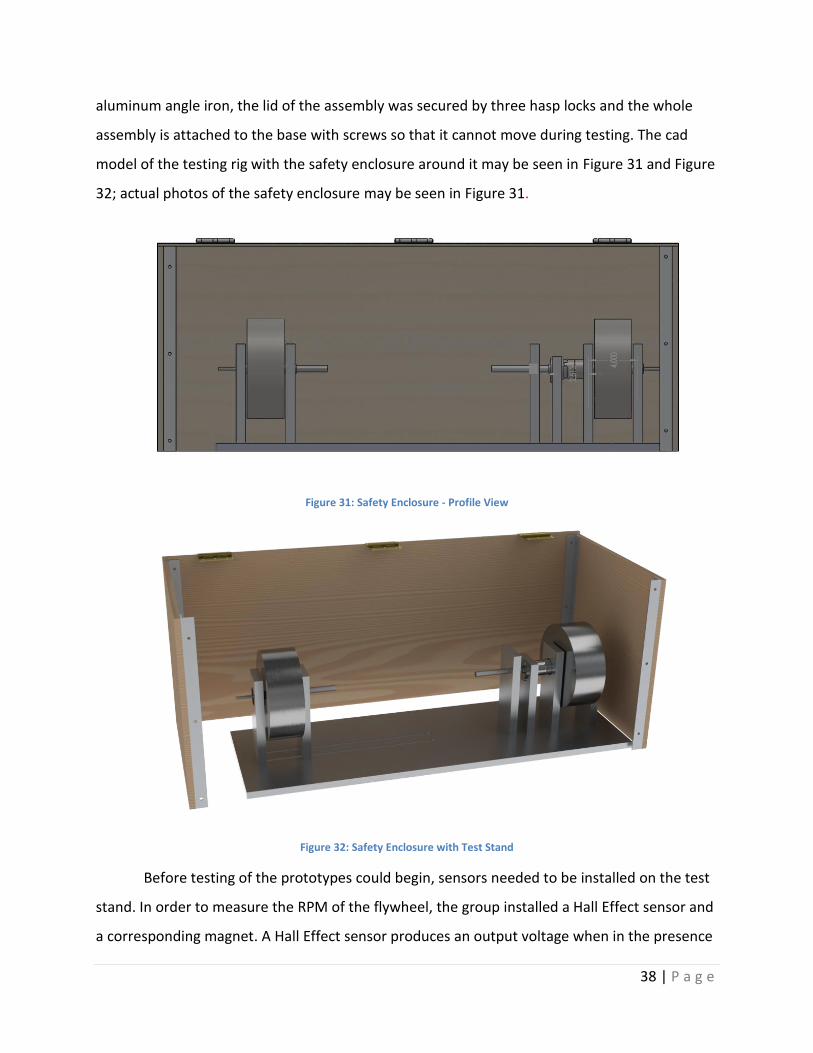
38 | P a g e
aluminum angle iron, the lid of the assembly was secured by three hasp locks and the whole
assembly is attached to the base with screws so that it cannot move during testing. The cad
model of the testing rig with the safety enclosure around it may be seen in Figure 31 and Figure
32; actual photos of the safety enclosure may be seen in Figure 31.
Figure 31: Safety Enclosure - Profile View
Figure 32: Safety Enclosure with Test Stand
Before testing of the prototypes could begin, sensors needed to be installed on the test
stand. In order to measure the RPM of the flywheel, the group installed a Hall Effect sensor and
a corresponding magnet. A Hall Effect sensor produces an output voltage when in the presence
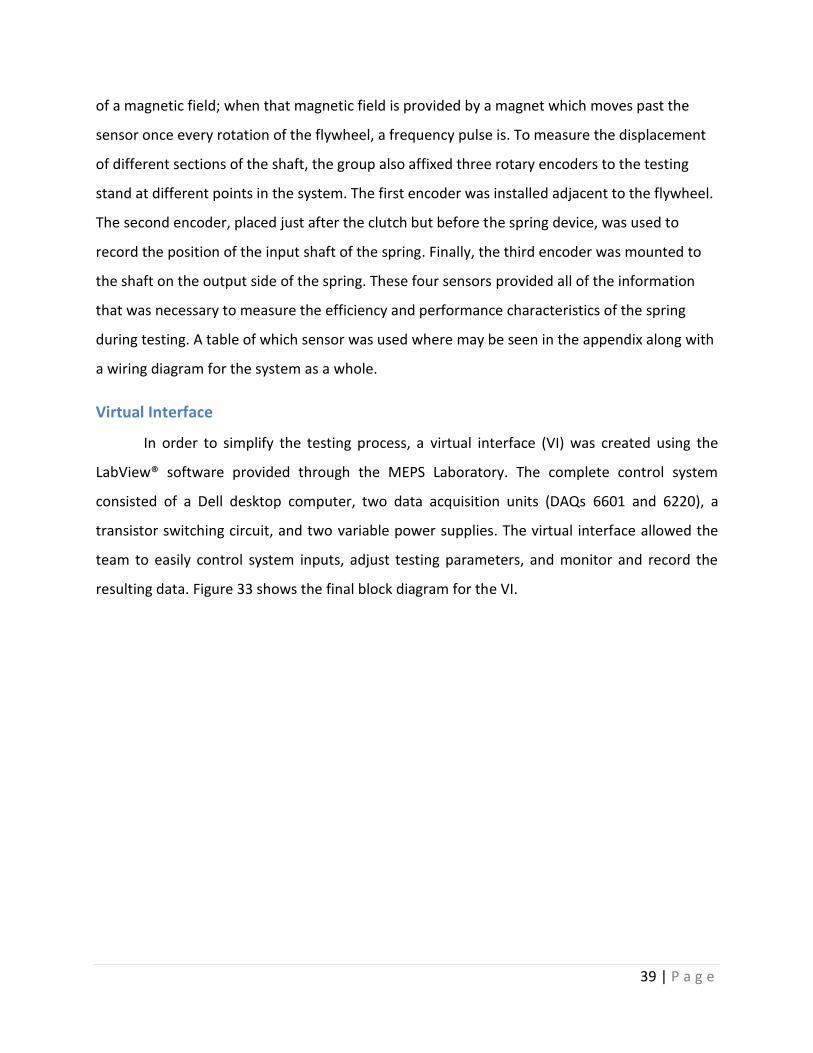
39 | P a g e
of a magnetic field; when that magnetic field is provided by a magnet which moves past the
sensor once every rotation of the flywheel, a frequency pulse is. To measure the displacement
of different sections of the shaft, the group also affixed three rotary encoders to the testing
stand at different points in the system. The first encoder was installed adjacent to the flywheel.
The second encoder, placed just after the clutch but before the spring device, was used to
record the position of the input shaft of the spring. Finally, the third encoder was mounted to
the shaft on the output side of the spring. These four sensors provided all of the information
that was necessary to measure the efficiency and performance characteristics of the spring
during testing. A table of which sensor was used where may be seen in the appendix along with
a wiring diagram for the system as a whole.
Virtual Interface
In order to simplify the testing process, a virtual interface (VI) was created using the
LabView® software provided through the MEPS Laboratory. The complete control system
consisted of a Dell desktop computer, two data acquisition units (DAQs 6601 and 6220), a
transistor switching circuit, and two variable power supplies. The virtual interface allowed the
team to easily control system inputs, adjust testing parameters, and monitor and record the
resulting data. Figure 33 shows the final block diagram for the VI.
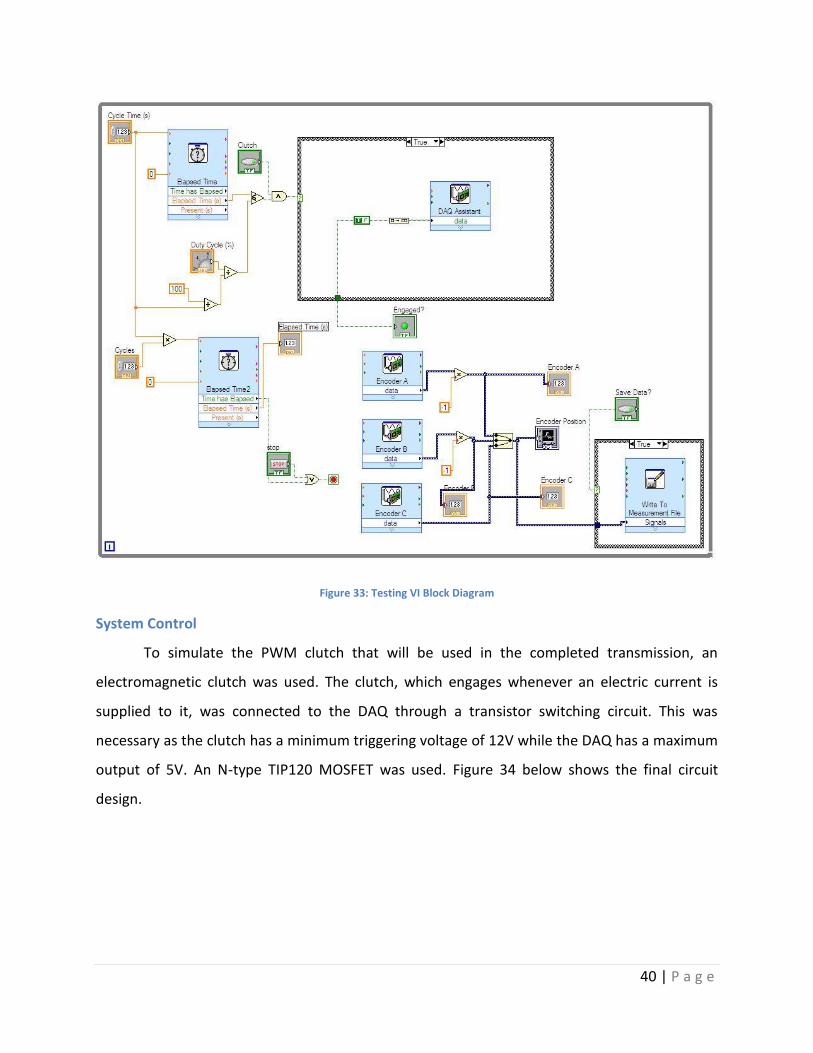
40 | P a g e
Figure 33: Testing VI Block Diagram
System Control
To simulate the PWM clutch that will be used in the completed transmission, an
electromagnetic clutch was used. The clutch, which engages whenever an electric current is
supplied to it, was connected to the DAQ through a transistor switching circuit. This was
necessary as the clutch has a minimum triggering voltage of 12V while the DAQ has a maximum
output of 5V. An N-type TIP120 MOSFET was used. Figure 34 below shows the final circuit
design.
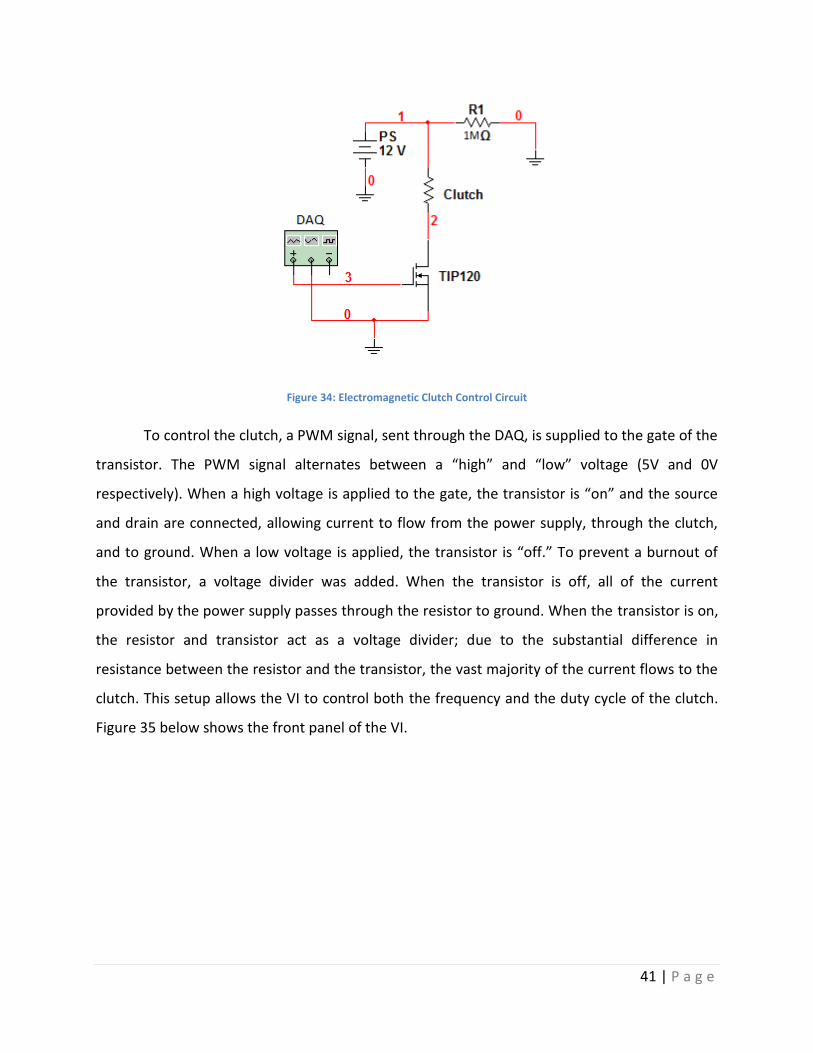
41 | P a g e
Figure 34: Electromagnetic Clutch Control Circuit
To control the clutch, a PWM signal, sent through the DAQ, is supplied to the gate of the
transistor. The PWM signal alternates between a “high” and “low” voltage (5V and 0V
respectively). When a high voltage is applied to the gate, the transistor is “on” and the source
and drain are connected, allowing current to flow from the power supply, through the clutch,
and to ground. When a low voltage is applied, the transistor is “off.” To prevent a burnout of
the transistor, a voltage divider was added. When the transistor is off, all of the current
provided by the power supply passes through the resistor to ground. When the transistor is on,
the resistor and transistor act as a voltage divider; due to the substantial difference in
resistance between the resistor and the transistor, the vast majority of the current flows to the
clutch. This setup allows the VI to control both the frequency and the duty cycle of the clutch.
Figure 35 below shows the front panel of the VI.
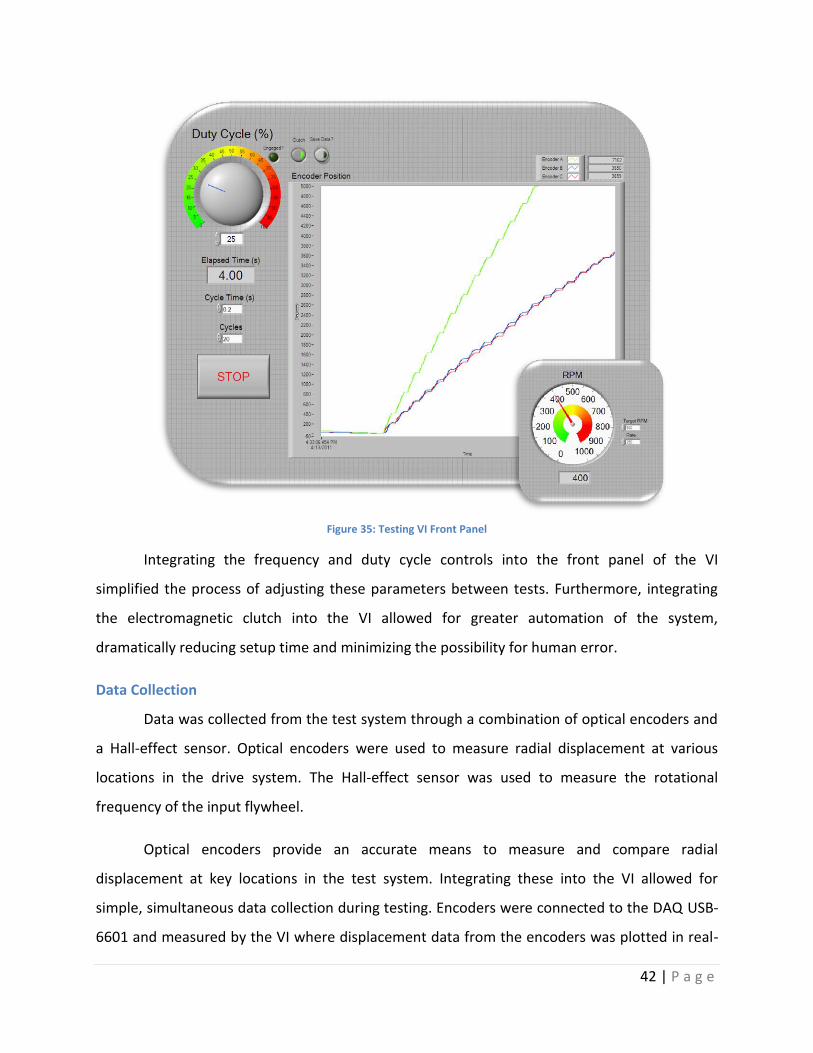
42 | P a g e
Figure 35: Testing VI Front Panel
Integrating the frequency and duty cycle controls into the front panel of the VI
simplified the process of adjusting these parameters between tests. Furthermore, integrating
the electromagnetic clutch into the VI allowed for greater automation of the system,
dramatically reducing setup time and minimizing the possibility for human error.
Data Collection
Data was collected from the test system through a combination of optical encoders and
a Hall-effect sensor. Optical encoders were used to measure radial displacement at various
locations in the drive system. The Hall-effect sensor was used to measure the rotational
frequency of the input flywheel.
Optical encoders provide an accurate means to measure and compare radial
displacement at key locations in the test system. Integrating these into the VI allowed for
simple, simultaneous data collection during testing. Encoders were connected to the DAQ USB-
6601 and measured by the VI where displacement data from the encoders was plotted in real-

43 | P a g e
time on the front panel. This allowed the team to easily monitor the system and watch the
changes in the system over time.
To measure rpms, the VI calculated the frequency from the pulses sent from the hall
effect sensor and used this to determine the RPMs. During development of the test system, it
was determined that the addition of the sensor used too much processing power and slowed
the computer down. To remedy this, a second VI was created specifically to measure the RPMs.
This VI was run only during the setup of each test to measure the initial RPMs of the flywheel.

44 | P a g e
Testing Procedure
Basic Procedures
The characteristics which were tested in both springs were efficiency and qualitative
traits. The qualitative portions were derived from analyzing high speed video of the prototypes
during use, which would give the group a good idea of whether or not the concept would work.
Efficiency was determined through quantitative analysis of the test data, this process is
described below. As outlined previously, the testing rig contained an input flywheel a clutch
and an output load (brake or string and mass) which would simulate on a small scale the actual
application of the spring. The data needed to calculate the efficiency was only based on energy
in vs. energy out. This along with the need for basic observations of the performance quality
and the small scale of the systems led to a low scale testing procedure.
Before getting into the details of the test procedure a basic procedure is provided. The
procedure simulates what the spring will see in the CVT system. At first the input flywheel is
spun up to a designated speed. The speed will vary test to test, but will be picked before the
test and measured using the RPM VI. Once the flywheel reaches the desired angular velocity
the motor is disengaged and the flywheel is spinning freely at the desired RPMs. After the
motor is disengaged the second VI is run. The VI will be preset to the correct duty ratio
resulting in the clutch cycling on and off to simulate the load being tested. The VI will also
collect the necessary data from the three encoders in order for it to be analyzed later.
Because the testing was low scale compared to what the full size system would be
operating at, the RPMs, duty cycles, and loads could also be low. The RPMs were kept under
1000 meaning relatively little energy was transferred through this system. As such, the tests all
were completed within 10 seconds of engaging the clutch because the system slowed down
quickly. The tests which were run on each spring may be seen below in Table 6.
Table 6: List of Tests Performed
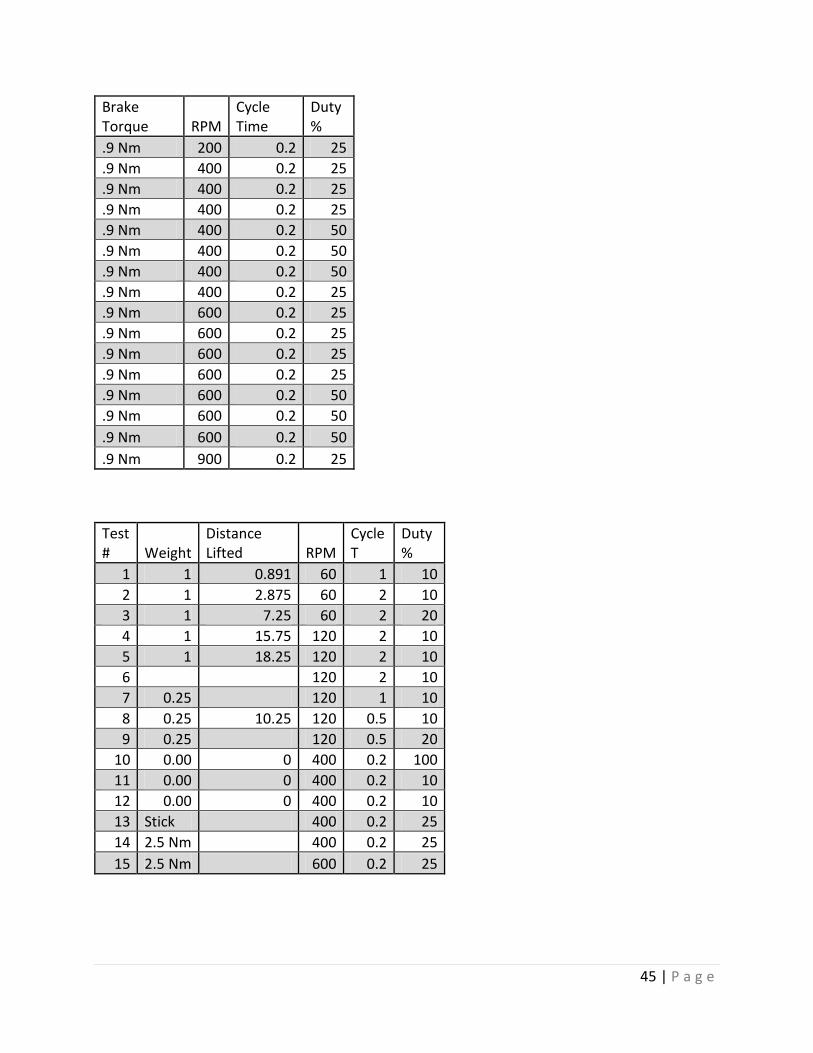
45 | P a g e
Brake Torque RPM
Cycle Time
Duty %
.9 Nm 200 0.2 25
.9 Nm 400 0.2 25
.9 Nm 400 0.2 25
.9 Nm 400 0.2 25
.9 Nm 400 0.2 50
.9 Nm 400 0.2 50
.9 Nm 400 0.2 50
.9 Nm 400 0.2 25
.9 Nm 600 0.2 25
.9 Nm 600 0.2 25
.9 Nm 600 0.2 25
.9 Nm 600 0.2 25
.9 Nm 600 0.2 50
.9 Nm 600 0.2 50
.9 Nm 600 0.2 50
.9 Nm 900 0.2 25
Test # Weight
Distance Lifted RPM
Cycle T
Duty %
1 1 0.891 60 1 10
2 1 2.875 60 2 10
3 1 7.25 60 2 20
4 1 15.75 120 2 10
5 1 18.25 120 2 10
6 120 2 10
7 0.25 120 1 10
8 0.25 10.25 120 0.5 10
9 0.25 120 0.5 20
10 0.00 0 400 0.2 100
11 0.00 0 400 0.2 10
12 0.00 0 400 0.2 10
13 Stick 400 0.2 25
14 2.5 Nm 400 0.2 25
15 2.5 Nm 600 0.2 25
46 | P a g e
Series Spring
The first test conducted for the series spring was a natural frequency test. For this test a
one pound mass was placed on the weight platform to put the spring under load. Next, the
pulley on the output was brought to max deflection. Once it reached max deflection the pulley
was released and the oscillations were observed. This procedure was repeated 10 times to
gather adequate data. The rest of the tests were done using the basic procedure and the
output load described in the section above. The mass of the output system was calibrated
using bottles of water because the weight could be varied quickly and easily. The weight was
calibrated by adjusting the weight to where the spring would show the load, but it would still
have enough deflection left to run an acceptable test.
Cam Spring
Just like in the case of the series spring, the first test run was a natural frequency test.
In this case the brake output load was calibrated for the entire test process before the natural
frequency test was run. In order to calibrate the brake we adjusted the pressure applied by the
brake pads on the rotor using the adjustment screw on the BB-7 braking calipers. The pressure
was selected when the output system resisted motion, but it was a small enough torque that
the spring still had the force to revert back to its natural resting position. Once the brake was
calibrated the natural frequency test was performed in a similar manner, by deflecting the
spring to near max deflection and observing any oscillations that occurred.
47 | P a g e
Results
Round 1
The first round of testing was done in order to narrow make a decision on the last two
designs, the cam spring and the series spring. This testing looked for qualitative characteristics
such as the series spring bottoming out or the cam spring overdriving, but also looked at
quantitative data such as efficiency of both systems. This section is broken up into the
qualitative and quantitative results and the final decision matrix. In the final decision matrix
the better of the two springs was chosen to be built and tested at full scale.
Qualitative Results
Series Spring
During the design process of the series spring the biggest issue identified by the group
involved determining if a large enough deflection could be obtained through this design. This
problem was solved by adding more discs until the desired deflection could be achieved. Once
it became clear that the spring design would need a multitude of discs, another problem arose.
The group became concerned that the initial springs in the assembly would compress too
quickly allowing the discs to collide into each other which would lead to early failure of the
system. In running the first round of testing the group watched very closely to make sure this
didn’t occur. Unfortunately In most tests the initial pulse of the clutch was enough for the
series spring to bottom out and cause the discs to collide with one another. The bottoming out
behavior is directly related to fact that the effective inertia on either side of each disc is
different which means that a rethinking of the design would be necessary if it were to be taken
to the second round.
The other qualitative test is a test of the concept itself investigates whether the spring
demonstrates the appropriate performance qualities. This data was accrued through the
analysis of the graphs compiled in matlab, as well as through high speed video analysis. In the
series spring very good compliance qualities were demonstrated. Through the high speed
48 | P a g e
camera the group observed the input with a very jerky angular motion while the output had a
nearly constant angular velocity motion.
Cam Spring
The possible problems that the group expected to arise from the cam spring were
asymmetrical motion of the followers and the possibility of the followers jumping over the cam.
The cam was designed to have two identical faces on each side and corresponding followers.
Because the motion of the output followers relied on both the motion of the input followers
and the cam the group was not completely positive that the input followers and output
followers would mirror each other’s movements and therefore unevenly split the load. During
both slow speed and high speed analysis, symmetric follower travel was exhibited which
validated the concept significantly.
The output system for the testing rig of the cam spring was designed to be a constant
torque bike brake. What actually occurred was a varying torque output without inertia. At
different angular displacements the torque would increase and decrease based on the
transition from static to dynamic friction. This caused jerky motion in the cam spring and
without inertia every pulse was similar to starting from a stop. This led to issues such as the
cam spring being under load and the followers starting a pulse already halfway up the cam face.
At low speeds the cam would take two input pulses in order to get one output pulse. The group
coined the term ‘double pulse’ for this effect. With higher speeds the double pulse effect
caused the followers to overrun the cam and lose 180 degrees of input deflection. This
problem arose due to the fact that the Lexan supports for the spring would flex too much under
load. In the full scale design, there is a physical stopping point that prevents the followers from
going past 180 degrees of deflection.
Quantitative Results
Data collected from the optical encoders during testing was used to compare the efficiency
of the two designs. Angular displacement, velocity, and acceleration plots were calculated for
each test from this data. From this, the efficiency was determined while providing visual
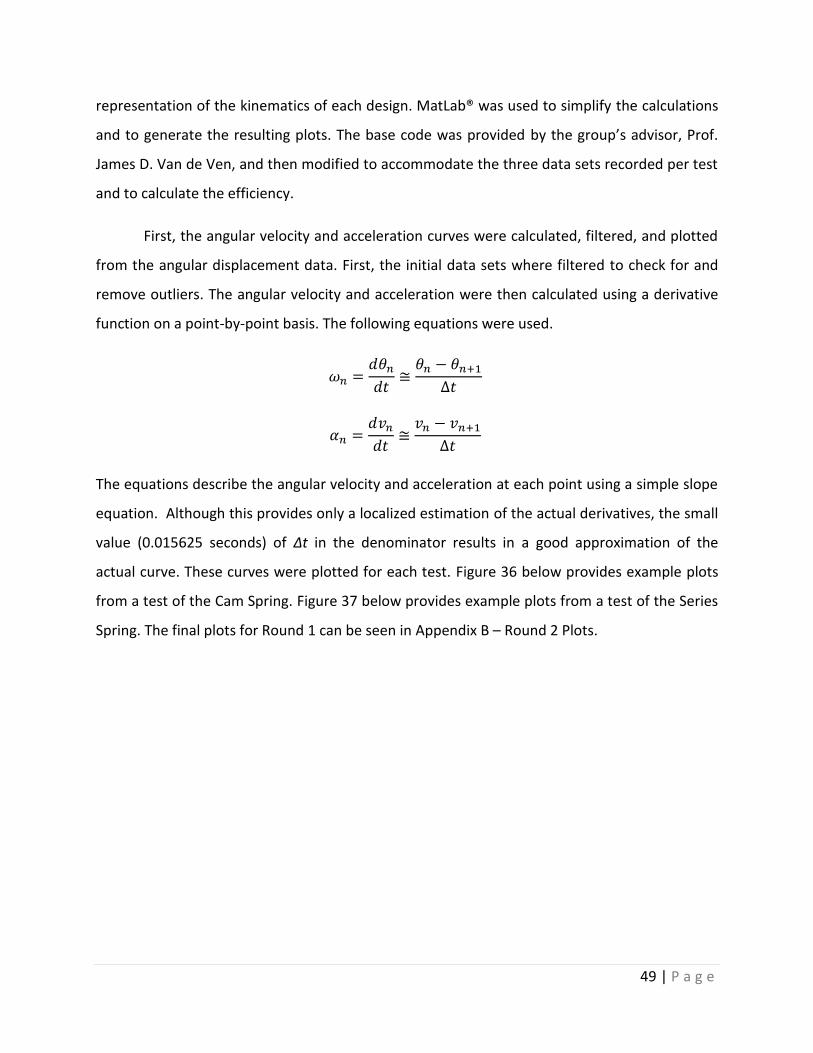
49 | P a g e
representation of the kinematics of each design. MatLab® was used to simplify the calculations
and to generate the resulting plots. The base code was provided by the group’s advisor, Prof.
James D. Van de Ven, and then modified to accommodate the three data sets recorded per test
and to calculate the efficiency.
First, the angular velocity and acceleration curves were calculated, filtered, and plotted
from the angular displacement data. First, the initial data sets where filtered to check for and
remove outliers. The angular velocity and acceleration were then calculated using a derivative
function on a point-by-point basis. The following equations were used.
The equations describe the angular velocity and acceleration at each point using a simple slope
equation. Although this provides only a localized estimation of the actual derivatives, the small
value (0.015625 seconds) of Δt in the denominator results in a good approximation of the
actual curve. These curves were plotted for each test. Figure 36 below provides example plots
from a test of the Cam Spring. Figure 37 below provides example plots from a test of the Series
Spring. The final plots for Round 1 can be seen in Appendix B – Round 2 Plots.
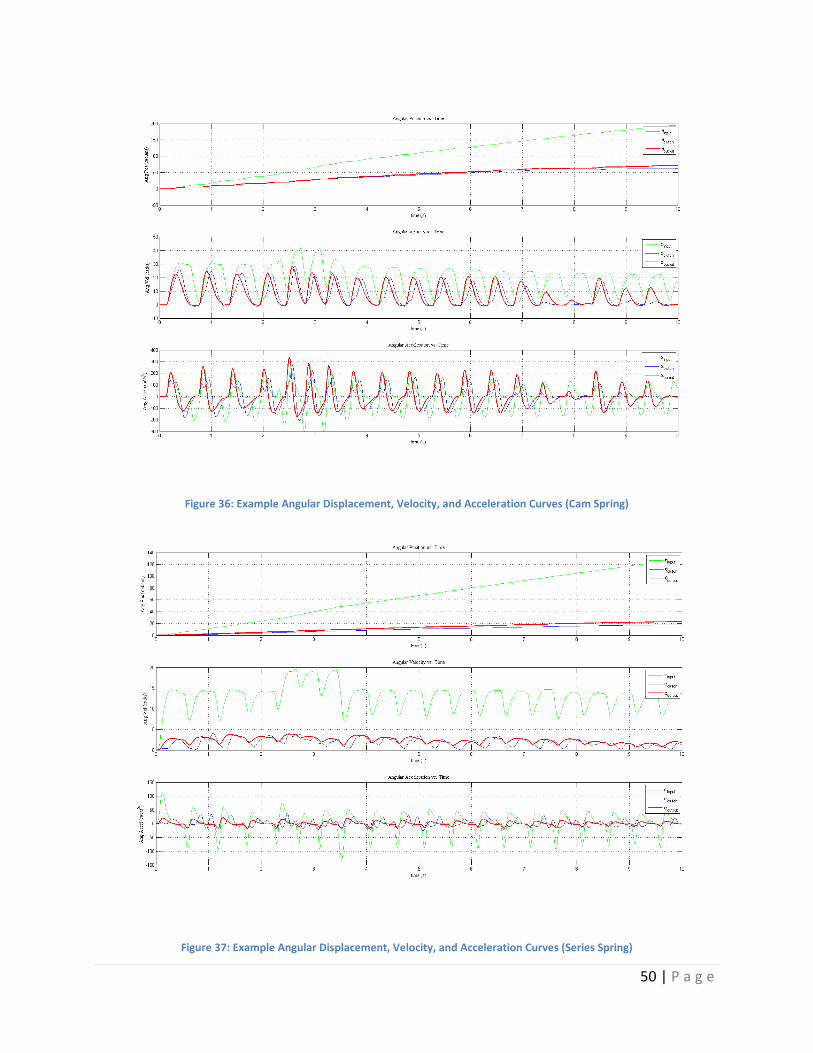
50 | P a g e
Figure 36: Example Angular Displacement, Velocity, and Acceleration Curves (Cam Spring)
Figure 37: Example Angular Displacement, Velocity, and Acceleration Curves (Series Spring)

51 | P a g e
Next, efficiencies for each system were calculated. First, linear regression analyses of
the angular velocities were made. Using this, the instantaneous kinetic energies of the input,
clutch, and output were calculated. Using the same equations used to describe the angular
velocity and acceleration, the change in kinetic energy over time was calculated. Finally, the
efficiency of each test was calculated using the following equation where the energy output by
the spring was divided by the energy put in to the spring.
||
⁄
⁄
||
The overall efficiency for each design was determined by averaging the resulting
efficiency of each test.
In the series spring, the average efficiency of the prototype was found to be %69. The
average efficiency of the cam spring was found to be 62%. Both prototypes were less efficient
at low speeds and gained efficiency with higher rpms and duty cycles. The individual results of
each test may be graphically seen in the Appendix. Raw data of each test may be found on the
group’s sharepoint page.
52 | P a g e
Round 2
After selecting the Cam Spring as the final design, production began on the full-scale,
final spring. Based upon the performance of the Cam Spring during initial testing, no revisions
of the cam or any other aspect of the device were necessary. To reduce manufacturing time,
especially for the cam, the final parts were outsourced to a local machine shop where they
were machined from AISI 304 Stainless Steel. Upon receiving the completed parts, the final
spring was assembled and tested.
Testing took place at 400 and 600 RPMs as well as at various duty cycles. Although the
initial methodology called for final testing at 1000 RPMs, problems occurred during testing that
could not be overcome. Specifically, the axial thrust resulting from the compression of the
linear springs caused binding in the system, despite the addition of the thrust cross-beams.
Furthermore, the additional torque applied by the system sheared a pin in the input shaft which
locates its rotational position to that of the clutch. Replacement of the pin revealed that the
resulting torque for this round of testing would shear the pin within 1-2 tests, making data
collection difficult and unreliable. However, data sets that were collected showed that the final
system performed as predicted by testing during Round 1.
Qualitative Results
As with the first round of testing, qualitative testing was performed using a high speed
camera, taken at 260 FPS. The resulting video shows the Cam Spring functioning as expected;
with the spring smoothing the output as well as the Series Spring did during Round 1 testing.
This shows that the jerky output exhibited by the Cam Spring during Round 1 testing was
primarily due to the output disc brake and not the design itself.
Quantitative Results
As with the first round of testing, quantitative analysis of the system was performed by
measuring the angular displacement, velocity, and acceleration. No aspects of data collection
were changed. The resulting encoder data was analyzed using MatLab®. The resulting angular
displacement, velocity, and acceleration plots (Appendix B – Round 2 Plots) show that the
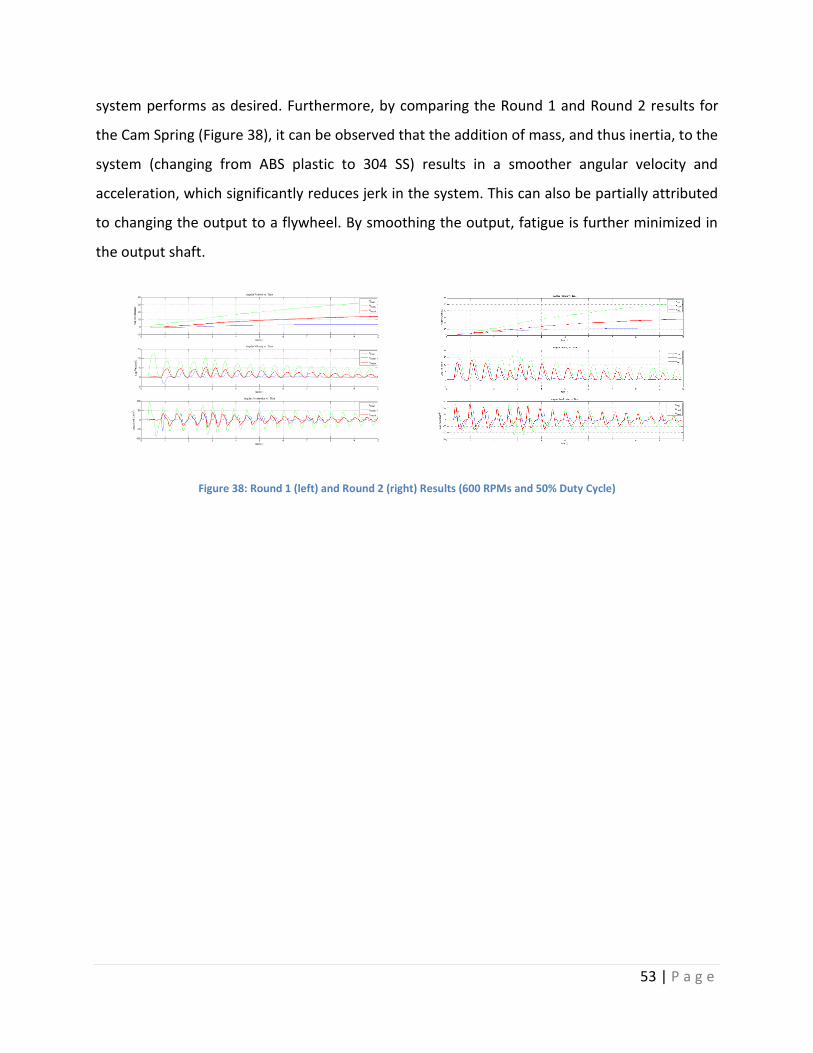
53 | P a g e
system performs as desired. Furthermore, by comparing the Round 1 and Round 2 results for
the Cam Spring (Figure 38), it can be observed that the addition of mass, and thus inertia, to the
system (changing from ABS plastic to 304 SS) results in a smoother angular velocity and
acceleration, which significantly reduces jerk in the system. This can also be partially attributed
to changing the output to a flywheel. By smoothing the output, fatigue is further minimized in
the output shaft.
Figure 38: Round 1 (left) and Round 2 (right) Results (600 RPMs and 50% Duty Cycle)

54 | P a g e
Conclusions and Recommendations
The purpose of the project was to complete the table top model of the CVT system by
implementing a torsion spring coupled with the clutch. Three tasks were necessary to
accomplish this. First, develop a torsion spring which meets the physical and mechanical
requirements of the system. Second, manufacture a full-scale, working prototype. Finally, test
the design in a simulated, complete system. The first task was completed by developing,
mathematically analyzing using finite element analysis and dynamic calculations as needed, and
then narrowing down 14 initial designs. Each of these designs, including the two chosen for
prototyping and initial testing, met the physical specifications for size, inertial qualities, and
deflection capabilities. From these, two designs were chosen for baseline testing. Adding this
step resulted in a greater time requirement. Additionally, the VI took much longer to
implement than originally planned.
Initially, the group hoped to facilitate development of the testing assembly by recycling
components used by previous groups. However, this resulted in unforeseen setbacks. While
the system was well suited for testing during Round 1, which was scaled down to accommodate
the materials used, complications occurred during final testing. Specifically, the testing
assembly proved unable to withstand the axial thrust loads applied by the final spring. The
system output also proved problematic. Using a small flywheel for the series spring worked
well. However, using a bicycle disc brake for the cam spring negatively affected the output of
the spring as the disc brake could not provide a constant resistive torque nor simulate an
inertial load. As such, a disc brake alone should not be used in future testing unless some form
of inertia load is also used. This will help better model the output of the CVT system.
Another setback, of the project was the time necessary to machine parts. Despite the
use of rapid prototyping during Round 1 testing, development of the initial Cam Spring and
Series Spring took far longer than anticipated. This was due to the time required to machine
non-rapid prototyped components, such as the shafts. To alleviate this during development of
the final design, the final parts were outsourced. However, once the cam spring was selected as
the final device, too much time was spent locating a machine shop to do the work. The parts
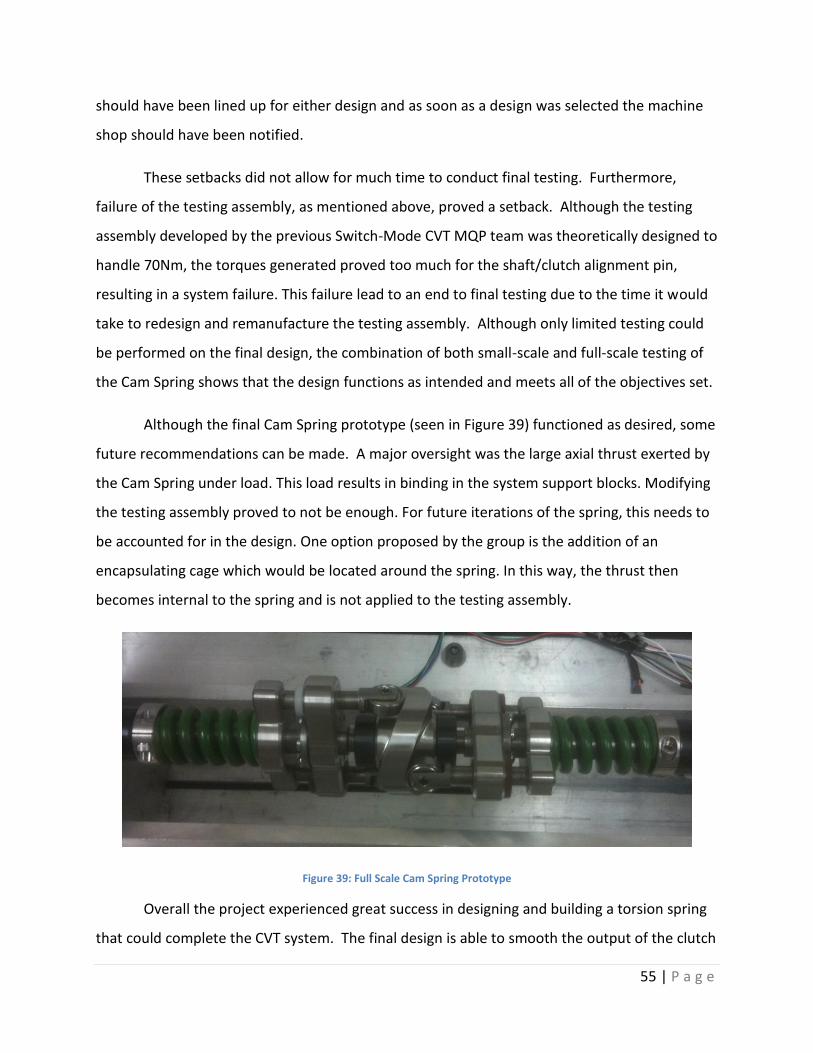
55 | P a g e
should have been lined up for either design and as soon as a design was selected the machine
shop should have been notified.
These setbacks did not allow for much time to conduct final testing. Furthermore,
failure of the testing assembly, as mentioned above, proved a setback. Although the testing
assembly developed by the previous Switch-Mode CVT MQP team was theoretically designed to
handle 70Nm, the torques generated proved too much for the shaft/clutch alignment pin,
resulting in a system failure. This failure lead to an end to final testing due to the time it would
take to redesign and remanufacture the testing assembly. Although only limited testing could
be performed on the final design, the combination of both small-scale and full-scale testing of
the Cam Spring shows that the design functions as intended and meets all of the objectives set.
Although the final Cam Spring prototype (seen in Figure 39) functioned as desired, some
future recommendations can be made. A major oversight was the large axial thrust exerted by
the Cam Spring under load. This load results in binding in the system support blocks. Modifying
the testing assembly proved to not be enough. For future iterations of the spring, this needs to
be accounted for in the design. One option proposed by the group is the addition of an
encapsulating cage which would be located around the spring. In this way, the thrust then
becomes internal to the spring and is not applied to the testing assembly.
Figure 39: Full Scale Cam Spring Prototype
Overall the project experienced great success in designing and building a torsion spring
that could complete the CVT system. The final design is able to smooth the output of the clutch

56 | P a g e
as desired while still remaining well within the physical requirements of the system. Future
work will involve complete integration of the Cam Spring into the full CVT system, including the
existing clutch prototype.

57 | P a g e
References
Anonymous. (2010, September 18). Duty Cycle. Retrieved October 12, 2010, from Wikipedia:
http://en.wikipedia.org/wiki/Duty_cycle
Baseley et. al., S. (2007). Power Density versus Energy Density of Various Technologies. SAE
International.
Birch, S. (2010). Audi takes CVT from 15th century to 21st century. Retrieved October 12, 2010,
from SAE International: http://www.sae.org/automag/techbriefs_01-00/03.htm
Duffy, S. (n.d.). Hybrid Car Sales Figures. Retrieved October 12, 2010, from Hybrid Car.
Harris, W. (n.d.). How CVTs Work. Retrieved October 12, 2010, from How Stuff Works:
http://auto.howstuffworks.com/cvt.htm
Hebner, R., Beno, J., Walls, A., & University of Texas, A. (2002). Flywheel Batteries Come Around
Again. Spectrum, IEEE, 46-51.
Jonsson, E. (1954). Patent No. 2,873,110. United States.
Lawrence Livermore National Laboratories, US DOE. (August 2010). Estimated Energy Use in
2009: ~94.6 Quads. Livermore, CA.
Morocco, A. J., Lambusta, C. M., DeMalia, M. A., & Araujo, J. M. (2009). Switch-Mode
Continuously Variable Transmission. Worcester, MA: Worcester Polytechnic Institute.
Nashawi, I. S. (2010). Forecasting World Crude Oil Production Using Multicyclic Hubbert Model.
Energy & Fuels, 1788-1800.

58 | P a g e
Norton, R. L. (2009). Cam Design and Manufacturing Handbook. Industrial Press, Inc.
Norton, R. L. (2010). Design of Machinery. Prentice Hall.
SAE International. (1996). SAE Manual on Design and Application of Helical and Spiral Springs.
Warrendale, PA: SAE International.
Takeuchi, H. (1992). Patent No. 5,163,875. United States.
Williams, J. L. (2007). Oil Price History and Analysis. Retrieved October 12, 2010, from WTRG
Economics: http://www.wtrg.com/prices.htm
Wolff, C. (n.d.). Peak and Average Power. Retrieved October 12, 2010, from Radar Tutorial.eu:
http://www.radartutorial.eu/18.explanations/ex28.en.html
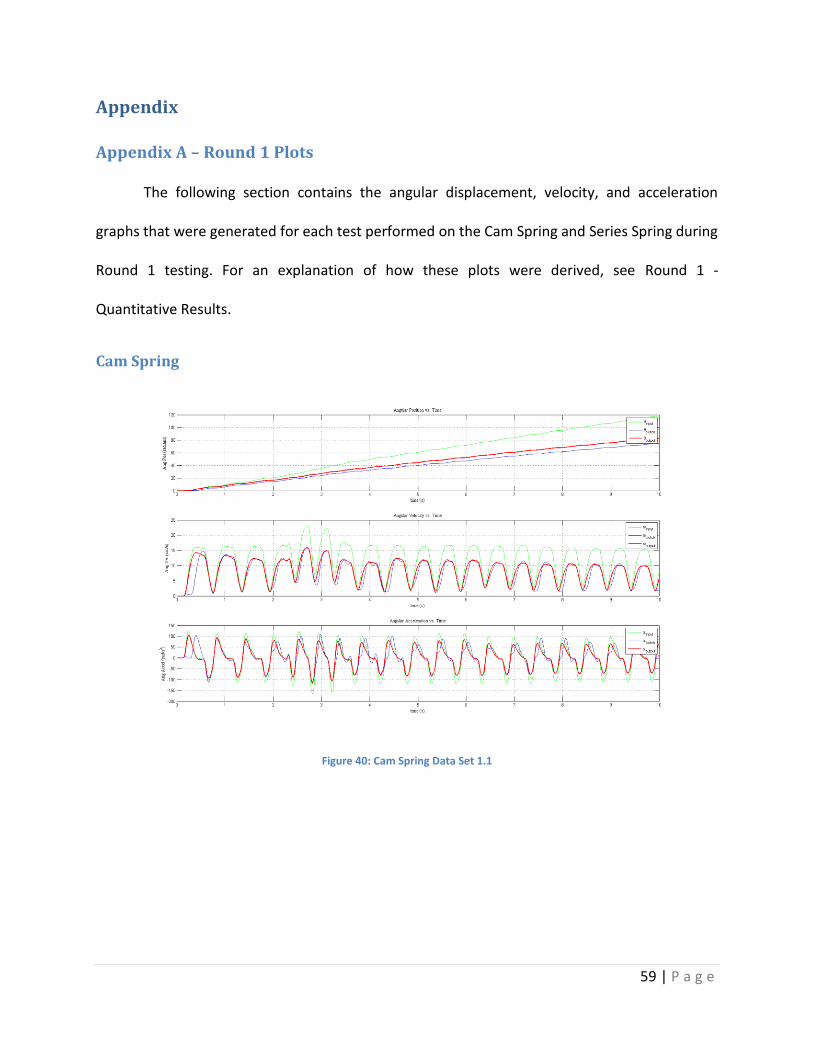
59 | P a g e
Appendix
Appendix A – Round 1 Plots
The following section contains the angular displacement, velocity, and acceleration
graphs that were generated for each test performed on the Cam Spring and Series Spring during
Round 1 testing. For an explanation of how these plots were derived, see Round 1 -
Quantitative Results.
Cam Spring
Figure 40: Cam Spring Data Set 1.1
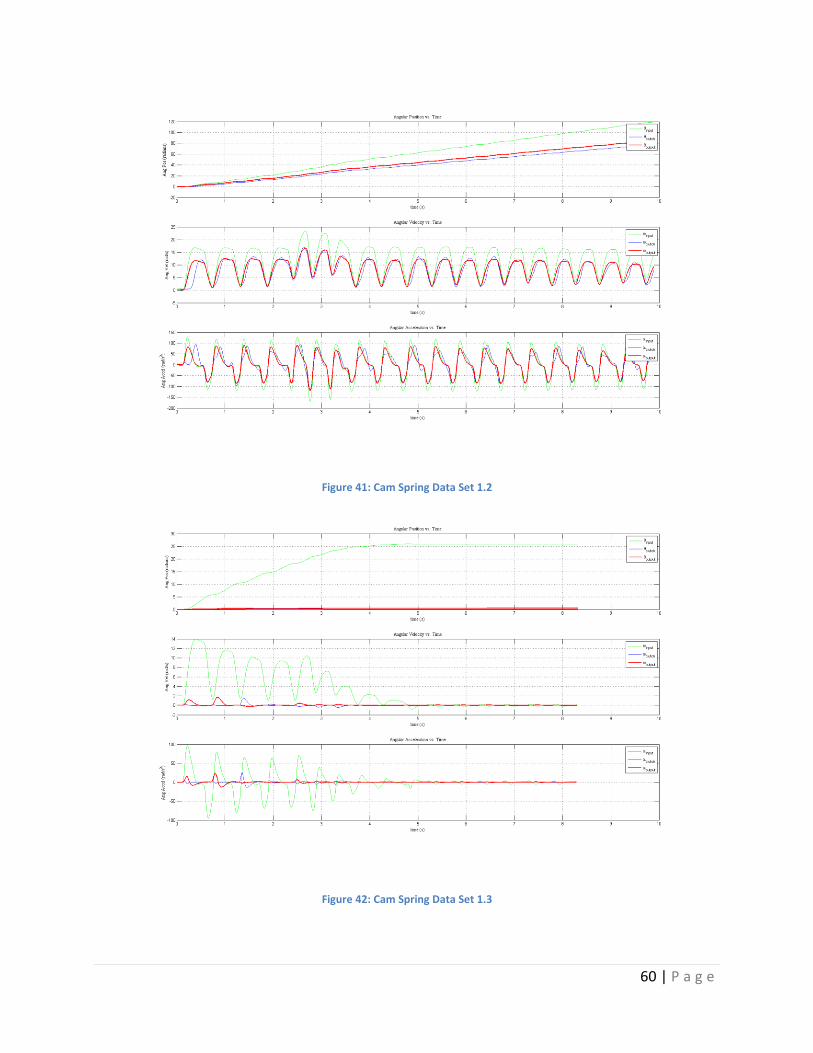
60 | P a g e
Figure 41: Cam Spring Data Set 1.2
Figure 42: Cam Spring Data Set 1.3
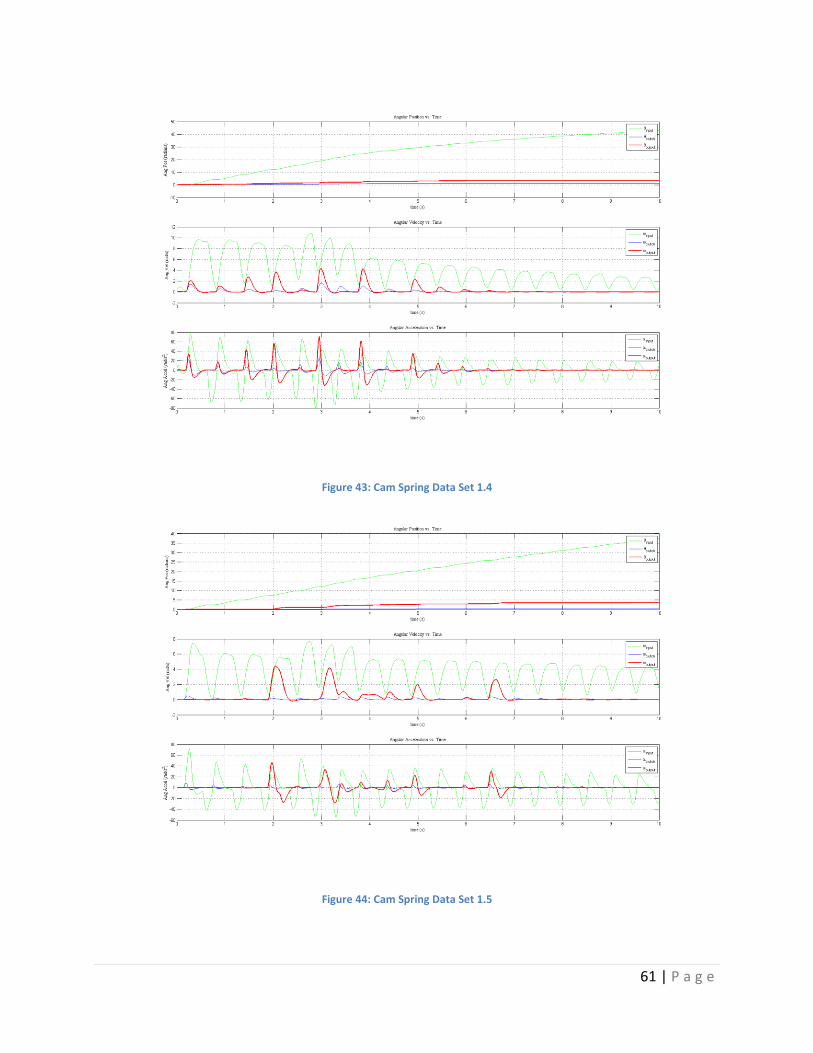
61 | P a g e
Figure 43: Cam Spring Data Set 1.4
Figure 44: Cam Spring Data Set 1.5
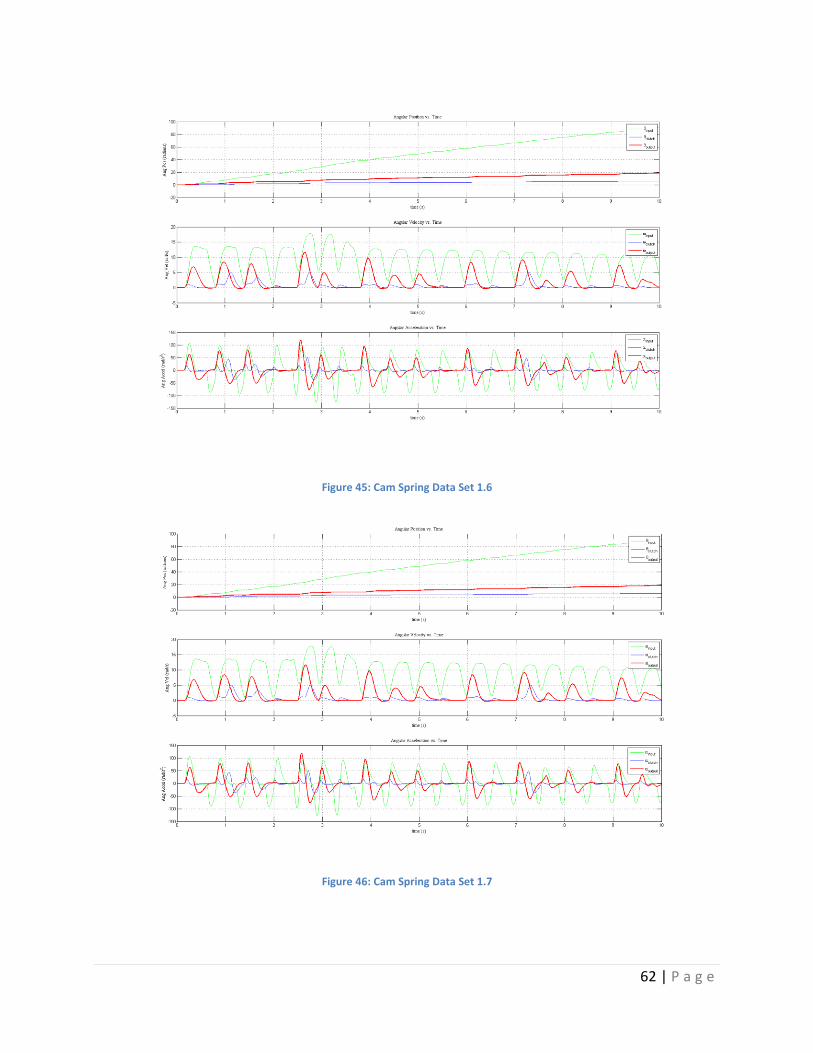
62 | P a g e
Figure 45: Cam Spring Data Set 1.6
Figure 46: Cam Spring Data Set 1.7
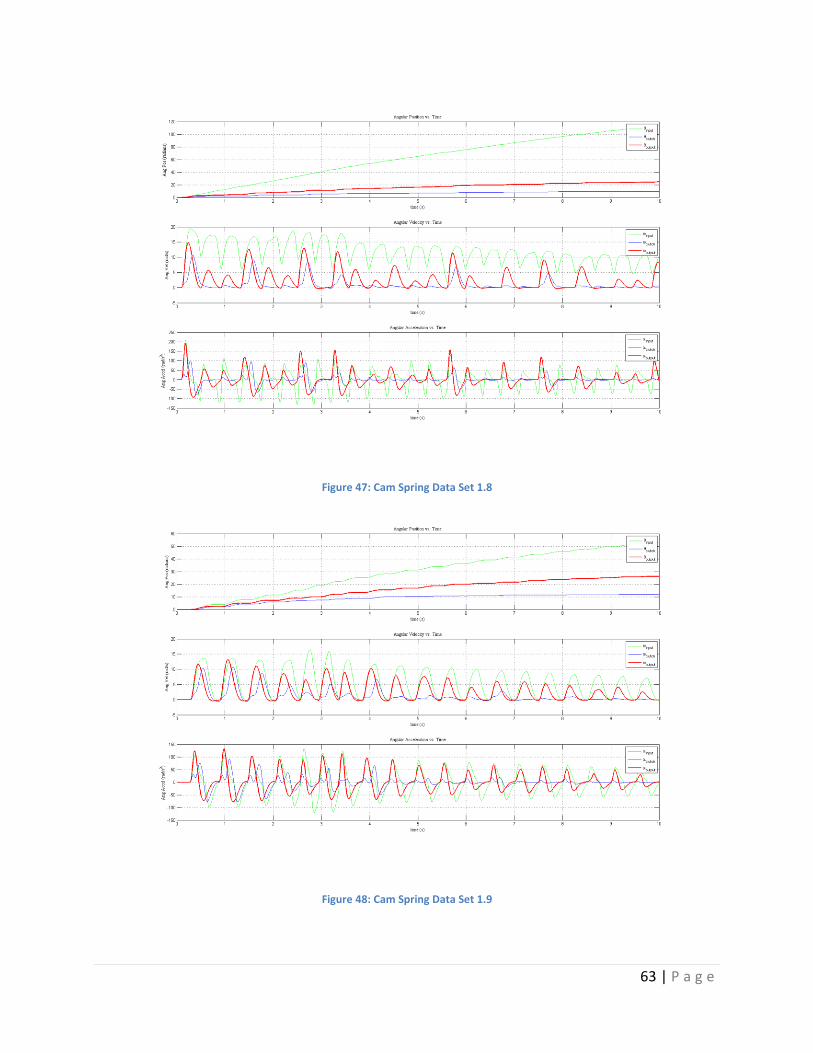
63 | P a g e
Figure 47: Cam Spring Data Set 1.8
Figure 48: Cam Spring Data Set 1.9
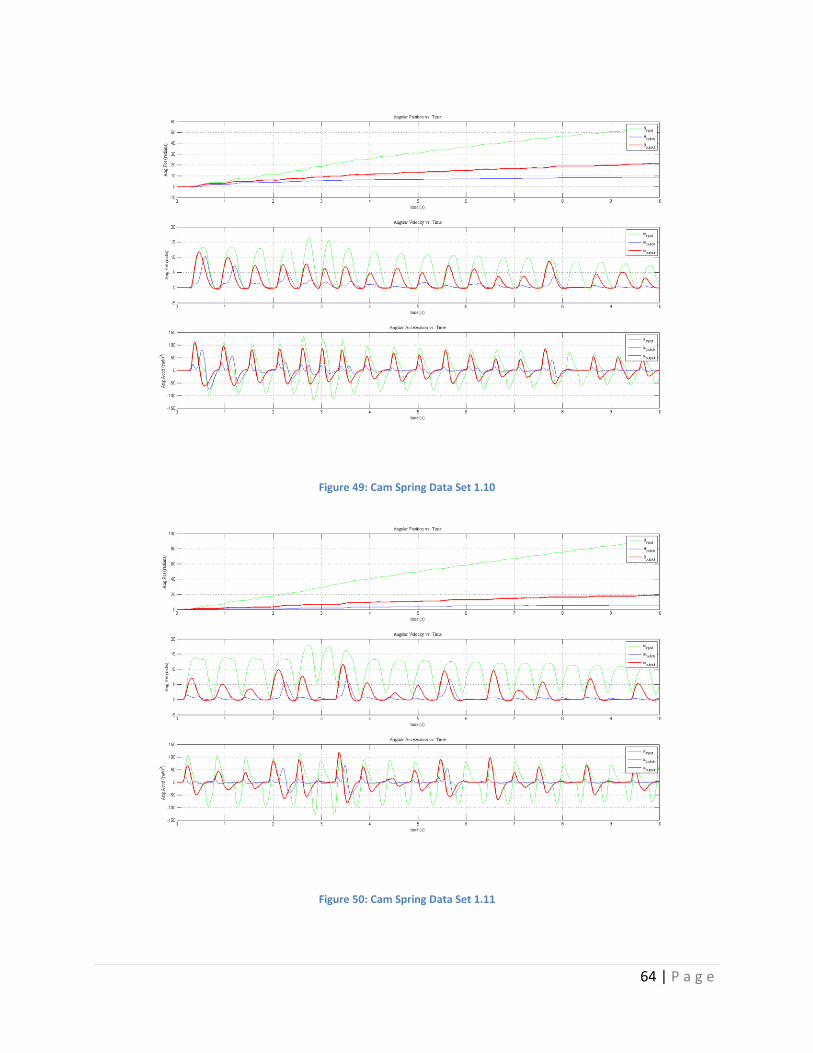
64 | P a g e
Figure 49: Cam Spring Data Set 1.10
Figure 50: Cam Spring Data Set 1.11
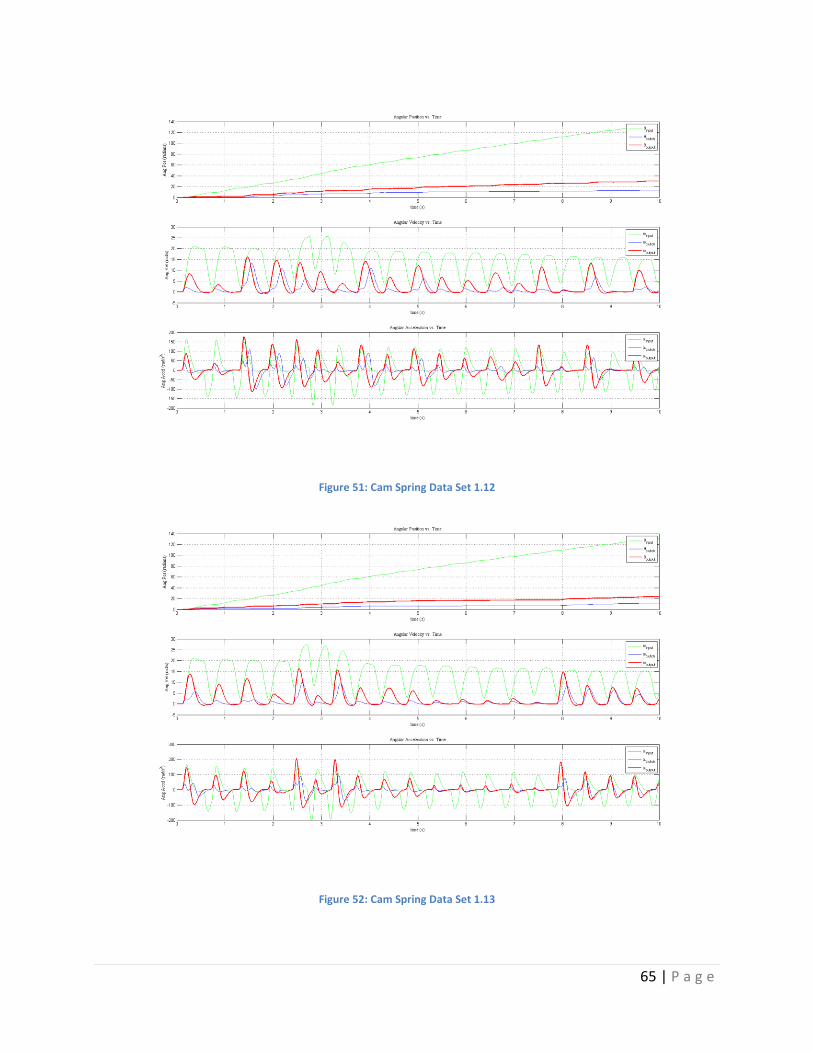
65 | P a g e
Figure 51: Cam Spring Data Set 1.12
Figure 52: Cam Spring Data Set 1.13
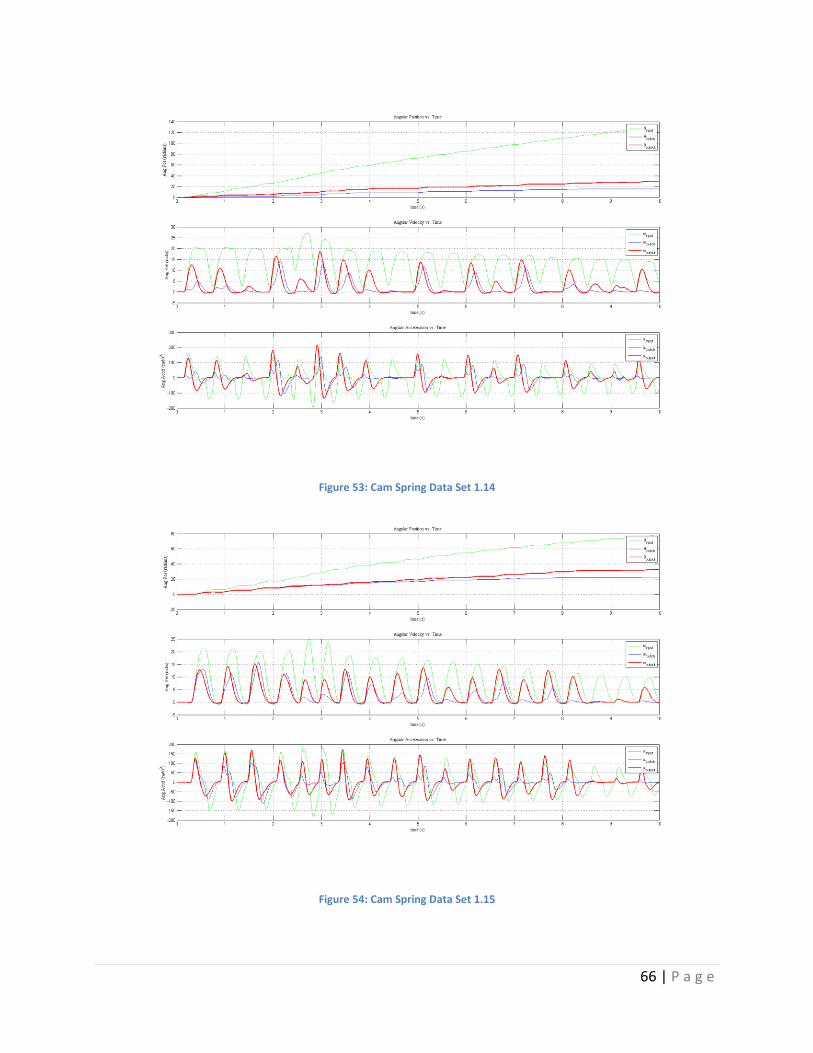
66 | P a g e
Figure 53: Cam Spring Data Set 1.14
Figure 54: Cam Spring Data Set 1.15
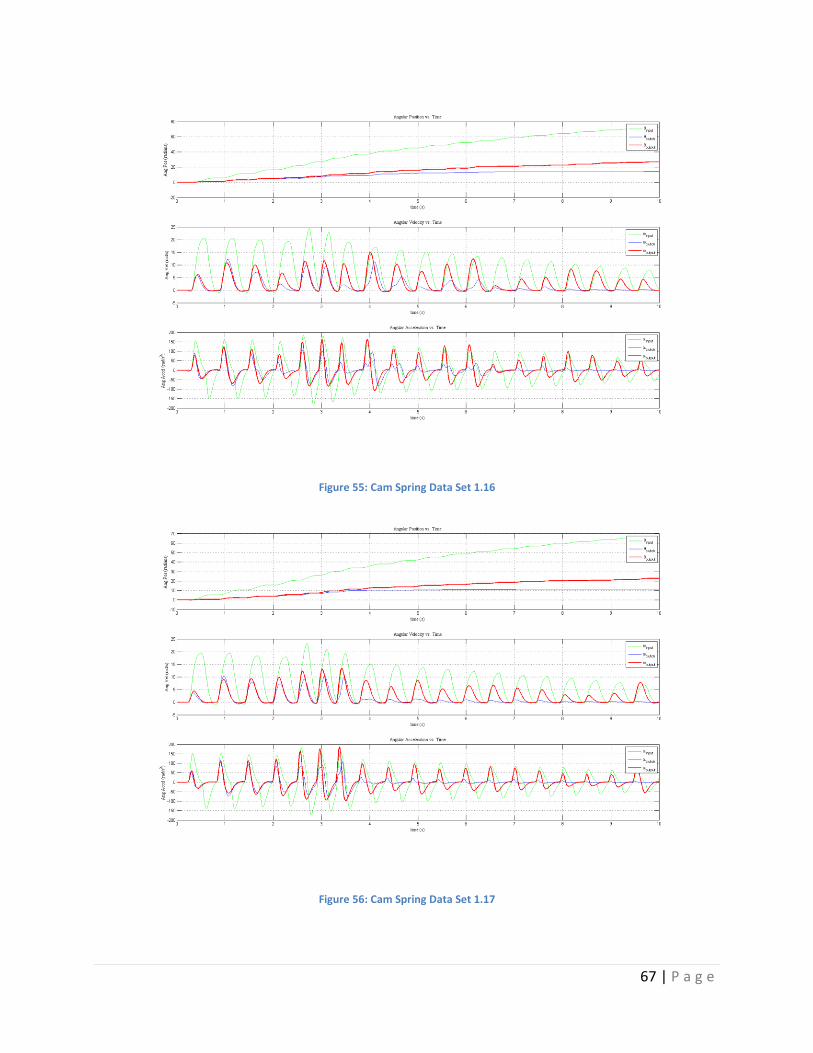
67 | P a g e
Figure 55: Cam Spring Data Set 1.16
Figure 56: Cam Spring Data Set 1.17
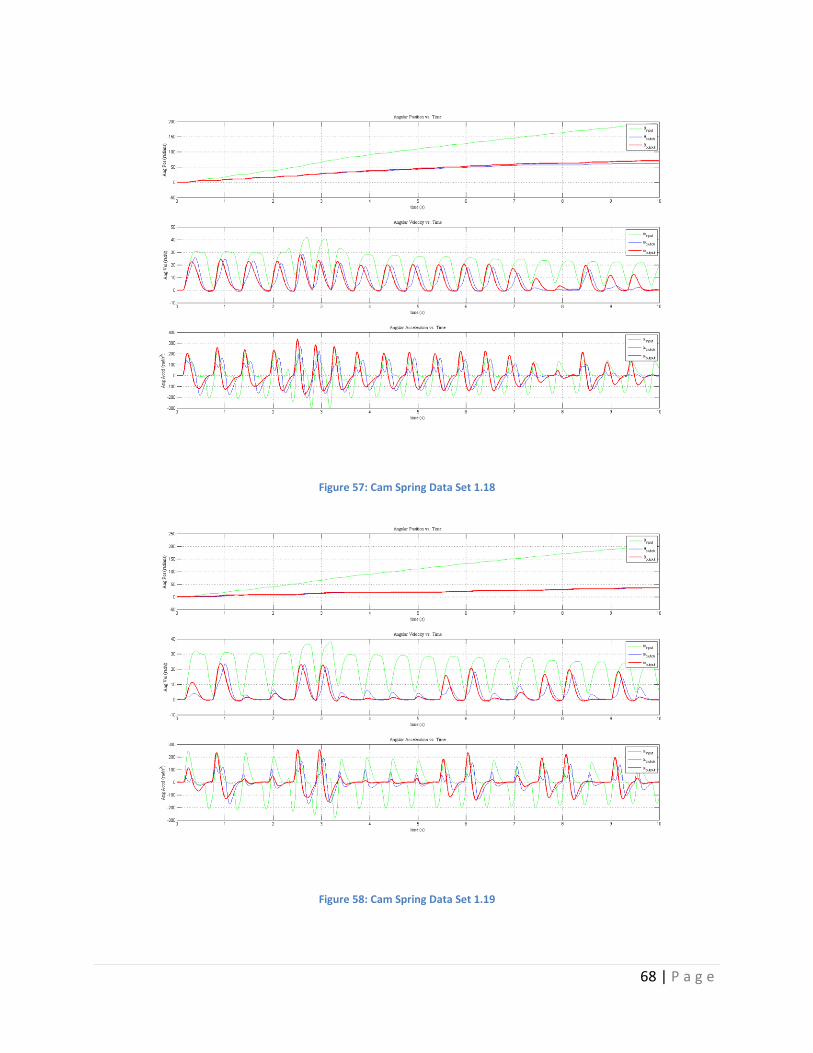
68 | P a g e
Figure 57: Cam Spring Data Set 1.18
Figure 58: Cam Spring Data Set 1.19
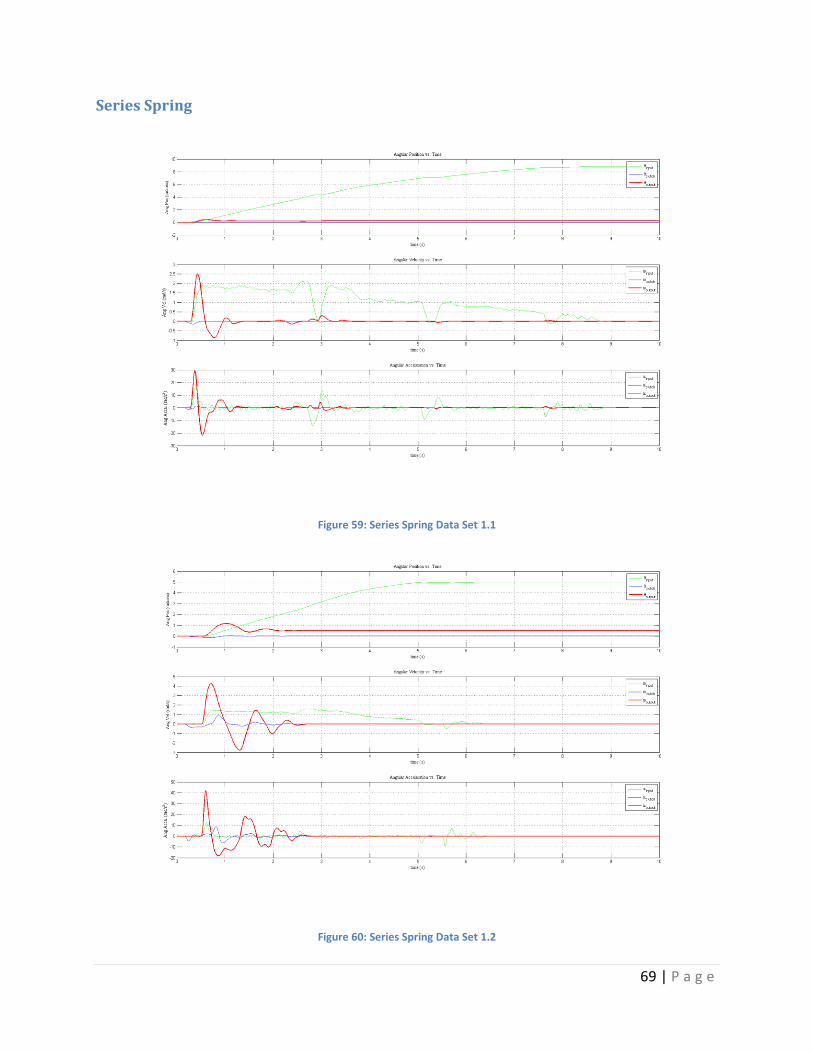
69 | P a g e
Series Spring
Figure 59: Series Spring Data Set 1.1
Figure 60: Series Spring Data Set 1.2
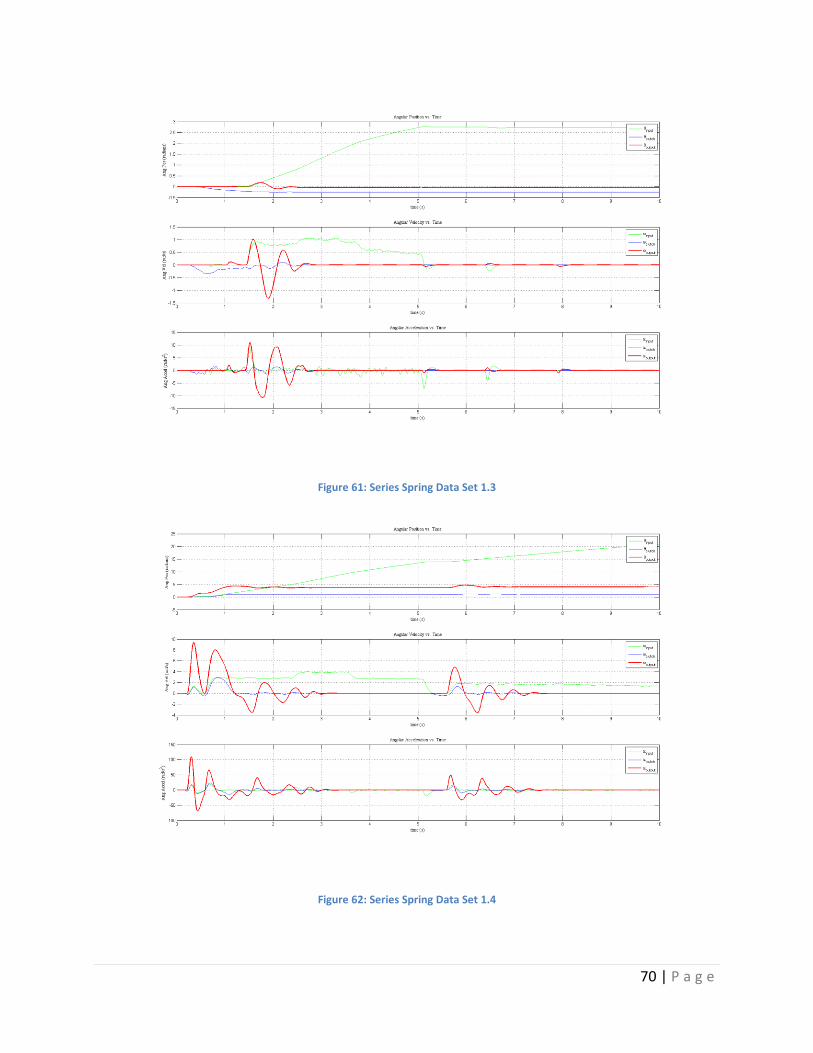
70 | P a g e
Figure 61: Series Spring Data Set 1.3
Figure 62: Series Spring Data Set 1.4
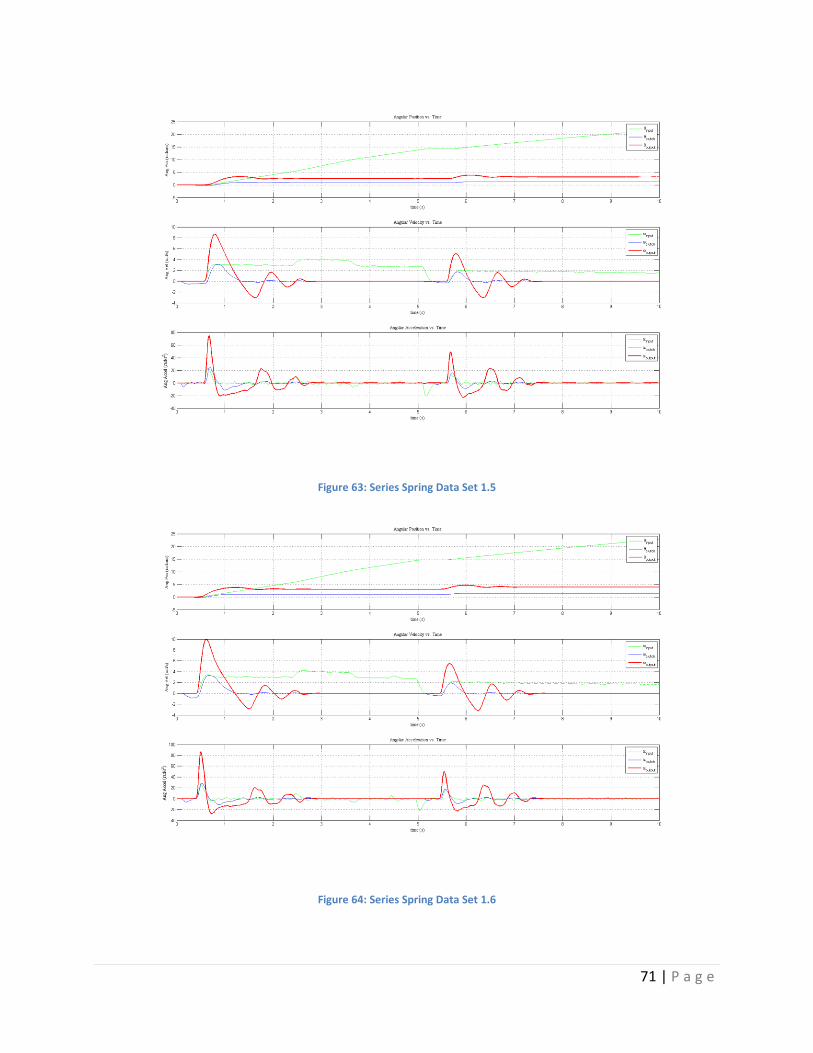
71 | P a g e
Figure 63: Series Spring Data Set 1.5
Figure 64: Series Spring Data Set 1.6
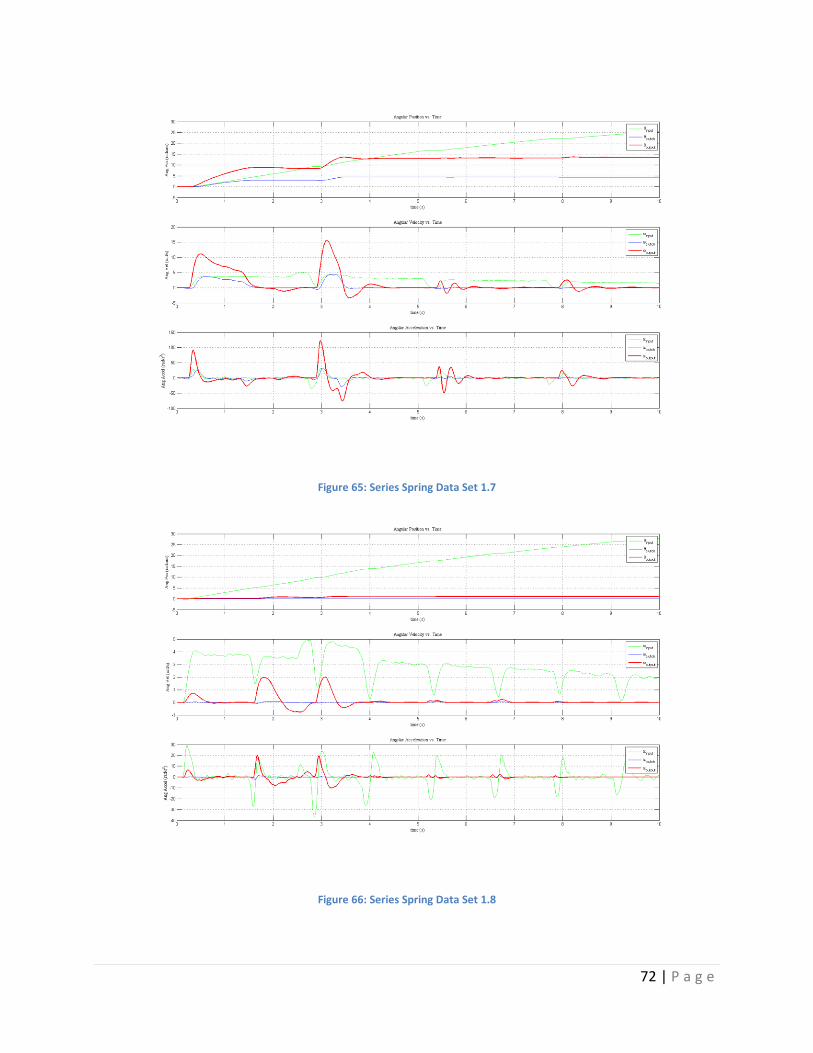
72 | P a g e
Figure 65: Series Spring Data Set 1.7
Figure 66: Series Spring Data Set 1.8
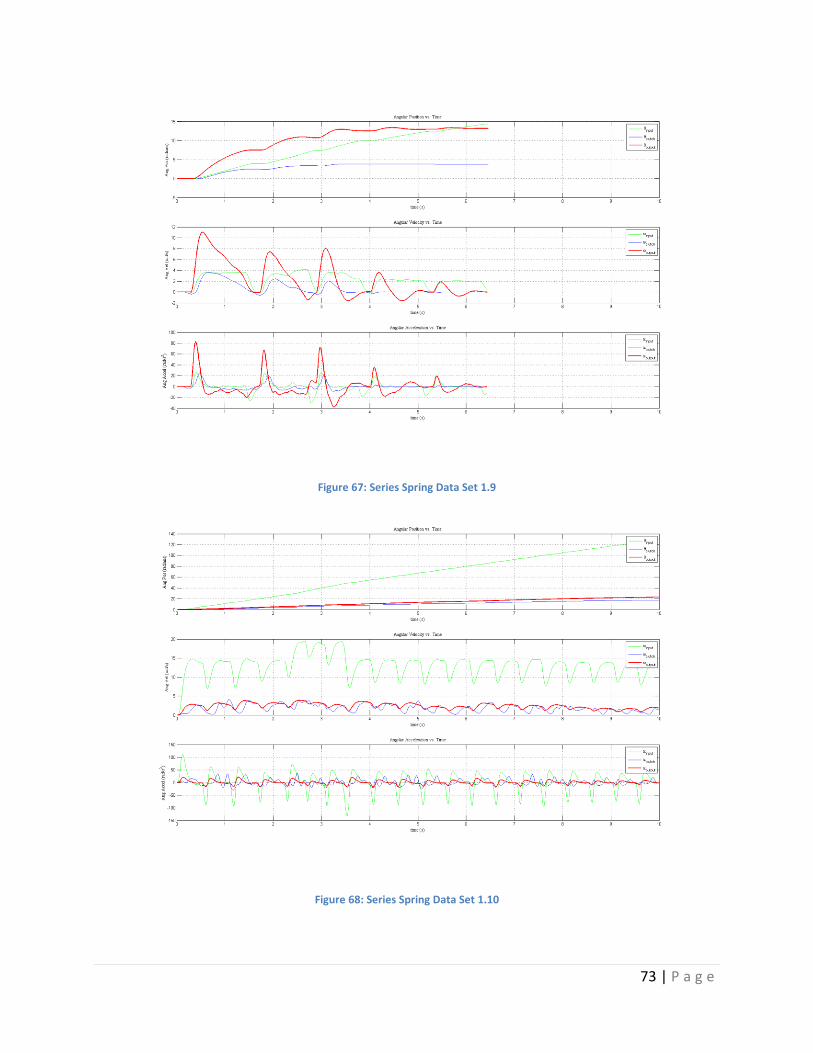
73 | P a g e
Figure 67: Series Spring Data Set 1.9
Figure 68: Series Spring Data Set 1.10
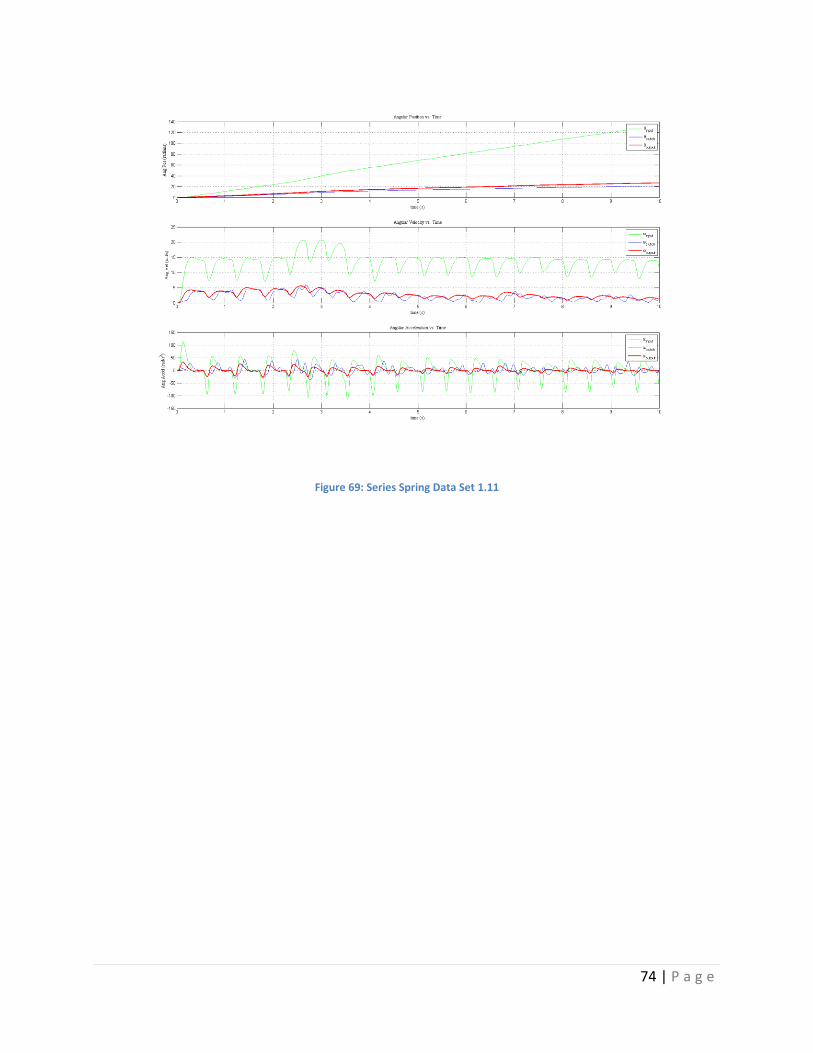
74 | P a g e
Figure 69: Series Spring Data Set 1.11
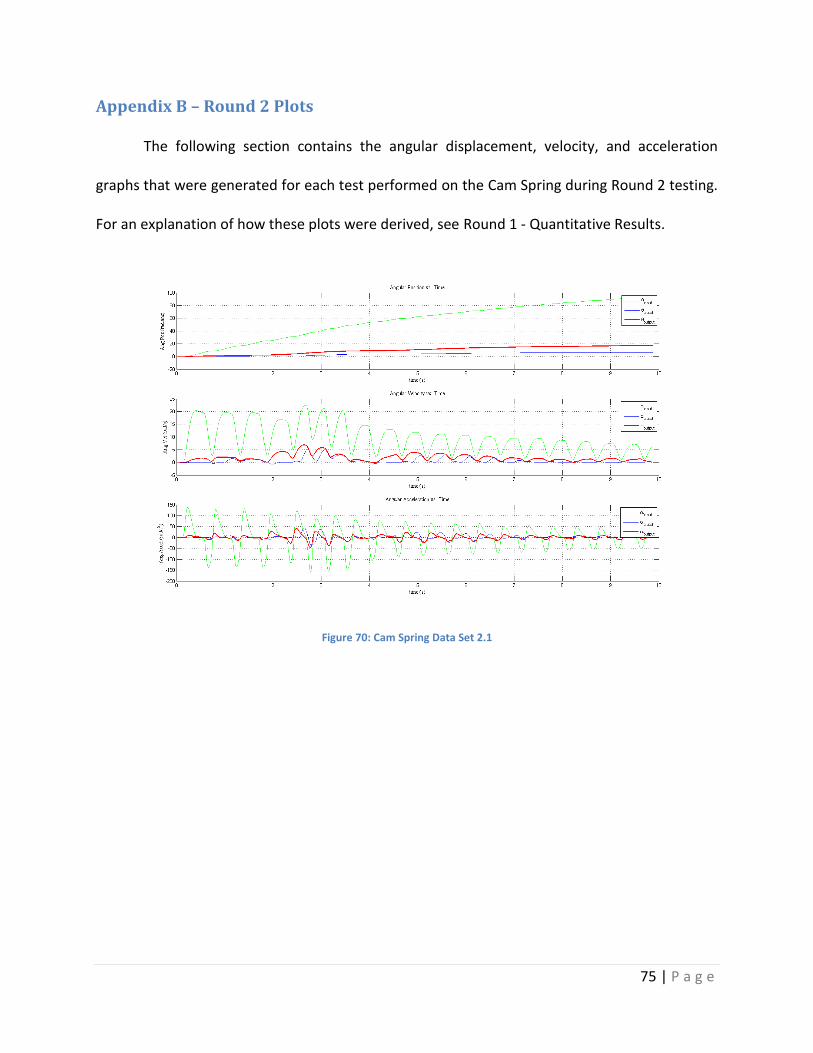
75 | P a g e
Appendix B – Round 2 Plots
The following section contains the angular displacement, velocity, and acceleration
graphs that were generated for each test performed on the Cam Spring during Round 2 testing.
For an explanation of how these plots were derived, see Round 1 - Quantitative Results.
Figure 70: Cam Spring Data Set 2.1
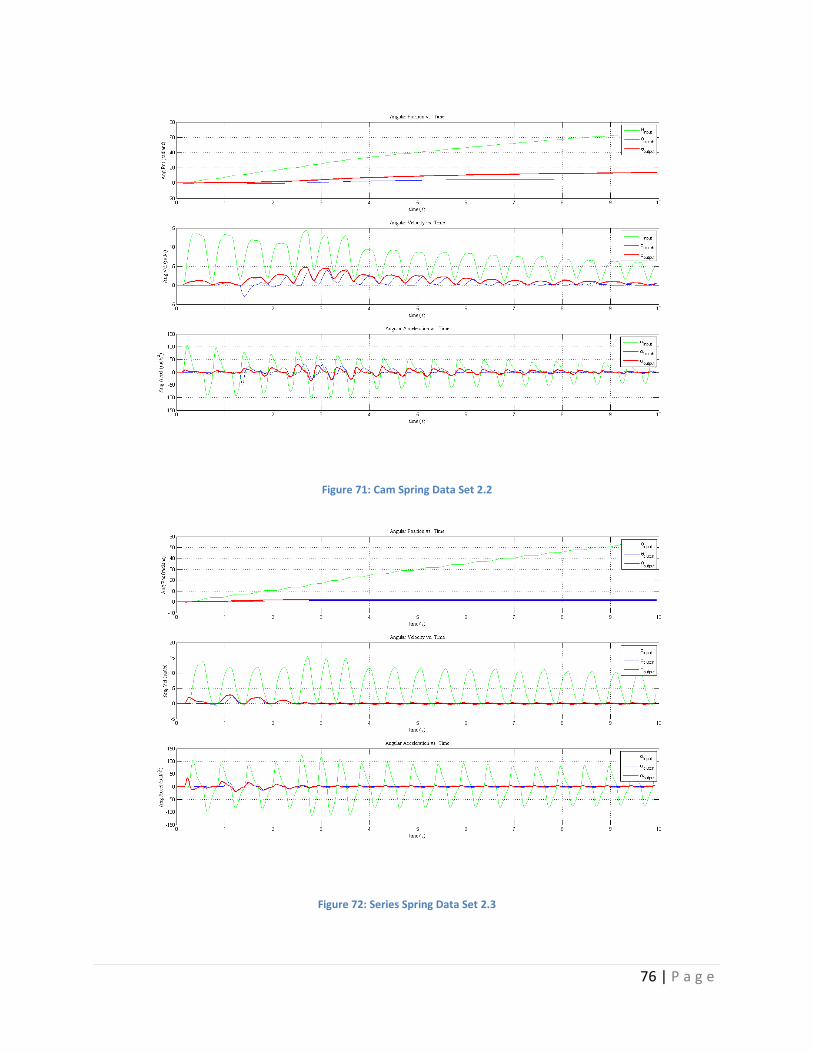
76 | P a g e
Figure 71: Cam Spring Data Set 2.2
Figure 72: Series Spring Data Set 2.3
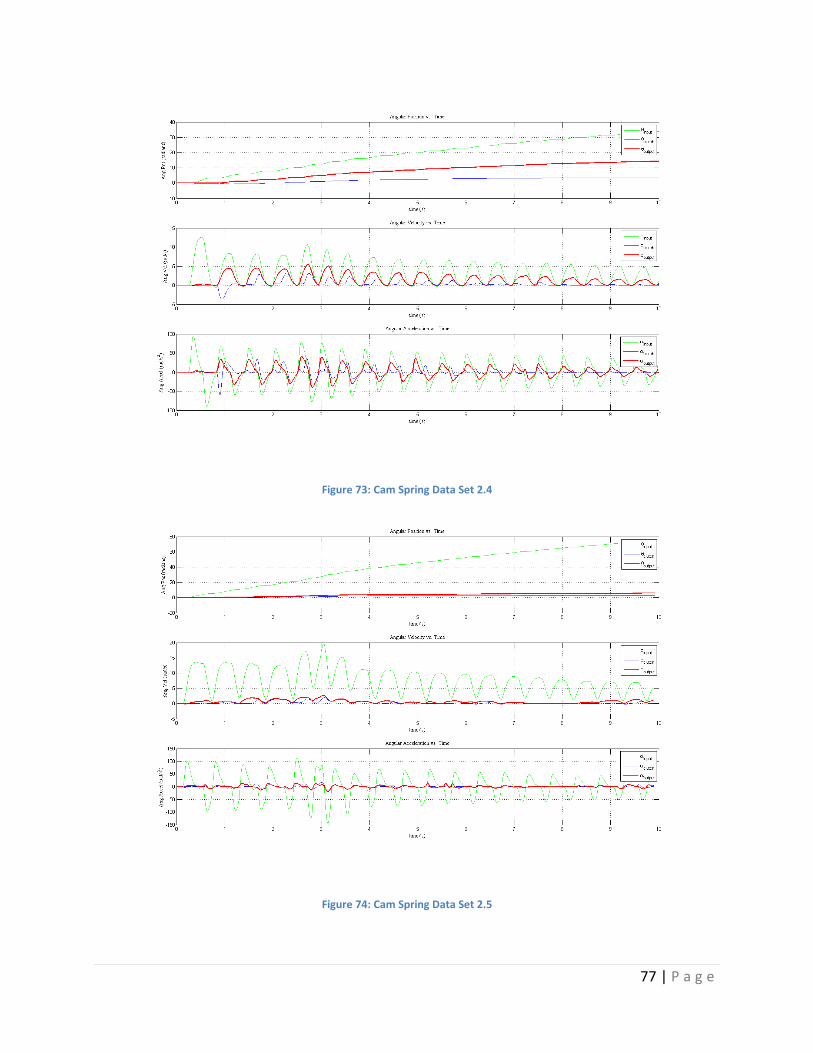
77 | P a g e
Figure 73: Cam Spring Data Set 2.4
Figure 74: Cam Spring Data Set 2.5

78 | P a g e
Figure 75: Cam Spring Data Set 2.6
Appendix C – Photo Documentation
The following section contains images and videos taken by the group during testing of
various aspects of the full test setup, including wiring, DAQ layout, and the test assembly.
Video documentation of the testing may be viewed on http://www.youtube.com/ under the
channel name WPIMEPSCVT.
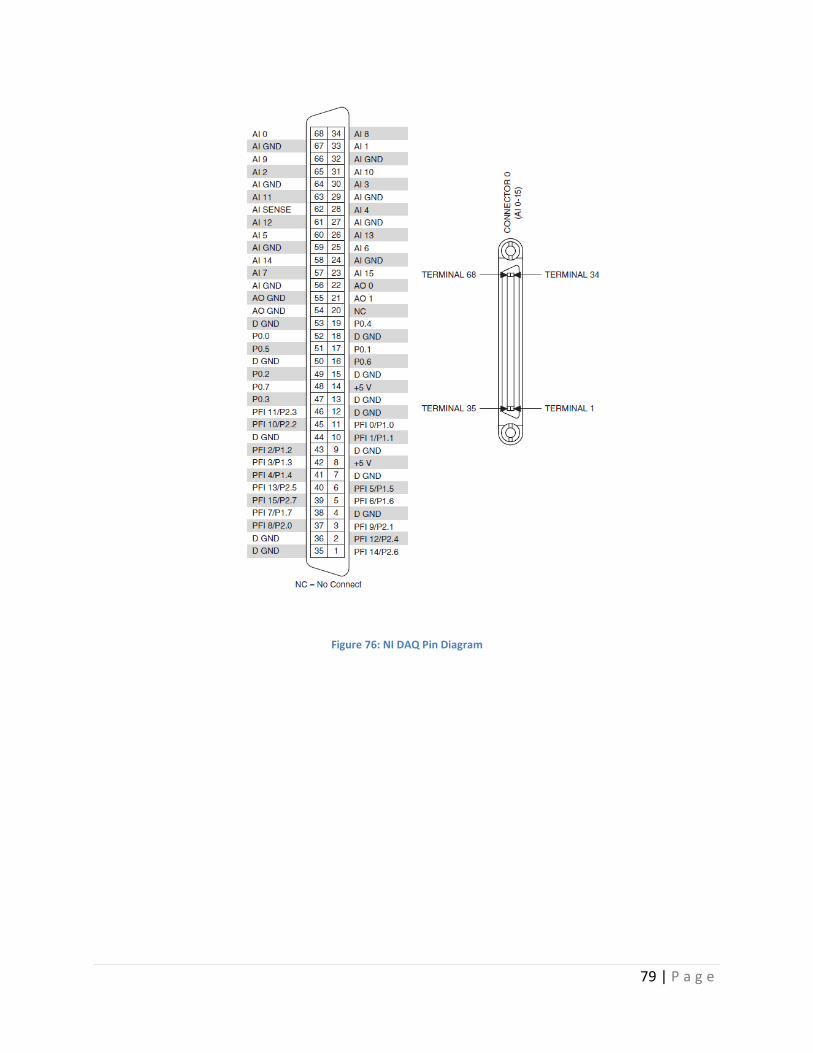
79 | P a g e
Figure 76: NI DAQ Pin Diagram

80 | P a g e
Figure 77: Counter Pin Location List (Used to Wire encoders)

81 | P a g e
Figure 78: NI PCI-6220 Wiring Photo (Hall Effect Sensor)
PCI- 6220 Ai14-58 AIGND-24

82 | P a g e
Figure 79: NI PCI 6024E Wiring Photo (Encoders)
PCI 6601 PFI39/Gate0-2-A channel (Encoder B) PFI 39/Source0-3-Index (Encoder B) PFI37/UP_Down0-40-B channel (Encoder B) PFI33/UP_Down1-6-B channel (Encoder A) PFI35/Source1-7-A channel (Encoder A) PFI34/Gate1-8-Index (Encoder A) PFI6/DIO2-48-Power + PFI7/DIO7-15-Ground

83 | P a g e
PFI31/Source2-34-A channel (Encoder C) PFI30/Gate2-67-Index (Encoder C) PFI28/UP_Down2-66-B channel (Encoder C)
Figure 80: Final Testing Assembly