Embed Size (px)
Citation preview

100
CHAPTER 4 DATA ANALYSIS
As mentioned earlier, the data was collected by using questionnaire and Interview
method. The entire section of data analysis has been divided into three subsections. Subsection A
contains the data analysis in respect of the Workers, while subsection B contains the data
analysis in respect of the Managers and subsection C in respect of Inspectors.
Two separate questionnaires were prepared for the purpose of data analysis. One
questionnaire was prepared to collect the data from the point of view of workers and second was
made with the purpose to know about the condition of workers and implication of Safety
measures and provision by the Managers.
Data is also been collected by conducting Interview of Safety officers for the purpose of
study of current situation of Safety provisions in SSIs in Pune city.

101
SECTION-A
4.A Data analysis done for the responses that were given by the employees.
Table 4A.1: Age of the employees in years
Frequency Percent Valid Percent Cumulative Percent
Valid 18-25 171 28.5 28.5 28.5
25-35 272 45.3 45.3 73.8
35-45 125 20.8 20.8 94.7
45-60 28 4.7 4.7 99.3
60 and above 4 .7 .7 100.0
Total 600 100.0 100.0
Graph 4A.1: Age of the employees in years
From the above table it can be clearly seen that out of the respondents that were randomly
selected, nearly 95% are from the age groups 18 to 45. Only 5% of the respondents were above
the age of 45. When the workers were interview informally, some responded that after the age of

102
45, most of the workers do not prefer to work on hazardous activities or jobs that can cause
excessive physical stress.
Table 4A.2: Gender
Frequency Percent Valid Percent Cumulative Percent
Valid Male 567 94.5 94.5 94.5
Female 33 5.5 5.5 100.0
Total 600 100.0 100.0
Very less number of female workers were found. Less than 6% of the respondents were
found to be female workers. The table, although strikingly indicates a possibility that the female
class does not prefer to work on activities that involve physical effort, although quite
understandably.
Graph 4A.2: Gender
The figures also indicate that activities which happen in the workshop are not suitable for
females, as they include physical labour, not usually suitable for females. Lifting heavy things,
working on cutting machines and other machines that require physical strength seem to be
activities that are not usually preferred by females. According to the National Sample Survey, the

103
worker population proportion for women in the rural area was 24.8 in the year 2011-12 whereas,
that for male workers was 54.3. In the Urban sector, it was 14.7 for females and 54.6 for males.
Table 4A.3: Marital Status
Frequency Percent Valid Percent Cumulative Percent
Valid Married 533 88.8 88.8 88.8
Unmarried 67 11.2 11.2 100.0
Total 600 100.0 100.0
Graph 4A.3: Marital Status
Nearly 90% of the respondents were found to be Married. This also means that they have
higher chances of having dependents. The Cross tabulation provided on the next page shows that
maximum number of respondents who were between the age group of 25 to 35 years, were
would to be married. The data above confirms to the traditional and conventional aspect of
marital status of typical Indian workers.

104
Table 4A.3.1 Age in years * Marital Status Cross tabulation
Marital Status
TotalMarried Single
Age in years 18-25 154 17 171
25-35 245 27 272
35-45 106 19 125
45-60 26 2 28
60 and above 2 2 4
Total 533 67 600
Table 4A.4: Occupation of the spouse
Frequency Percent Valid Percent Cumulative Percent
Valid Housewife 444 74.0 74.0 74.0
Industrial Worker 24 4.0 4.0 78.0
Self Occupied 72 12.0 12.0 90.0
Salaried employee elsewhere 60 10.0 10.0 100.0
Total 600 100.0 100.0
74% of the respondents said that their spouses were housewives. Being housewives, and
dependents, their livelihood depends entirely on the earnings fetched by the working member of
the family. Hazardous processes can pose serious threats to the physiological and psychological
well being of the worker. It is difficult to imagine, as to what would happen to a given worker's
family, if he stops generating income due to some temporary or permanent disability due to a
hazardous process.

105
Graph 4A.4: Occupation of the spouse.
Table 4A.5: Total Experience as an Industrial labourer
Frequency Percent Valid Percent Cumulative Percent
Valid Less than 1 year 85 14.2 14.2 14.2
1-3 years 329 54.8 54.8 69.0
4-6 years 144 24.0 24.0 93.0
7-10 years 39 6.5 6.5 99.5
11 years and above 3 .5 .5 100.0
Total 600 100.0 100.0

106
Graph 4A.5: Total Experience as an Industrial labourer
0
100
200
300
400
500
600
Frequency Percent
Less than 1 year
1‐3 years
4‐6 years
7‐10 years
11 years and above
Total
Nearly 80% of the respondents were found to be experienced for 1 to 6 years. The cross
tabulated table below would give a clear idea of the age and corresponding experience of the
workers.
Table 4A.5.1 Age in years * Total Experience as an Industrial labourer (Cross tabulation)
Total Experience as an Industrial labourer
Total
Less than 1
year
1-3
years
4-6
years
7-10
years
11 years and
above
Age in
years
18-25 85 62 19 0 0 166
25-35 12 253 5 7 0 277
35-45 15 14 72 13 11 125
45-60 0 1 0 27 0 28
60 and
above 0 1 0 2 1 4
Total 113 330 96 49 12 600
Approximately 42 to 43% of the workers in small scale industries were found to be
experienced for 1 to 3 years and were in the age group 25 to 35 years. Very less number of

107
workers were found to be experienced for more than 10 years. This may be because of the
hazardous nature of the job.
Graph 4A.5.1: Age in years * Total Experience as an Industrial labourer
Table 4A.6: Number of Members in the family
Frequency Percent Valid Percent Cumulative Percent
Valid 2 121 20.2 20.2 20.2
3 97 16.2 16.2 36.3
4 135 22.5 22.5 58.8
5 174 29.0 29.0 87.8
6 43 7.2 7.2 95.0
7 24 4.0 4.0 99.0
8 6 1.0 1.0 100.0
Total 600 100.0 100.0
Nearly 70% of the respondents have 3 to 5 members in the family. It would be interesting
to observe on the next page, in table that shows cross tabulated data between number of members
in the family and number of dependents.

108
Table 4A.7: Number of Dependents
Frequency Percent Valid Percent Cumulative Percent
Valid 0 64 10.7 10.7 10.7
1 104 17.3 17.3 28.0
2 174 29.0 29.0 57.0
3 155 25.8 25.8 82.8
4 74 12.3 12.3 95.2
5 17 2.8 2.8 98.0
6 9 1.5 1.5 99.5
7 3 .5 .5 100.0
Total 600 100.0 100.0
From the above table it can be seen that only around 10% of the respondents have no
dependents. This may be because there can be seen only a couple of members in the family, with
no children or elderly people to be taken care of. 54.8% of the respondents had 2 or 3 dependents
in their families. Less than 5% of the respondents had 5 or more people who were dependents.
Table 4A.7.1: Number of Members in the family * Number of Dependents (Cross
tabulation)
Number of Dependents
Total0 1 2 3 4 5 6 7
Number of Members 2 64 57 0 0 0 0 0 0 121
3 0 46 51 0 0 0 0 0 97
4 0 0 62 73 0 0 0 0 135
5 0 1 61 56 56 0 0 0 174
6 0 0 0 21 11 11 0 0 43
7 0 0 0 5 5 5 9 0 24
8 0 0 0 0 2 1 0 3 6
Total 64 104 174 155 74 17 9 3 600

109
Nearly 30% of the respondents who have three or more members and the family have at
least two dependents. Clearly the above data suggest that the employees who work in hazardous
processes and have more than 2 family members have people who are dependent on their earning
capacity for their livelihood. The above numbers help us to understand the necessity and the
requirement of the employees who work on hazardous processes to maintain good health to
support their families.
Table 4A.8 Salary paid, approximately per annum
Frequency Percent Valid Percent Cumulative Percent
Valid 0-75000 135 22.5 22.5 22.5
75000-100000 290 48.3 48.3 70.8
100000-150000 171 28.5 28.5 99.3
150000-200000 4 .7 .7 100.0
Total 600 100.0 100.0
Graph 4A.8 Salary paid, approximately per annum
0 100 200 300
150000‐200000
100000‐150000
75000‐100000
0‐75000

110
This study focuses on workers who are employed on hazardous jobs. The situation at an
individual's job varies significantly depending on income levels, that decide the class (Kerbo,
Herald (1996). Earning members of the upper-middle class and middle class families get
pleasure from superior freedoms in their jobs. They are more valued, benefit from extra
diversity, and are awarded a little authority.
For further analysis, a cross tabulated sheet that contains a comparison between the
salaries earned by the employees and the number of dependents in their family yields interesting
results.
Table 4A.8.1 : Number of Dependents * Salary paid, Approximately per annum Cross
tabulation
Salary paid, Approximately per annum
Total0-75000 75000-100000 100000-150000 150000-200000
Number of Dependents 0 14 33 17 0 64
1 26 45 33 0 104
2 36 87 49 2 174
3 33 76 45 1 155
4 18 31 24 1 74
5 4 10 3 0 17
6 2 7 0 0 9
7 2 1 0 0 3
Total 135 290 171 4 600
The above table shows that almost the entire set of respondents belong to lower middle
class. Those in lower classes face lower levels of job satisfaction. The physical and
psychological environment of the place of work vary significantly among classes. The blue-
collar employees are subjects to suffer with monotonous work that may involve health hazards,
injury, that may even turn out to be fatal in nature. Approximately 48% of the employees belong
to the income group between 75,000 to one lack rupees. The majority of who belong to this

111
income group have more than one dependent. With the general rise in the price of essential
commodities, one may find it hard to imagine that the way these people must be surviving.
14.5% of the observed respondents have 2 dependents, with a salary ranging between
75000 to 100000. 12.7% have 3 dependents, within the same salary range. It means that nearly
27% of the employees are earning less than 1 lakh rupees per annum and have to take care of 2 to
3 dependents. The cross tabulated data shows that even after operating at very high risks, the
standard of living of these employees yet remains very low.
Graph 4A.8.1: Number of Dependents * Salary paid,

112
Table 4A.9: Type of House/ Home / Residence
Frequency Percent Valid Percent Cumulative Percent
Valid Rent Free Accommodation 18 3.0 3.0 3.0
Rented 276 46.0 46.0 49.0
Owned 287 47.8 47.8 96.8
Others 19 3.2 3.2 100.0
Total 600 100.0 100.0
The above data shows us that on the 3% of the employees have been given rent-free staff
quarters to stay. 46% of the respondents live in rented houses. This adds up to the cost of living,
especially then they are paid such low salaries. As an interesting fact, 47.8% of the employees
who were questioned, have their own houses.
Table 4A.10: Consumption of tobacco
Frequency Percent Valid Percent Cumulative Percent
Valid Yes 396 66.0 66.0 66.0
No 204 34.0 34.0 100.0
Total 600 100.0 100.0

113
Table 4A.10.1: Age in years * Consumption of tobacco Cross tabulation
Consumption of tobacco
TotalYes No
Age in years 18-25 109 62 171
25-35 191 81 272
35-45 78 47 125
45-60 17 11 28
60 and above 1 3 4
Total 396 204 600
Graph 4A.10.1: Age-wise Consumption of tobacco
The processes which involve physical labour are monotonous in nature. When some of
these workers were interviewed informally, they complained that their work was boring. Then
they were asked as to why they consume tobacco? The most common answer was they were
addicted to tobacco because tobacco in a way stimulates them to carry on with their work. 191
employees working within the age group of 25 to 35 years, were more frequently found to be
addicted to tobacco. The above data points to an interesting fact that after the age of 35 following
the 60 and above group, the tobacco habit has been found to be less frequent.
114
These workers already work in hazardous processes. Consumption of tobacco is almost
an added hazard with these kind of occupations as nearly 70 percent of the respondents agreed
that they consume tobacco.
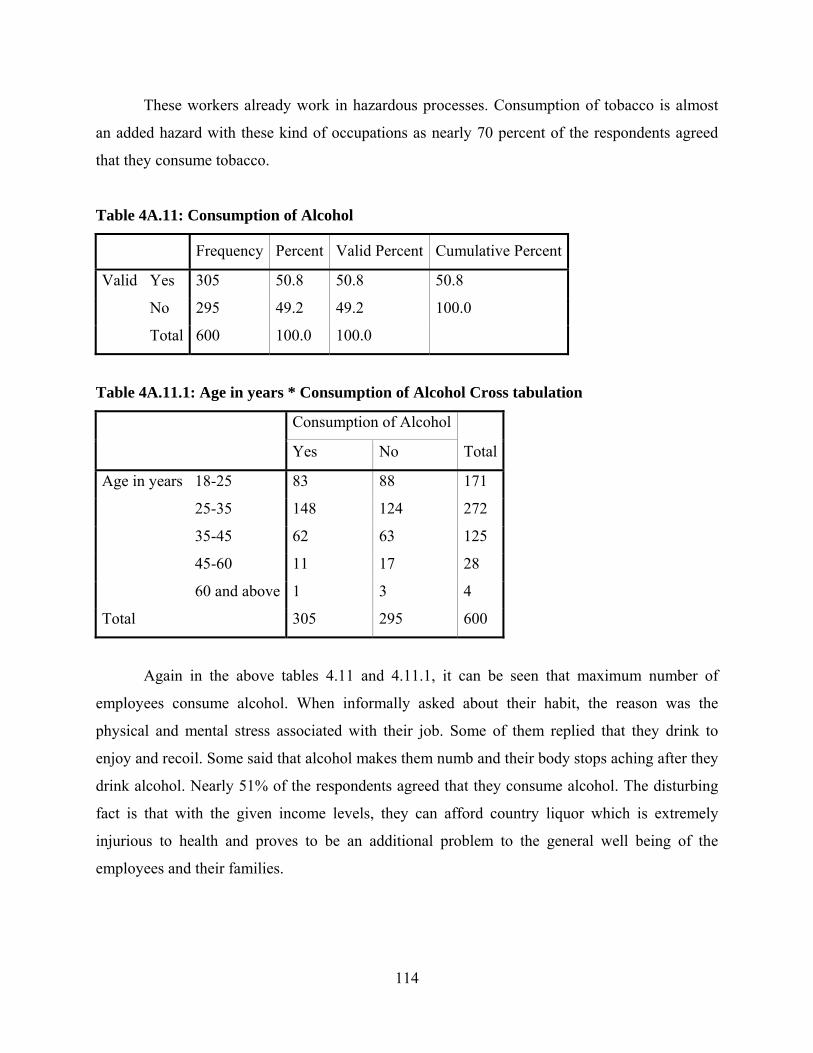
Table 4A.11: Consumption of Alcohol
Frequency Percent Valid Percent Cumulative Percent
Valid Yes 305 50.8 50.8 50.8
No 295 49.2 49.2 100.0
Total 600 100.0 100.0
Table 4A.11.1: Age in years * Consumption of Alcohol Cross tabulation
Consumption of Alcohol
TotalYes No
Age in years 18-25 83 88 171
25-35 148 124 272
35-45 62 63 125
45-60 11 17 28
60 and above 1 3 4
Total 305 295 600
Again in the above tables 4.11 and 4.11.1, it can be seen that maximum number of
employees consume alcohol. When informally asked about their habit, the reason was the
physical and mental stress associated with their job. Some of them replied that they drink to
enjoy and recoil. Some said that alcohol makes them numb and their body stops aching after they
drink alcohol. Nearly 51% of the respondents agreed that they consume alcohol. The disturbing
fact is that with the given income levels, they can afford country liquor which is extremely
injurious to health and proves to be an additional problem to the general well being of the
employees and their families.

115
Table 4A.12: Consumption of tobacco * Consumption of Alcohol Cross tabulation
Consumption of Alcohol
TotalYes No
Consumption of tobacco Yes 197 199 396
No 108 96 204
Total 305 295 600
The above is another table which matches the bad habits of the workers. It can be seen
that almost all those who consume alcohol, consume tobacco and have agreed to the fact.
Alcohol and tobacco consumption, for the same person can lead to medical conditions which
may range from mental stress to serious medical conditions like cancer, lever cirrhosis etc. The
above data shows that most of the workers are either not aware of the consequences or are not
bothered about the consequences.
Graph 4A.12: Consumption of tobacco * Consumption of Alcohol

116
The above graph shows us that workers who commonly chew tobacco are also
consuming alcohol. It is known that this combination is lethal to the health of the workers who
are already exposed to several different industrial pollutants.
Table 4A.13: Major hazard associated with the job
Frequency Percent
Valid
Percent
Cumulative
Percent
Valid Sound Pollution, 53 8.8 8.8 8.8
Air pollutants 157 26.2 26.2 35.0
Any other physical / orthopedic
stress
138 23.0 23.0 58.0
Dangerous machines, which can
cause fatal/serious injury
193 32.2 32.2 90.2
Mental stress
59
9.8
9.8
100.0
Total 600 100.0 100.0
The above table helps us to interpret the data mix. Air pollutants that can cause irritation,
any other physical / orthopedically stress and dangerous machines, which can cause fatal/serious
injury constitute the majority of the hazards in the small scale industry. Sound pollution and
mental stress seem to be less dominant, though they are potentially destructive hazards. Most of
the workers were found to be using phones that had MP3 playback capacity with noise isolating
heap-phones plugged into their ears.
When asked informally, they replied that the music they play does 2 things, 1. It blocks
background noise that is extremely disturbing and 2. Helps them as a stress buster by keeping
them entertained at the job. Very rarely it was observed that the employees are banned from
carrying cell phones within the factory premises.

117
Table 4A.13.1: Total Experience as an Industrial labourer * Major hazard associated with
the job Cross tabulation
Major hazard associated with the job Total
Sound
Pollution
Air
pollutants
Physical
stress
Dangerous
machines
Mental
stress
Total
Experience
Less
than
1
year
5 23 14 25 18 85
1-3
years
26 88 79 103 33 329
4-6
years
18 34 35 52 5 144
7-10
years
4 10 9 13 3 39
11
years
and
above
0 2 1 0 0 3
Total 53 157 138 193 59 600
From the table we can see that workers who belong to the group of workers who have an
experience of 1 to 3 years are at maximum risk of suffering injuries that happen due to dangerous
machines.
The table also shows that the figures of sound pollution are heavily under- estimated.
This may be because the ill effects of sound pollution may not be considered as immediate and
life threatening by the employees.

118
Graph 4A.13: Hazards and Experience as an Industrial Labourer
Mental stress is actually associated with every job. But all other hazards seem to
dominate the mental stress of the workers. They seemed to be worried about other hazards more
than mental stress. The above figure also points out that the maximum effects of sound pollution
can be felt within the span of 4 to 6 years for the industrial labourers.
Table 4A.14 Medical problems in the past year due to the type of hazard.
Frequency Percent Valid Percent Cumulative Percent
Valid Yes 188 31.3 31.3 31.3
No 412 68.7 68.7 100.0
Total 600 100.0 100.0
31.3% of the employees have faced medical conditions in the past one year. This
indicates that the almost every one out of three workers face a medical condition, within one year
of beginning their job. The above numbers are quite disturbing in nature and show that the
employees in hazardous small scale industries have to indeed risk their well being to make a
living. The medical problems were serious to moderate, but necessarily originated from the type
of activity performed on the job. For further analysis, this table has been cross tabulated with the
type of hazard associated with the job.

119
Table 4A.14.1: Major hazard associated with the job * Medical problems in the past year-
related to the hazard Cross tabulation
Medical problems in the past year-
related to the hazard
TotalYes No
Major
hazard
Sound Pollution, affecting the
physical and mental health 15 38 53
Air pollutants that can cause irritation
66
91
157
Any other physical / orthopedic stress 44 94 138
Dangerous machines, which can
cause fatal/serious injury 53 140 193
Mental stress 10 49 59
Total 188 412 600
The major hazard that creates a problem seems to be Air Pollutants. Air pollutants
include particles, chemicals and other elements which can cause irritation. Employees reported
difficulty in breathing. Some reported asthma, Continuous cough etc. Some companies involve
employees who operate on cutting / drilling machines. These machines pose dual hazards as
these machines are dangerous and can cause serious injuries too. Welders, people who lift heavy
parts mainly reported orthopedic stress.

120
Graph 4A.14.1: Major hazard associated with the job * Medical problems in the past year
Following the air pollutants, dangerous machines also seem to cause problems for the
workers. Wounds varying from minor to serious happen to workers when they work on
machines. Cuts, sprains and Repetitive Motion Injuries were found to be common among
workers.

121
Table 4A.14.2: Medical problems in the past year- related to the hazard * Age in years
Cross tabulation
Age in years
Total18-25 25-35 35-45 45-60 60 and above
Medical problems in the past year. Yes 53 57 66 10 2 188
No 118 215 59 18 2 412
Total 171 272 125 28 4 600
More than 50% of the worker who were of the age group 35-45 years seem to be already getting
the symptoms of a major irritation due to the occupational hazard.
Table 4A.14.3: Medical problems in the past year- related to the hazard * Total Experience
as an Industrial labourer Cross tabulation
Total Experience as an Industrial labourer
Total
Less than
1 year
1-3
years
4-6
years
7-10
years
11 years
and above
Medical problems in the past
year- related to the hazard
Yes 23 78 72 14 1 188
No 62 251 72 25 2 412
Total 85 329 144 39 3 600
50% of the people who have an industrial experience of 4-6 years have faced medical problems
in the past year.

122
Table 4A.15 Problems observed in colleagues due to type of the job
Frequency Percent Valid Percent Cumulative Percent
Valid Yes 150 25.0 25.0 25.0
No 450 75.0 75.0 100.0
Total 600 100.0 100.0
The above question was asked to further enquire into the injurious nature of such units
that carry on hazardous activities. 25% of the workers responded that they have seen their
colleagues suffer due to occupational hazards.
Table 4A.16: Frequency of medical checkups - number of times every six months
Frequency Percent Valid Percent Cumulative Percent
Valid None 184 30.7 30.7 30.7
1 TO 2 211 35.2 35.2 65.8
3 TO 5 178 29.7 29.7 95.5
More than 5 times 27 4.5 4.5 100.0
Total 600 100.0 100.0
The workers, Government and the employers must target towards making working
conditions safe and hygienic. Most of the poisonous chemicals used in small scale industries can
create grave health threats that can cause cancer, respiratory and other dermatological disorders.
Past studies have shown that they can lead to adverse effects on reproductive function. Although
it seems simple and obvious, this idea does not seem to have gained meaningful recognition in
the case of this research study. 30.7% employees responded that they have not undergone any
medical checkup.
Symptoms of injuries can sometimes not be visible. They become visible only after
conditions get worse and cost the employee his life. If medical checkups are done regularly, the
chances of an injury or disease associated with a particular risk area can be identified and action
can be taken.

123
Table 4A.16.1: Frequency of medical checkups - number of times every six months *
Medical problems in the past year- related to the hazard Cross tabulation:
Medical problems in the past
year- related to the hazard
TotalYes No
Frequency of medical checkups -
number of times every six months
None 65 119 184
1 TO 2 67 144 211
3 TO 5 52 126 178
More than
5 times 4 23 27
Total 188 412 600
From the above table it can be seen that more than 10% of the employees who faced
medical problems arising out of the hazard, seem to have neglected the need for a medical
checkup. Only four employees reported for having medical checkups for more than 5 times
during the past six months.
In practice, it is usually suggested for a person who is working on a hazardous process to
have at least one medical checkup monthly to prevent things from becoming bad to worse.

124
Graph 4.16: Frequency of medical checkups every six months.
Table 4A.17 Are medical check-ups provided by the organization?
Frequency Percent Valid Percent Cumulative Percent
Valid Yes 75 12.5 12.5 12.5
No 525 87.5 87.5 100.0
Total 600 100.0 100.0
Only 12.5% of the companies were found to provide their workers with medical
checkups. When managers were informally asked for not providing checkups, some managers
responded that the body of the workers slowly gets immune to the hazard and they develop
tolerance. In addition to the above, some also coupled the reason with the fact that the company
was a small scale unit and that the owners and decision makers cannot afford to provide a free
medical checkup for the employees.

125
As a matter of fact, a simple medical checkup once every 3 months is easily affordable
for every worker. Where there are less than 20 workers, a basic medical checkup can be made
where each worker goes through a preliminary physical examination. It would actually cost the
employer a little over 1500 rupees, which can be deemed to be reasonable if done once in three
months. The table shows us that in 87.5% of the cases, the managers or the employers were not
human enough to understand the importance of knowing the impact of hazardous processes on
the employees.
Table 4A.17.1: Frequency of medical checkups - number of times every six months * Are
medical check-ups provided by the organization? Cross tabulation
Are medical check-ups provided
by the organization?
TotalYes No
Frequency of medical checkups -
number of times every six months
None 35 149 184
1 TO 2 16 195 211
3 TO 5 21 157 178
More than
5 times 3 24 27
Total 75 525 600
35 respondents who are given the facility of medical checkups do not opt to go for it.
Around 30% of the workers who are not given medical checkup facility from the organization,
voluntarily pay for it.
A local doctor is appointed to do a general physical examination of the workers. In 75
(only 12.5%) cases it was observed that the management has a tie up with the doctor and the
doctor's fees are borne by the company.
92.4% of the employees who go for medical checkups once or twice every six months,
pay for it from their own pockets.

126
Graph 4A.17: Frequency of medical checkups – Medical Checkups provided by the
organization – Cross tabulation.
Table 4A.18: Has the company made it mandatory to undergo medical examination?
Frequency Percent Valid Percent Cumulative Percent
Valid Compulsory 39 6.5 6.5 6.5
Optional 561 93.5 93.5 100.0
Total 600 100.0 100.0
Majority of the companies that have made medical checkups optional, do not provide the facility
to the workers. This fact will be clear after we observe the following cross tabulation:

127
Table 4A.18.1: Has the company made it mandatory to undergo medical examination? *
Are medical check-ups provided by the organization? Cross tabulation
Are medical check-ups provided
by the organization?
TotalYes No
Has the company made it to undergo
medical examination?
Compulsory 39 0 39
Optional 36 525 561
Total 75 525 600
None of the companies who do not provide medical checkups, make it mandatory for the
employees. Out of the 75 employees who responded that medical checkups are provided to them,
nearly half responded that the medical checkups are more need based or optional in nature.
Table 4A.19: Does the hazard de-motivate the employee from continuing the current job?
Frequency Percent Valid Percent Cumulative Percent
Valid Yes 379 63.2 63.2 63.2
No 221 36.8 36.8 100.0
Total 600 100.0 100.0
Modern day occupational hazards seem to challenge the employees in all industries. The
small scale industrial workers belong to a special type of semi-skilled and unskilled workers who
have very less options but to continue on their job. Several studies have shown that the level of
job satisfaction reflects in the motivation for any employee and vice versa.
For an employee to be productive it is necessary that he should be motivated. From the
above table we can see that most of the employees are in the state of being de-motivated.

128
In an informal reply many of the workers have responded by asking a counter question:
"Who would like to suffer from medical problems, especially when one knows that the type of
work he does is going to cause some or the other adverse medical condition?”
The workers who were de-motivated seemed to be not wanting to continue with the kind
of work they do, on the basis that they were very less motivated to continue to do the same job.
A cross tabulation below would illustrate the type of hazard associated with the job.
Table 4A.20: Major hazard associated with the job * Does the hazard de-motivate the
employee from continuing the current job? Cross tabulation
Does the hazard de-motivate the
employee from continuing the current
job?
TotalYes No
Major hazard
associated with the
job
Sound Pollution, 32 21 53
Air pollutants 104 53 157
Any other physical /
orthopedic stress 86 52 138
Dangerous machines 113 80 193
Mental stress 44 15 59
Total 379 221 600
At places where air pollution is the major hazard, 66.2% of the employees responded that
they were de-motivated to continue with the job. In cases where there are dangerous machines,
58.5% of the employees feel less motivation to continue with the same job. Nearly 75% of the
employees who feel that mental stress is the major hazard associated to the job, feel that the
current job fails to motivate them to continue doing it.

129
Table 4A.21: Does the company provide safety equipment?
Frequency Percent Valid Percent Cumulative Percent
Valid Yes 552 92.0 92.0 92.0
No 48 8.0 8.0 100.0
Total 600 100.0 100.0
In 8% of the cases, safety equipment is not provided to the workers. A cross tabulation shown
below yields some interesting results.
Table No 4.21.1: Major hazard associated with the job * Does the company provide safety
equipment? Cross tabulation
Does the company provide
safety equipment?
TotalYes No
Major hazard associated
with the job
Sound Pollution, 53 0 53
Air pollutants 145 12 157
Any other physical /
orthopedic stress 126 12 138
Dangerous machines 169 24 193
Mental stress 59 0 59
Total 552 48 600
From the above table it can be seen that in cases where air pollution is a major hazard, 7.6% of
the employees responded that they are not given safety equipment.

130
Table 4A.22: Do employees use safety equipment?
Frequency Percent Valid Percent Cumulative Percent
Valid Yes 359 59.8 59.8 59.8
No 241 40.2 40.2 100.0
Total 600 100.0 100.0
Table No 4.22.1: Does the company provide safety equipment? * Do employees use safety
equipment? Cross tabulation
Do employees use safety
equipment?
TotalYes No
Does the company provide safety
equipment?
Yes 332 220 552
No 27 21 48
Total 359 241 600
In 40% of the cases, employees do not use the safety equipment even when it is provided
by the company. This is a very serious issue that raises various questions from whether the
equipment is really needed? whether it is useful? questions relating to the quality of the safety
equipment are analyzed in the latter part of this chapter.
56.3% of the individuals seem to buy their own equipment. Some workers who were
found to be working in cutting units, were wearing a "towel" around their face when they
performed the cutting work.
Their informal response was that the management does not care and that they had to get
these from their houses, and it was like a uniform to them, to be washed daily.

131
Table No 4.22.2: Major hazard associated with the job * Do employees use safety
equipment? Cross tabulation
Do employees use safety
equipment?
TotalYes No
Major hazard
associated with the job
Sound Pollution, affecting the
physical and mental health 22 31 53
Air pollutants that can cause
irritation 139 18 157
Any other physical / orthopedic
stress 66 72 138
Dangerous machines, which can
cause fatal/serious injury 101 92 193
Mental stress leading to other
chronic/ acute 31 28 59
Total 359 241 600
In the case of 48% of the employees who work on dangerous machines seem to have a
false sense of confidence that the machines are not so dangerous. This may be due to their
experience, but certainly it is a disturbing thing that can be seen from the above table.
Employees also seem to neglect or not be aware of the disturbing effects of sound
pollution as nearly 60% of the employees who work in noisy environments, do not use safety
equipment.

132
Table 4A.23: Need felt for safety equipment
Frequency Percent Valid Percent Cumulative Percent
Valid Yes 532 88.7 88.7 88.7
No 68 11.3 11.3 100.0
Total 600 100.0 100.0
The above table depicts the natural response of a human being. 89% agreed to the fact that safety
equipment at work is necessary.
Table 4A.23.1: Does the company make it compulsory to use the safety equipment?
Frequency Percent Valid Percent Cumulative Percent
Valid Yes 501 83.5 83.5 83.5
No 99 16.5 16.5 100.0
Total 600 100.0 100.0
From the above table, it can be seen that the company makes it compulsory to use safety
equipment. Only in 99 cases out of 600 it was observed that the usage of safety equipment is not
compulsory. It can also be seen that according to the earlier table no.4.22, 241 employees were
found not to be using safety equipment. This research thus identifies this gaps which raises many
questions mentioned earlier.
Table No 4.24: Does the employee think insurance is important
Frequency Percent Valid Percent Cumulative Percent
Valid Yes 600 100.0 100.0 100.0
The above table shows that all the employees feel that insurance is important. They all in fact
have themselves got insured as they are well aware of the hazard of the occupation that they are
working on.

133
Table 4A.25 Does the company pay any separate compensation to the employees, or their
family
Frequency Percent Valid Percent Cumulative Percent
Valid Yes 583 97.2 97.2 97.2
No 17 2.8 2.8 100.0
Total 600 100.0 100.0
The above table shows that the companies are considerate enough. 97.2% of the
employees are sure that the company would compensate them separately and that they would
readily make a demand for such compensation collectively if the contrary happens. In only 2.8%
of the cases it was found that the companies as employers do not give any separate compensation
to the employees.
Table 4A.26: Does the company care to keep the employees away from hazards?
Frequency Percent Valid Percent Cumulative Percent
Valid Yes 579 96.5 96.5 96.5
No 21 3.5 3.5 100.0
Total 600 100.0 100.0
In most of the cases it was observed that the employees feel that the company cares for
them and tries to keep the employees away from hazards. Only 3.5% of the respondents said that
the company is not bothered about this.

134
Table 4A.27: Do the employees feel that the company follows the provisions of the safety
related provisions of the Factories Act?
Frequency Percent
Valid
Percent
Cumulative
Percent
Valid Employee not aware of the act so
cannot make a statement 428 71.3 71.3 71.3
The company does not follow all
the provisions 172 28.7 28.7 100.0
Total 600 100.0 100.0
In most of the cases, the employees refused to say yes or no. They were clearly confused
as they did not really know about the major provisions of the factories act relating to the safety
and working conditions of the workers, especially in small scale industries.
Table 4A.28: Has the company arranged an awareness program regarding safety issues?
Frequency Percent Valid Percent Cumulative Percent
Valid Yes 37 6.1 6.1 6.1
No 563 93.9 93.9 100.0
Total 600 100.0 100.0
Clearly the above table states that the awareness programs are not organized or
undertaken by majority of the companies. Only 6.1% of the companies conduct such awareness
programs. Awareness of the safety issues is a part of training according to the informal responses
of the majority of the managers. Some said that the awareness program need not be taken, the
employees are told by their co-workers about the safety issues.

135
Table 4A.29: Does quality safety equipment in increase productivity and work efficiency?
Frequency Percent Valid Percent Cumulative Percent
Valid Yes 525 87.5 87.5 87.5
No 75 12.5 12.5 100.0
Total 600 100.0 100.0
Only 12.5 % of the employees feel that the quality of safety equipment does not
contribute to efficiency and productivity of the workers. These workers certainly seem to be
belonging to those people who respond that they do not need any safety equipment. The
following cross tabulation will clarify the above statement further.
Table 4A.29.1: Need felt for safety equipment * Employee's feeling about contribution of
quality safety equipment in increasing productivity and work efficiency Cross tabulation.
Contribution of quality safety equipment in increasing productivity and
work efficiency
TotalYes No
Need
felt
Yes 524 8 532
No 1 67 68
Total 525 75 600
From the above table it can be seen that most of the people who do not feel the need for
safety equipment have responded that the quality of the safety equipment does not contribute for
increasing the productivity and work efficiency of the workers. Out of 68 people who have said
that safety equipments are really not necessary, 67 people have responded that the contribution
of safety equipment in increasing the productivity and work efficiency is not that significant. All
the others that is, 525 have responded that the quality of safety equipment does affect the
productivity and efficiency of the workers.

136
Table 4A.30: Work of the safety inspectors - Do they achieve their objectives - Employee
perspective
Frequency Percent Valid Percent Cumulative Percent
Valid Yes 77 12.8 12.8 12.8
No 523 87.2 87.2 100.0
Total 600 100.0 100.0
According to 87.2% of the employees who had responded to this question, the safety
inspectors seem to be failing in achieving their objectives. There were informal gestures made by
workers that some of the inspectors would never even make a detailed inspection of the
workshop.
Table 4A.31: Whether formal training is imparted to the employees to avoid accidents or
injuries.
Frequency Percent Valid Percent Cumulative Percent
Valid Yes 39 6.5 6.5 6.5
No 561 93.5 93.5 100.0
Total 600 100.0 100.0
There are several dangerous machines within the factory premises that can cause a
variety of accidents. According to the factories act, it is necessary that the employer makes sure
that every person who works on a dangerous machine must be given sufficient training. Sveral
workers responded that they are given some basic training. But such training was informal in
nature. Such informal training was given to the workers to operate the machinery by senior
workers and make sure that the machinery works properly and wastage of resources and raw
material is minimised. Only 6.5% of the employees responded that though they were given
formal training for the proper usage of machines.

137
When workers work on machines that have heavy tools which need to be lifted properly,
it has been seen that very rarely there are taught about ergonomics while performing physical
work. When weights are lifted in awkward positions, they can cause repetitive motion injuries to
the workers. For this purpose, it is necessary that workers who lift things, workers who bend,
twist or stretch at work must be given a proper training by an expert so that instances of injuries
would be minimized.
Table 4A.32: Have the employees been given Fire Fighting training OR Disaster
management training?
Frequency Percent Valid Percent Cumulative Percent
Valid Yes 57 9.5 9.5 9.5
No 543 90.5 90.5 100.0
Total 600 100.0 100.0
Every now and then, one may hear news about the factory premises catching fire and
many of the people losing their lives, especially the workers who were present at the time the fire
broke out. Fire has to be extinguished as soon as possible so that the damage that can be caused
to the fire can be minimized. People within the premises must be taught to fight against fire and
must be given a special kind of training that is called as, "firefighting training". In medium scale
or large-scale firms one would easily observe firefighting equipment and a special team of
employees who have been given training to fight with fire. As far as the small-scale industries
are concerned, it seems that the entrepreneurs find it very difficult to allocate budgets for the
purpose of training the employees to fight against fire. In only 9.5% of the cases it was observed
that firefighting training has been actually given.

138
Table 4A.33 Does the company upgrade the safety equipment at reasonable frequency?
Frequency Percent Valid Percent Cumulative Percent
Valid Yes 114 19.0 19.0 19.0
No 486 81.0 81.0 100.0
Total 600 100.0 100.0
Safety equipment can prove to be useful only if it is upgraded whenever required. Like all
other assets safety equipment is also subject to wear and tear. Safety equipment like gloves,
safety goggles, helmets etc. can be most useful when they are upgraded and changed at the
proper time. In 81% of the cases it was seen that the safety equipment is not upgraded with
reasonable frequency. This further creates problems and jeopardizes the well-being of the
employees within the factory premises.
Table 4A.34: Temperature and Ventilation at work - Are employees satisfied?
Frequency Percent Valid Percent Cumulative Percent
Valid Yes 201 33.5 33.5 33.5
No 399 66.5 66.5 100.0
Total 600 100.0 100.0
The above table shows that in 67% of the cases the employees were not satisfied with the
kind of ventilation they were provided at work. Some of them also feel that the places in which
they work are very hot. As a common observation, it was seen that the workshops had metal roof
tops which are known to be disturbing, especially in the summer season.
As far as ventilation is concerned, according to Rule 22-A Prescribed under sub-section
(2) of section 13 of the factories act and the Maharashtra Factories Rules 1963 (Rule 22A) the
number of ventilation openings, must be of a total area of not less than 15% of the floor area of
the workshop.

139
If this is not possible, the rules have also made provisions for mechanical ventilation. All
the sections and the rules have been formed in order to make sure that the entire workshop is
properly ventilated. Yet, the Chief Inspector may relax some requirements regarding ventilation,
if he feels satisfied enough considering the location of the factory and "some other variables".
An improper ventilation intensifies the problems of dehydration and medical problems
related to air pollution. An improper ventilation also disturbs the employee and reduces the
productivity while at work.
Table 4A.35: Are the employees asked to pay for the safety equipment?
Frequency Percent Valid Percent Cumulative Percent
Valid Yes 41 6.8 6.8 6.8
No 559 93.2 93.2 100.0
Total 600 100.0 100.0
From the above table it can be seen that 93.2% of the employees responded that company
bears the cost of the safety equipment that is provided to them. But, in nearly 7% of the cases it
was observed that the company makes the workers bear the cost of the safety equipment.
When managers were asked informally about the reason for making the employees pay
for the safety equipment, they said that the safety equipment is not properly used by the
employees.
In a few cases the managers responded that the safety equipment gets misplaced and thus
the company cannot keep on affording to invest in safety equipment again and again. Another
cross tabulation would clarify certain facts as stated below:

140
Table 4A.36: Are the employees asked to pay for the safety equipment? * Do employees use
safety equipment? Cross tabulation
Do employees use safety
equipment?
TotalYes No
Are the employees asked to pay for the safety
equipment?
Yes 25 16 41
No 334 225 559
Total 359 241 600
The above cross tabulation helps us to understand that nearly 40% of the employees who
are asked to pay for the safety equipment do not use the safety equipment. It is quite possible that
the employees who do not use safety equipments cannot afford it. And the fact that they cannot
afford it may be one of the major contributing factors for not using any safety equipment.
Table 4A.37: Quality of the safety equipment - Employee's perspective
Frequency Percent Valid Percent Cumulative Percent
Valid Excellent 39 6.5 6.5 6.5
Very good 72 12.0 12.0 18.5
Good 124 20.7 20.7 39.2
Average 257 42.8 42.8 82.0
Poor 108 18.0 18.0 100.0
Total 600 100.0 100.0

141
Graph: 4.37: Quality of the safety equipment
Nearly 61% of the employees have responded that the quality of the safety equipment is
either average or poor. Improper quality of the safety equipment only adds up to the possibility
of injuries and accidents.
Table 4A.38: Do the employees feel comfortable while working with the safety equipment?
Frequency Percent Valid Percent Cumulative Percent
Valid Yes 315 52.5 52.5 52.5
No 285 47.5 47.5 100.0
Total 600 100.0 100.0
From the above table we can see that nearly 48% of the employees responded that they
do not feel comfortable while using the safety equipment. 52.5% of the employees have
responded that they do feel comfortable while using the safety equipment. There were informal
responses given by the employees that they do not have a choice to not use the safety equipment.
Safety equipment for these employees was a compulsion and they would use it whether it were
comfortable or not.

142
Table 4A.39: Do the employees feel comfortable while working with the safety equipment?
* Do employees use safety equipment? Cross tabulation
Do employees use safety
equipment?
TotalYes No
Do the employees feel comfortable while working
with the safety equipment?
Yes 196 119 315
No 163 122 285
Total 359 241 600
The cross tabulation tries to examine the contribution of the comfort factor for not using
the safety equipment. It can be seen that out of the 285 workers who do not feel comfortable
while working with the safety equipment, 122 do not use it (more than 42%). On the contrary out
of 315 of the employees who feel comfortable while working with the safety equipment, 119 still
do not use it.
Clearly it can be interpreted that it is all about the attitude and the behaviour of the
workers towards the usage of safety equipment. The workers must be trained and told, educated
about the importance of safety equipment.
They must be taught that comfort is secondary to safety and that safety must be there first
priority. At the same time, the managers too need to understand that if at all an employee is
expected to use safety equipments; they must be reasonably comfortable so that maximum output
can be obtained from a satisfied worker.
143
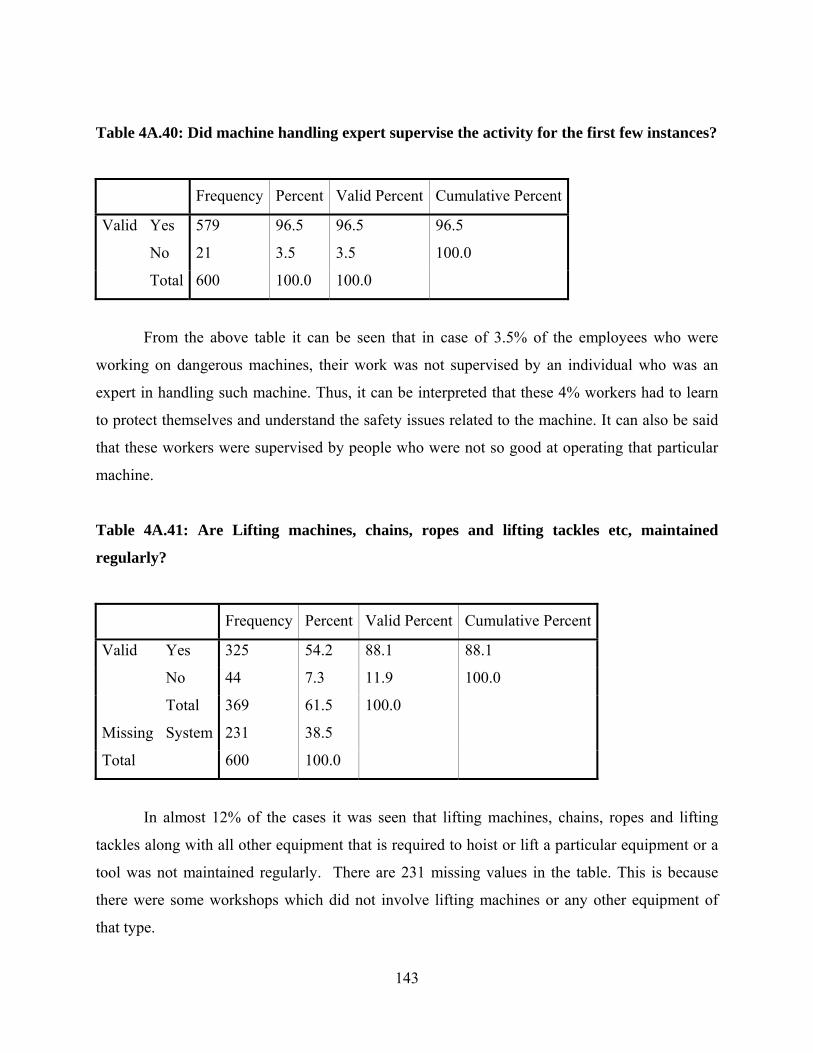
Table 4A.40: Did machine handling expert supervise the activity for the first few instances?
Frequency Percent Valid Percent Cumulative Percent
Valid Yes 579 96.5 96.5 96.5
No 21 3.5 3.5 100.0
Total 600 100.0 100.0
From the above table it can be seen that in case of 3.5% of the employees who were
working on dangerous machines, their work was not supervised by an individual who was an
expert in handling such machine. Thus, it can be interpreted that these 4% workers had to learn
to protect themselves and understand the safety issues related to the machine. It can also be said
that these workers were supervised by people who were not so good at operating that particular
machine.
Table 4A.41: Are Lifting machines, chains, ropes and lifting tackles etc, maintained
regularly?
Frequency Percent Valid Percent Cumulative Percent
Valid Yes 325 54.2 88.1 88.1
No 44 7.3 11.9 100.0
Total 369 61.5 100.0
Missing System 231 38.5
Total 600 100.0
In almost 12% of the cases it was seen that lifting machines, chains, ropes and lifting
tackles along with all other equipment that is required to hoist or lift a particular equipment or a
tool was not maintained regularly. There are 231 missing values in the table. This is because
there were some workshops which did not involve lifting machines or any other equipment of
that type.

144
Table 4A.42: Are Floors, stairs and means of access such as ladders etc, properly
constructed?
Frequency Percent Valid Percent Cumulative Percent
Valid Yes 336 56.0 56.0 56.0
No 264 44.0 44.0 100.0
Total 600 100.0 100.0
Table 4A.42.1: Are Floors, stairs and means of access such as ladders etc, maintained
neatly?
Frequency Percent Valid Percent Cumulative Percent
Valid Yes 286 47.6 47.6 47.6
No 314 52.4 52.4 100.0
Total 600 100.0 100.0
Both the tables have shown data about construction and maintenance of floors, stairs and
other means of access. In 56% of the cases it was observed that the means of access are not
properly constructed. In nearly 47.6% of the cases it was seen that means of access were not
properly maintained.
In some of the cases when the premises was observed carefully, some ladders did not
have bars to hold on. In one of the premises it was observed that the workers were expected to
carry tools and equipments using this ladder. In such cases the risk of accidents is maximum and
one may say that means of access must be properly constructed and maintained regularly so that
the workers feel safe at work.

145
Table 4A.43. Does the job involve the employee's eyes being exposed to excessive light or
small particles?
Frequency Percent Valid Percent Cumulative Percent
Valid Yes 356 59.3 59.3 59.3
No 244 40.7 40.7 100.0
Total 600 100.0 100.0
The above table shows that in 60% of the cases, the employees are exposed to some pollutant
that can prove to be harmful for their eyes. Welding, cutting and spraying operations were
mostly found to be in this category.
Table 4A.43.1: If yes, Are safety goggles/ mask / protective covering given?
Frequency Percent Valid Percent Cumulative Percent
Valid Yes 241 40.2 67.9 67.9
No 114 19.0 32.1 100.0
Total 355 59.2 100.0
Missing System 245 40.8
Total 600 100.0
If safety goggles or masks or protecting covering is not used the eyes and the skin of the
workers is at risk. It can cause temporary or long-term damage to the employee. Out of the small
scale industry workers who work in environments that contain excessive light or small particles,
32.1% of the responded that they are not provided safety goggles. Especially with workers who
working on welding machines had a common complaint that they need to be given a protective
cover not only for their eyes, but for their entire face to protect them from the sparks. Some of
them were found to be not using these safety levels this because the goggles were of not their fit,
and that they would not be comfortable wearing them.
Note: The above table shows that 245 values are missing. This is because their job does
not require them to work with safety goggles.

146
Table 4A.44: Are the necessary equipment and facilities for extinguishing fire provided?
Frequency Percent Valid Percent Cumulative Percent
Valid 1 496 82.7 82.7 82.7
2 104 17.3 17.3 100.0
Total 600 100.0 100.0
In 17.3% of the cases it was found that necessary equipment and facilities for
extinguishing fire were not provided. In the majority of cases that is, nearly 83% of the cases it
was found that such facilities were provided.
Table 4A.45: Is casing done for dangerous moving parts of machines?
Frequency Percent Valid Percent Cumulative Percent
Valid Yes 186 31.0 76.5 76.5
No 57 9.5 23.5 100.0
Total 243 40.5 100.0
Missing System 357 59.5
Total 600 100.0
In almost 24% of the cases which involved machines that had dangerous moving parts, it
was found that there was no casing done for such machines. Again in this table 357 values are
missing. This is because there were some cases where there were no dangerous moving parts for
machines.

147
Section –B
4.B Data analysis for the responses that were given by the managers.
Table 4B.1: Age in years
Frequency Percent Valid Percent Cumulative Percent
Valid 18-25 8 13.3 13.3 13.3
25-35 13 21.7 21.7 35.0
35-45 23 38.3 38.3 73.3
45-60 14 23.3 23.3 96.7
60 and above 2 3.3 3.3 100.0
Total 60 100.0 100.0
From the above table which shows the ages for the managers we can see that almost 40%
of the managers were found to be between the age group of 35 to 45 years. Only 3.3% of the
managers were found to be aged 60 and above. 21.7% of the managers were between the age
group of 25 to 35 years. 35% were found to be between the age groups of 18 to 35 years.
The remaining 65% of the managers were found to be above the age of 35 years. It can be
interpreted that most of the managers are usually above the age of 35 years. Though, in this
particular study, people have been called as managers, in most of the cases it was observed that
the managers were the owners also.
This may be the case because in small scale industry it is very difficult for a business
which has a very small turnover to maintain two separate levels of management and ownership.
Young entrepreneurs who have acquired the most advanced knowledge through a developed
academic scenario need to participate more and start more small scale industries whereby the
economy of our country will benefit and the contribution of the small scale sector to our GDP
will maximize.

148
Graph 4B.1 Age in Years
Table 4B.2: Gender
Frequency Percent Valid Percent Cumulative Percent
Valid Male 55 91.7 91.7 91.7
Female 5 8.3 8.3 100.0
Total 60 100.0 100.0
Clearly, males dominate the above table which shows the gender of the managers work in
small scale industries. Nearly 92% of the observed managers were found to be male. This may be
because of the nature of the work that is performed in the manufacturing or processing unit. Yet
it is interesting to observe that 8.3% of the managers were found to be female.
60 and above45-6035-4525-3518-25

149
Graph 4B.2: Gender
The above bar chart shows a graph, which has been prepared on the basis of the age and the
gender of the managers. It can be seen that in the age group of 18-25, no female managers were
to be seen. The same can be said about the age group of 60 and above.

150
Table 4B.3: Educational Qualification
Frequency Percent Valid Percent Cumulative Percent
Valid Under Graduate 4 6.7 6.7 6.7
Graduate - Engg. 23 38.3 38.3 45.0
Graduate - Other 11 18.3 18.3 63.3
Masters - Other 14 23.3 23.3 86.7
Masters in Engg 2 3.3 3.3 90.0
Diploma 4 6.7 6.7 96.7
Others 2 3.3 3.3 100.0
Total 60 100.0 100.0
The above table is regarding the educational qualification of the managers. It can be seen
from the above table that most of the managers were found to be graduates in the field of
engineering.
Only 3.3% of the managers had acquired their masters degrees in engineering. It is
always said, that a successful business does not require a sound technical knowledge but also
requires the proper knowledge of business management and commerce.
That is why, nearly 20% of graduates who were from a non-engineering background have
been seen to become managers in the sample that was undertaken for study.
Only 6.7% of the people were diploma holders and some of the managers responded that
diploma holders become technicians in such factories provided that their studies support that
particular activity.

151
Graph 4B.3: Educational Qualification Cross Tabulated with Age
The above graph shows that engineering graduates between the age of 35 to 45 years
have been most commonly found to be managers in hazardous small scale industrial units.
60 and above45-6035-4525-35 18-25 Age in years
10
8
6
4
2
0
Others DiplomaMasters in EnggMasters - OtherGraduate - OtherGraduate - Engg.Under Graduate
EducationalQualification

152
Table 4B.4: Total Experience as a manager
Frequency Percent Valid Percent Cumulative Percent
Valid 0-2 years 9 15.0 15.0 15.0
2-4 years 18 30.0 30.0 45.0
4-6 years 17 28.3 28.3 73.3
6-10 Years 13 21.7 21.7 95.0
10 years+ 3 5.0 5.0 100.0
Total 60 100.0 100.0
Approximately, 58% of the managers were found to be having a total experience between
2 to 6 years. Nearly 21% were found to be having the experience of 6 to 10 years. Only 5% of
the managers were found to be experienced for more than 10 years in the field of manufacturing
in small scale industry.
Graph 4B.4: Total experience as a manager
Very less number of managers, only nine totaling to 15% of the entire sample, were
found to be experienced for less than two years. Thus, the about table helps us to interpret that
more than half the managers (65%) are experienced for more than 4 years.

153
Table 4B.5: Number of years in the current company as managers.
Frequency Percent Valid Percent Cumulative Percent
Valid 0-2 years 12 20.0 20.0 20.0
2-4 years 18 30.0 30.0 50.0
4-6 years 16 26.7 26.7 76.7
6-10 Years 12 20.0 20.0 96.7
10 years+ 2 3.3 3.3 100.0
Total 60 100.0 100.0
From the table we can see that 30% of the managers have been occupying a position in
the same company for a tenure of 2 to 4 years. 20% of the managers responded that they had
been working in the same company for 6 to 10 years. Only 3.3% of the managers responded that
they have been working for more than 10 years as managers in the same organisation.
Graph 4B.5: Number of years in the current company as managers.
A cross tabulation has been given below to see how well have managers been loyal to
their organisation and whether they have been involved in frequent job shifts from one
manufacturing concern to the other.

154
Table 4B.5.1: Total Experience as a manager * Number of years in the current company
Cross tabulation
Number of years in the current company Total
0-2 2-4 4-6 6-10 10 +
Total Experience 0-2 years 9 0 0 0 0 9
2-4 years 2 16 0 0 0 18
4-6 years 0 1 16 0 0 17
6-10 0 1 0 12 0 13
10 years+ 1 0 0 0 2 3
Total 12 18 16 12 2 60
The above table points out to an interesting fact that managers have not changed their
jobs and have remained in the same position for almost all the years that they have experience as
a manager. The reason for this situation may be because of the absence of difference between
management and ownership levels in most of the cases as mentioned earlier.
Graph 4B.5.1: Total Experience as a manager * Number of years in the current company

155
Table 4B.6: Number of Workers in the factory
Frequency Percent Valid Percent Cumulative Percent
Valid 10-15 27 45.0 45.0 45.0
15-20 24 40.0 40.0 85.0
20-30 7 11.7 11.7 96.7
30 and above 2 3.3 3.3 100.0
Total 60 100.0 100.0
85% of the managers responded that there are 10 to 20 workers working in the workshop
or the factory premises. The remaining 15% responded that there were more than 20 workers
working in the premises. The small scale firms were chosen at random. The above table shows us
that on most of the cases with regards to hazardous industries there are less than 30 people
working in the factory.
Graph 4.6: Pie chart showing number of workers distribution

156
Table 4.7: Approximate number of Working Machines
Frequency Percent Valid Percent Cumulative Percent
Valid 0-5 17 28.3 28.3 28.3
6-10 34 56.7 56.7 85.0
11-20 7 11.7 11.7 96.7
20 and above 2 3.3 3.3 100.0
Total 60 100.0 100.0
Nearly 60% of the managers responded that there are 6 to 10 machines that are in
working condition within the workshop premises.
Graph 4.7: Number of working machines

157
Table 4B.8: Major hazard that the managers think that is associated with the job
Frequency Percent
Valid
Percent
Cumulative
Percent
Valid Sound Pollution, affecting the
physical and mental health 6 10.0 10.0 10.0
Air pollutants 16 26.7 26.7 36.7
Any other physical /orthopedic
stress 7 11.7 11.7 48.3
Dangerous machines 31 51.7 51.7 100.0
Total 60 100.0 100.0
In the earlier section of this chapter we have looked at the employee's perspective for the
type of hazard associated with the job. In this section of the same chapter the above table points
out the major hazard according to the managers perspectives.
Graph 4B.8: Major hazard that the managers think that is associated with the job
More than half the managers responded that the major hazard is factors are dangerous
machines which can cause serious accidents the people were working on them. That is followed
by air pollutants which according to the managers contribute to nearly 27% of the cases.

158
Table 4B.9: Is there a housing or fencing for every moving part of all the machines?
Frequency Percent Valid Percent Cumulative Percent
Valid Yes 38 63.3 63.3 63.3
No 22 36.7 36.7 100.0
Total 60 100.0 100.0
In 37% of the cases, the managers responded that fencing was not done for moving parts
of machines. Informally, the managers responded that fencing is not required. According to the
factories act, such a fencing is essential for moving parts of all the machines. Fencing is one of
the most essential elements and has the ability of saving several serious accidents because due to
a fencing, the workers hands or legs are safeguarded to particular extent.
When asked for the reasons of not having a fencing, the managers responded to the
workers are well-trained and even in the most rare cases will never make a mistake of putting
their hand or getting the finger stuck in a moving part of a machine. In some cases it was said
that there is no fencing because the machine design does not allow them to have any fencing
around the moving part.
In some cases it was also seen that there was no space which could be allotted for any
casing of any kind. Some managers out of the above 37% also said that it is very difficult for
them to allocate a budget to do an additional fencing for the machine.

159
Table 4B.10: Approximate number of days training is given to the employees before they
work on dangerous machines
Days Frequency Percent Valid Percent Cumulative Percent
Valid 1 19 31.7 31.7 31.7
2 22 36.7 36.7 68.3
3 9 15.0 15.0 83.3
4 7 11.7 11.7 95.0
5 3 5.0 5.0 100.0
Total 60 100.0 100.0
In nearly 68% of the cases it has been seen that the workers are just given one or two
days of prior training before they start working on dangerous machines. Only 5% of the
managers responded that the workers are given a training of around 5 days before they actually
start working on a process.
When asked informally the managers seemed to be worried about the losses that would
occur due to wastage arising from improper utilization of raw material on the machines. They
seemed to be more worried about the quality of the produce.
Graph 4B.10: Approximate number of days training
54321
Approximate number of days
25
20
15
10
5
0

160
The United States Department of labour has developed Occupational Safety and Health
Administration standards. These standards are commonly referred to as OSHA Standards.
According to these standards "For Initial training. (i) General site workers (such as equipment
operators, general labourers and supervisory personnel) engaged in hazardous substance removal
or other activities which expose or potentially expose workers to hazardous substances and
health hazards shall receive a minimum of 40 hours of instruction off the site, and a minimum of
three days actual field experience under the direct supervision of a trained, experienced
supervisor." It is an astonishing fact that majority of the managers become very confident and
very quickly to withdraw training activities within two days for a person who works on a
dangerous machine.
Table 4B.11: How well do employees carry out any mounting or shipping of belts or
lubrication or make any adjustments when the machinery is in motion?
Frequency Percent Valid Percent Cumulative Percent
Valid Very Well 14 23.3 23.3 23.3
Good Enough 8 13.3 13.3 36.7
Poorly 1 1.7 1.7 38.3
Carelessly 2 3.3 3.3 41.7
They are not allowed 35 58.3 58.3 100.0
Total 60 100.0 100.0
This question was designed to test the knowledge of the manager regarding the safety
provisions that have been mentioned in the factories act of 1948. According to the provisions of
the act employees are not allowed to carry on any mounting or shipping of belts or lubrication or
make any adjustments when the machinery is in motion. In almost 60% of the cases it was seen
that managers knew that such an action is not allowed therefore the responded that no one is
permitted to do any activity regarding belts or machines and the lubrication especially when the
machinery is in motion. Others unfortunately did not even know about this provision and
indicated that they allow this particular work to be done.

161
Table 4B.12: How frequently cranes and other machines are checked for safety - every
three months?
Frequency Percent Valid Percent Cumulative Percent
Valid Once 18 30.0 30.0 30.0
2 to 3 times 12 20.0 20.0 50.0
Weekly basis 11 18.3 18.3 68.3
Daily Basis 8 13.3 13.3 81.7
As per Requirement 11 18.3 18.3 100.0
Total 60 100.0 100.0
Nearly 18.3% of the managers responded that cranes and other machines are checked for
safety only as per requirement. When they're actually being checked only as per requirement it
means that unless and until there is a fault or some problem associated with a crane was a
machine it would never be checked.
Graph 4.12: How frequently cranes and other machines are checked for safety - every
three months?
As perRequirement
Daily BasisWeekly basis2 to 3 timesOnce

162
Every worker who is working with the crane cannot be deemed or cannot be assumed to
be an expert and to understand all the warnings that particular machine or a crane gives before it
contributes to a major accident. Such a practice is very dangerous. Unfortunately, there is no
such single international standard which tells us as to how many times should a particular crane
be checked in three months.
It is actually the job of the person who manages the affairs of the production department
to make sure that all the parts are well serviced, lubricated and are safe to work on. Actually for
practical purposes, some equipments are not of dangerous nature. These equipments in the
workshops are of such a nature that they would not lead to an accident. All that would happen, if
such an equipment malfunctions is that the work would stop. Strikingly, this category of
equipment was tested more regularly as compared to the others.
Managers want the work to continue, at all costs. This fact came up during informal
interviews with the managers and workers. The above pie chart also depicts that nearly 50% of
the equipment is tested only once or as per requirement.
Lathe machines have been observed to the most feared machines based on personal
interviews. Lathes are machines which are equipped with a motor that turns along with the work
piece (job). A very sharp lathe knife or other cutting device changes its shape or form. The
workers responded that lathe machines can cause serious injuries in certain conditions.
Lathe machines can be made safer by using guards. The following exhibit shows how a
lathe machine with a guard looks like:

163
Fig 4B.12.1: Lathe Machine Guard.
Fig 4B.12.2: Guarded Lathe Machine
The above figures show that the workplace can be made safer. Unfortunately, when the
researcher made visits, there were very rare instances where such dangerous machines were
found to be properly guarded. One of the examples of the lathe machine that was seen is shown
in Fig 4.12.C.A Lathe machine can cause accidents in various forms. Minor to serious injuries
that can occur due to a lathe machine are that the small particles of metal can fly and pierce the
eyes of the operator or a person who is standing near the lathe machine. Thus, wearing eye
protection while working on a lathe machines is extremely essential.

164
Fig 4B.12.3: Lathe Machines - Example of an observed lathe machine.
Table 4B.13: Need of adequate supervision by an expert for a person working on a
dangerous machine.
Frequency Percent Valid Percent Cumulative Percent
Valid Yes 46 76.7 76.7 76.7
No 14 23.3 23.3 100.0
Total 60 100.0 100.0
23.3% of the managers responded that there is no need of adequate supervision by an
expert for person working on a dangerous machine. Another cross tabulated table as shown
below will make things more clear

165
Table 4B.13.1: Approximate number of days training * need of adequate supervision by an
expert for worker on a dangerous machine? Cross tabulation
Supervision
TotalYes No
Number of days of training 1 12 7 19
2 16 6 22
3 8 1 9
4 7 0 7
5 3 0 3
Total 46 14 60
Graph 4B.13.1: Need for supervision and approximate number of days of training.
Clearly the above graph shows us that those managers who say that only one or two days
training is given to the people were working on dangerous machines, majority of them are such
people who feel that there is no adequate need of supervision to be done by experts when such a
person is working on a dangerous machine.

166
Table 4B.14: How frequently does the Safety Inspector Visit the premises?
Frequency Percent
Valid
Percent
Cumulative
Percent
Valid Once or more than once in a
year 46 76.7 76.7 76.7
Not even once in a year 14 23.3 23.3 100.0
Total 60 100.0 100.0
From the above table it can be seen that in most of the cases (77 %) it has been observed
that the safety inspectors visit the factory premises at least once in a year. In 23% it was found
that the factory inspectors do not visit the premises even once during the entire year.
Graph 4B.14: How frequently does the Safety Inspector Visit the premises?

167
Table 4B.15: Managers' rating for the strictness of the Safety Inspector
Frequency Percent
Valid
Percent
Cumulative
Percent
Valid Extremely
Strict 30 50.0 50.0 50.0
Strict 7 11.7 11.7 61.7
Not so strict 9 15.0 15.0 76.7
Lenient 10 16.7 16.7 93.3
Very Lenient 4 6.7 6.7 100.0
Total 60 100.0 100.0
50% of the managers responded that the safety inspectors were extremely strict. 12%
responded that they were strict. All others have responded that they are either not so strict or
lenient or they are very lenient. Certainly, the above table helps us to understand that the
inspectors are very strict with the majority of the managers.
Graph 4B.15: Managers rating for the strictness of the Safety Inspector

168
Table 4B.16: Frequency of minor accidents: Responses given by managers.
Frequency Percent Valid Percent Cumulative Percent
Valid Very rare 19 31.7 31.7 31.7
Rarely 8 13.3 13.3 45.0
Sometimes 18 30.0 30.0 75.0
Often 9 15.0 15.0 90.0
Very frequently 6 10.0 10.0 100.0
Total 60 100.0 100.0
Graph 4B.16: Frequency of minor accidents
In 55% of the cases seen that accidents that are minor in nature either happen sometimes,
often or very frequently. In 10% of the cases it was found that accidents happen very frequently.
When enquired the manager said that now the workers have accepted it is a part of the job and
have become immune to such minor accidents and at times they continue their work without
even paying attention to such small accidents.

169
Table 4B.17: How many fatal accidents took place during their entire experience as a
manager?
Frequency Percent Valid Percent Cumulative Percent
Valid 0 57 95.0 95.0 95.0
1 2 3.3 3.3 98.3
2 1 1.7 1.7 100.0
Total 60 100.0 100.0
Graph 4B.17: Frequency of Fatal Accidents during the tenure of the manager
5% of the managers responded that there has been at least one fatal accident during their
entire experience as a manager. This table points out to a very interesting fact that actually fatal
accidents are rare. This fact will be further supported by another cross tabulation as below.

170
Table 4B.18: Total Experience as a manager * How many fatal accidents took place? Cross
tabulation
How many fatal accidents took place?
Total0 1 2
Total Experience as a manager 0-2 years 9 0 0 9
2-4 years 16 1 1 18
4-6 years 16 1 0 17
6-10 Years 13 0 0 13
10 years+ 3 0 0 3
Total 57 2 1 60
The above cross tabulation shows managers who have experiences ranging from 2 to
more than 10 years. Managers who have an experience of more than 10 years have not reported
any fatal accident during their entire lifespan. Certainly these managers are the most experienced
managers of the entire lot but have not encountered a situation of a fatal accident even after
serving as managers or entrepreneurs for more than 10 years.
Table 4B.19: During the entire experience as a manager, how many accidents happened in
the factory that caused permanent disability to the worker?
Frequency Percent Valid Percent Cumulative Percent
Valid 0 49 81.7 81.7 81.7
1 11 18.3 18.3 100.0
Total 60 100.0 100.0
The above table shows that in 81.7 % of the cases permanent disability was not caused to
any of the workers. In remaining 18.3% of the cases it was seen that at least once did the
managers face a situation where a permanent disability was caused to a worker due to an
accident that happened in the factory. Certainly, this percentage is very high. It helps us to
interpret that at least one in five managers does encounter a situation in his career and has to
manage problems caused by an accident which cause permanent disability to a worker.

171
Table 4B.20: Is the maintenance of the machines cranes and all mechanical parts or tools
done by in-house personnel or is it out-sourced?
Frequency Percent Valid Percent Cumulative Percent
Valid In-house personnel 46 76.7 76.7 76.7
Outsourced 14 23.3 23.3 100.0
Total 60 100.0 100.0
It seems to be a common practice in more than one third of the firms that maintenance is
taken care by in-house personnel. Only in 23.3% of the cases the managers responded that a team
from some vendor is appointed to make sure that the machines are maintained, lubricated and are
safe to work on.
Graph 4B.20: Is the maintenance of the machines cranes and all mechanical parts or tools
done by in-house personnel or is it out-sourced?

172
Table 4B.21: Do all workers working in the factory have certificate of fitness issued by a
certified surgeon?
Frequency Percent Valid Percent Cumulative Percent
Valid Yes 16 26.7 26.7 26.7
No 44 73.3 73.3 100.0
Total 60 100.0 100.0
73.3% of the managers responded that all the workers working in the factory are not
having a certificate of fitness issued by certified surgeon. They were asked the reason as to why
this was the case. Their answer was that most of the workers work on daily basis and are given
daily or weekly pays.
Graph 4B.21: Do all workers working in the factory have certificate of fitness issued by a
certified surgeon?
They are temporary workers. Some also said that some of these workers are highly
irregular and there is no guarantee that such a worker who is working today will come tomorrow
for work.

173
Table 4B.22: What kind of provision has the company made for medical emergencies that
may arise?
Frequency Percent
Valid
Percent
Cumulative
Percent
Valid First aid box 33 55.0 55.0 55.0
Special Training is given to the
employees 4 6.7 6.7 61.7
Both 1 and 2 8 13.3 13.3 75.0
None* 15 25.0 25.0 100.0
Total 60 100.0 100.0
Medical emergencies come without any warning. Such emergencies may arise out of an
accident or otherwise. There has to be some kind of a provision made within the factory premises
to face such a medical emergency.
Graph 4B.22: Kind of provision
A first aid box which is one of the most basic requirements which we also see in a bus.
25% of the managers responded that there is no safety box or medical aid box maintained within
the factory premises. Such boxes were in some cases hanging like showpieces on the wall. Some

174
were broken and were not properly maintained. Only 6.7% of the managers responded that some
kind of training is given to the employees to treat a person who needs immediate medical
attention.
*Note: None here means that there were 11 instances where the managers said that there
was a provision, but when observed, the first aid boxes were empty- out of supplies, and in 4
cases, there was no first aid box at all.
Table 4B.23: Has the company tied up or subscribed for the services of any organization
that spreads awareness regarding employee's safety?
Frequency Percent Valid Percent Cumulative Percent
Valid Yes 47 78.3 78.3 78.3
No 13 21.7 21.7 100.0
Total 60 100.0 100.0
Graph 4B.23: Tie-up or Subscription with organizations that spread awareness
In 78% of the cases it was seen that the company of the firm has tied up or subscribed for
the services of an organisation that spreads awareness regarding employee safety. The remaining
21.7% of the managers responded that there are no such active tie-ups.
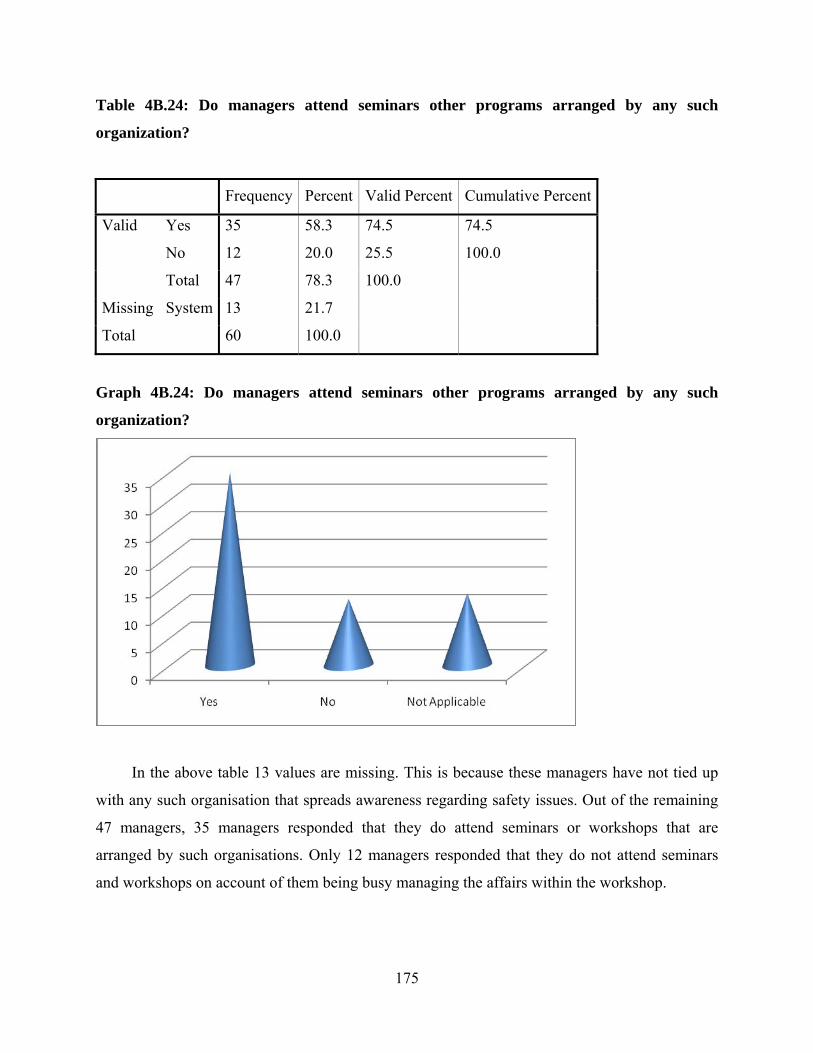
175
Table 4B.24: Do managers attend seminars other programs arranged by any such
organization?
Frequency Percent Valid Percent Cumulative Percent
Valid Yes 35 58.3 74.5 74.5
No 12 20.0 25.5 100.0
Total 47 78.3 100.0
Missing System 13 21.7
Total 60 100.0
Graph 4B.24: Do managers attend seminars other programs arranged by any such
organization?
In the above table 13 values are missing. This is because these managers have not tied up
with any such organisation that spreads awareness regarding safety issues. Out of the remaining
47 managers, 35 managers responded that they do attend seminars or workshops that are
arranged by such organisations. Only 12 managers responded that they do not attend seminars
and workshops on account of them being busy managing the affairs within the workshop.

176
Table 4B.25: Frequency of upgrading the safety equipment:
Frequency Percent Valid Percent Cumulative Percent
Valid Once a year 20 33.3 33.3 33.3
Need Based Upgrade 40 66.7 66.7 100.0
Total 60 100.0 100.0
Graph 4B.25: Frequency of upgrading the safety equipment:
Safety equipment must not only be purchased but also maintained and upgraded
whenever required. The workers keep on using safety equipment unless they're found to be
defective or outdated by either themselves or the supervisor. The situation certainly needs to
improve as nearly 67% of the managers responded that their upgrade of the safety equipments is
need based. The major reason behind this is that small scale industries operate on very tight
budgets. Yet, 33% responded that they upgrade safety equipment at least once a year.

177
Table 4B.26: According to the managers, are the Safety Inspectors doing a very good job?
Frequency Percent Valid Percent Cumulative Percent
Valid Yes 38 63.3 63.3 63.3
No 22 36.7 36.7 100.0
Total 60 100.0 100.0
Graph 4B.26: According to the managers, are the Safety Inspectors doing a very good job?
From the above table we can see that 63% of the managers have responded that according
to their perspective the safety inspectors are doing a very good job. Very recently, our Hon.
Prime Minister, Narendra Modi, seems to have taken a serious note of the issues related to safety
inspection. Mr. Narendra Modi, strongly believes that labour reforms hold the master key to the
success of India.
On Oct 17, 2014, at Pt. Deendayal Upadhyay "Shramev Jayete" which was a program
organised by the Labour Ministry, uncovered a new line of action, that includes several
procedures to end the ‘Inspector Raj’ with a structure that is likely to stridently limit the element
of judgment with labour inspectors and a single window compliance method for companies on
issues that are related to workers. More details of the scheme have been given in the Literature
Review.

178
Table 4B.27: Has the company ever been penalized for not following safety provisions?
Frequency Percent Valid Percent Cumulative Percent
Valid Yes 13 21.7 21.7 21.7
No 47 78.3 78.3 100.0
Total 60 100.0 100.0
In 22% of the cases the managers responded that they have been penalised at least once
for not following the safety provisions. The above table helps us to interpret that the managers
were managing the affairs of small scale industries are in the phase of learning the importance of
safety provisions that have been stated by the factories act and other legislative frameworks
which cover such industries.
Table 4B.28: Do your safety provisions exactly match with the provisions laid down by the
Factories Act?
Frequency Percent Valid Percent Cumulative Percent
Valid Yes 17 28.3 28.3 28.3
No 13 21.7 21.7 50.0
Cannot Comment 30 50.0 50.0 100.0
Total 60 100.0 100.0
30 managers chose not to comment whether they're provisions exactly match with those
laid down by the factories act or the State rules that have been stated to make sure that the
factory is a safe place to work. 21.7% of the managers bluntly said that they were sure that all the
provisions do not match. 28.3% of the managers seem to be confident enough that they're safety
provisions exactly match with the provisions laid down by the factories act.

179
Table 4B.29: When Safety provisions are upgraded, do you observe an effective increase in
the productivity of the workers?
Frequency Percent Valid Percent Cumulative Percent
Valid Yes 46 76.7 76.7 76.7
No 14 23.3 23.3 100.0
Total 60 100.0 100.0
Nearly 77% of the managers agreed to the fact that there is an effective increase in the
product of the workers won the safety equipment has been upgraded. On the 23.3% of the
managers said that there were other factors which were more important than a mere safety
provision upgrade that contribute to an increasing the productivity of the workers.
When being interviewed most of the managers responded that bonuses and salary hikes
are even more elemental increasing the productivity of the workers. Salaries, bonuses and other
financial incentives are the major concern of the employees. If paid substantial amount of salary
given worker according to some managers would sacrifice his safety to a particular extent and
work more productively.
Table 4B.30: How efficiently do they work with available safety equipments? Rating given
(10 Most effectively, 1 Least effectively)
Frequency Percent Valid Percent Cumulative Percent
Valid 1 3 5.0 5.0 5.0
2 5 8.3 8.3 13.3
3 4 6.7 6.7 20.0
4 5 8.3 8.3 28.3
5 6 10.0 10.0 38.3
6 11 18.3 18.3 56.7
7 9 15.0 15.0 71.7
8 9 15.0 15.0 86.7
9 3 5.0 5.0 91.7
10 5 8.3 8.3 100.0
Total 60 100.0 100.0

180
Graph 4B.30: How efficiently do they work with available safety equipments? Rating given
(10 Most effectively, 1 Least effectively)
Statistics
N Valid 60
Missing 0
Mean 5.88
Mode 6
The table shows us that the mode six and the meanness 5.8. This means the managers
have responded with considerable consistency that the workers are working with reasonable
efficiency with the currently provided safety equipment.

181
Table 4B.31: Motivation, retention and sense of belonging
Motivation Retention Sense of belonging
Yes 52 56 55
No 8 4 5
In the above table the responses of the managers to questions such as: whether proper
safety equipments help to increase motivation workers? Whether such equipments help in
retaining the workers? Whether safety equipments contribute towards increasing the sense of
belonging of the workers towards the company? Have been recorded. In all the three cases more
than 50/60 managers have responded positively that a proper set of safety equipments which is
maintained from time to time damages of reasonably good quality does not only motivate the
workers but also helps the company to retain such workers and increases sense of belonging
towards the company.
A proper safety equipment when given to a worker underlines the fact that the company
cares for the workers and also makes an informal appeal to the workers to care for the company
and work for the company with maximum efficiency and loyalty.

182
Graph 4.31: Motivation, retention and sense of belonging
Table 4B.32: Training of the managers for in working with hazardous industry
Frequency Percent Valid Percent Cumulative Percent
Valid Yes 18 30.0 30.0 30.0
No 42 70.0 70.0 100.0
Total 60 100.0 100.0
It is not only the workers who can face the difficulties arising out of hazardous processes
or chemicals. Since they are into the work of supervision of the workers were working on
different machines and processes, the managers equally need to be careful and must protect
themselves from whatever hazards may arise. Therefore it is necessary to the managers are also
trained in working in hazardous environments.
It is also necessary for them to use the appropriate safety equipment when they are
performing supervision activities. From the above table it can be seen that 42/60 that is nearly

183
70% of the managers have responded that they have not taken any such formal training to work
in hazardous industries.
Table 4B.33: Up-to-date health records of all the employees in the factory.
Frequency Percent Valid Percent Cumulative Percent
Valid Yes 6 10.0 10.0 10.0
No 54 90.0 90.0 100.0
Total 60 100.0 100.0
Only 6/60 managers responded that they do have up-to-date health records of all the employees
in the factory. Remaining 90% of the managers responded that they do not keep up-to-date
records and that they are sure that no other company does the same.
Table 4B.34: Have you provided for medical examination of very worker before he joins as
a new worker in the factory?
Frequency Percent Valid Percent Cumulative Percent
Valid Yes 23 38.3 38.3 38.3
No 37 61.7 61.7 100.0
Total 60 100.0 100.0
When an individual is appointed for any particular work in a company or a medium or
large-scale organisation usually, he must undergo medical examination which is conducted by a
health officer who is a doctor and is appointed by the company.
Some basic variables regarding the workers health checked and recorded. The factories
act also makes it mandatory to the appointing firm to provide for medical examination of every
worker before he joins a particular factory. Almost 62% of the managers responded that no such
medical examination is conducted.

184
Table 4B.35: Knowledge of permissible limits of exposure of chemical and toxic substances
Frequency Percent Valid Percent Cumulative Percent
Valid Yes 21 35.0 35.0 35.0
No 39 65.0 65.0 100.0
Total 60 100.0 100.0
Graph 4B.35: Knowledge of permissible limits of exposure of chemical and toxic substances
The above question was employed in, is the knowledge of the managers. They were
asked whether they knew the permissible limits of exposure of chemical or toxic substances
according to law.
65% of the managers responded that they did not know about this and that as long as the
workers did not complain about any health problem though not much concerned about measuring
the amount of exposure of the workers towards chemical and toxic substances. In the interview,
managers were also asked whether they have set their own standards for the same.
The answer was somewhat similar and more than 60% replied that such standards are
followed in large industries which have very huge turnover and have budgets for establishing and
maintaining standards.

185
Table 4B.36: Workers' participation in safety management
Frequency Percent Valid Percent Cumulative Percent
Valid Excellent 8 13.3 13.3 13.3
Very Good 9 15.0 15.0 28.3
Reasonable 18 30.0 30.0 58.3
Very Rare 15 25.0 25.0 83.3
Never 10 16.7 16.7 100.0
Total 60 100.0 100.0
Graph 4B.36: Workers' participation in safety management
Safety management cannot be taken care of by the manager alone. He must take into
confidence his subordinates and the workers who can give useful suggestions as far as
implementation of safety norms is concerned.
Nearly 32% of the employees very rarely or never participate in safety management
issues. According to the managers there are not bothered about their own safety. As a response to
this interview question some of the managers responded that they were only bothered about the
daily pay and bonuses and salaries and the financial aspect of the job.

186
Table 4B.37: Do workers work on hoists and lifts?
Frequency Percent Valid Percent Cumulative Percent
Valid Yes 33 55.0 55.0 55.0
No 27 45.0 45.0 100.0
Total 60 100.0 100.0
A hoist is a piece of equipment used for lifting or lowering a weight through a drum or
lift-wheel in the region of which cable or chain wraps. It may be manually or mechanically
operated. Such hoists are used in many of the small scale industries. In 55% of the cases it was
found that workers work on hoists and lifts.
Picture 4B.37: A Hoist

187
Table 4B.38: Frequency of maintaining and servicing the hoists and lifts
Frequency Percent Valid Percent Cumulative Percent
Valid Very rare 9 15.0 27.3 27.3
Rarely 8 13.3 24.2 51.5
Once in 6 Months 6 10.0 18.2 69.7
As per requirement only 5 8.3 15.2 84.8
Very frequently 5 8.3 15.2 100.0
Total 33 55.0 100.0
Missing System 27 45.0
Total 60 100.0
Graph 4B.38: Frequency of maintaining and servicing the hoists and lifts
From the above table it can be seen that out of the 55% of the cases where it was found that
workers work on hoists and lifts out of them, 51.5% managers responded that very rarely the
hoists and lifts are serviced and maintained.
15.2% responded that these are serviced only as per requirement and if there is a particular
fault arising out of the considered for the purpose of being serviced and maintained.

188
Table 4B.39: Register kept to record the details of every examination of hoists and lifts.
Frequency Percent Valid Percent Cumulative Percent
Valid Yes 7 11.7 21.2 21.2
No 26 43.3 78.8 100.0
Total 33 55.0 100.0
Missing System 27 45.0
Total 60 100.0
Many of the managers responded that there is no need to keep a register for the
examination of a hoist or lift as they had a continuous watch on the way a particular hoist or lift
is working and that they would know by just looking at it whether or not it requires any
maintenance.
The managers seemed to be a little bit overconfident over here. 78% of the managers
have responded that there is no register kept to record the details of every such examination. If
there is a major repair they get a bill which is then attached to a file and entries are also recorded
using software like Tally onto the computer so they have a ready reference whenever they want
to check the date of servicing a particular lift a hoist and that such data is readily available along
with all the details of the repairs made to this mechanical equipment.
Only 21.2% of the managers responded that they keep a separate register and every
time the equipment is serviced or maintained or repaired an entry has to be made in the register.

189
Table 4B.40: Floors, stairs and means of access: Is fencing done?
Frequency Percent Valid Percent Cumulative Percent
Valid Yes 45 75.0 75.0 75.0
No 15 25.0 25.0 100.0
Total 60 100.0 100.0
Floors stairs and means of access can prove to be very dangerous if there not properly
fenced or their weak. Many accidents happen well people walking on the floors or the stairs lose
their balance. Very easily such accidents can cause fractures and serious injuries. Therefore it is
necessary that proper fencing is made to the floors or the stairs and other means of access. From
the above table we can see that 45/60 managers responded that floors stairs and means of access
are properly fenced. When the data was being collected a general observation of the entire
factory premises was made. In 25% of the cases it was found that fencing was not proper and in
some cases fencing was totally absent.
Table 4B.41: Maximum weight of material article, tool or appliance is regularly lifted by
your strongest employee
Frequency Percent Valid Percent Cumulative Percent
Valid More than 100 Kgs 2 3.3 3.3 3.3
60 to 100 Kgs 19 31.7 31.7 35.0
55 to 60 Kgs 22 36.7 36.7 71.7
Less than 55 Kgs. 17 28.3 28.3 100.0
Total 60 100.0 100.0
The Maharashtra Factory Rules State that "(3) No woman or young person shall be
engaged in conjunction with others, in lifting, carrying or moving any material, article, tool or
appliance, if the weight thereof exceeds the maximum weight fixed by the schedule to Sub-rule
(2), multiplied by the number of the persons engaged. "

190
Graph 4B.41: Maximum weight of material article, tool or appliance is regularly lifted by
your strongest employee
Unfortunately, many of the managers did not know about the rules. The maximum weight
that can be lifted by an adult male employee is 55 kgs. 72% of the managers answered that there
strongest employees can carry anything that is above 55 kgs. As one of the most astonishing
observations we can see that nearly 32% have stated that there strongest worker can lift 60 kg to
100 kg of weight.

191
Table 4B.42 Motivation level of employees (1=Poor, 10 Fabulous)
Frequency Percent Valid Percent Cumulative Percent
Valid 1 6 10.0 10.0 10.0
2 8 13.3 13.3 23.3
3 2 3.3 3.3 26.7
4 14 23.3 23.3 50.0
5 12 20.0 20.0 70.0
6 11 18.3 18.3 88.3
7 5 8.3 8.3 96.7
8 2 3.3 3.3 100.0
Total 60 100.0 100.0
Graph 4B.42 Motivation level of employees (1=Poor, 10 Fabulous)
The above table shows the responses of the managers about the motivation levels of the
employees. This question was purposefully asked to the managers because they are the ones who
really understand how well their employees are motivated. Around 30% of the managers have
given a rating of 6, 7 or eight on a scale of 10, where one meant least motivated and 10 meant
most motivated.

192
Table 4B.43 Productivity/ Efficiency of employees
Frequency Percent Valid Percent Cumulative Percent
Valid 1 3 5.0 5.0 5.0
2 5 8.3 8.3 13.3
3 7 11.7 11.7 25.0
4 16 26.7 26.7 51.7
5 5 8.3 8.3 60.0
6 11 18.3 18.3 78.3
7 5 8.3 8.3 86.7
8 4 6.7 6.7 93.3
9 3 5.0 5.0 98.3
10 1 1.7 1.7 100.0
Total 60 100.0 100.0
Like the earlier table, the managers were requested to rate the productivity of their
employees on a scale of 10 where one meant least productive and 10 meant most productive.
Most of the managers have given an average rating between 4 to 7.
Table4B.44: Safety measures rating
Frequency Percent Valid Percent Cumulative Percent
Valid 2 10 16.7 16.7 16.7
4 24 40.0 40.0 56.7
5 19 31.7 31.7 88.3
6 6 10.0 10.0 98.3
7 1 1.7 1.7 100.0
Total 60 100.0 100.0

193
In the table above the managers were requested to give a rating out of 10 for the safety
measures that there were undertaken in the workshop. In the rating of 10, 1 meant poor safety
measures whereas 10 was for the best safety measures.
It is interesting to see that none of them have given a rating above seven. With this we
can interpret that not even a single manager could rate his safety features as the best.
Table 4B.45: Approximate average monthly salary per employee
Frequency Percent Valid Percent Cumulative Percent
Valid 6000 13 21.7 21.7 21.7
6500 11 18.3 18.3 40.0
7000 11 18.3 18.3 58.3
7500 10 16.7 16.7 75.0
8000 2 3.3 3.3 78.3
8500 3 5.0 5.0 83.3
9000 10 16.7 16.7 100.0
Total 60 100.0 100.0
In the above table we see the responses given by the managers about the average monthly
salary they pay per employee for the factory workshop. It will be seen that most of the managers
were between Rs. 6,000 to 7,000 as an average monthly salary to the employees.

194
SECTION –C
4.3 Interviews of the inspectors:
As mentioned earlier, a detailed interviews of safety inspectors were conducted. This
section focuses on the same interview which contained a series of questions, asked to the
inspector.
The first question was asked how many industries were allotted per inspector. This
question was asked because it was essential to know as to how much attention could one
inspector give to a particular company or a group of companies in a given area. A proper
inspection of the entire premises is essential to make sure that the objectives of the visits made
by the inspectors are achieved. If too many companies are allotted to a single inspector, it means
that such an inspector would not be able to give proper justice at each of his visit. Therefore it is
necessary that the amount of load per inspector is kept reasonable. When asked the same
question the inspectors answered that around 2000 to 2500 firms are allotted to one safety
inspector.
Though this particular number is an approximate figure and not an exact figure, it can be
seen that the total number of firms that have been allotted per inspector seem to be unreasonable.
Taking into consideration the above answer if one calculates three monthly visits per inspector
for 2000 odd companies, the inspectors will have to do 8000 visits per annum at an average of
around 22 visits every day. It is very difficult for a single person to make 22 visits in one day and
be just and equitable to all these workshops or firms that have been visited.
The inspectors were asked about the approximate duration of each visit. According to the
inspectors the duration of each visit depends upon the size of operations and the provisions in
each case. In case of bigger workshops or units it took them around 30 to 40 minutes to conduct
the visit. In some cases it took even more time where it was found that many discrepancies

195
existed. The inspectors responded that the duration of the visit is not standard and is totally
dependent upon the circumstances of each case.
This question was followed by another question which is connected to the previous one.
They were asked that how frequently are visits conducted in a single year? The answer was that
visits happen mostly once in a year. For the rest of the year it is the employer and the employees
are the ones who are taking care that the workers work in a healthy environment. It is quite
sensible and can be easily understood that 22 visits every day are not reasonable. Safety
inspectors also take leaves and have their holidays. Since the workload on each inspector is so
huge, they cannot conduct quarterly visits to the premises of the various companies and factories
that require inspection.
The next question that was asked was about the cooperation that the inspectors receive
from the managers. There is full cooperation from the managers. It is a good thing to know that
whenever visits are arranged the managers are always present and respect the inspectors. At the
same time, according to what the inspectors said, all the suggestions that are given are
implemented by the managers of such factory workshops with the visits have been done.
Since there is a huge load per inspector, a special team that is trained in operating
technical equipments that are required to take vital measurements during the visit is appointed.
There are several instances where the inspector may demand the sound levels be checked in
terms of decibels. There may be certain instances where the inspectors may require a temperature
or humidity to be measured to make sure that all these variables do not cross the permissible
limits according to the laws framed from time to time. This special team knows the correct way
to use the testing equipment and helps to save the time of the inspectors. It can be said that the
inspectors are dependent totally upon the opinion and the measurements that are taken by the
team.
In the next question the inspectors were asked whether they have estimates relating to is
accidents or data that is related to accidents for example: how many accidents happened in the
past three months or six months? The inspectors answered that did not have exact estimates and

196
minor accidents kept happening from one place to the other. According to what they said, major
accidents or fatal accidents are not that much common and they don't happen very frequently.
The reason as to why there were no exact estimates relating to such accidents was that the
reporting of such accidents happens at the root level of the proprietors or managers of the small
scale firms. These proprietors or so-called managers are the ones who take sole responsibility of
whatever accident has happened within the premises.
The inspectors were asked the reasons as to why accidents happen. According to the
inspectors the accidents happen mainly due to 3 reasons. viz: Employee Psychology, Safety
measures and welfare. If the company does not provide for welfare facilities, which include
timely wages, bonuses, healthy working conditions etc., it affects the psyche of the workers and
the chances of accidents certainly rise. It must be said that inspectors were absolutely right in
giving the answer to this particular question. Employees psychology is totally dependent upon
the kind of wages that they get. The kind of wages that a particular employee gets decides the
lifestyle of that particular worker. In our earlier data analysis we have seen that the kind of
lifestyle that the workers live is not up to the mark. Their wages are the major reason behind this.
With so many dependents in their family, it is very difficult for a worker to be satisfied about his
job and the wages that he gets. Many times, workers are found to get depressed because their
wages are not enough to support the desires of the dependents. Due to this kind of disorientation,
the psych of the workers is affected adversely.
The workers are pushed to work for more hours to earn more money. When they work for
overtime, their health gets compromised and the chances of accidents and injuries that may
happen to workers increase. The most obvious reason is the safety provisions. Inadequate safety
provisions are also one of the most critical factors that affect the possibility of accidents.
According to the provisions of The Factories Act, 1948, safety registers of documents
related to safety must be properly maintained by the managers and must be kept up-to-date. The
inspectors were asked whether such records are always available at which are premises they
visit. The inspectors answered that when the eight the inspectors ask for the safety registers or
documents related to safety, these are not always available up to date. In such cases the

197
inspectors have to take very strict steps to make sure that all the compliances are properly
followed and taken seriously by the management. At times, they even charge penalties in case of
serious defaults being observed with the same regards. The next question is related to penalties.
It was asked to the inspectors about the maximum penalty that they have charged during
their tenure. The maximum penalty that was charged by the inspector most frequently was up to
1 lakh rupees and case was filed, according to the law applicable and the circumstances of each
case. Whenever required, criminal procedures were also made applicable.
When the cases are filed, the inspectors themselves present the case before the court as
the inspectors have the required qualifications or powers. The inspectors said that they are public
servants and that it is their prime duty to fight against all injustice.
The inspectors were asked that whether their advice was taken seriously and whether all
the recommendations or suggestions that they made were implemented. The inspectors answered
that their advice is taken very seriously and their recommendations are immediately
implemented. Whenever the inspectors suggest any changes to be made in the safety equipment,
the changes are brought about at the earliest.
Further, the inspectors were asked that whenever they feel that there is a particular
change in the existing laws that is to be brought about, what was the procedure? The inspectors
answered that they were the ones who work at the grassroots level. They affirmatively said that
their higher authorities do pay serious attention to the various suggestions that are made by the
inspectors regarding suggestions to make changes in the existing provisions in the laws or the
rules that are formed by the state.
The usual procedure is that inspectors make reports whenever they feel that a particular
change in the provision would make things better for the workers and for the act to achieve its
objectives in a more efficient way. Such reports are made to the higher authorities which are then
discussed by the respective panel specially appointed for the same purpose and changes are
brought about in the existing laws wherever it is felt necessary.

198
The inspectors were asked whether they feel that the remuneration was up to the mark of
whether they are completely satisfied with the kind of remuneration that is given by the
government to them. The inspectors responded that their remuneration is certainly not up to the
mark. The only motivation that drives them to serve is the amount of respect they get from the
concerned individuals especially the factory owners and the workers. They feel that they're doing
something for the society and have a feeling of service embedded into their minds.
Inspectors were asked whether they require additional task force to make sure that visits
happen more efficiently and more frequently and a better check is kept upon the safety of the
workers? The inspectors responded that task force was not enough. The task force according to
them is only up to the extent of 20 to 30% of the required force. According to what they said, this
percentage should increase to at least 70% so that the efficiency of the entire department
increases and the safety of the worker becomes guaranteed to a greater extent.
The inspectors rely upon their previous experiences. They visit several factories. Various
discrepancies and their effects are noted. The inspectors responded that there are several
incidences where it is found that a particular provision does not exist in the law, but it is essential
to make sure that a particular change in infrastructure or the safety provision must be brought
about so that the workers do not face the danger while working in a particular situation. Such
suggestions are given by them even though it is not mentioned in the law.