Embed Size (px)
Citation preview
Word-Synchronous Linear Optical Sampling of 40 Gb/s QPSK Signals
T. Dennis, P. A. Williams, I. Coddington, and N.R. Newbury
National Institute of Standards and Technology, 325 Broadway, Boulder, CO 80305 USA [email protected]
Abstract: We demonstrate word-synchronous measurements of QPSK format 40 Gb/s PRBS signals using linear optical sampling with a precision time-base, which allows us to average waveforms and distinguish between signal distortion and noise in eye diagrams. OCIS codes: (060:2330) Fiber optics communications; (320:7100) Ultrafast measurements Work of an agency of the US government; not subject to copyright.
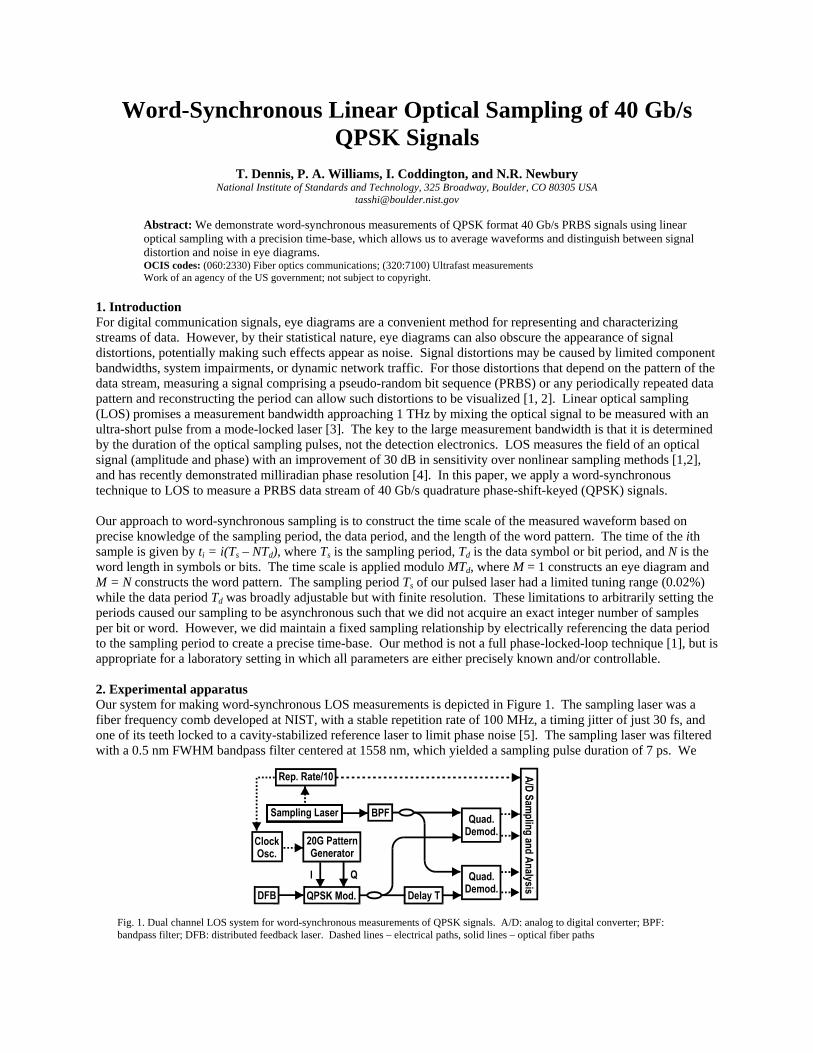
1. Introduction For digital communication signals, eye diagrams are a convenient method for representing and characterizing streams of data. However, by their statistical nature, eye diagrams can also obscure the appearance of signal distortions, potentially making such effects appear as noise. Signal distortions may be caused by limited component bandwidths, system impairments, or dynamic network traffic. For those distortions that depend on the pattern of the data stream, measuring a signal comprising a pseudo-random bit sequence (PRBS) or any periodically repeated data pattern and reconstructing the period can allow such distortions to be visualized [1, 2]. Linear optical sampling (LOS) promises a measurement bandwidth approaching 1 THz by mixing the optical signal to be measured with an ultra-short pulse from a mode-locked laser [3]. The key to the large measurement bandwidth is that it is determined by the duration of the optical sampling pulses, not the detection electronics. LOS measures the field of an optical signal (amplitude and phase) with an improvement of 30 dB in sensitivity over nonlinear sampling methods [1,2], and has recently demonstrated milliradian phase resolution [4]. In this paper, we apply a word-synchronous technique to LOS to measure a PRBS data stream of 40 Gb/s quadrature phase-shift-keyed (QPSK) signals. Our approach to word-synchronous sampling is to construct the time scale of the measured waveform based on precise knowledge of the sampling period, the data period, and the length of the word pattern. The time of the ith sample is given by ti = i(Ts – NTd), where Ts is the sampling period, Td is the data symbol or bit period, and N is the word length in symbols or bits. The time scale is applied modulo MTd, where M = 1 constructs an eye diagram and M = N constructs the word pattern. The sampling period Ts of our pulsed laser had a limited tuning range (0.02%) while the data period Td was broadly adjustable but with finite resolution. These limitations to arbitrarily setting the periods caused our sampling to be asynchronous such that we did not acquire an exact integer number of samples per bit or word. However, we did maintain a fixed sampling relationship by electrically referencing the data period to the sampling period to create a precise time-base. Our method is not a full phase-locked-loop technique [1], but is appropriate for a laboratory setting in which all parameters are either precisely known and/or controllable. 2. Experimental apparatus Our system for making word-synchronous LOS measurements is depicted in Figure 1. The sampling laser was a fiber frequency comb developed at NIST, with a stable repetition rate of 100 MHz, a timing jitter of just 30 fs, and one of its teeth locked to a cavity-stabilized reference laser to limit phase noise [5]. The sampling laser was filtered with a 0.5 nm FWHM bandpass filter centered at 1558 nm, which yielded a sampling pulse duration of 7 ps. We
Fig. 1. Dual channel LOS system for word-synchronous measurements of QPSK signals. A/D: analog to digital converter; BPF: bandpass filter; DFB: distributed feedback laser. Dashed lines – electrical paths, solid lines – optical fiber paths
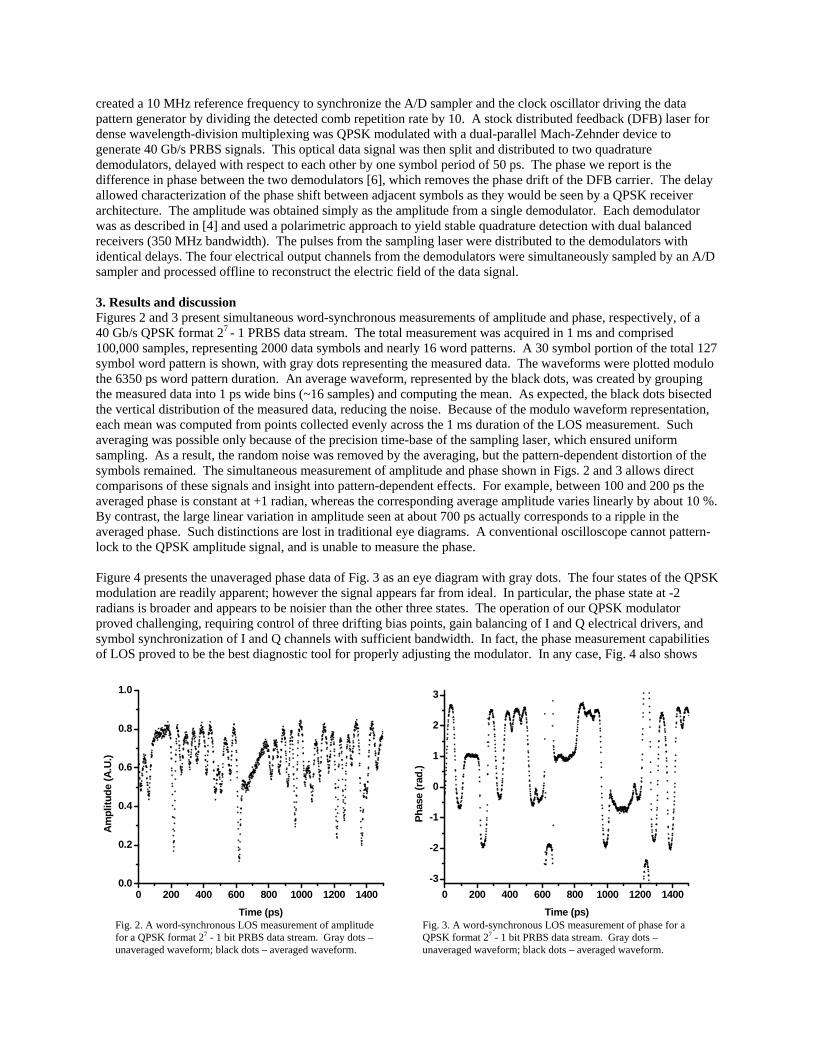
created a 10 MHz reference frequency to synchronize the A/D sampler and the clock oscillator driving the data pattern generator by dividing the detected comb repetition rate by 10. A stock distributed feedback (DFB) laser for dense wavelength-division multiplexing was QPSK modulated with a dual-parallel Mach-Zehnder device to generate 40 Gb/s PRBS signals. This optical data signal was then split and distributed to two quadrature demodulators, delayed with respect to each other by one symbol period of 50 ps. The phase we report is the difference in phase between the two demodulators [6], which removes the phase drift of the DFB carrier. The delay allowed characterization of the phase shift between adjacent symbols as they would be seen by a QPSK receiver architecture. The amplitude was obtained simply as the amplitude from a single demodulator. Each demodulator was as described in [4] and used a polarimetric approach to yield stable quadrature detection with dual balanced receivers (350 MHz bandwidth). The pulses from the sampling laser were distributed to the demodulators with identical delays. The four electrical output channels from the demodulators were simultaneously sampled by an A/D sampler and processed offline to reconstruct the electric field of the data signal. 3. Results and discussion Figures 2 and 3 present simultaneous word-synchronous measurements of amplitude and phase, respectively, of a 40 Gb/s QPSK format 27 - 1 PRBS data stream. The total measurement was acquired in 1 ms and comprised 100,000 samples, representing 2000 data symbols and nearly 16 word patterns. A 30 symbol portion of the total 127 symbol word pattern is shown, with gray dots representing the measured data. The waveforms were plotted modulo the 6350 ps word pattern duration. An average waveform, represented by the black dots, was created by grouping the measured data into 1 ps wide bins (~16 samples) and computing the mean. As expected, the black dots bisected the vertical distribution of the measured data, reducing the noise. Because of the modulo waveform representation, each mean was computed from points collected evenly across the 1 ms duration of the LOS measurement. Such averaging was possible only because of the precision time-base of the sampling laser, which ensured uniform sampling. As a result, the random noise was removed by the averaging, but the pattern-dependent distortion of the symbols remained. The simultaneous measurement of amplitude and phase shown in Figs. 2 and 3 allows direct comparisons of these signals and insight into pattern-dependent effects. For example, between 100 and 200 ps the averaged phase is constant at +1 radian, whereas the corresponding average amplitude varies linearly by about 10 %. By contrast, the large linear variation in amplitude seen at about 700 ps actually corresponds to a ripple in the averaged phase. Such distinctions are lost in traditional eye diagrams. A conventional oscilloscope cannot pattern-lock to the QPSK amplitude signal, and is unable to measure the phase. Figure 4 presents the unaveraged phase data of Fig. 3 as an eye diagram with gray dots. The four states of the QPSK modulation are readily apparent; however the signal appears far from ideal. In particular, the phase state at -2 radians is broader and appears to be noisier than the other three states. The operation of our QPSK modulator proved challenging, requiring control of three drifting bias points, gain balancing of I and Q electrical drivers, and symbol synchronization of I and Q channels with sufficient bandwidth. In fact, the phase measurement capabilities of LOS proved to be the best diagnostic tool for properly adjusting the modulator. In any case, Fig. 4 also shows
Fig. 3. A word-synchronous LOS measurement of phase for a QPSK format 27 - 1 bit PRBS data stream. Gray dots – unaveraged waveform; black dots – averaged waveform.
0 200 400 600 800 1000 1200 1400-3
-2
-1
0
1
2
3
Phas
e (r
ad.)
Time (ps)0 200 400 600 800 1000 1200 1400
0.0
0.2
0.4
0.6
0.8
1.0
Ampl
itude
(A.U
.)
Time (ps)Fig. 2. A word-synchronous LOS measurement of amplitude for a QPSK format 27 - 1 bit PRBS data stream. Gray dots – unaveraged waveform; black dots – averaged waveform.
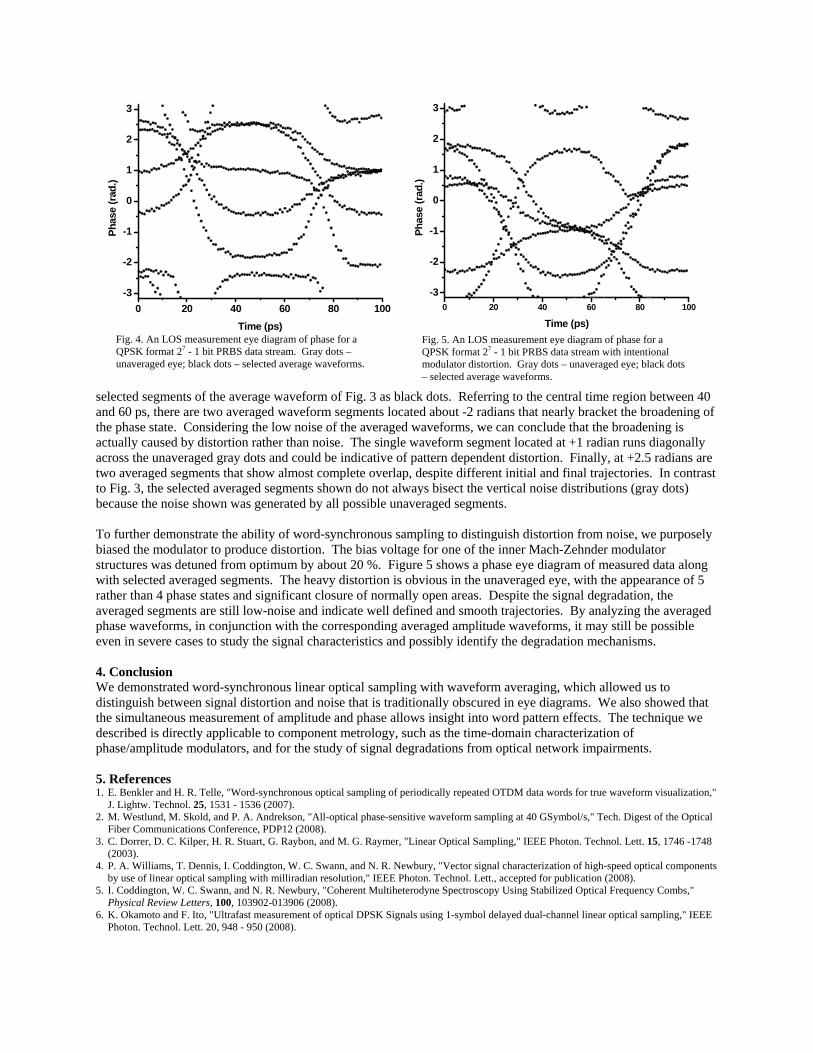
selected segments of the average waveform of Fig. 3 as black dots. Referring to the central time region between 40 and 60 ps, there are two averaged waveform segments located about -2 radians that nearly bracket the broadening of the phase state. Considering the low noise of the averaged waveforms, we can conclude that the broadening is actually caused by distortion rather than noise. The single waveform segment located at +1 radian runs diagonally across the unaveraged gray dots and could be indicative of pattern dependent distortion. Finally, at +2.5 radians are two averaged segments that show almost complete overlap, despite different initial and final trajectories. In contrast to Fig. 3, the selected averaged segments shown do not always bisect the vertical noise distributions (gray dots) because the noise shown was generated by all possible unaveraged segments. To further demonstrate the ability of word-synchronous sampling to distinguish distortion from noise, we purposely biased the modulator to produce distortion. The bias voltage for one of the inner Mach-Zehnder modulator structures was detuned from optimum by about 20 %. Figure 5 shows a phase eye diagram of measured data along with selected averaged segments. The heavy distortion is obvious in the unaveraged eye, with the appearance of 5 rather than 4 phase states and significant closure of normally open areas. Despite the signal degradation, the averaged segments are still low-noise and indicate well defined and smooth trajectories. By analyzing the averaged phase waveforms, in conjunction with the corresponding averaged amplitude waveforms, it may still be possible even in severe cases to study the signal characteristics and possibly identify the degradation mechanisms. 4. Conclusion We demonstrated word-synchronous linear optical sampling with waveform averaging, which allowed us to distinguish between signal distortion and noise that is traditionally obscured in eye diagrams. We also showed that the simultaneous measurement of amplitude and phase allows insight into word pattern effects. The technique we described is directly applicable to component metrology, such as the time-domain characterization of phase/amplitude modulators, and for the study of signal degradations from optical network impairments. 5. References 1. E. Benkler and H. R. Telle, "Word-synchronous optical sampling of periodically repeated OTDM data words for true waveform visualization,"
J. Lightw. Technol. 25, 1531 - 1536 (2007). 2. M. Westlund, M. Skold, and P. A. Andrekson, "All-optical phase-sensitive waveform sampling at 40 GSymbol/s," Tech. Digest of the Optical
Fiber Communications Conference, PDP12 (2008). 3. C. Dorrer, D. C. Kilper, H. R. Stuart, G. Raybon, and M. G. Raymer, "Linear Optical Sampling," IEEE Photon. Technol. Lett. 15, 1746 -1748
(2003). 4. P. A. Williams, T. Dennis, I. Coddington, W. C. Swann, and N. R. Newbury, "Vector signal characterization of high-speed optical components
by use of linear optical sampling with milliradian resolution," IEEE Photon. Technol. Lett., accepted for publication (2008). 5. I. Coddington, W. C. Swann, and N. R. Newbury, "Coherent Multiheterodyne Spectroscopy Using Stabilized Optical Frequency Combs,"
Physical Review Letters, 100, 103902-013906 (2008). 6. K. Okamoto and F. Ito, "Ultrafast measurement of optical DPSK Signals using 1-symbol delayed dual-channel linear optical sampling," IEEE
Photon. Technol. Lett. 20, 948 - 950 (2008).
Fig. 5. An LOS measurement eye diagram of phase for a QPSK format 27 - 1 bit PRBS data stream with intentional modulator distortion. Gray dots – unaveraged eye; black dots – selected average waveforms.
Fig. 4. An LOS measurement eye diagram of phase for a QPSK format 27 - 1 bit PRBS data stream. Gray dots – unaveraged eye; black dots – selected average waveforms.
0 20 40 60 80 100-3
-2
-1
0
1
2
3Ph
ase
(rad
.)
Time (ps)
0 20 40 60 80 100-3
-2
-1
0
1
2
3
Phas
e (r
ad.)
Time (ps)