Embed Size (px)
Citation preview

Work participation among youth and adolescents
( NSS lens)
Smt. Jeyalakshmi sekhar17 July 2014

Economic activity
• Any activity resulting in production of goods and services that add value to national product is considered an economic activity
• Production of all goods and services for market for pay or profit including those of Government services, production of primary commodities for own consumption and own account production of fixed assets are taken as Economic activities in NSS EU (employment unemployment) surveys.
• Processing of primary products for own consumption was not considered as economic activity in NSS surveys

Activity status
• Three broad activity statuses working (engaged in economic activity) Not engaged in economic activity (work) but seeking
work or available for work Not engaged in any economic activity and also not
available for work• First two together define labour force while the
last category is considered not in labour force.• First category is employed and second is
unemployed.

Decision on activity status• During reference period if more than one activity is obtained for a
person, the decided category is based on the major time criterion (In usual status approach) or priority criterion (current status approach)
• Usual activity status is the status during the 365 days preceding the date of the survey; determined on the basis of usual principal activity status (ps) and usual subsidiary activity status (ss) taken together. If the person does some economic activity for 30 days or more during last 365 days, he is considered a worker according to usual status approach
• Current status is current weekly and current daily status• Worked for at least 1 hour on any day during the 7 days preceding the
survey • Worked for at least 1 hour during the day for current daily status

workers• Persons engaged in any economic activity or who despite their
attachment to the economic activity , abstained themselves from work for reason of illness, injury or other physical disability, bad weather, festivals, social or religious functions or other contingencies necessitating temporary absence from work, constituted workers
• Unpaid household members who assisted in the operation of an economic activity in household farm or nonfarm activities were also considered as workers
• Workers were further categorised as self employed Codes 11,12,21), regular wage/ salaried employee(code 31) and casual labour(41). These are the codes applicable for usual status approach.
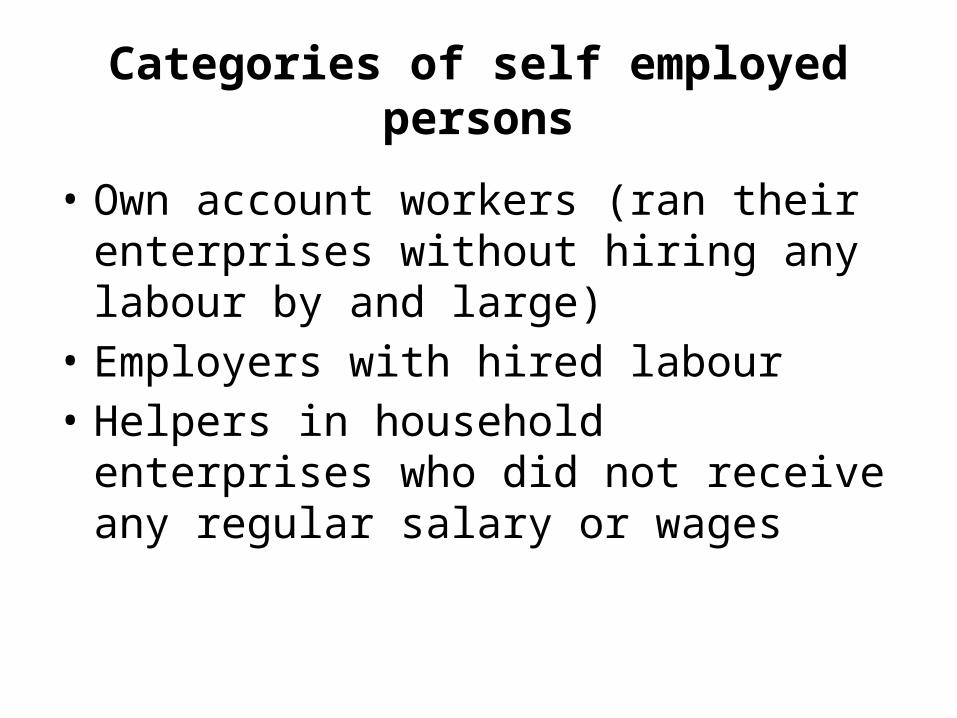
Categories of self employed persons
• Own account workers (ran their enterprises without hiring any labour by and large)
• Employers with hired labour• Helpers in household enterprises who did not
receive any regular salary or wages

Classification followed
• To record industry of work, 5 digit classification of National Industrial Classification 2008 was used.
• To record type of occupation, 3 digit classification of National Classification of occupations 2004 was used.
• To identify certain category of workers under Division 97 of NIC (Activities of households as employers of domestic personnel), additional codes were used such as housemaid/ servant (97001), cook (97002) etc

Key Indicators
• Labour force participation rate(LFPR) = [ ( no of employed+ no of unemployed ) / total population] * 1000
• Worker population ratio (WPR) =no of employed persons/ total population
• Proportion of unemployed (PU) = ( no of unemployed persons/ total population ) * 1000
• Unemployment rate (UR) =[ no of unemployed persons/ (no of employed + unemployed persons) ] *1000

WPR (ps+ss) – male, female
• We will understand the trend of WPR according to usual status(ps+ss) .
• Data are based on the 68 th round of NSS EUS the reference period being july 2011-june2012.
• WPR for persons = 386 per 1000• WPR for female = 219• WPR for male = 544• Only 22% of women are workers while 54% of men are
workers . Gender differentials in WPR are highly pronounced, considering that almost equal no of men and women constitute the population.
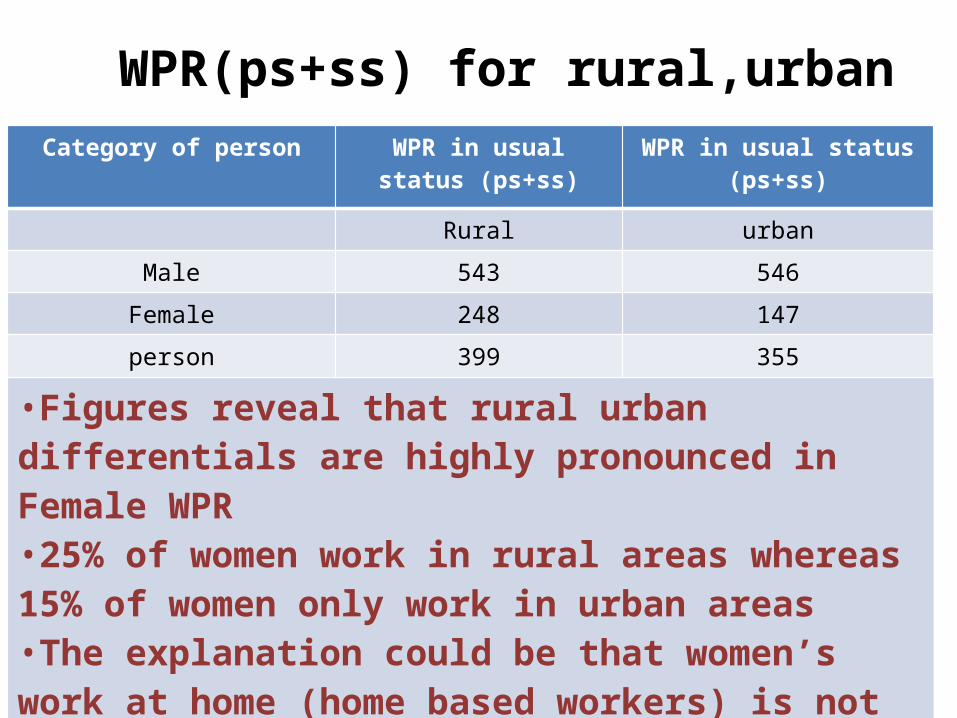
WPR(ps+ss) for rural,urbanCategory of person WPR in usual status
(ps+ss)WPR in usual status (ps+ss)
Rural urban
Male 543 546
Female 248 147
person 399 355
•Figures reveal that rural urban differentials are highly pronounced in Female WPR •25% of women work in rural areas whereas 15% of women only work in urban areas•The explanation could be that women’s work at home (home based workers) is not fully accounted for. The respondent may not reveal the information unless deeply probed

WPR(ps+ss) trend over the years61 (2004-05) 66 (2009-10) 68 (2011-12)
RURAL
MALE 546 547 543
FEMALE 327 261 248
PERSON 439 408 399
Urban
Male 549 543 546
Female 166 138 147
Person 365 350 355
Rural+urban
Male 547 546 544
Female 287 228 219
person 420 392 386
There is a declining trend in Female WPR over the years while the male WPR remains almost at the same level

male female2004-05 546 3272009-10 547 2612011-12 543 248
0
100
200
300
400
500
600
2004-05 2009-10 2011-12
male
female
RURAL

male female2004-05 549 1662009-10 543 1382011-12 546 147
0
100
200
300
400
500
600
2004-05 2009-10 2011-12
male
female
URBAN

Trend in Age specific WPR (ps+ss) Rural
10-14 years 15-19 years 20-24 years All (0+)
male female male female male female male female
1999-2000 91 96 503 304 844 409 531 299
2004-2005 68 74 497 319 849 410 546 327
2009-2010 44 35 358 186 768 295 547 261
2011-2012 26 28 303 156 742 278 543 248
WPR (ps+ss) for the adolescent and youth groups are showing a declining trend in rural areas for both male and female

RURAL MALE
10-14 yrs 15-19 yrs 20-24 yrs1999-2000 91 503 8442004-05 68 497 8492009-10 44 358 7682011-12 26 303 742
0
200
400
600
800
1000
1200
1400
1600
1999-2000 2004-05 2009-10 2011-12
20-24 yrs
15-19 yrs
10-14 yrs

RURAL FEMALE10-14 yrs 15-19 yrs 20-24 yrs
1999-2000 96 304 4092004-05 74 319 4102009-10 35 186 2952011-12 28 156 278
0
100
200
300
400
500
600
700
800
900
1999-2000 2004-05 2009-10 2011-12
20-24 yrs
15-19 yrs
10-14 yrs

Trend in Age specific WPR (ps+ss) urban
10-14 years 15-19 years 20-24 years All (0 +)
male female male female male female male female
1999-2000 49 36 314 105 658 155 518 139
2004-2005 48 33 335 128 684 201 549 166
2009-2010 28 12 231 76 617 160 543 138
2011-2012 33 9 223 78 594 160 546 147
WPR (ps+ss) for the adolescent and youth groups are showing a declining trend in urban areas also for both male and female. This may be an indication for the fact that the adolescents and youth are proceeding for higher studies to increase their qualifications for job market.

Trend urban male10-14 yrs 15-19 yrs 20-24 yrs
1999-2000 49 314 6582004-2005 48 335 6842009-2010 28 231 6172011-2012 33 223 594
0
200
400
600
800
1000
1200
1999-2000 2004-2005 2009-2010 2011-2012
20-24 yrs
15-19 yrs
10-14 yrs

Trend Urban Female10-14yrs 15-19yrs 20-24 yrs
1999-2000 36 105 1552004-2005 33 128 2012009-2010 12 76 1602011-2012 9 78 160
0
50
100
150
200
250
300
350
400
1999-2000 2004-2005 2009-2010 2011-2012
20-24 yrs
15-19yrs
10-14yrs

Age specific WPR (ps+ss) Rural Male 2011-12 by States/UTs
10-14 years 15-19 years 20-24 years All (0+)
male female male female male female male female
All India 26 28 303 156 742 278 543 248
States/uts above national average for the age group
10-14 years: rural male – Gujarat(47),Jharkhand(76),Karnataka(35),Maharashtra(36),Punjab(30), UP((42), WB(33)15-19 years: rural male-Gujarat(353),Jharkhand(384),Karnataka(311),MP(374),Mizoram(434), Odisha(400),Punjab(303),Tnadu(283) UP(381),WB(360),Andaman(358),Lakshadweep(318)20-24 years:rural male-Chattisgarh(855),Gujarat(887),Karna(767)MP(807),Mizoram(817),odisha(836), Punjab(757), Rajasthan(751), Sikkim(875),UP(800),WB(806),Chandigarh(850),Daman&Diu(946)
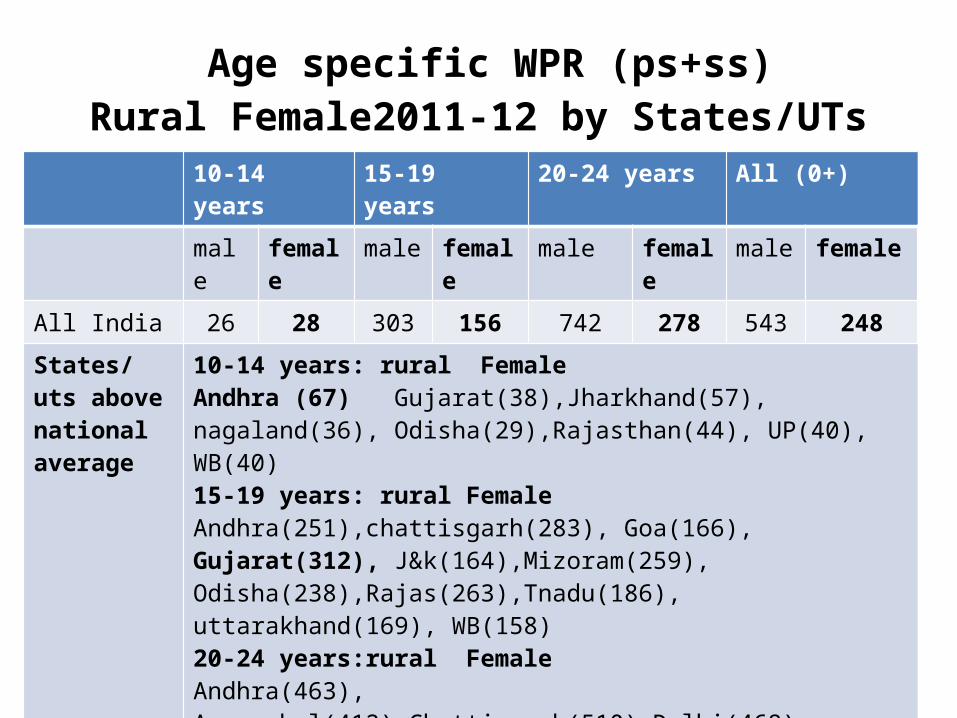
Age specific WPR (ps+ss) Rural Female2011-12 by States/UTs
10-14 years 15-19 years 20-24 years All (0+)
male female male female male female male female
All India 26 28 303 156 742 278 543 248
States/uts above national average
10-14 years: rural Female Andhra (67) Gujarat(38),Jharkhand(57), nagaland(36), Odisha(29),Rajasthan(44), UP(40), WB(40)15-19 years: rural FemaleAndhra(251),chattisgarh(283), Goa(166), Gujarat(312), J&k(164),Mizoram(259), Odisha(238),Rajas(263),Tnadu(186), uttarakhand(169), WB(158)20-24 years:rural FemaleAndhra(463), Arunachal(412),Chattisgarh(510),Delhi(468), Goa(520),Guj(363),HP(557),J&K(379),Karna(299),MP(339),maha(405), manipur(379),Meghalaya(458),Mizoram(657), Nagaland(346) ,Odisha(320),Punjab(281), Rajas(454), Sikkim(596), Tnadu(386), Uttarakhand(351), Andaman(368)

Age specific WPR (ps+ss) urban male 2011-12 by States/UTs
10-14 years 15-19 years 20-24 years All (0+)
male female male female male female male femaleAll India 33 9 223 78 594 160 546 147States/uts above national average
10-14 years: urban male – Odisha(55), UP(60), WB(199)15-19 years: urban male-Chattisgarh(248),Gujarat(302),HP(279), Odisha(278),Punjab(268),Rajasthan(234),UP(337),WB(332),Dadra nagar haveli(253)20-24 years:urban male-Guj(747),HP(688),Kerala(627),Punjab(646), Rajas(603), Sikkim(839),Tnadu(608),Uttarakhand(640),UP(627),WB(642),Andaman(804),Dadra(650),Daman&diu(984)

Age specific WPR (ps+ss) urban Female2011-12 by States/UTs
10-14 years 15-19 years 20-24 years All (0+)
male female male female male female male female
All India 33 9 223 78 594 160 546 147
States/uts above national average
10-14 years: urban Female Chattisgarh(12), Gujarat(17),Jharkhand(25), Odisha (24), Punjab(15),Rajasthan(10),Sikkim(51) ,UP(24), WB(27),Chandigarh(12)15-19 years: urban Female Gujarat(102),Maharashtra(83),Meghalaya(80) ,Mizoram(88), Rajasthan(112),UP(120), WB(108)20-24 years:urban FemaleChattisgarh(289),Delhi(181), Goa(289),J&K(174),Karna(172),Maha(182), Manipur(189),Mizoram(261),Odisha(201), Sikkim(196), Tnadu(242), Andaman(328),Daman&diu(249),Puducherry(193)
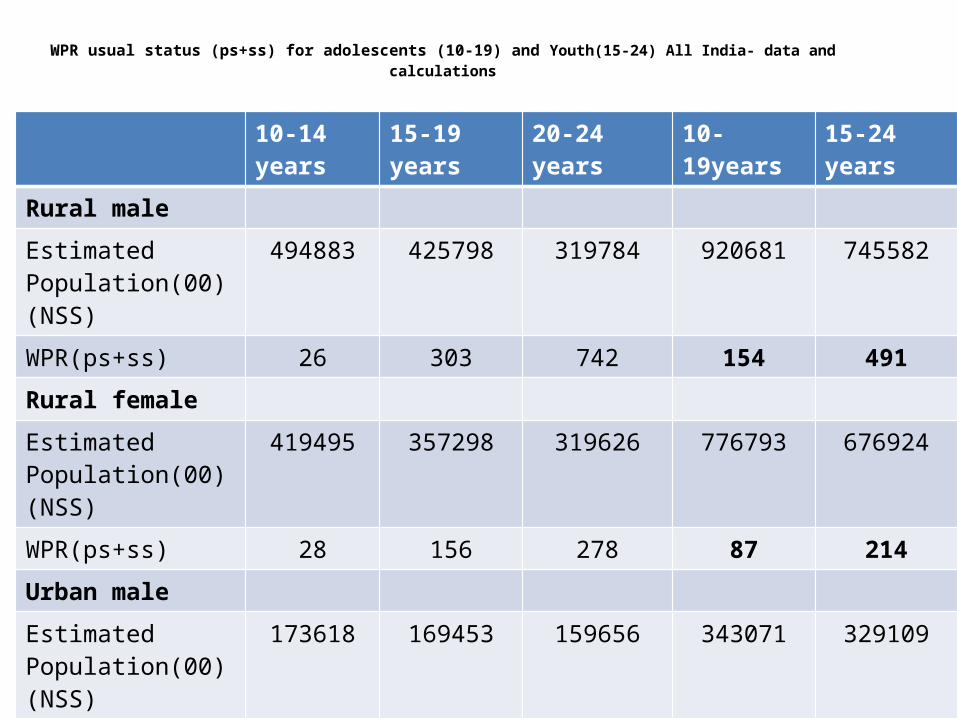
WPR usual status (ps+ss) for adolescents (10-19) and Youth(15-24) All India- data and calculations
10-14 years 15-19 years 20-24 years 10-19years 15-24 years
Rural male
Estimated Population(00) (NSS)
494883 425798 319784 920681 745582
WPR(ps+ss) 26 303 742 154 491
Rural female
Estimated Population(00) (NSS)
419495 357298 319626 776793 676924
WPR(ps+ss) 28 156 278 87 214
Urban male
Estimated Population(00) (NSS)
173618 169453 159656 343071 329109
WPR(ps+ss) 33 223 594 127 403
Urban female
Estimated Population(00) (NSS)
142425 137274 149466 279699 286740
WPR(ps+ss) 9 78 160 43 121
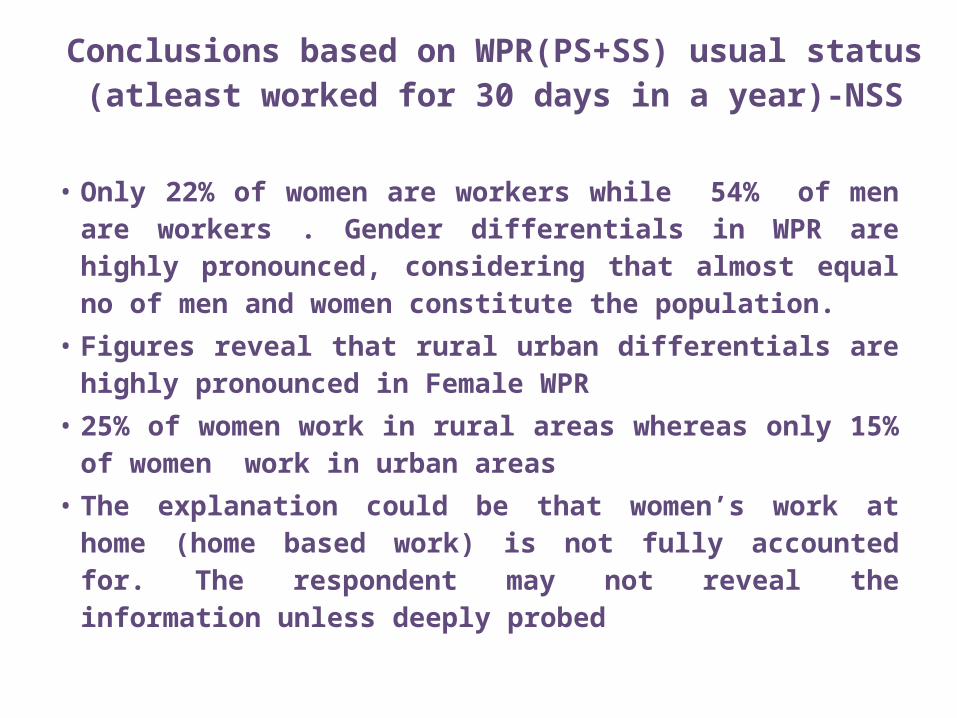
Conclusions based on WPR(PS+SS) usual status (atleast worked for 30 days in a year)-NSS
• Only 22% of women are workers while 54% of men are workers . Gender differentials in WPR are highly pronounced, considering that almost equal no of men and women constitute the population.
• Figures reveal that rural urban differentials are highly pronounced in Female WPR
• 25% of women work in rural areas whereas only 15% of women work in urban areas
• The explanation could be that women’s work at home (home based work) is not fully accounted for. The respondent may not reveal the information unless deeply probed
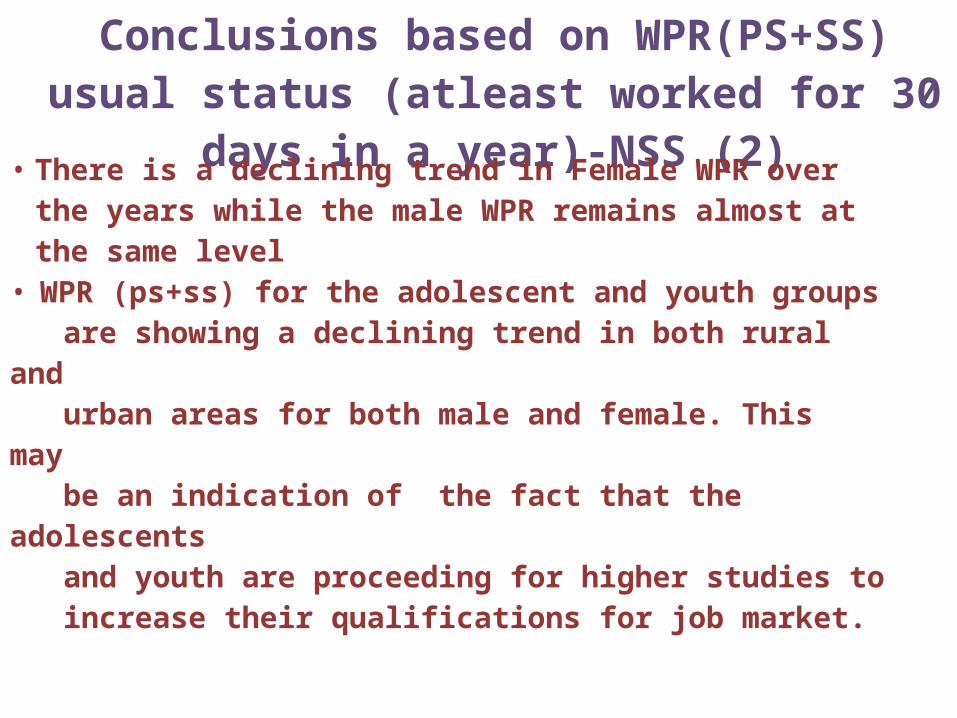
Conclusions based on WPR(PS+SS) usual status (atleast worked for 30 days in a year)-NSS (2)
• There is a declining trend in Female WPR over the years while the male WPR remains almost at the same level
• WPR (ps+ss) for the adolescent and youth groups are showing a declining trend in both rural and urban areas for both male and female. This may be an indication of the fact that the adolescents and youth are proceeding for higher studies to increase their qualifications for job market.

Conclusions based on WPR(PS+SS) usual status (atleast worked for 30 days in a year)-NSS (3)
• For rural males age group 10-14 years, the WPR is highest in Jharkhand(76) and lowest in all UTs and HP(0).
• For rural males age group 15-19 years, the WPR is highest in Mizoram(434) and lowest in Chandigarh(0), Daman and Diu(0), Delhi stands at 8.
• For rural males age group 20-24 years, the WPR is highest in Daman and Diu(946) followed by Gujarat(887) and lowest in Manipur(409)

Conclusions based on WPR(PS+SS) usual status (atleast worked for 30 days in a year)-NSS (4)
• For rural Females age group 10-14 years, the WPR is highest in Andhra Pradesh(67) and lowest in all UTs, Delhi, Goa, Haryana, Kerala,Meghalaya, Mizoram and Tripura(0)
• For rural Females age group 15-19 years, the WPR is highest in Gujarat(312) and lowest in Delhi, Daman and Diu and lakshadweep(0).
• For rural Females age group 20-24 years, the WPR is highest in Mizoram(657) and lowest in Bihar(36)
Conclusions based on WPR(PS+SS) usual status (atleast worked for 30 days in a year)-NSS (5)
• For urban males age group 10-14 years, the WPR is highest in West Bengal(199) and lowest in all UTs and Arunachal Pradesh,Goa, HP, Manipur, Mizoram, Nagaland and Sikkim(0)
• For urban males age group 15-19 years, the WPR is highest in UP(337) and lowest in Arunachal Pradesh(6).
• For urban males age group 20-24 years, the WPR is highest in Daman and Diu(984) and lowest in Nagaland(138)

Conclusions based on WPR(PS+SS) usual status (atleast worked for 30 days in a year)-NSS (6)
• For urban Females age group 10-14 years, the WPR is highest in Sikkim(51) and lowest in Assam, Delhi, Goa,Haryana,HP,Karnataka,Kerala,Maharashtra,Meghalaya,Mizoram,Nagaland,Tripura,Uttarakhand,Andaman and Nicobar,Dadra And Nagar Haveli, Lakshadweep and Puducherry(0)
• For Urban Females age group 15-19 years, the WPR is highest in UP(120) and lowest in Goa(0) followed by Bihar(1).
• For urban Females age group 20-24 years, the WPR is highest in Andaman and nicobar(328) and lowest in Assam(45).

Conclusions based on WPR(PS+SS) usual status (atleast worked for 30 days in a year)-NSS (7)
2011-12 Rural male Urban male Rural female
Urban female
Adolescents(10-19)
154 127 87 43
Youth(15-24) 491 403 214 121
It can be concluded that the work participation rate of youth is roughly 3 times more than that of adolescents irrespective of rural or urban and male or female.For both adolescents and youth, Female participation rates are roughly 50% of male rates in rural areas while it is roughly 1/3rd of male rates in urban areas.

Thank you