Embed Size (px)
Citation preview
The South Africa I know, the home I understand
Work Programme2015/16
For further information contact:Celia de KlerkTel: 012 310 8454Strategy Office
Statistics South AfricaPrivate Bag X44Pretoria 0001South Africa
170 Thabo Sehume StreetPretoria0002
User information service: 012 310 8600Fax: 012 310 8500Main switchboard: 012 310 8911Fax: 012 321 7381
Website: www.statssa.gov.zaEmail: [email protected]
Work Programme 2015/16
Statistics South Africa, 2015
Pali Lehohla, Statistician-Geneneral

Work Programme 2015/16 Statistics South Africa Published by Statistics South Africa, Private Bag X44, Pretoria 0001 © Statistics South Africa, 2015 Users may apply or process this data, provided Statistics South Africa (Stats SA) is acknowledged as the original source of the data; that it is specified that the application and/or analysis is the result of the user's independent processing of the data; and that neither the basic data nor any reprocessed version or application thereof may be sold or offered for sale in any form whatsoever without prior permission from Stats SA. Stats SA Library Cataloguing-in-Publication (CIP) Data Work Programme 2015/16 - Statistics South Africa. Pretoria: Statistics South Africa, 2015 RP117/2015 281 pp ISBN: 978-0-621-43497-2 A complete set of Stats SA publications is available at Stats SA Library and the following libraries:
National Library of South Africa, Pretoria Division National Library of South Africa, Cape Town Division Library of Parliament, Cape Town Bloemfontein Public Library Natal Society Library, Pietermaritzburg Johannesburg Public Library Eastern Cape Library Services, King William's Town Central Regional Library, Polokwane Central Reference Library, Nelspruit Central Reference Collection, Kimberley Central Reference Library, Mmabatho
This report is available on the Stats SA website: www.statssa.gov.za Copies are obtainable from: Printing and Distribution, Statistics South Africa Tel: (012) 310 8093 (012) 310 8619 (012) 310 8161 Fax: (012) 321 7381 Email: [email protected] [email protected]
Contents
Official sign-off 1
Foreword: Minister 2
Foreword: Chairperson of the Statistics Council 3
Introduction: the Statistician-General 4
1. Strategic overview 7
2. Programme and subprogramme plans 21
2.1 Programme 1: Administration 22
2.2 Programme 2: Economic Statistics 28
2.3 Programme 3: Population and Social Statistics 33
2.4 Programme 4: Methodology, Standards and Research 39
2.5 Programme 5: Statistical Support and Informatics 44
2.6 Programme 6: Statistical Collection and Outreach 49
2.7 Programme 7: Survey Operations 54
3. Annual Performance Plan 62
3.1 Strategic Outcome 1: An informed nation 63
3.2 Strategic Outcome 2: Trusted statistics 120
3.3 Strategic Outcome 3: Partners in statistics 152
3.4 Strategic Outcome 4: Capable organisation 174
3.5 Strategic Outcome 5: Statistical leadership 202
3.6 Provincial and district offices: Sustainable and responsive statistical infrastructure 217
4. Stakeholders and the environment 241
4.1 Statistics Council 242
4.2 Stakeholders and their needs 242
4.3 Service delivery improvement plan 244
4.4 Resource management plan 246
4.5 Long-term infrastructure plans 248
Annexures:
1. Strategy in brief 252
2. African Charter on Statistics 255
3. Fundamental principles of official statistics 258
4. Organisational structure 259
5. Planning, monitoring and reporting 261
6. Strategy map 262
7. Summary of publications 263
8. List of abbreviations and acronyms 265
9. Statistics Act 270
The South Africa I know, the home I understand
1
Official sign-off
It is hereby certified that this Work Programme for 2015/16: • Was developed by the Management of Statistics South Africa reporting to the Minister in the Presidency, Mr Jeff Radebe; • Was prepared in line with the current Strategic Plan of Statistics South Africa; and • Accurately reflects the performance targets which Statistics South Africa will endeavour to achieve, given the resources made available in
the budget for 2015/16. Mr B Mathunjwa Chief Financial Officer Ms C de Klerk Executive Manager: Strategic Planning Mr P Lehohla Statistician-General Mr JT Radebe Executive Authority

The South Africa I know, the home I understand
2
Foreword: Minister The National Development Plan (NDP), our programme for addressing the triple challenge of poverty, inequality and unemployment, is best served by a credible and robust statistical system. The Work Programme for Statistics South Africa that I submit to Parliament for consideration and approval, holds the promise to deliver the crucial evidential base for our political decisions. This Work Programme embraces the NDP and takes important note of the historic Post-2015 Agenda, and enables us to be part of this global remit of implementing and delivering on the Sustainable Development Goals as part of the global community. The Work Programme focuses on four deliverables that ensure a sustained transformative agenda for our information base. A critical leg of this is legislative reform that focuses on revamping the current Statistics Act (Act No. 6 of 1999) by embracing geography as an explicit strategic driver of change amongst five other areas. The Work Programme demonstrates that the transformative agenda for statistics is afoot as the implementation of the National Statistics System gains practical meaning with the three sides of the gross domestic product (GDP) now residing under one roof. Stats SA will finally be producing the expenditure side of the GDP which used to be done by the South African Reserve Bank (SARB), and we thank SARB for having done the needful whilst Stats SA was building the necessary capability to execute its mandate. Stats SA will again be undertaking a major survey that informs the nation on service delivery, the size and composition of our population and a more granular picture of the nation. The Community Survey will be conducted next year February with results expected in June. Through this Work Programme Parliament, the people of South Africa and I are able to hold Statistics South Africa to account, and deliver they will. JT Radebe (MP) Minister in the Presidency: Planning, Monitoring and Evaluation

The South Africa I know, the home I understand
3
Foreword: Chairperson of Statistics Council The Work Programme for 2015/16 was considered in terms of section 5(1)(a) of the Statistics Act (Act No. 6 of 1999), which states that: ‘The minister must, on recommendation of the Statistician-General, prioritise the work programme of Statistics South Africa in accordance with the purpose of official statistics and the statistical principles contemplated in section 3 and both having been advised by the Statistics Council.’ This work programme advances the strengthening of the South African National Statistics System which was launched by the Minister in July 2014. The strengthening of the South African National Statistics System involves legislative changes to the governing act and the concomitant wide stakeholder consultation and advocacy processes as well as the ultimate drawing up of the National Strategy for the Development of Statistics. Council shall, in terms of Section 13(2) of the Act, embark on an advocacy programme and leverage the efforts of the Statistician-General in this regard, in order to optimise outcomes. During the period of this work programme, a second Community Survey is planned – the first survey was conducted in 2007. Council had noted the planned employment of innovation practices that will result in efficiency gains as well as improved quality of survey results. Furthermore, Statistics South Africa shall, during this period, for the first time in the history of this country, take over the management of the expenditure side of the GDP from the South African Reserve Bank. Council has been closely involved in the monitoring of the process of taking over this function and is sanguine that the project is progressing adequately. Council recommends that the Minster approves the Work Programme 2015/16 of Statistics South Africa. On behalf of Council I wish to thank the Minister for his guidance and leadership, the Statistician-General and his team at Statistics South Africa for their cooperation. MB Mphahlele Chairperson of the Statistics Council
The South Africa I know, the home I understand
4
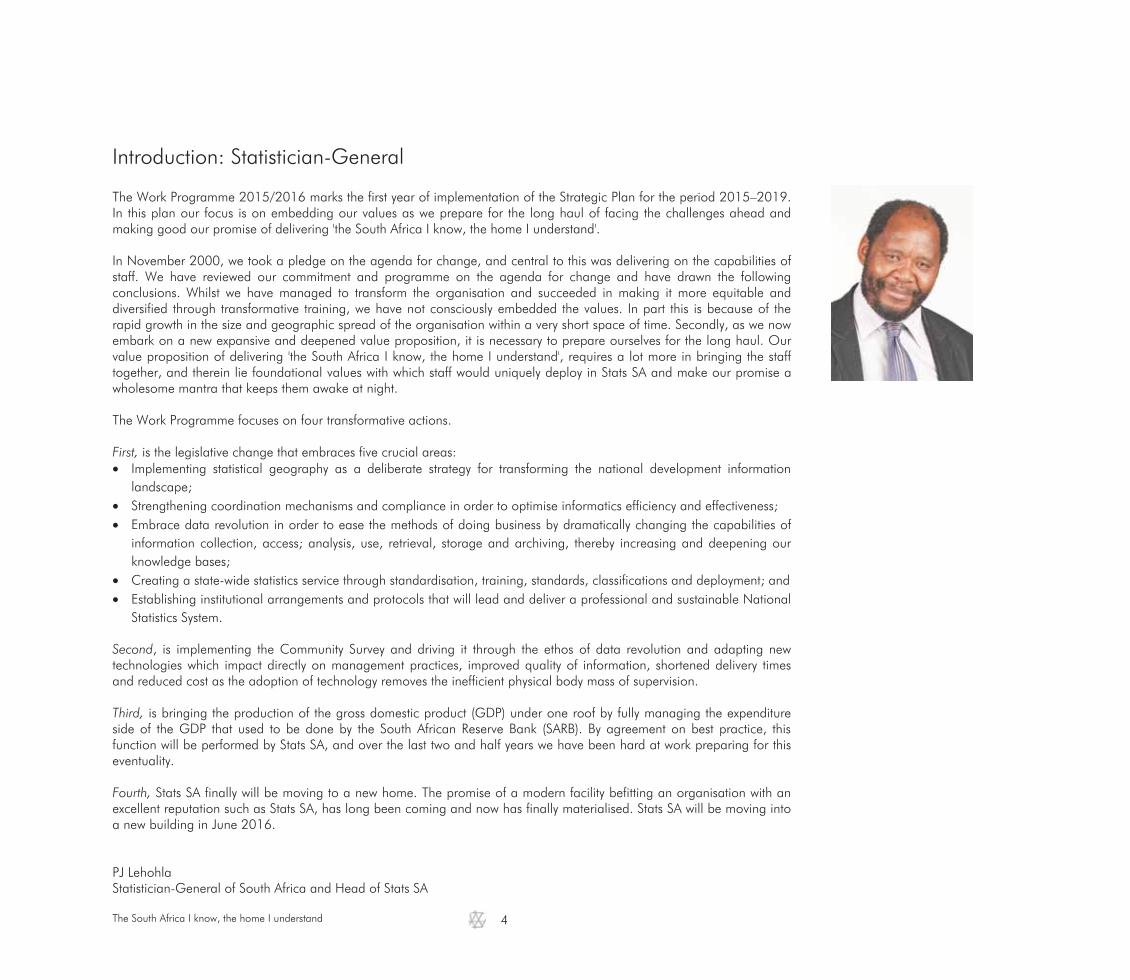
Introduction: Statistician-General The Work Programme 2015/2016 marks the first year of implementation of the Strategic Plan for the period 2015–2019. In this plan our focus is on embedding our values as we prepare for the long haul of facing the challenges ahead and making good our promise of delivering 'the South Africa I know, the home I understand'. In November 2000, we took a pledge on the agenda for change, and central to this was delivering on the capabilities of staff. We have reviewed our commitment and programme on the agenda for change and have drawn the following conclusions. Whilst we have managed to transform the organisation and succeeded in making it more equitable and diversified through transformative training, we have not consciously embedded the values. In part this is because of the rapid growth in the size and geographic spread of the organisation within a very short space of time. Secondly, as we now embark on a new expansive and deepened value proposition, it is necessary to prepare ourselves for the long haul. Our value proposition of delivering 'the South Africa I know, the home I understand', requires a lot more in bringing the staff together, and therein lie foundational values with which staff would uniquely deploy in Stats SA and make our promise a wholesome mantra that keeps them awake at night. The Work Programme focuses on four transformative actions. First, is the legislative change that embraces five crucial areas: Implementing statistical geography as a deliberate strategy for transforming the national development information
landscape; Strengthening coordination mechanisms and compliance in order to optimise informatics efficiency and effectiveness; Embrace data revolution in order to ease the methods of doing business by dramatically changing the capabilities of
information collection, access; analysis, use, retrieval, storage and archiving, thereby increasing and deepening our knowledge bases;
Creating a state-wide statistics service through standardisation, training, standards, classifications and deployment; and Establishing institutional arrangements and protocols that will lead and deliver a professional and sustainable National
Statistics System.
Second, is implementing the Community Survey and driving it through the ethos of data revolution and adapting new technologies which impact directly on management practices, improved quality of information, shortened delivery times and reduced cost as the adoption of technology removes the inefficient physical body mass of supervision. Third, is bringing the production of the gross domestic product (GDP) under one roof by fully managing the expenditure side of the GDP that used to be done by the South African Reserve Bank (SARB). By agreement on best practice, this function will be performed by Stats SA, and over the last two and half years we have been hard at work preparing for this eventuality. Fourth, Stats SA finally will be moving to a new home. The promise of a modern facility befitting an organisation with an excellent reputation such as Stats SA, has long been coming and now has finally materialised. Stats SA will be moving into a new building in June 2016. PJ Lehohla Statistician-General of South Africa and Head of Stats SA

The South Africa I know, the home I understand
5


Strategic overviewChapter 1

The South Africa I know, the home I understand
8
1. Strategic overview 1.1 Introduction
Statistics and official statistics in particular, are a sine qua non for rationality and the process by which deliberate choices are made. Better statistics, better information, lead to better decisions and better policy outcomes. Our long and short history is replete of evidence that such factual basis for decisions is sorely absent or, when present, it is in quantities that are far from adequate, and not able to be used appropriately. The thrust of the National Development Plan (NDP) and the policy documents that precede it (which include the Reconstruction and Development Programme (RDP), and Growth, Employment and Redistribution (GEAR) strategy, which was the macroeconomic framework to render the RDP implementable) point not only to a national vision, but also to the associated information required in making such a vision a reality. The biggest challenge that confronts policy and statistics, at least in the case of South Africa in large part, has been the relative inability of the statistics and information to be visible to those who implement policy, especially at the level of those who are directly responsible for implementation, namely the municipalities, schools, police and health – to mention a few but important examples. As we continue on the road map of the country's development, it is important to reflect and ask ourselves; are the policy and statistics domains known and understood by the society at large. As we move forward within the five-year chapter as encapsulated in the new organisational strategy (2015/16 – 2019/20) it is important to set a new platform for a better future in line with the National Development Plan 2030. The central tenet of our future is: "Statistics must be used for Transparency, Accountability, Results and Transformation". Critical focus will be placed on statistical coordination working together with other government departments, particularly with schools in relation to capacity building, and with municipalities to facilitate basic services at local level. This enormous task is going to be spearheaded by the South African National Statistics System (SANSS) and implemented within the policy framework on statistical production systems in South Africa.
1.2 A new strategic direction
Stats SA has crafted a new strategic direction for the period 2015/16–2019/20 in response to an ever-changing internal and external environment. We have crafted a strategy that responds to the information demand of the NDP, Medium Term Strategic Framework (MTSF) and other stakeholders. Below is an outline of the strategy.
Vision
To deliver: The South Africa I know, the home I understand
The South Africa I know, the home I understand
9
Mission
To lead and partner in statistical systems and products for evidence-based decisions
Values
Stats SA has reviewed its value proposition, and this is encapsulated in the Vision and Mission statement. We take it that this was a profound and coherent vision which is consistent with how data revolution is envisaged to influence the development agenda in the post 2015 period. The question then would be, are our lived and experienced values consistent with delivering ‘the South Africa I know, the Home I understand’? We have introspected on what this would mean. The aspired-for values are generally very generic; however, what is always important is how the staff and leadership of Stats SA embrace these and embed them as an ethos. In the main, the value system has been driven by an express desire for change and the adoption of the agenda for change in November 2000. This commitment with the five areas of focus ensured that driving change would be based on shared values that engender trust and link the organisation and its people together. These values have been reviewed. We now need to intensify and speed up their implementation by focusing on deliberate monitoring and evaluation. The core values below form the basis of our decision-making and our interactions with our stakeholders (both internal and external) and will influence the way in which we do our work: Integrity: We take accountability for the quality of information delivered by striving to deliver products and services in a transparent and
ethical way. We ensure that our products are fit for use and aligned to internationally recognised best practice; Empowering partnerships: We create opportunities for organisational and individual growth. We will treat each other with mutual
respect and harness diversity to advance organisational effectiveness. We foster partnerships to achieve better coordination and collaboration; and
Service excellence: We strive to deliver more products and services to satisfy customer needs through operational excellence and value
for money, and by continuously increasing our productivity through innovation.
Overall strategic goal and thrust
The overall strategic goal is to increase the supply and use of official and other quality statistics for transparency, accountability, results-based management and transformation through coordination, integration and innovation.
Strategic impact
The impact of the strategy is evidence-based development and transformation that will “improve the quality of life of all citizens”.
The South Africa I know, the home I understand
10
1.3 Strategic outcomes
Stats SA has defined five strategic outcomes to be achieved over the medium to long term. These outcomes are aligned to the development outcomes in the National Development Plan (NDP) and the Medium Term Strategic Framework (MTSF):
1.3.1 Strategic Outcome 1: An informed nation
Goal statement: By 2020, statistical products and services have been expanded to better meet planning, monitoring and evaluation, and policy needs through coordination, integration and innovation. Statistics is used by the nation and other stakeholders at large for knowledge, information and evidence-based decisions. We have increased stakeholder engagement to ensure that the statistical products and services are more responsive and relevant to their needs. Key indicators for success are:
A statistics production system capable of generating integrated indicators for use A geo-statistical platform providing superior geo-statistics outputs for planning, monitoring and evaluation An informatics web-enabled environment for a new breed of unified production and use (Pro-Users of statistics) Five administrative registers are used as complementary data sources Stakeholder satisfaction index (opinion on products, services and use)
Goal statement: By 2030, a statistical information system responds to the information demands of the NDP that informs development and transformation.
1.3.2 Strategic Outcome 2: Trusted statistics
Goal statement: By 2020, the statistics value chain is based on sound statistical quality principles in line with international standards and classifications that engender trust in our products. Key indicators for success are:
10% of statistical series are certified as official Five independent evaluations have been conducted Two international standards adopted and implemented Delighted users of statistical products
Goal statement: By 2030, users and the public are delighted and have confidence and trust in official statistics as it is common knowledge and practice that statistics produced in the National Statistical System (NSS) are based on statistical quality principles and international best practices.
The South Africa I know, the home I understand
11
1.3.3 Strategic Outcome 3: Partners in statistics
Goal statement: By 2020, Stats SA is leading statistical coordination in the country. Partners in the SANSS actively participate in statistical coordination structures, are establishing statistics units to improve the quality of statistics generated, and increase the use of statistics as evidence to inform policy processes. South Africa continues to guide and influence statistical development in the region, continent and the world. Key indicators for success are:
20%of municipalities are updating the spatial information frame through collaborative partnerships A geo-statistically enabled institution powered by informatics 5% of organs of state actively participate in the SANSS A National Strategy for the Development of Statistics has been compiled by 2017
Goal statement: By 2030, Stats SA is the statistical authority at the heart of the NSS. Collaborative partnerships and statistics units are established within organs of state under the statistical leadership of the Statistician-General. The production of statistics has now become part of the annual performance plans of organs of state and is used for decision-making by all to inform policy, planning, monitoring and evaluation.
1.3.4 Strategic Outcome 4: A capable organisation
Goal statement: By 2020, the amended legislative framework enables effective statistical coordination in South Africa. Stats SA will have sustained and improved its good governance practices and systems as evidenced by unqualified audit reports, and complemented by effective accountability practices. Key indicators for success are:
The amended Statistics Act has been passed by 2017 Unqualified audit reports (clean audits) 100% of household survey collections are technology-driven by 2020 Turnaround times to delivery of results are within six weeks of survey completion
Goal statement: By 2030, Stats SA is a top performing organ of state and an employer of choice. Technology drives an end-to-end robust statistical production system. Our governance and statistical systems are flexible, efficient and innovative, underpinned by sound governance and statistical methodologies.
The South Africa I know, the home I understand
12
1.3.5 Strategic Outcome 5: Statistical leadership
Goal statement: By 2020, we have re-skilled our staff for the new environment. We have invested in our schools and tertiary programmes to increase statistical skills at grass roots level. We have empowered municipalities in the production and use of statistics. Management and staff foster shared values. Key indicators for success are: 50 staff are empowered in policy research, integrative and spatial analysis 100% of fieldwork staff are re-skilled in the use of new technology Black African females at senior management level achieve equity
Goal statement: By 2030, we are a diverse, transformed and united organisation with the statistical capability to lead the national statistical system. The statistical literacy of citizens and statistical capability in the national statistics system have increased. School leavers are better equipped to understand statistical concepts and the application thereof in their daily lives. A new generation of statistical leaders has been grown to head statistical information systems in the NSS.
1.4 Situation analysis
The situation analysis for 2015/16 is captured in the Strategic Plan (2015/16 – 2019/20).
1.5 Key priorities for 2015/16
The following are the key priorities according to strategic outcomes. 1.5.1 Informed nation GDP expenditure approach Conducting a Community Survey
1.5.2 Trusted statistics Increasing use of statistical information (focus on municipalities and schools)
1.5.3 Partners in statistics Legislative reform Compiling a National Strategy for Development of Statistics
1.5.4 Capable organisation Move to the new building Driving a business modernisation programme

The South Africa I know, the home I understand
13
1.5.5 Statistical leadership Building statistical leadership capability Driving the agenda for change
1.6 Revisions to legislative and other mandates
Statistics South Africa is a national government department accountable to the Minister in the Presidency: Planning, Monitoring and Evaluation. The activities of the department are regulated by the Statistics Act (Act No. 6 of 1999), which mandates the department to advance the production, dissemination, use and coordination of official and other statistics to assist organs of state, businesses, other organisations and the public in planning, monitoring, and decision-making. The Act also requires that the department coordinate statistical production among organs of state in line with the purpose of official statistics and statistical principles. Stats SA has commenced with developing a policy framework to guide the production and coordination of statistical and spatial information in South Africa. Once adopted by Cabinet, the policy framework will have implications on statistical legislation. An amendment to the Statistics Act (Act No. 6 of 1999) will be proposed to the legislature to ensure that there is administrative and legislative consistency in accountability, as Stats SA was gazetted to be accountable to the Minister in the Presidency. Other amendments will include changing the execution of a population census from a five-yearly to a 10-yearly cycle.
1.7 Overview of 2015/16 budget and MTEF estimates
A prerequisite for implementing the current strategy of Stats SA is of progressively funding a growing organisation over a period of five years. The Work Programme therefore reflects targets and outputs that are affordable within the ENE allocation, but at variance with the Strategic Plan 2015/16 – 2019/20. Unfunded activities are outlined in the five-year strategy.

The South Africa I know, the home I understand
14
1.7.1 Expenditure trends
Vote expenditure trends by programme and economic classification Programmes 1. Administration 2. Economic Statistics 3. Population and Social Statistics 4. Methodology, Standards and Research 5. Statistical Support and Informatics 6. Statistical Collection and Outreach 7. Survey Operations Programme
Ann
ual b
udge
t
Adj
uste
d
appr
opri
atio
n
Aud
ited
ou
tcom
e
Ann
ual b
udge
t
Adj
uste
d
appr
opri
atio
n
Aud
ited
ou
tcom
e
Ann
ual b
udge
t
Adj
uste
d
appr
opri
atio
n
Aud
ited
ou
tcom
e
Ann
ual b
udge
t
Adj
uste
d
appr
opri
atio
n
Rev
ised
es
timat
e
Out
com
e/A
nnua
l bu
dget
ave
rage
(%
)
Out
com
e/A
djus
ted
ap
prop
riat
ion
av
erag
e (%
)
R million 2011/12 2012/13 2013/14 2014/15 2011/12 - 2014/15
Programme 1 414,5 413,4 411,6 444,5 452,0 461,4 487,1 530,8 554,2 934,7 914,4 780,6 96,8% 95,5% Programme 2 196,4 194,1 167,6 213,9 193,7 182,2 199,2 196,7 187,2 210,5 202,8 195,8 89,4% 93,1% Programme 3 121,8 102,6 94,3 122,0 111,7 102,3 111,8 109,6 102,1 117,9 150,0 168,3 98,6% 98,5% Programme 4 75,6 72,3 46,1 80,2 52,9 48,5 68,7 62,9 51,2 65,5 60,2 55,4 69,4% 81,0% Programme 5 195,1 192,6 199,6 200,3 211,2 202,9 223,8 218,7 210,7 245,1 235,6 213,0 95,6% 96,3% Programme 6 414,7 445,2 470,7 454,6 465,1 466,6 471,3 474,9 473,5 524,5 524,7 517,2 103,4% 100,9% Programme 7 1 822,9 2 309,9 2 284,5 206,0 275,0 297,9 175,9 148,0 149,6 144,3 154,9 154,9 122,9% 100,0%
Total 3 240,9 3 730,1 3 674,4 1 721,6 1 761,7 1 761,7 1 737,7 1 741,6 1 728,4 2 242,5 2 242,5 2 085,2 103,4% 97,6%
Current payments 3 188,8 3 596,6 3 526,6 1 677,5 1 707,6 1 632,9 1 697,1 1 692,0 1 676,1 1 767,7 1 763,8 1 742,3 103,0% 97,9%
Compensation of employees 1 531,0 1 361,6 1 232,8 1 201,2 1 107,1 1 074,9 1 159,5 1 103,3 1 080,1 1 231,7 1 216,8 1 183,8 89,2% 95,5% Goods and services 1 657,2 2 234,0 2 293,8 475,9 598,9 558,0 536,1 588,7 596,0 536,1 547,0 558,6 125,0% 100,9% of which: Communication 65,1 52,8 53,1 25,7 36,2 32,8 31,3 32,8 35,0 38,4 37,4 35,5 97,4% 98,1% Computer services 106,0 89,9 89,2 81,0 80,6 62,3 86,4 84,5 86,7 90,9 86,5 73,5 85,6% 91,3% Fleet services (including government motor transport)
– – 49,2 – 39,7 21,9 27,7 31,0 20,7 16,0 17,3 17,3 249,6% 124,0%
Operating leases 5,5 11,0 109,1 69,2 108,9 113,5 98,5 156,7 246,5 136,3 155,6 182,4 210,5% 150,8% Property payments 83,3 104,6 60,3 31,9 59,5 71,4 37,6 61,1 70,7 31,3 31,8 44,8 134,2% 96,1% Travel and subsistence 297,4 412,9 477,8 111,3 108,9 128,3 128,4 85,2 53,3 85,0 92,4 74,7 118,0% 105,0% Interest and rent on land 0,6 1,0 – 0,4 1,5 – 1,5 – – – – – 0,1% 0,1%
Transfers and subsidies 10,5 10,7 19,1 7,3 15,3 21,6 14,7 17,7 8,2 15,1 17,3 17,3 139,4% 108,5%
Departmental agencies and accounts
– – – – – – 0,1 0,1 – – – – 20,0% 20,0%
Higher education institutions – 0,5 1,0 1,0 8,3 8,0 8,8 8,8 1,5 8,8 8,8 8,8 103,5% 72,9% Foreign governments and international organisations
– – – – 0,7 0,7 – – – – – – – 100,0%
Public corporations and private enterprises
– – – – – – – – – – 2,2 2,2 – 100,0%
Non-profit institutions 0,1 0,1 – 1,1 1,2 0,1 0,2 0,2 0,2 0,3 0,3 0,3 35,6% 33,9% Households 10,4 10,1 18,1 5,2 5,1 12,8 5,5 8,6 6,5 6,0 6,0 6,0 160,8% 145,7%
Payments for capital assets 41,7 122,8 94,0 36,8 38,8 74,9 25,9 32,0 41,9 459,7 461,4 325,5 95,1% 81,9%
Buildings and other fixed structures
– – – – – – – – – 421,2 421,2 288,0 68,4% 68,4%
Machinery and equipment 35,1 116,1 91,5 28,8 19,6 57,3 24,4 28,5 41,9 33,9 35,6 32,9 183,0% 111,9% Software and other intangible assets
6,6 6,7 2,5 8,1 19,2 17,6 1,5 3,5 – 4,6 4,6 4,6 119,2% 72,6%
Payments for financial assets
– – 34,7 – – 32,3 – – 2,2 – – – – –
Total 3 240,9 3 730,1 3 674,4 1 721,6 1 761,7 1 761,7 1 737,7 1 741,6 1 728,4 2 242,5 2 242,5 2 085,2 103,4% 97,6%
The South Africa I know, the home I understand
15
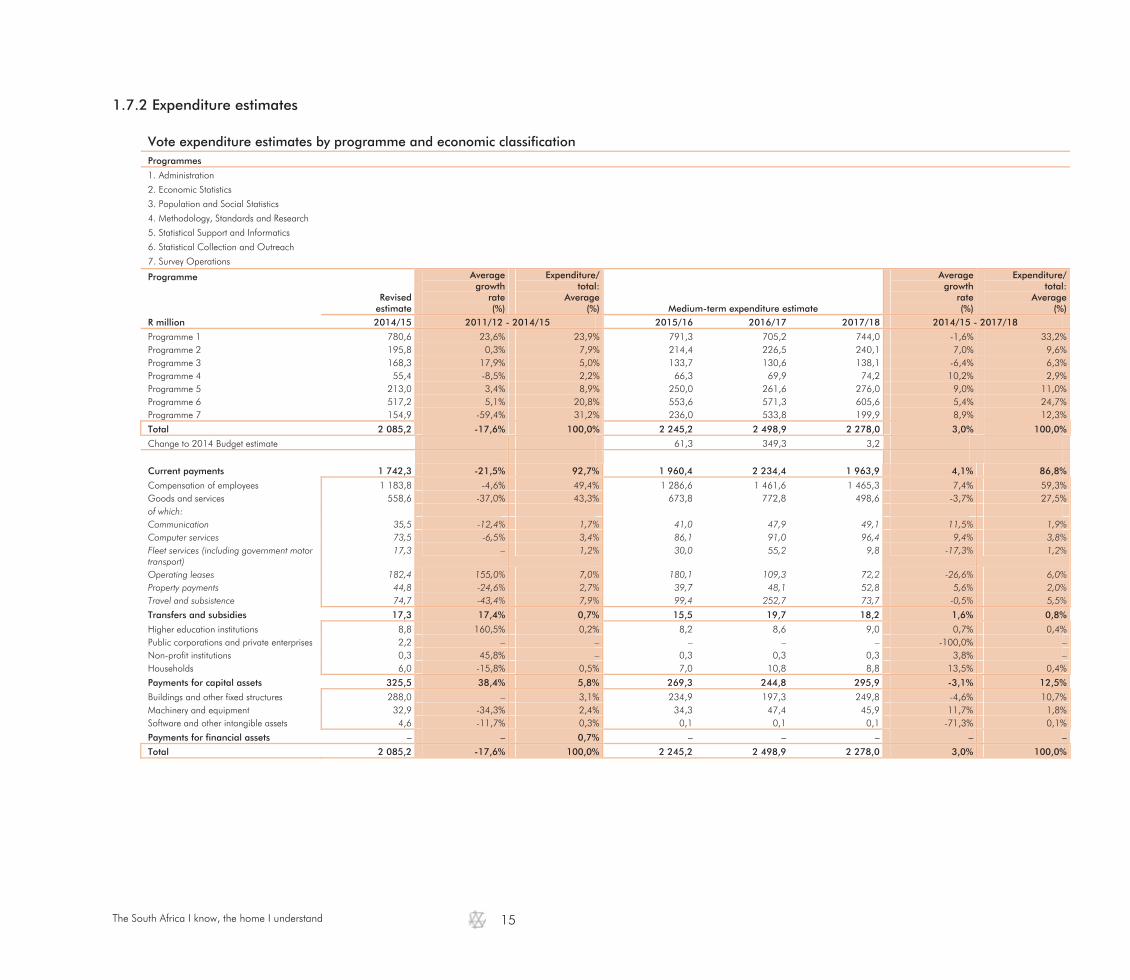
1.7.2 Expenditure estimates
Vote expenditure estimates by programme and economic classification Programmes 1. Administration 2. Economic Statistics 3. Population and Social Statistics 4. Methodology, Standards and Research 5. Statistical Support and Informatics 6. Statistical Collection and Outreach 7. Survey Operations Programme
Revised estimate
Averagegrowth
rate(%)
Expenditure/total:
Average(%) Medium-term expenditure estimate
Averagegrowth
rate(%)
Expenditure/ total:
Average (%)
R million 2014/15 2011/12 - 2014/15 2015/16 2016/17 2017/18 2014/15 - 2017/18
Programme 1 780,6 23,6% 23,9% 791,3 705,2 744,0 -1,6% 33,2% Programme 2 195,8 0,3% 7,9% 214,4 226,5 240,1 7,0% 9,6% Programme 3 168,3 17,9% 5,0% 133,7 130,6 138,1 -6,4% 6,3% Programme 4 55,4 -8,5% 2,2% 66,3 69,9 74,2 10,2% 2,9% Programme 5 213,0 3,4% 8,9% 250,0 261,6 276,0 9,0% 11,0% Programme 6 517,2 5,1% 20,8% 553,6 571,3 605,6 5,4% 24,7% Programme 7 154,9 -59,4% 31,2% 236,0 533,8 199,9 8,9% 12,3%
Total 2 085,2 -17,6% 100,0% 2 245,2 2 498,9 2 278,0 3,0% 100,0%
Change to 2014 Budget estimate 61,3 349,3 3,2
Current payments 1 742,3 -21,5% 92,7% 1 960,4 2 234,4 1 963,9 4,1% 86,8%
Compensation of employees 1 183,8 -4,6% 49,4% 1 286,6 1 461,6 1 465,3 7,4% 59,3% Goods and services 558,6 -37,0% 43,3% 673,8 772,8 498,6 -3,7% 27,5% of which: Communication 35,5 -12,4% 1,7% 41,0 47,9 49,1 11,5% 1,9% Computer services 73,5 -6,5% 3,4% 86,1 91,0 96,4 9,4% 3,8% Fleet services (including government motor transport)
17,3 – 1,2% 30,0 55,2 9,8 -17,3% 1,2%
Operating leases 182,4 155,0% 7,0% 180,1 109,3 72,2 -26,6% 6,0% Property payments 44,8 -24,6% 2,7% 39,7 48,1 52,8 5,6% 2,0% Travel and subsistence 74,7 -43,4% 7,9% 99,4 252,7 73,7 -0,5% 5,5%
Transfers and subsidies 17,3 17,4% 0,7% 15,5 19,7 18,2 1,6% 0,8%
Higher education institutions 8,8 160,5% 0,2% 8,2 8,6 9,0 0,7% 0,4% Public corporations and private enterprises 2,2 – – – – – -100,0% – Non-profit institutions 0,3 45,8% – 0,3 0,3 0,3 3,8% – Households 6,0 -15,8% 0,5% 7,0 10,8 8,8 13,5% 0,4%
Payments for capital assets 325,5 38,4% 5,8% 269,3 244,8 295,9 -3,1% 12,5%
Buildings and other fixed structures 288,0 – 3,1% 234,9 197,3 249,8 -4,6% 10,7% Machinery and equipment 32,9 -34,3% 2,4% 34,3 47,4 45,9 11,7% 1,8% Software and other intangible assets 4,6 -11,7% 0,3% 0,1 0,1 0,1 -71,3% 0,1%
Payments for financial assets – – 0,7% – – – – –
Total 2 085,2 -17,6% 100,0% 2 245,2 2 498,9 2 278,0 3,0% 100,0%

The South Africa I know, the home I understand
16
1.7.3 Personnel information
The South Africa I know, the home I understand
17
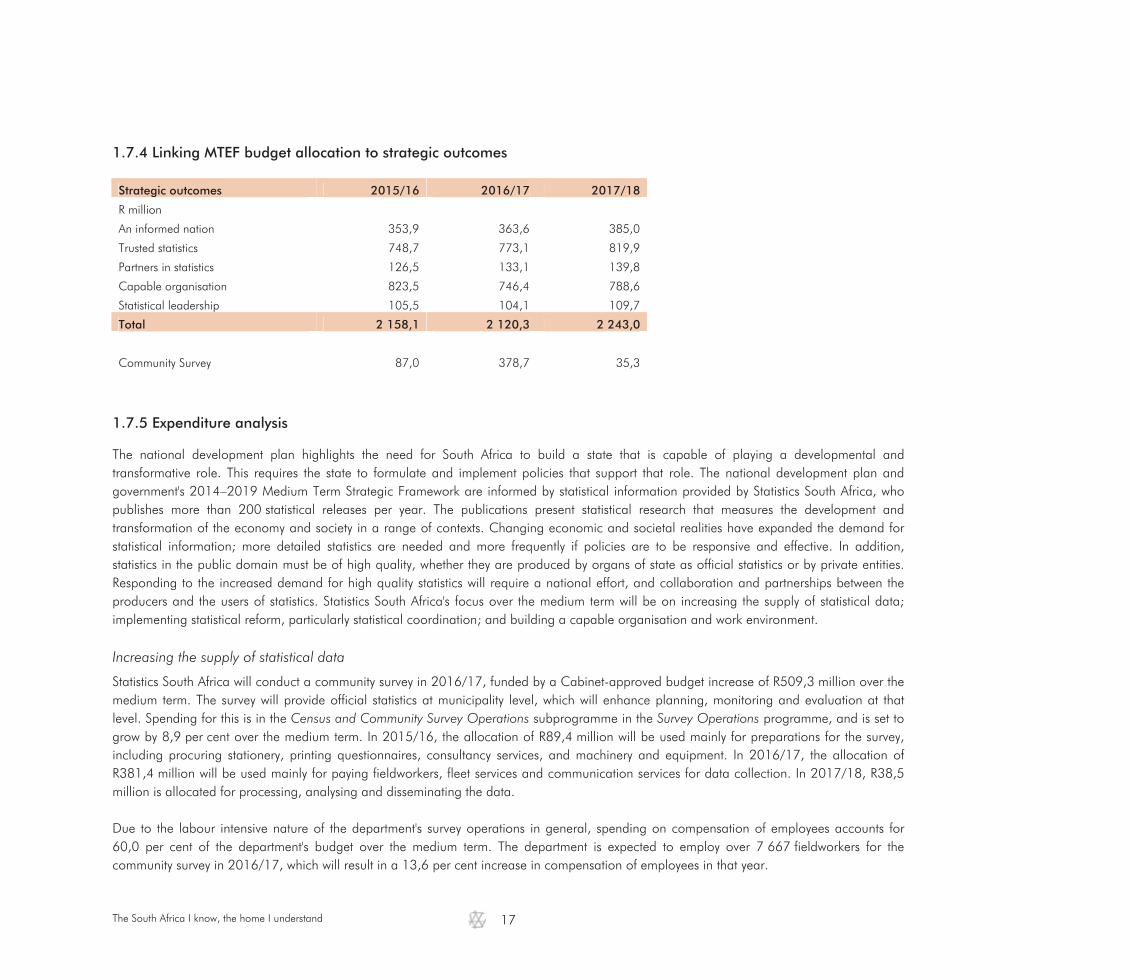
1.7.4 Linking MTEF budget allocation to strategic outcomes
Strategic outcomes 2015/16 2016/17 2017/18
R million
An informed nation 353,9 363,6 385,0
Trusted statistics 748,7 773,1 819,9
Partners in statistics 126,5 133,1 139,8
Capable organisation 823,5 746,4 788,6
Statistical leadership 105,5 104,1 109,7
Total 2 158,1 2 120,3 2 243,0
Community Survey 87,0 378,7 35,3
1.7.5 Expenditure analysis The national development plan highlights the need for South Africa to build a state that is capable of playing a developmental and transformative role. This requires the state to formulate and implement policies that support that role. The national development plan and government's 2014–2019 Medium Term Strategic Framework are informed by statistical information provided by Statistics South Africa, who publishes more than 200 statistical releases per year. The publications present statistical research that measures the development and transformation of the economy and society in a range of contexts. Changing economic and societal realities have expanded the demand for statistical information; more detailed statistics are needed and more frequently if policies are to be responsive and effective. In addition, statistics in the public domain must be of high quality, whether they are produced by organs of state as official statistics or by private entities. Responding to the increased demand for high quality statistics will require a national effort, and collaboration and partnerships between the producers and the users of statistics. Statistics South Africa's focus over the medium term will be on increasing the supply of statistical data; implementing statistical reform, particularly statistical coordination; and building a capable organisation and work environment. Increasing the supply of statistical data
Statistics South Africa will conduct a community survey in 2016/17, funded by a Cabinet-approved budget increase of R509,3 million over the medium term. The survey will provide official statistics at municipality level, which will enhance planning, monitoring and evaluation at that level. Spending for this is in the Census and Community Survey Operations subprogramme in the Survey Operations programme, and is set to grow by 8,9 per cent over the medium term. In 2015/16, the allocation of R89,4 million will be used mainly for preparations for the survey, including procuring stationery, printing questionnaires, consultancy services, and machinery and equipment. In 2016/17, the allocation of R381,4 million will be used mainly for paying fieldworkers, fleet services and communication services for data collection. In 2017/18, R38,5 million is allocated for processing, analysing and disseminating the data. Due to the labour intensive nature of the department's survey operations in general, spending on compensation of employees accounts for 60,0 per cent of the department's budget over the medium term. The department is expected to employ over 7 667 fieldworkers for the community survey in 2016/17, which will result in a 13,6 per cent increase in compensation of employees in that year.

The South Africa I know, the home I understand
18
Cabinet-approved budget reductions of R95,5 million over the medium term follow recent underspending, mainly on compensation of employees due to the difficulty in attracting candidates with specialised skills and organisational restructuring. The reductions will be effected on goods and services items such as operating payments, stationery, printing and office supplies, travel and subsistence, catering, and communication. The department will absorb the bulk of the reductions through efficiency savings, mainly by freezing vacant funded posts to align to the reduced compensation of its employees budget. Statistical reform
The department's key focus over the medium term is the revision of the statistics legislation to drive statistical reform, particularly statistical coordination. The process will begin with stakeholder consultations in 2015/16. Coordination between statistical agencies is essential for consistency and efficiency in the statistical system. The provisions for statistical coordination between organs of state in the Statistics Act (1999) need to be strengthened to support the regulatory framework for a responsive national statistics system. The national statistics system is a tool to transform the current production of statistics, which is characterised by gaps in information, quality and capacity. Through the system, the department will be able to drive statistical planning, establish statistical production systems in other organs of state, establish governance structures, and promote the use of statistical information in planning and decision-making and in the implementation of consequences for non-compliance. Statistics South Africa will be responsible for developing statistical policy for the production of official statistics and developing standardised, shared frameworks for all producers. Other reform activities will include establishing a governance structure, setting up a statistical clearing house to advise the Statistician-General, as well as setting up a professional body for statisticians. Funding for statistical coordination activities of R93,7 million over the medium term in the National Statistics System subprogramme in the Administration programme will be spent mainly on compensation of employees and travel and subsistence.
Building a capable organisation and work environment
The department will invest in business modernisation over the medium term. Activities will entail researching and developing platforms to digitise data collection, and processing and disseminating statistical information that will lead to efficiency gains in the future. Testing and piloting digital data collection will start in 2015/16. Business modernisation will take place across all the department's programmes. Since no funds have been allocated for business modernisation, each programme either requests the Statistical Support and Informatics programme to incur limited ICT expenditure on its behalf or uses its own budget. The department is aiming to improve its productivity, speed up some of its processes and reduce the potential for human error. One of the benefits will be faster turnaround times for releasing statistics to the public. Statistics South Africa is building a new head office through a public-private partnership. The new premises signal the start of the government precinct development at Salvokop, which is part of the Tshwane inner city regeneration project. The department contributes R617 million to the project. The construction of the head office began in 2014/15. At the end of December 2014, R133,4 million had been spent of the 2014/15 budget allocation of R421,2 million, for bulk earthworks, excavation, piling and the construction of the basement. In 2015/16, an additional R195,9 million, allocated to building and other fixed structures, will advance construction, which is expected to be completed in June 2016.

The South Africa I know, the home I understand
19
1.7.6 Selected performance indicators
Performance indicators by programme and related outcome Indicator Programme Outcome Past Current Projections
2011/12 2012/13 2013/14 2014/15 2015/16 2016/17 2017/18
Number of quarterly and annual releases on GDP estimates per year
Economic Statistics
Outcome 4: Decent employment through inclusive economic growth
5 5 4 4 4 4 4
Number of releases on industry and trade statistics per year
Economic Statistics 142 142 150 150 150 150 150
Number of releases on financial statistics per year
Economic Statistics 17 17 17 17 17 17 17
Number of price index releases per year1
Economic Statistics 24 24 24 24 48 48 48
Number of releases on labour market dynamics per year2
Population and Social Statistics
8 8 8 8 8 8 8
Number of releases on living circumstances, service delivery and poverty
Population and Social Statistics
2 2 2 7 4 4 4
Number of releases on the changing profile of the population per year
Population and Social Statistics
Outcome 4: Decent employment through inclusive economic growth
17 17 17 17 17 17 17
Number of releases on population dynamics and service delivery at national, provincial and municipal levels
Population and Social Statistics
Outcome 8: Sustainable human settlements and improved quality of household life
–3 –3 –3 –3 –3 –3 10
1. The indicators for the consumer price index and the producer price index have been combined. 2 new monthly releases have been introduced. 2. The employment and earnings indicator has been combined with the labour market dynamics indicator. 3. Historical data are not available, because the indicator will be measured in 2017/18.

Programme and subprogramme plansChapter 2
The South Africa I know, the home I understand
22
2. Linking programmes to strategic outcomes and objectives
Statistics South Africa has seven budget programmes responsible for the outputs and outcomes of the organisation. The Economic and Social Statistics clusters are mainly responsible for the statistical products and outputs of the organisation. These clusters are mainly supported by (1) the Methodology, Standards and Research cluster, (2) the Statistical Support and Informatics cluster, (3) the Statistical Collection and Outreach cluster, (4) the Survey Operations cluster, and (5) Administration.
2.1 Programme 1: Administration
Programme 1: Administration Programme 1 consists of three distinct parts, namely the Office of the Statistician-General, the Corporate Services cluster and the recently established South African National Statistics Systems (SANSS) cluster.
a) Programme purpose and objectives
Purpose: Provide strategic leadership, management and support services to the department, and capacity building. Drive statistical coordination among organs of state. Objectives Lead the development and coordination of the statistical production system among organs of state in line with the purpose of official
statistics and statistical principles on an ongoing basis. Provide direction and leadership through driving strategic and operational planning and monitoring processes, as well as monthly, quarterly
and annually reporting on organisational performance. Provide corporate support services on an ongoing basis by:
o improving human resource and financial management systems and processes o creating a conducive working environment o enhancing qualifications, skills and capabilities
o promoting good governance.
The South Africa I know, the home I understand
23
b) Reconciling performance targets and outputs with the budget for each subprogramme
Departmental Management provides strategic direction and leadership to the organisation at a cost of R13,1 million.
o Programme Office oversees operational planning and reporting in the organisation, provides coordinated and integrated management information, and builds project management capability. Key activities include the coordination of organisational operational planning and reporting documents and project management training. Key outputs for 2015/16 are monthly progress reports on the operational performance of the organisation to Exco and Senior Management Staff (SMS); project management training and enhancing of the management information repository at a cost of R14,6 million.
o The Strategy division is responsible for driving and facilitating organisational strategy development, strategic planning, organisational strategic reporting and monitoring processes, and to drive the change agenda. Key activities include the coordinating of organisational planning and reporting information to compile accountability documents. Key outputs for 2015/16 include the Work Programme, Service Delivery Improvement Plan (SDIP), quarterly reports on organisational performance and the SDIP, annual reports of the organisation and the SDIP, and reports on change management initiatives and communicating the new strategic direction to staff at a cost of R10 million.
Internal Audit provides an independent audit service to the department and promotes good governance through assessing risk management, internal control systems and governance processes. Key activities include the conducting of audits. Key outputs for 2015/16 are audit reports and aligning of internal audit systems and methodologies at a cost of R12,5 million.
National Statistics System coordinates the statistical production system among organs of state. Key activities include coordinating and finalising amendments to the Statistics Act, coordinating and compiling the MDG country report, and technical support to SANSS partners. Key outputs for 2015/16 include conducting independent quality assessments to certify statistics as official, preparing reports on statistical planning and reporting across organs of state, coordination of statistical production, statistical support and advice, and the compilation of national and international statistical reports at a cost of R30,8 million.
Corporate Services provides human resources, facilities management and capacity building services, and promotes good governance.
o Programme Management provides strategic direction and leadership to the programme, at a cost of R3,9 million.
o Human Resource Management provides an efficient and effective human resource management service to the organisation. Key activities include recruitment of permanent and contract staff, career management including succession planning; job evaluation; performance management; employee assistance programme and labour relations management, HR administration management and labour relations management. Key outputs for 2015/16 include a reduced vacancy rate, an HRM strategy, an employment equity report, reports on redeployment of staff affected by the new building, and support to the Community Survey 2016 at a cost of R52,3 million.
o Facilities Management, Logistics and Security is responsible for providing a secure and healthy working environment for staff, and an effective and efficient logistical service that is timely and cost-effective to support operations in the organisation (fleet management and property management). Key activities include the management of fleet services and the new building project, and the conducting of OHSA audits and security screening. Key outputs for 2015/16 include reports on OHSA compliance, the new building, support to the CS2016 and preparing the organisation for the new environment at a cost of R58,3 million.

The South Africa I know, the home I understand
24
o Human Capacity Development is responsible for the development and implementation of a people development programme to enhance the skills and competencies of staff and assistance with the acquisition of necessary educational and training qualifications where needs have been identified in line with the talent management framework. Key activities include the coordination of capacity building initiatives and the bursary and internship programmes, and compilation of training plans. Key outputs include an approved training plan, a workplace skills plan, a skills portfolio of the organisation, reports on the internship programme and bursary allocation, and creating learning opportunities at tertiary level at a cost of R67,8 million.
o Corporate Governance is responsible for the provision of efficient risk management, an efficient process for the development, review and implementation of organisational policies, and a sound legal advisory service to the department. Key activities include the identification and management of key organisational risks, the coordination of policy review and development of new policies, and the provision of legal advice and services. Key outputs for 2015/16 include reports on top organisational risks, a strategic risk register and a fraud prevention plan at a cost of R22,2 million.
Financial Administration provides financial, asset and procurement support services to the department. Key activities include the compilation of financial planning and reporting documents; procurement of assets, goods and services; contract management; maintenance of an asset register; payments to suppliers within 30 days; and the compilation of the interim and annual financial statements. Key outputs for 2015/16 include the departmental MTEF, ENE, AENE, Financial Statements for auditing purposes, biannual tax reconciliations to SARS and an asset disposal strategy in support of the new building project at a cost of R85,5 million.
Office Accommodation provides a secure and healthy working environment for employees and stakeholders at a cost of R420 million.
c) Linking programmes with strategic outcomes and objectives
The table below outlines how Programme 1 contributes to the achievement of strategic outcomes and objectives:
Strategic outcome Strategic objective
Office of the SG Statistical leadership Fostering shared values
Equalising opportunities, promoting inclusion and redress Capable state Driving legislative reform
Enhance corporate governance and administration (integrative planning and reporting)
South African National Statistics System Informed nation Enhance the statistical information base by increasing its depth, breadth and
geographic spread Partners in statistics Lead the coordination and collaboration of the statistical system in South Africa

The South Africa I know, the home I understand
25
Strategic outcome Strategic objective Corporate Services Capable state Enhance corporate governance and administration
(Financial Administration, Human Resource Management, Risk Management, Compliance, Facilities Management & Security) Become the employer of choice
Statistical leadership Invest in statistical leadership and management
Invest in building statistical capability and competence
d) Programme risks
The following risks have been identified that could impact on the operations of the programme:
Strategic risks Mitigation strategy Organisational budget is inadequate to fund strategic priorities
Demonstrate prudent spending and effective reprioritisation of funding of activities Engage the Minister and National Treasury to stabilise the financial environment
Slow uptake of NSS activities by organs of state Approval of Policy framework by Cabinet and Amendment to the Statistics Act Inadequate capacity to conduct independent quality assessments against SASQAF
Expand capacity building efforts to increase methodological and statistical capability
Non-compliance to legislative provisions Enhance communication to personnel and enforcement of accountability Inaccurate and incomplete supporting documentation for accountability
Enhance internal controls and monitor accountability
e) Resource considerations
A prerequisite for implementing the new strategy of Stats SA is progressively funding a growing organisation over a period of five years. The estimated budget that follows is an outline per subprogramme of funding the sustained agenda as well as a change agenda. Unfunded activities are indicated under the 5-year strategy.
The South Africa I know, the home I understand
26
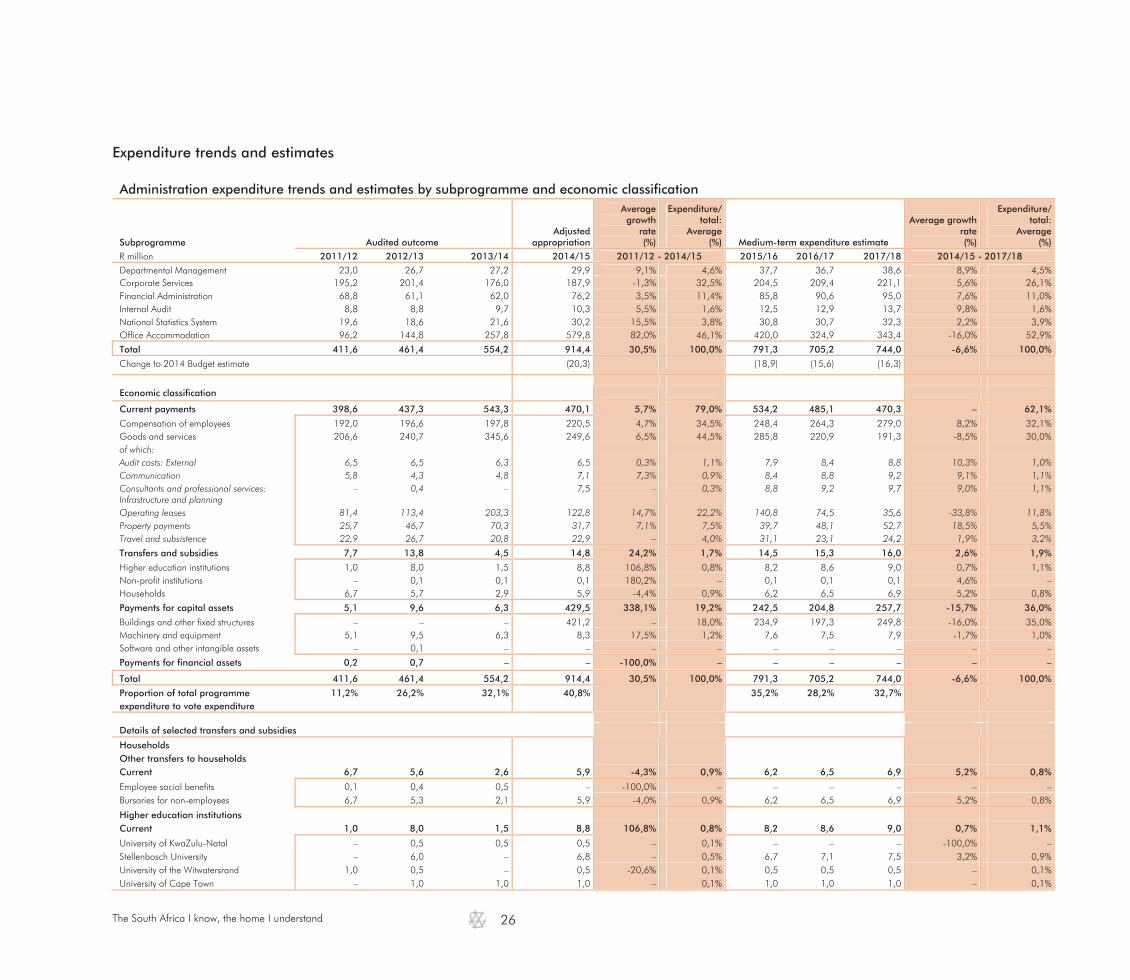
Expenditure trends and estimates
Administration expenditure trends and estimates by subprogramme and economic classification
Subprogramme Audited outcome Adjusted
appropriation
Averagegrowth
rate(%)
Expenditure/total:
Average(%) Medium-term expenditure estimate
Average growth rate(%)
Expenditure/ total:
Average (%)
R million 2011/12 2012/13 2013/14 2014/15 2011/12 - 2014/15 2015/16 2016/17 2017/18 2014/15 - 2017/18 Departmental Management 23,0 26,7 27,2 29,9 9,1% 4,6% 37,7 36,7 38,6 8,9% 4,5% Corporate Services 195,2 201,4 176,0 187,9 -1,3% 32,5% 204,5 209,4 221,1 5,6% 26,1% Financial Administration 68,8 61,1 62,0 76,2 3,5% 11,4% 85,8 90,6 95,0 7,6% 11,0% Internal Audit 8,8 8,8 9,7 10,3 5,5% 1,6% 12,5 12,9 13,7 9,8% 1,6% National Statistics System 19,6 18,6 21,6 30,2 15,5% 3,8% 30,8 30,7 32,3 2,2% 3,9% Office Accommodation 96,2 144,8 257,8 579,8 82,0% 46,1% 420,0 324,9 343,4 -16,0% 52,9%
Total 411,6 461,4 554,2 914,4 30,5% 100,0% 791,3 705,2 744,0 -6,6% 100,0%
Change to 2014 Budget estimate (20,3) (18,9) (15,6) (16,3)
Economic classification
Current payments 398,6 437,3 543,3 470,1 5,7% 79,0% 534,2 485,1 470,3 – 62,1%
Compensation of employees 192,0 196,6 197,8 220,5 4,7% 34,5% 248,4 264,3 279,0 8,2% 32,1% Goods and services 206,6 240,7 345,6 249,6 6,5% 44,5% 285,8 220,9 191,3 -8,5% 30,0% of which: Audit costs: External 6,5 6,5 6,3 6,5 0,3% 1,1% 7,9 8,4 8,8 10,3% 1,0% Communication 5,8 4,3 4,8 7,1 7,3% 0,9% 8,4 8,8 9,2 9,1% 1,1% Consultants and professional services: Infrastructure and planning
– 0,4 – 7,5 – 0,3% 8,8 9,2 9,7 9,0% 1,1%
Operating leases 81,4 113,4 203,3 122,8 14,7% 22,2% 140,8 74,5 35,6 -33,8% 11,8% Property payments 25,7 46,7 70,3 31,7 7,1% 7,5% 39,7 48,1 52,7 18,5% 5,5% Travel and subsistence 22,9 26,7 20,8 22,9 – 4,0% 31,1 23,1 24,2 1,9% 3,2%
Transfers and subsidies 7,7 13,8 4,5 14,8 24,2% 1,7% 14,5 15,3 16,0 2,6% 1,9%
Higher education institutions 1,0 8,0 1,5 8,8 106,8% 0,8% 8,2 8,6 9,0 0,7% 1,1% Non-profit institutions – 0,1 0,1 0,1 180,2% – 0,1 0,1 0,1 4,6% – Households 6,7 5,7 2,9 5,9 -4,4% 0,9% 6,2 6,5 6,9 5,2% 0,8%
Payments for capital assets 5,1 9,6 6,3 429,5 338,1% 19,2% 242,5 204,8 257,7 -15,7% 36,0%
Buildings and other fixed structures – – – 421,2 – 18,0% 234,9 197,3 249,8 -16,0% 35,0% Machinery and equipment 5,1 9,5 6,3 8,3 17,5% 1,2% 7,6 7,5 7,9 -1,7% 1,0% Software and other intangible assets – 0,1 – – – – – – – – –
Payments for financial assets 0,2 0,7 – – -100,0% – – – – – –
Total 411,6 461,4 554,2 914,4 30,5% 100,0% 791,3 705,2 744,0 -6,6% 100,0%
Proportion of total programme expenditure to vote expenditure
11,2% 26,2% 32,1% 40,8% 35,2% 28,2% 32,7%
Details of selected transfers and subsidies
Households Other transfers to households Current 6,7 5,6 2,6 5,9 -4,3% 0,9% 6,2 6,5 6,9 5,2% 0,8%
Employee social benefits 0,1 0,4 0,5 – -100,0% – – – – – – Bursaries for non-employees 6,7 5,3 2,1 5,9 -4,0% 0,9% 6,2 6,5 6,9 5,2% 0,8%
Higher education institutions Current 1,0 8,0 1,5 8,8 106,8% 0,8% 8,2 8,6 9,0 0,7% 1,1%
University of KwaZulu-Natal – 0,5 0,5 0,5 – 0,1% – – – -100,0% – Stellenbosch University – 6,0 – 6,8 – 0,5% 6,7 7,1 7,5 3,2% 0,9% University of the Witwatersrand 1,0 0,5 – 0,5 -20,6% 0,1% 0,5 0,5 0,5 – 0,1% University of Cape Town – 1,0 1,0 1,0 – 0,1% 1,0 1,0 1,0 – 0,1%

The South Africa I know, the home I understand
27
f) Expenditure analysis
The programme has spent R579,631 million of the allocated budget as at end of January 2015. Of the total expenditure, R175,215 million was spent on compensation of employees, whilst R209,942 million was spent on goods and services; R187,875 million was spent on payments for capital assets and R6,599 million was spent on transfers mainly to the University of Stellenbosch and the payment of bursaries. The main cost drivers within operational costs are property payments (R50,581 million), operating leases (R103,021 million), audit costs (R5,032 million), business and advisory services (R4,925 million) mainly for public-private partnership (PPP) transactions and travel and subsistence amounting to (R18,602 million).
g) Personnel information
The graphic below outlines the number of posts per level and associated cost over the MTEF period:
The South Africa I know, the home I understand
28
2.2 Programme 2: Economic Statistics
a) Programme purpose and objectives Purpose: Produce economic statistics to inform evidence-based economic development and transformation in line with internationally recognised practices. Objectives Expand the economic statistics information base by increasing the depth, breadth and geographic spread for evidence-based planning, monitoring and decision-making for use by both the public and private sectors through: publishing monthly, quarterly, annual and periodic statistical releases on industry, trade and financial statistics in the private and public
sectors publishing monthly statistical releases on the consumer price and producer price indices publishing quarterly and annual GDP estimates providing information on 10 industries of the economy developing new and innovative products to respond to user demands over the medium term improving the measurement of economic indicators over the medium term through the application of internationally recognised standards
and practices.
b) Reconciling performance targets and outputs with the budget for each subprogramme
Programme Management for Economic Statistics provides strategic direction and leadership to the programme, at a cost of R3,5 million. Short-term Indicators provides information on turnover and volumes in various industries in the economy through the publication of monthly, quarterly and annual statistical releases. Key activities include the conducting of 15 business surveys. The division publishes 2 annual releases on: Selected building plans passed and completed, and buildings completed per annum, 1 quarterly release on Manufacturing: utilisation of production capacity by large enterprises, and 12 monthly releases consisting of Mining: production and sales, Manufacturing: production and sales, Generation and consumption of electricity, Building plans passed and completed, Retail trade sales, Motor trade sales, Wholesale trade sales, Food and beverages, Tourist accommodation, Transport, Liquidations and insolvencies, and Civil cases for debt. Key outputs for 2015/16 include 150 releases on 10 industries at a cost of R31,1 million.
Structural Industry Statistics provides periodic information on the income and expenditure structure of industries by publishing periodic statistical information. Key activities include the conducting of periodic business surveys. The division compiles periodic reports on the structure/composition, and the income and expenditure variables of the following industries: agriculture; mining and quarrying; retail sales; motor trade; wholesale and trade sales; transport, storage and communication; food and beverages; and tourist accommodation. Key outputs for 2015/16 include 9 releases/reports at a cost of R39,9 million.
Private Sector Finance Statistics tracks the financial performance of private sector organisations. Key activities include conducting an annual and a quarterly survey. Key outputs for 2015/16 include 5 releases on private sector income, expenditure and selected balance sheet indicators at a cost of R28,6 million.
The South Africa I know, the home I understand
29
Government Financial Statistics tracks government revenue and spending and the financial performance of government. Key activities include the compilation of quarterly and annual statistical information on national, provincial and local government spending. Key outputs for 2015/16 include quarterly releases on financial statistics of municipalities and 9 annual releases on financial and non-financial statistics of municipalities and other government spending, and 4 reports on improving government financial statistics at a cost of R16,3 million.
National Accounts produces GDP data and other integrative statistical products. Key activities include the compilation of quarterly GDP estimates and the conducting of research. Key outputs for 2015/16 include quarterly GDP estimates, 5 annual releases on national accounts, 2 research reports on improving national accounts statistics and 3 reports on environmental economic accounts at a cost of R12,4 million.
Economic Analysis integrates and analyses information from various internal and external data sources. Key activities include research and analysis of national accounts statistics and economic statistics. Key outputs for 2015/16 include quarterly flash estimates of GDP, 2 research reports on national account statistics and 4 research reports on economic statistics at a cost of R14,6 million.
Price Statistics provides information on the level of inflation by producing the consumer price index and various producer price indices. Key activities include collecting consumer and producer prices from retail stores and manufacturing companies. Key outputs for 2015/16 include monthly CPI and PPI, and 3 technical reports at a cost of R68,1 million.
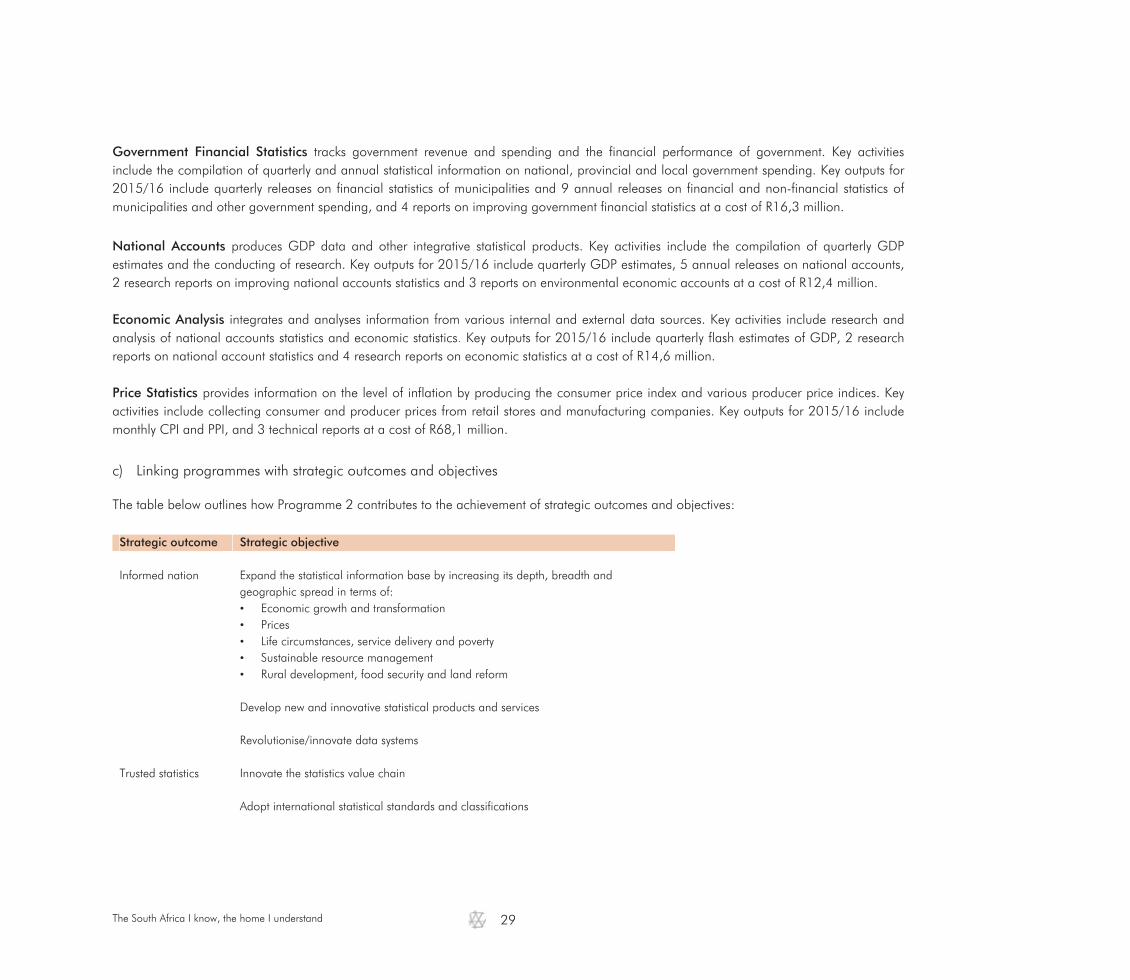
c) Linking programmes with strategic outcomes and objectives
The table below outlines how Programme 2 contributes to the achievement of strategic outcomes and objectives: Strategic outcome Strategic objective
Informed nation Expand the statistical information base by increasing its depth, breadth and
geographic spread in terms of: • Economic growth and transformation • Prices • Life circumstances, service delivery and poverty • Sustainable resource management • Rural development, food security and land reform Develop new and innovative statistical products and services Revolutionise/innovate data systems
Trusted statistics Innovate the statistics value chain
Adopt international statistical standards and classifications
The South Africa I know, the home I understand
30
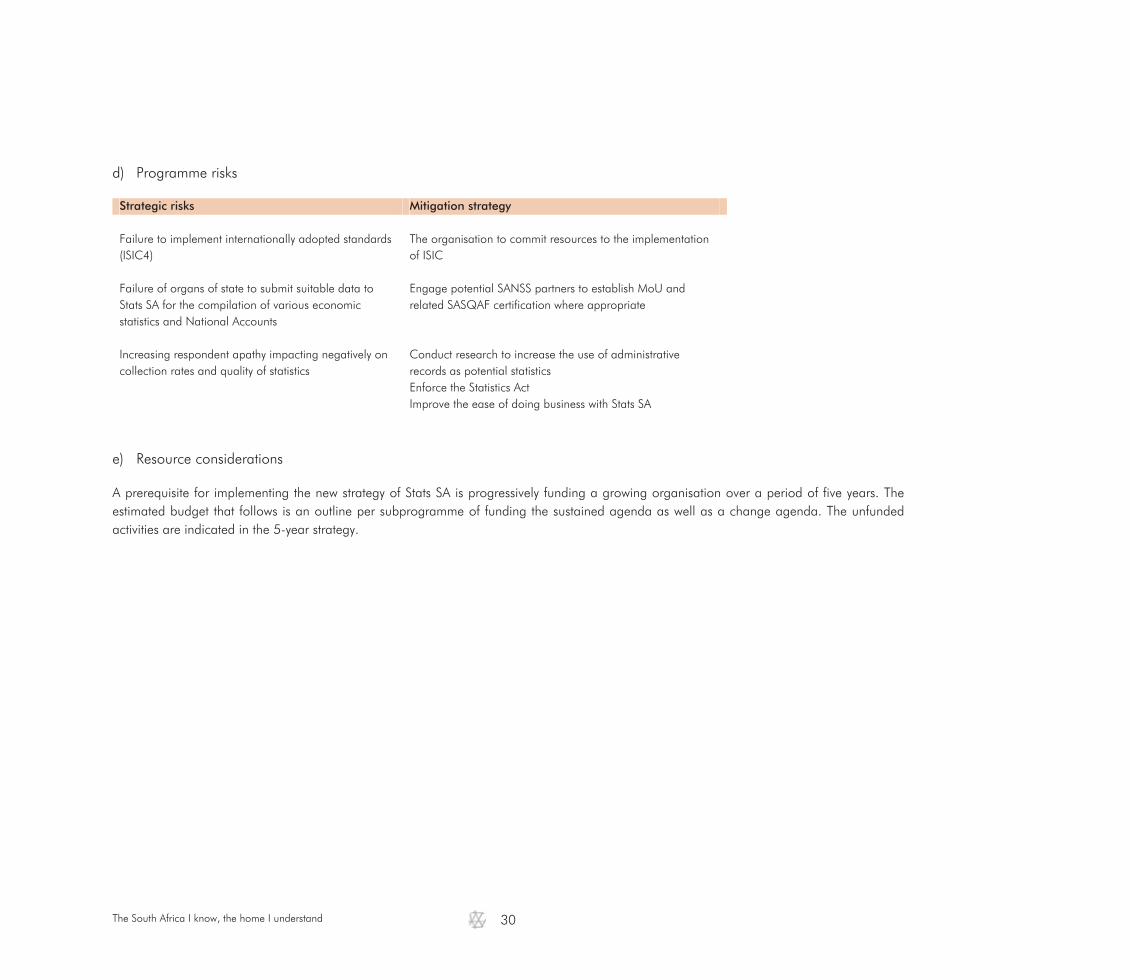
d) Programme risks
Strategic risks Mitigation strategy Failure to implement internationally adopted standards (ISIC4)
The organisation to commit resources to the implementation of ISIC
Failure of organs of state to submit suitable data to Stats SA for the compilation of various economic statistics and National Accounts
Engage potential SANSS partners to establish MoU and related SASQAF certification where appropriate
Increasing respondent apathy impacting negatively on collection rates and quality of statistics
Conduct research to increase the use of administrative records as potential statistics Enforce the Statistics Act Improve the ease of doing business with Stats SA
e) Resource considerations
A prerequisite for implementing the new strategy of Stats SA is progressively funding a growing organisation over a period of five years. The estimated budget that follows is an outline per subprogramme of funding the sustained agenda as well as a change agenda. The unfunded activities are indicated in the 5-year strategy.
The South Africa I know, the home I understand
31
Expenditure trends and estimates
Economic Statistics expenditure trends and estimates by subprogramme and economic classification
Subprogramme Audited outcome Adjusted
appropriation
Averagegrowth
rate(%)
Expen-diture/
total:Average
(%) Medium-term expenditure
estimate
Averagegrowth
rate(%)
Expen- diture/
total: Average
(%) R million 2011/12 2012/13 2013/14 2014/15 2011/12 - 2014/15 2015/16 2016/17 2017/18 2014/15 - 2017/18 Programme Management for Economic Statistics 2,6 2,6 2,6 3,0 4,4% 1,5% 3,5 3,6 3,8 8,6% 1,6% Short-term Indicators 27,0 26,8 25,7 28,4 1,7% 14,6% 31,1 32,9 34,9 7,1% 14,4% Structural Industry Statistics 30,0 32,5 34,3 33,5 3,7% 17,6% 39,9 42,1 44,7 10,1% 18,1% Price Statistics 56,3 61,0 62,3 66,2 5,6% 33,2% 68,1 72,0 76,4 4,9% 32,0% Private Sector Finance Statistics 24,1 24,7 24,7 28,1 5,2% 13,7% 28,6 30,3 32,1 4,6% 13,5% Government Finance Statistics 12,3 13,0 15,8 15,1 7,1% 7,6% 16,3 17,2 18,2 6,5% 7,5% National Accounts 9,2 8,8 9,7 11,7 8,4% 5,3% 12,4 13,1 13,9 5,9% 5,8% Economic Analysis 6,1 12,8 12,1 16,9 40,7% 6,5% 14,6 15,3 16,1 -1,7% 7,1%
Total 167,6 182,2 187,2 202,8 6,6% 100,0% 214,4 226,5 240,1 5,8% 100,0%
Change to 2014 Budget estimate (7,8) (7,4) (2,6) (3,1)
Economic classification
Current payments 166,4 180,8 186,1 201,6 6,6% 99,3% 213,4 225,4 239,1 5,9% 99,5%
Compensation of employees 147,7 161,0 166,8 181,0 7,0% 88,7% 187,0 198,1 210,6 5,2% 87,9% Goods and services 18,7 19,8 19,3 20,6 3,3% 10,6% 26,4 27,3 28,5 11,4% 11,6% of which: Communication 4,5 4,2 4,1 4,7 1,1% 2,4% 4,9 5,2 6,0 8,5% 2,4% Consultants and professional services: Business and advisory services
2,7 7,1 6,6 5,3 25,2% 2,9% 6,9 7,1 7,6 13,3% 3,0%
Consumables: Stationery, printing and office supplies
1,8 1,6 1,8 1,9 2,7% 1,0% 2,4 2,5 2,8 13,3% 1,1%
Travel and subsistence 7,8 5,7 4,9 6,7 -5,1% 3,4% 8,6 8,8 8,2 7,3% 3,6% Training and development – – – – -58,5% – 1,3 1,4 1,5 799,0% 0,5% Operating payments 0,6 0,7 1,2 0,7 6,9% 0,4% 0,9 0,9 0,8 6,5% 0,4%
Transfers and subsidies 0,1 0,2 0,2 0,1 6,5% 0,1% – – – -75,7% –
Households 0,1 0,2 0,2 0,1 6,0% 0,1% – – – -100,0% –
Payments for capital assets 1,1 1,2 0,9 1,1 1,8% 0,6% 1,1 1,1 1,0 -3,5% 0,5%
Machinery and equipment 1,1 1,2 0,9 1,1 1,8% 0,6% 1,1 1,1 1,0 -3,5% 0,5%
Total 167,6 182,2 187,2 202,8 6,6% 100,0% 214,4 226,5 240,1 5,8% 100,0%
Proportion of total programme expenditure to vote expenditure
4,6% 10,3% 10,8% 9,0% – – 9,6% 9,1% 10,5% – –
The South Africa I know, the home I understand
32
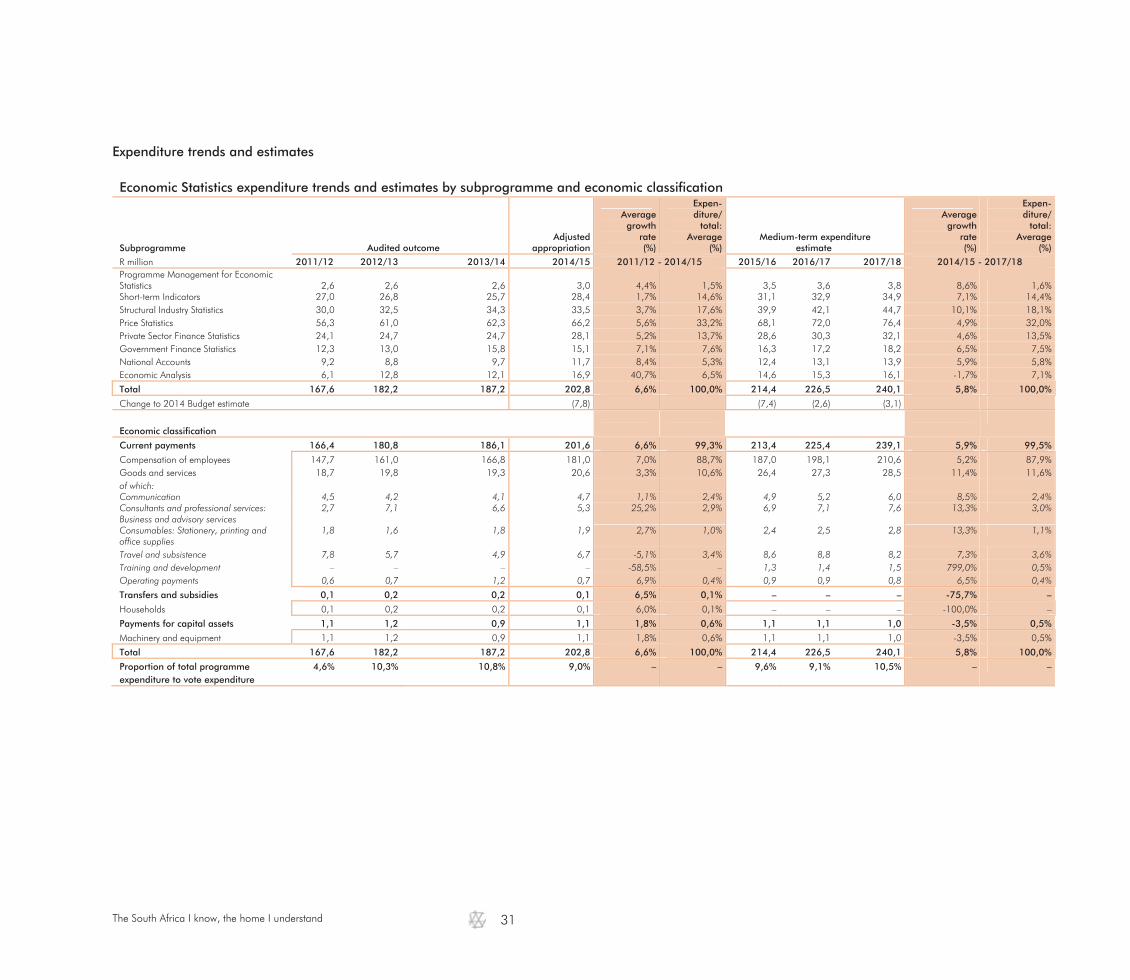
f) Expenditure analysis
The programme has spent R163,196 million of the allocated budget as at 31 January 2015. Of the total expenditure, R147,411 million was spent on compensation of employees, whilst R14,894 million was spent on goods and services. The main cost drivers within operational costs are consultants (R6,757 million), travel and subsistence (R3,653 million) and communication (R2,839 million).
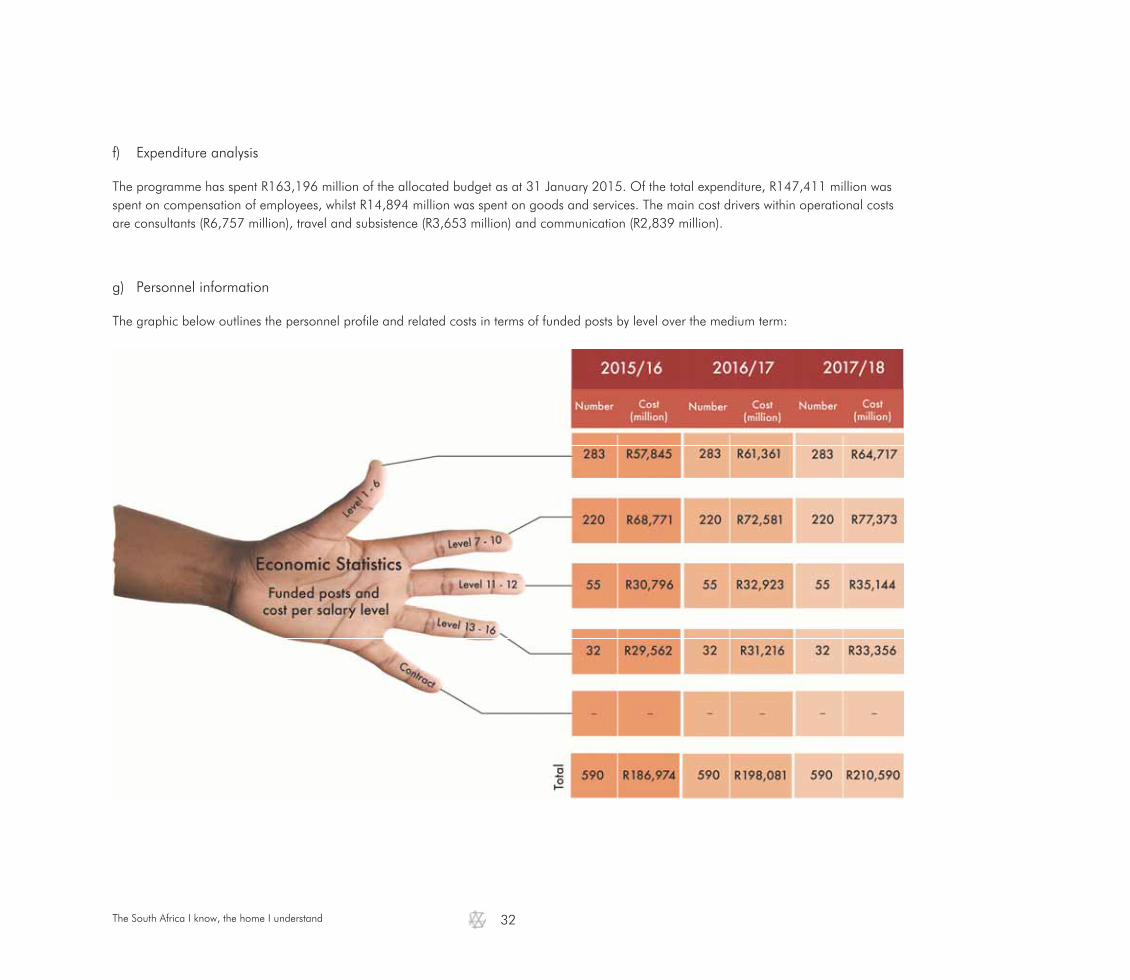
g) Personnel information
The graphic below outlines the personnel profile and related costs in terms of funded posts by level over the medium term:

The South Africa I know, the home I understand
33
2.3 Programme 3: Population and Social Statistics a) Programme purpose and objectives
Purpose: Produce population and social statistics to inform evidence-based socio-economic development and transformation in line with internationally recognised practices. Objectives Expand the population and social statistics information base by increasing the depth, breadth and geographic spread for evidence-based planning, monitoring and decision-making for use by both the public and private sectors through: • publishing quarterly and annual statistical information on the labour market, and on employment and earnings in the formal and informal
sectors
• publishing monthly and annual statistical information on vital registrations based on administrative sources
• publishing annual and periodic statistical information on poverty levels, living conditions and service delivery, as well as population dynamics and demographic trends
• developing new innovative products to respond to user demands over the medium term • improving the measurement of social indicators over the medium term through the application of internationally recognised standards and
practices.
b) Reconciling performance targets and outputs with the budget for each subprogramme
Programme Management for Population and Social Statistics provides strategic direction and leadership to the programme, at a cost of R4,5 million. Poverty and Inequality Statistics provides information on poverty levels and income and expenditure trends in South Africa. Key activities include conducting the Living Conditions Survey and the compilation of technical reports on improving and expanding life circumstances, poverty and inequality statistics. Key outputs for 2015/16 include 4 technical reports on improving and expanding life circumstances, poverty and inequality statistics at a cost of R37,9 million.
Labour Statistics provides information on employment levels in the formal, non-agriculture sector and labour market trends in South Africa. Key activities include conducting quarterly surveys on the labour force, and employment and earnings. Key outputs for 2015/16 include the quarterly publication of labour market trends, an annual report on labour market dynamics in South Africa, a research report on the use of administrative data and 2 reports on improving labour market statistics at a cost of R40,5 million.
Demographic Analysis collates and analyses data from censuses and other surveys, as well as administrative data to compile mid-year population estimates and generate a knowledge base on social and population themes. Key activities include compilation of mid-year population estimates and thematic demographic reports. Key outputs for 2015/16 include an annual report on projected population estimates, a thematic demographic report on emerging demographic issues, and a content and research methodology report at a cost of R15,3 million.
The South Africa I know, the home I understand
34
Health and Vital Statistics publishes statistics on births, deaths, marriages, divorces, tourism and migration based on administrative records. Key activities include the compilation of monthly and annual statistical information on vital events. Key outputs for 2015/16 include monthly and an annual publication on tourism and migration, annual publications on mortality and causes of death, recorded live births, documented immigrants, perinatal deaths, and marriages and divorces, datasets on recorded live births, mortality and causes of death, and marriages and divorces and 4 reports on improving health and vital statistics at a cost of R11,7 million.
Population Statistics publishes population estimates collected through population censuses and surveys. Key activities include the compilation of thematic and research reports and support to the Community Survey and Census. Key outputs for 2015/16 include a revised questionnaire, designed products, tabulation plan and analysis report for CS2016 at a cost of R9,3 million. Social Statistics provides information on living conditions, domestic tourism and crime through household surveys. Key activities include the compilation of reports/releases on gender and vulnerable groups, social and household services, tourism, crime and education. Key outputs for 2015/16 include reports on gender and vulnerable groups, social and household services, tourism, crime and education and 8 research reports to improve statistics in those areas at a cost of R14,4 million.
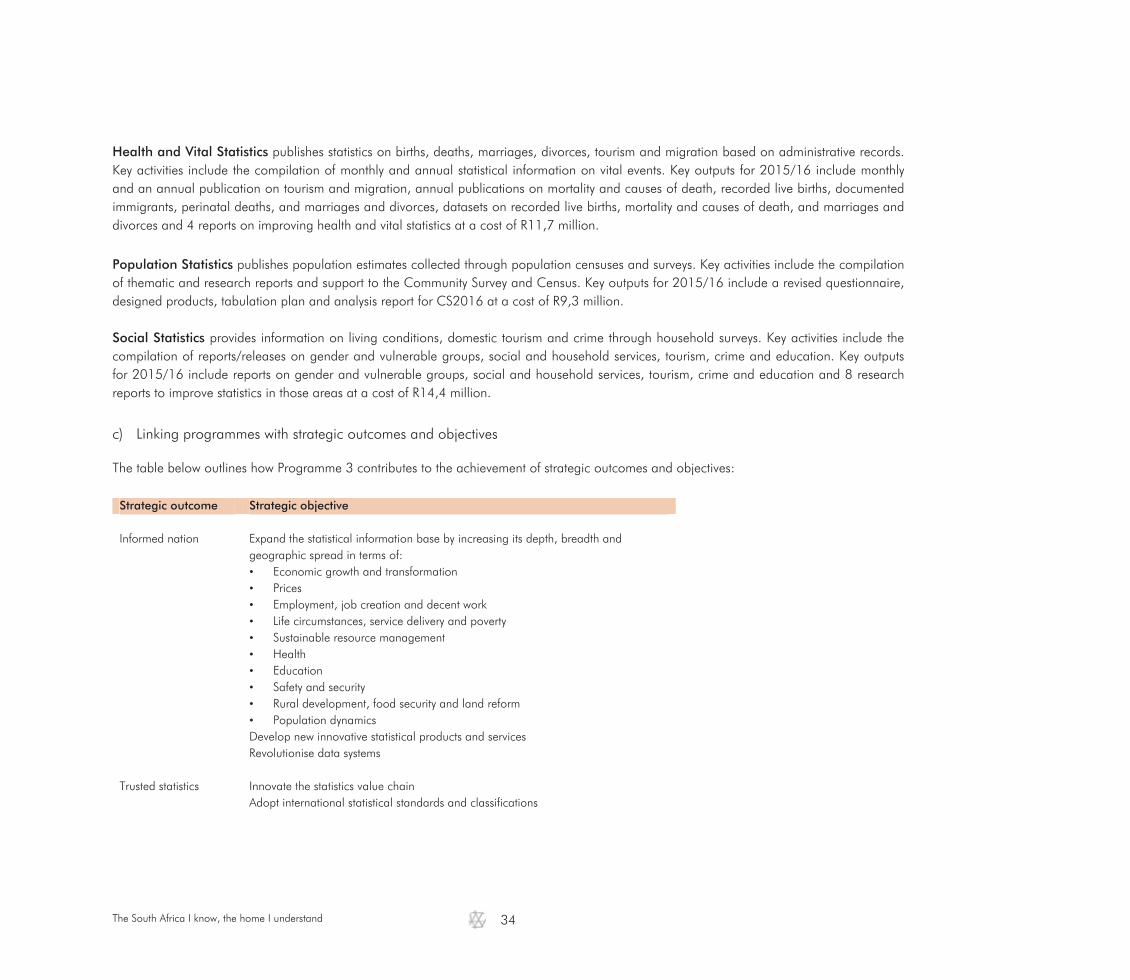
c) Linking programmes with strategic outcomes and objectives
The table below outlines how Programme 3 contributes to the achievement of strategic outcomes and objectives: Strategic outcome Strategic objective
Informed nation Expand the statistical information base by increasing its depth, breadth and
geographic spread in terms of: • Economic growth and transformation • Prices • Employment, job creation and decent work • Life circumstances, service delivery and poverty • Sustainable resource management • Health • Education • Safety and security • Rural development, food security and land reform • Population dynamics Develop new innovative statistical products and services Revolutionise data systems
Trusted statistics Innovate the statistics value chain
Adopt international statistical standards and classifications
The South Africa I know, the home I understand
35
d) Strategic intent of Population and Social Statistics
The role of the Population and Social Statistics cluster is to produce relevant, reliable and accurate population, demographic, labour market, poverty and social statistics using ethical and internationally acclaimed methodologies to provide evidence for the formulation of policies and interventions aimed at enhancing the development policies of South Africa. These statistics are used to monitor poverty, service delivery, development programmes, the labour market dynamics and for international comparability. The overall strategic intent of the Population and Social Statistics cluster is to expand the breadth and depth of the statistical base to respond to the demand at lower levels and the need to produce more indicators frequently and timely. This strategic thrust aims to address the gaps in the development of statistics. Information gap: The responsibility for producing social statistics is a shared responsibility among various organs of state. Although Stats SA is the leading partner in the social statistics subsystem, it is not feasible to meet all the needs of users. The current supply of official statistics does not have the desired scope, coverage and frequency, especially at lower levels of geography. Besides the census that will be scheduled for every ten years going forward, there is a challenge for the statistics produced to be disaggregated at local municipal level. Consultations with stakeholders have shown a high increased demand for regular and timely statistics at lower levels of disaggregation than provincial level that is provided by most household surveys currently. Planning is based at local level, hence the greater demand for most of the indicators to be at local level, including quality of service delivery indicators. The country's social issues are evolving quickly and affect development. A key strategic intervention in response to this huge challenge is the introduction of a Continuous Population Survey (CPS). Quality gap: Data quality is a multidimensional concept including both the relevance of information to users' needs, and other characteristics such as accuracy, timeliness, accessibility, interpretability, coherence and comparability of data that affect how it can be used. Data have quality if it satisfies the requirements of its intended use. Statistics produced through surveys are potentially subject to missing data and inconsistent responses. This can increase the amount of non-sampling errors occurring during the analysis of data. Analyses of datasets with missing data can create inconsistency as analysts compensate for missing data in different ways. Secondly, in the presence of non-responses that are unlikely to be random, estimates of population parameters may be biased. The population and social statistics produced and released by Stats SA will be subjected to the South African Statistical Quality Assessment Framework (SASQAF) over the medium term. Standard guidelines for questionnaire design, data quality and survey quality assurance have been developed but need to be reviewed and updated. Part of the strategy is to develop standardised guidelines across all processes in the production of official statistics. The master sample is the heartbeat of production of quality statistics. The master sample listing needs to be regularly updated and maintained because of its importance and its impact on the data quality. Stats SA is currently looking into new methodologies to maintain the master sample. The reliance of the vital statistics on administrative records produced by other organs of state poses challenges with respect to the completeness, timeliness and accuracy of these statistics. As a result, the organisation has limited control over the quality of data produced. Stats SA will be working with relevant partners to address the quality gaps that exist in the civil registration and vital statistics system.

The South Africa I know, the home I understand
36
In summary, the overall strategic intent of this cluster is to expand the statistics information base to better meet the needs of users through innovation by: • Introducing a continuous population survey; • Expanding the health and vital statistics products; • Implementing new statistical standards, classifications and frameworks; • Introducing innovative collection methodologies; • Increasing utilisation of administrative sources; • Expanding research and analytical capability as part of a learning culture; and • Partnering with key stakeholders.
e) Programme risks
Strategic risks Mitigation strategy Inability to respond to the high demand for statistics at a more detailed level, more frequently, within tight financial constraints
Introduce a continuous population survey that integrates content across surveys and publish data at municipal level every 3 years
Inadequate or poor quality of information sourced from administrative sources
Compile Memorandum of Understanding through the SANSS cluster with the relevant organs of state to establish partnership and enhance collaboration; introduce elements of SASQAF
f) Resource considerations
A prerequisite for implementing the new strategy of Stats SA is progressively funding a growing organisation over a period of five years. The estimated budget that follows is an outline per subprogramme of funding the sustained agenda as well as a change agenda. Unfunded activities are included in the breakdown of the 5-year strategy.

The South Africa I know, the home I understand
37
Expenditure trends and estimates
Population and Social Statistics expenditure trends and estimates by subprogramme and economic classification
Subprogramme Audited outcome Adjusted
appropriation
Averagegrowth
rate(%)
Expen-diture/
total:Average
(%) Medium-term expenditure
estimate
Averagegrowth
rate(%)
Expen- diture/
total: Average
(%) R million 2011/12 2012/13 2013/14 2014/15 2011/12 - 2014/15 2015/16 2016/17 2017/18 2014/15 - 2017/18 Programme Management for Population and Social Statistics 4,1 4,5 5,6 4,6 3,4% 4,2% 4,5 4,8 5,0 3,3% 3,4% Population Statistics 10,4 10,8 8,9 7,2 -11,8% 8,3% 9,3 9,8 10,4 13,2% 6,6% Health and Vital Statistics 8,6 11,6 9,2 12,1 12,0% 9,3% 11,7 12,4 13,1 2,6% 8,9% Social Statistics 9,2 12,4 12,9 13,0 12,1% 10,6% 14,4 15,1 16,1 7,4% 10,6% Demographic Analysis 4,2 4,1 6,0 12,5 43,7% 6,0% 15,3 16,2 17,1 11,0% 11,1% Labour Statistics 29,9 30,6 33,3 39,6 9,8% 29,7% 40,5 41,9 44,2 3,8% 30,1% Poverty and Inequality Statistics 27,8 28,2 26,2 61,0 30,0% 31,9% 37,9 30,5 32,3 -19,2% 29,3%
Total 94,3 102,3 102,1 150,0 16,7% 100,0% 133,7 130,6 138,1 -2,7% 100,0%
Change to 2014 Budget estimate 32,1 3,5 (3,6) (4,0)
Economic classification
Current payments 90,2 93,9 99,4 148,6 18,1% 96,3% 132,5 129,4 136,9 -2,7% 99,1%
Compensation of employees 60,1 66,8 76,9 112,0 23,1% 70,4% 97,1 102,9 109,4 -0,8% 76,3% Goods and services 30,1 27,2 22,5 36,6 6,7% 25,9% 35,4 26,5 27,6 -9,0% 22,8% of which: Communication 2,3 1,8 1,3 2,0 -4,3% 1,6% 2,4 2,2 2,6 9,3% 1,7% Consultants and professional services: Business and advisory services
3,4 2,6 2,8 3,9 4,1% 2,8% 3,6 3,7 3,9 0,1% 2,7%
Agency and support/outsourced services 0,3 0,4 – 0,2 -19,9% 0,2% 1,5 1,6 1,7 116,1% 0,9% Operating leases – – 6,3 – -100,0% 1,4% 5,7 7,1 7,4 – 3,6% Travel and subsistence 17,1 14,5 2,7 18,5 2,6% 11,8% 6,5 4,2 4,5 -37,7% 6,1% Operating payments 2,2 3,9 7,7 6,4 42,0% 4,5% 6,1 4,6 4,1 -13,4% 3,8%
Transfers and subsidies 0,2 0,3 0,2 0,2 7,9% 0,2% 0,2 0,2 0,2 3,4% 0,2%
Non-profit institutions – – 0,1 0,2 – 0,1% 0,2 0,2 0,2 3,4% 0,2% Households 0,2 0,3 0,1 – -100,0% 0,1% – – – – –
Payments for capital assets 0,6 0,9 0,7 1,1 22,1% 0,7% 0,9 1,0 1,0 -4,2% 0,7%
Machinery and equipment 0,6 0,9 0,7 1,0 18,7% 0,7% 0,8 0,9 0,9 -5,1% 0,7% Software and other intangible assets – – – 0,1 – – 0,1 0,1 0,1 5,4% 0,1%
Payments for financial assets 3,3 7,1 1,9 – -100,0% 2,7% – – – – –
Total 94,3 102,3 102,1 150,0 16,7% 100,0% 133,7 130,6 138,1 -2,7% 100,0%
Proportion of total programme expenditure to vote expenditure
2,6% 5,8% 5,9% 6,7% – – 6,0% 5,2% 6,1% – –
g) Expenditure trends
The programme has spent R124,477 million of the allocated budget. Of the total expenditure, R86,348 million was spent on compensation of employees, whilst R36,167 million was spent on goods and services. The main cost drivers within operational costs are business advisory services (R1,525 million), operating payments (R5,480 million), travel and subsistence (R14,486 million) and venues and facilities (R10,151 million).

The South Africa I know, the home I understand
38
h) Personnel information
The graphic below outlines the personnel profile and related costs in terms of funded posts by level over the medium term:
The South Africa I know, the home I understand
39
2.4 Programme 4: Methodology, Standards and Research
a) Programme purpose and objectives
Purpose: Provide expertise on quality, methodology, statistical standards and practices for official statistics in line with international best practice. Build and maintain a business sampling frame. Conduct policy research and analysis on emerging policy matters. Objectives • Improve the comparability and accuracy of statistical information by annually reviewing and evaluating methodological compliance in
survey areas, and applying appropriate quality criteria, standards, classifications and procedures to the statistical value chain. • Ensure accurate and reliable statistical information for users by the regular use of a sound business sampling frame to draw annual samples
for all economic surveys. • Provide statistical support and advice to policymakers by annually conducting policy research and analysis on emerging policy matters and
producing annual research papers on the economy and society.
b) Reconciling performance targets and outputs with the budget for each subprogramme
Programme Management for Methodology, Standards and Research provides strategic direction and leadership to the programme at a cost of R3,8 million. Methodology and Evaluation provides technical expertise on methodologies for producing official statistics and conducting reviews of surveys. Key activities include the rendering of methodological and systems development support to the survey areas. Key outputs for 2015/16 include samples for economic and social surveys, a concept note on data revolution, 2 evaluation reports on surveys conducted and 10 research reports on improving methodological support and evaluations and emerging methodologies at a cost of R11,7 million. Survey Standards develops standards, classifications, and definitions for surveys undertaken by the department. Key activities include the development and review of standards. Key outputs for 2015/16 include developing and reviewing 9 statistical standards and 7 technical reports on the implementation of a quality management system and improving standards development at a cost of R7,9 million. Business Register maintains and improves the sampling frame for economic statistics. Key activities include surveys of large businesses and providing snapshots and frames for sampling of economic surveys. Key outputs for 2015/16 include updating and maintaining the Business Register for economic statistics, completing surveys of large businesses, providing quarterly snapshots and financial sampling frames based on the Business Register, 3 research reports on improving the functionality of the business sampling frame, 1 report on register-based statistics and 1 technical report on business rules at a cost of R32 million. Policy Research and Analysis provides integrative technical support and advisory services for policy planners and development practitioners, and participates in knowledge research and innovation on key development themes. Key activities include conducting research on broad cross-cutting issues that have long-term implications for development. Key outputs for 2015/16 include 6 research reports on government socio-economic planning and spatial analysis at a cost of R5,8 million.
The South Africa I know, the home I understand
40
c) Linking programmes with strategic outcomes and objectives
The table below outlines how Programme 4 contributes to the achievement of strategic outcomes and objectives: Strategic outcome Strategic objective
Informed nation Develop new innovative statistical products and services
Revolutionise data systems Trusted statistics Institutionalise quality management
Innovate the statistics value chain Adopt international statistical standards and classifications
Partners in statistics Strengthen collaboration to build statistical sampling frames
d) Strategic intent of Methodology, Standards and Research
The strategic focus of this cluster is to ensure implementation of international frameworks and standards as it promotes quality statistics for the accurate measurement of the economy and society. Quality statistics is manifested in terms of data comparability, coherence and international best practices. These international tools are supported by international organisations such as the OECD, UNSC and the IMF.
The System of National Accounts (SNA) is the framework that guides all activities relating to economic statistics. At present, South Africa follows the 1993 SNA. The 2008 SNA has recently been approved by the United Nations Statistics Division (UNSD) and countries are in the process of implementing it. In support of the 2008 SNA, the International Standard Industrial Classification of all economic activities (ISIC) was updated, to ISIC rev. 4, locally adapted to SIC 7. This provides an updated classification of activities in the economy. Stats SA is currently using a locally developed version of ISIC rev. 3 (SIC 5) and has developed a similar classification based on ISIC rev. 4 which needs to be implemented. The introduction of a new classification system is a lengthy process encompassing 4 distinct phases. The first is the local adaptation of ISIC, which Stats SA has successfully completed. The second relates to the modification of existing and the development of new IT systems related to the business register, the basis of all economic statistics. Phase 3 classifies all businesses according to SIC 7. Phase 4 deals with parallel sampling and other survey methodologies. This cluster will continue to provide methodological support to both Economic and Social Statistics in terms of sampling, weighting and estimation as well as quality audits of the sampling frames. Methodological support in terms of sampling and weighting will be critical for the introduction of the new continuous population survey as well as a large scale survey. Over the medium term, the application of statistical methodology by survey areas will be evaluated.
The South Africa I know, the home I understand
41
e) Programme risks Strategic risks Mitigation strategy Demand for support regarding the development and implementation of standards exceeds supply
Continuous capacity building of standards developers and re-prioritisation of user requests.
Inability of the statistical Business Register to respond to user needs
Collaboration with providers (SARS and the dti) of administrative data in order to implement SIC7
f) Resource considerations
A prerequisite for implementing the new strategy of Stats SA is progressively funding a growing organisation over a period of five years. The estimated budget that follows is an outline per subprogramme of funding the sustained agenda as well as a change agenda. Unfunded activities are included in the breakdown of the 5-year strategy.
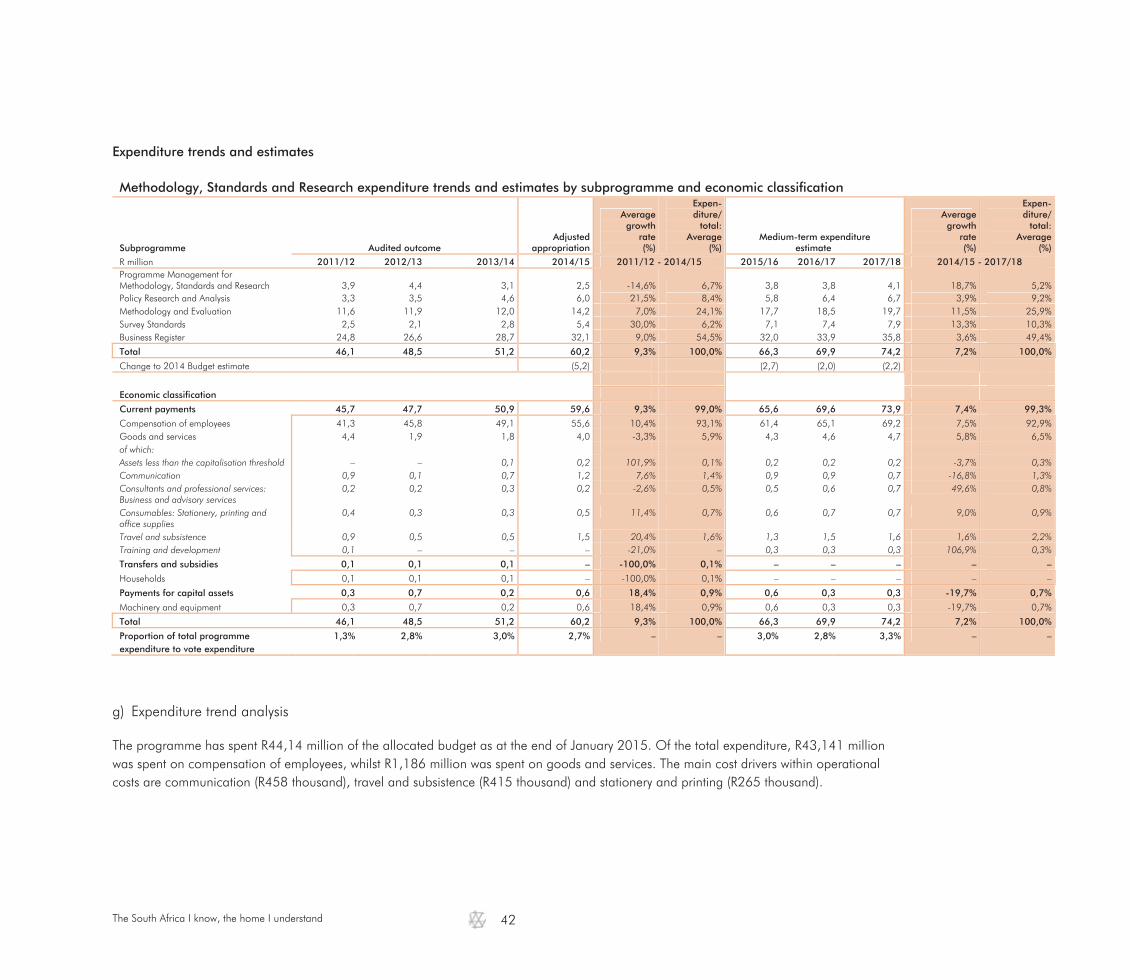
The South Africa I know, the home I understand
42
Expenditure trends and estimates
Methodology, Standards and Research expenditure trends and estimates by subprogramme and economic classification
Subprogramme Audited outcome Adjusted
appropriation
Averagegrowth
rate(%)
Expen-diture/
total:Average
(%) Medium-term expenditure
estimate
Averagegrowth
rate(%)
Expen- diture/
total: Average
(%) R million 2011/12 2012/13 2013/14 2014/15 2011/12 - 2014/15 2015/16 2016/17 2017/18 2014/15 - 2017/18 Programme Management for Methodology, Standards and Research 3,9 4,4 3,1 2,5 -14,6% 6,7% 3,8 3,8 4,1 18,7% 5,2% Policy Research and Analysis 3,3 3,5 4,6 6,0 21,5% 8,4% 5,8 6,4 6,7 3,9% 9,2% Methodology and Evaluation 11,6 11,9 12,0 14,2 7,0% 24,1% 17,7 18,5 19,7 11,5% 25,9% Survey Standards 2,5 2,1 2,8 5,4 30,0% 6,2% 7,1 7,4 7,9 13,3% 10,3% Business Register 24,8 26,6 28,7 32,1 9,0% 54,5% 32,0 33,9 35,8 3,6% 49,4%
Total 46,1 48,5 51,2 60,2 9,3% 100,0% 66,3 69,9 74,2 7,2% 100,0%
Change to 2014 Budget estimate (5,2) (2,7) (2,0) (2,2)
Economic classification
Current payments 45,7 47,7 50,9 59,6 9,3% 99,0% 65,6 69,6 73,9 7,4% 99,3%
Compensation of employees 41,3 45,8 49,1 55,6 10,4% 93,1% 61,4 65,1 69,2 7,5% 92,9% Goods and services 4,4 1,9 1,8 4,0 -3,3% 5,9% 4,3 4,6 4,7 5,8% 6,5% of which: Assets less than the capitalisation threshold – – 0,1 0,2 101,9% 0,1% 0,2 0,2 0,2 -3,7% 0,3% Communication 0,9 0,1 0,7 1,2 7,6% 1,4% 0,9 0,9 0,7 -16,8% 1,3% Consultants and professional services: Business and advisory services
0,2 0,2 0,3 0,2 -2,6% 0,5% 0,5 0,6 0,7 49,6% 0,8%
Consumables: Stationery, printing and office supplies
0,4 0,3 0,3 0,5 11,4% 0,7% 0,6 0,7 0,7 9,0% 0,9%
Travel and subsistence 0,9 0,5 0,5 1,5 20,4% 1,6% 1,3 1,5 1,6 1,6% 2,2% Training and development 0,1 – – – -21,0% – 0,3 0,3 0,3 106,9% 0,3%
Transfers and subsidies 0,1 0,1 0,1 – -100,0% 0,1% – – – – –
Households 0,1 0,1 0,1 – -100,0% 0,1% – – – – –
Payments for capital assets 0,3 0,7 0,2 0,6 18,4% 0,9% 0,6 0,3 0,3 -19,7% 0,7%
Machinery and equipment 0,3 0,7 0,2 0,6 18,4% 0,9% 0,6 0,3 0,3 -19,7% 0,7%
Total 46,1 48,5 51,2 60,2 9,3% 100,0% 66,3 69,9 74,2 7,2% 100,0%
Proportion of total programme expenditure to vote expenditure
1,3% 2,8% 3,0% 2,7% – – 3,0% 2,8% 3,3% – –
g) Expenditure trend analysis
The programme has spent R44,14 million of the allocated budget as at the end of January 2015. Of the total expenditure, R43,141 million was spent on compensation of employees, whilst R1,186 million was spent on goods and services. The main cost drivers within operational costs are communication (R458 thousand), travel and subsistence (R415 thousand) and stationery and printing (R265 thousand).

The South Africa I know, the home I understand
43
h) Personnel information
The graphic below outlines the personnel profile and related costs in terms of funded posts by level over the medium term:
The South Africa I know, the home I understand
44
2.5 Programme 5: Statistical Support and Informatics a) Programme purpose and objectives
Purpose: Enable service delivery programmes by using technology in the production and use of official statistics. Inform policy through the use of statistical geography. Build and maintain a spatial information frame. Objectives • Collaborate with partners to build and maintain a reliable sampling frame for household surveys by updating the spatial information frame
annually. • Modernise business processes by applying emerging technologies in the data collection, processing and dissemination of statistics. • Support the department's production of official statistics by upgrading and maintaining ICT infrastructure, and ensuring 90 per cent of
network availability for users at all times over the medium term.
b) Reconciling performance targets and outputs with the budget for each subprogramme Programme Management for Statistical Support and Informatics provides strategic direction and leadership to the programme at a cost of R2,9 million. Geography Frame provides a sampling frame for household surveys and censuses. Key activities include updating and maintenance of the sampling frame for population and social statistics. Key outputs for 2015/16 include the establishment of a spatial information frame, maintaining place names and demarcating enumeration areas (EAs) within municipal boundaries at a cost of R24,6 million. Geography Services provides a mapping and information service to the department and other users. Key activities include the development of geospatial applications, continued development and implementation of web-based solutions, and research and development of an enterprise architecture for spatial data delivery at a cost of R25,7 million. Data Management and Technology provides technological infrastructure for the department and supports data management across statistical series. Key activities include providing IT services to the department and developing systems applications. Key outputs for 2015/16 include a broadband infrastructure, stabilised ICT infrastructure in provinces and districts, improved response times for ICT services, and ICT standards and protocols developed with SANSS partners at a cost of R120,7 million. Publication Services provides editing, publishing and distribution services to survey areas and all areas of the department that produce reports, correspondence, policy documentation and manuals. Key activities include printing, distributing, editing and design services and research to increase access. Key outputs for 2015/16 include the compilation of multidisciplinary publications, the development of electronic datasets for statistical data and research documents on a data repository, data delivery channels and the writing skills course at a cost of R28,2 million.

The South Africa I know, the home I understand
45
Business Modernisation improves data and information management across the department, modernising the way business is conducted and supported by technology, and develops systems applications. Key activities include researching and developing solutions to modernise business processes. Key outputs for 2015/16 include research documents on platforms to automate data collection, processing and dissemination, an enterprise architecture programme, and a knowledge management environment at a cost of R47,8 million.
c) Linking programmes strategic outcomes and objectives
Below is an outline of how Programme 5 contributes to the achievement of strategic outcomes and objectives: Strategic outcome Strategic objective
Informed nation Revolutionise data systems
Inform policy processes through statistical geography Trusted statistics Increase stakeholder focus/Improve brand positioning
Partners in statistics Strengthen collaboration to build statistical sampling frames A capable organisation Invest in ICT aligned to organisational growth
d) Strategic intent of Statistical Support and Informatics
This cluster aims to improve the effectiveness, efficiency and economy of the department's operations through the use of technology, infrastructure and datasets at its disposal. This cluster is responsible for the development and maintenance of a geospatial information frame, the provision of a technological infrastructure that supports data management across statistical series, modernising business processes and the provision of a publishing service. An updated geospatial information frame exists to enable the production, dissemination and use of official statistics. The implementation of the Geospatial Strategy is the blueprint for the delivery of a complete geospatial information frame over the next five years. In line with this strategy, the organisation has embarked on an initiative to involve other stakeholders in the maintenance and updating of the spatial information framework through collaboration and partnerships. In the short term, Stats SA intends sharing the complete dwelling frame with all municipalities and to have it incorporated and used as part of their planning, reporting, monitoring and service delivery processes. This phase will be characterised by providing support, building capacity and sharing experiences with municipalities. Over the medium term, a collaborative mapping approach will be adopted to facilitate the integration of a national dataset of dwelling structures with up-to-date information through a web interface. In this way, a user can view and update his/her own information and, in the process, contribute to the maintenance of the dwelling frame. The rewards generated through such partnerships (especially those for municipalities) are better service delivery as well as delivering on the mandate that life has equal worth by ensuring that everyone in South Africa has their own address in an urban as well as a rural setting. A key challenge, however, remains the lack of addresses in informal settlements.
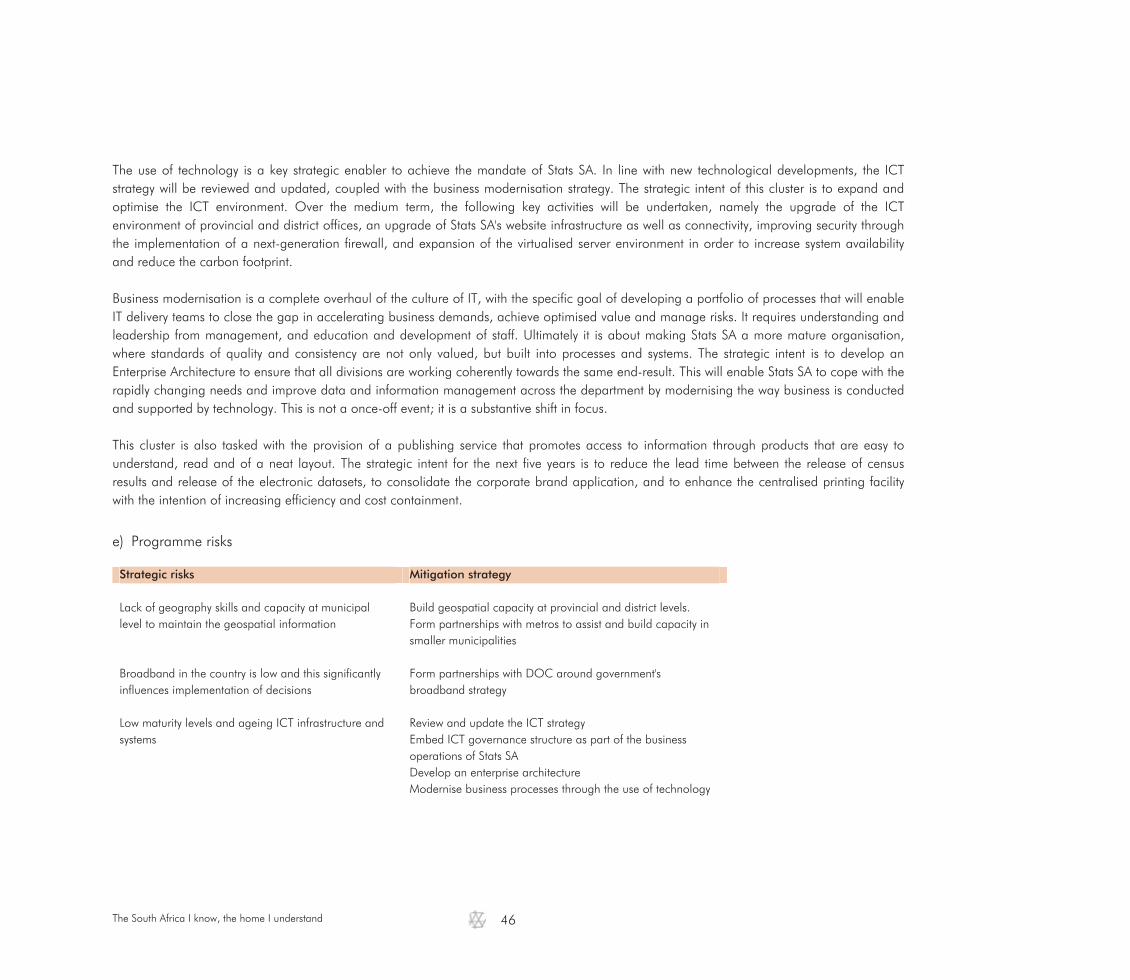
The South Africa I know, the home I understand
46
The use of technology is a key strategic enabler to achieve the mandate of Stats SA. In line with new technological developments, the ICT strategy will be reviewed and updated, coupled with the business modernisation strategy. The strategic intent of this cluster is to expand and optimise the ICT environment. Over the medium term, the following key activities will be undertaken, namely the upgrade of the ICT environment of provincial and district offices, an upgrade of Stats SA's website infrastructure as well as connectivity, improving security through the implementation of a next-generation firewall, and expansion of the virtualised server environment in order to increase system availability and reduce the carbon footprint. Business modernisation is a complete overhaul of the culture of IT, with the specific goal of developing a portfolio of processes that will enable IT delivery teams to close the gap in accelerating business demands, achieve optimised value and manage risks. It requires understanding and leadership from management, and education and development of staff. Ultimately it is about making Stats SA a more mature organisation, where standards of quality and consistency are not only valued, but built into processes and systems. The strategic intent is to develop an Enterprise Architecture to ensure that all divisions are working coherently towards the same end-result. This will enable Stats SA to cope with the rapidly changing needs and improve data and information management across the department by modernising the way business is conducted and supported by technology. This is not a once-off event; it is a substantive shift in focus. This cluster is also tasked with the provision of a publishing service that promotes access to information through products that are easy to understand, read and of a neat layout. The strategic intent for the next five years is to reduce the lead time between the release of census results and release of the electronic datasets, to consolidate the corporate brand application, and to enhance the centralised printing facility with the intention of increasing efficiency and cost containment.
e) Programme risks
Strategic risks Mitigation strategy Lack of geography skills and capacity at municipal level to maintain the geospatial information
Build geospatial capacity at provincial and district levels. Form partnerships with metros to assist and build capacity in smaller municipalities
Broadband in the country is low and this significantly influences implementation of decisions
Form partnerships with DOC around government's broadband strategy
Low maturity levels and ageing ICT infrastructure and systems
Review and update the ICT strategy Embed ICT governance structure as part of the business operations of Stats SA Develop an enterprise architecture Modernise business processes through the use of technology
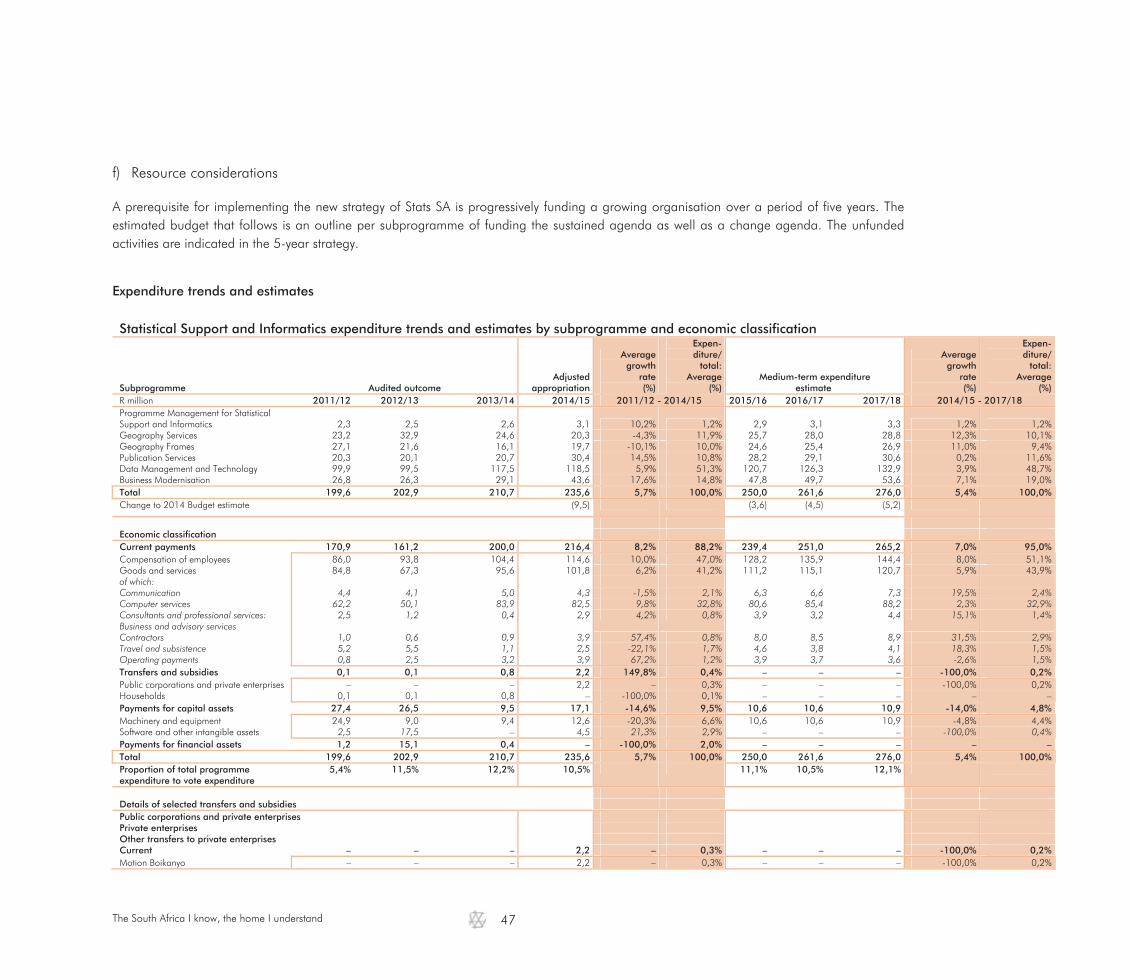
The South Africa I know, the home I understand
47
f) Resource considerations
A prerequisite for implementing the new strategy of Stats SA is progressively funding a growing organisation over a period of five years. The estimated budget that follows is an outline per subprogramme of funding the sustained agenda as well as a change agenda. The unfunded activities are indicated in the 5-year strategy.
Expenditure trends and estimates Statistical Support and Informatics expenditure trends and estimates by subprogramme and economic classification
Subprogramme Audited outcome Adjusted
appropriation
Averagegrowth
rate(%)
Expen-diture/
total:Average
(%) Medium-term expenditure
estimate
Averagegrowth
rate(%)
Expen- diture/
total: Average
(%) R million 2011/12 2012/13 2013/14 2014/15 2011/12 - 2014/15 2015/16 2016/17 2017/18 2014/15 - 2017/18 Programme Management for Statistical Support and Informatics 2,3 2,5 2,6 3,1 10,2% 1,2% 2,9 3,1 3,3 1,2% 1,2% Geography Services 23,2 32,9 24,6 20,3 -4,3% 11,9% 25,7 28,0 28,8 12,3% 10,1% Geography Frames 27,1 21,6 16,1 19,7 -10,1% 10,0% 24,6 25,4 26,9 11,0% 9,4% Publication Services 20,3 20,1 20,7 30,4 14,5% 10,8% 28,2 29,1 30,6 0,2% 11,6% Data Management and Technology 99,9 99,5 117,5 118,5 5,9% 51,3% 120,7 126,3 132,9 3,9% 48,7% Business Modernisation 26,8 26,3 29,1 43,6 17,6% 14,8% 47,8 49,7 53,6 7,1% 19,0% Total 199,6 202,9 210,7 235,6 5,7% 100,0% 250,0 261,6 276,0 5,4% 100,0% Change to 2014 Budget estimate (9,5) (3,6) (4,5) (5,2)
Economic classification Current payments 170,9 161,2 200,0 216,4 8,2% 88,2% 239,4 251,0 265,2 7,0% 95,0% Compensation of employees 86,0 93,8 104,4 114,6 10,0% 47,0% 128,2 135,9 144,4 8,0% 51,1% Goods and services 84,8 67,3 95,6 101,8 6,2% 41,2% 111,2 115,1 120,7 5,9% 43,9% of which: Communication 4,4 4,1 5,0 4,3 -1,5% 2,1% 6,3 6,6 7,3 19,5% 2,4% Computer services 62,2 50,1 83,9 82,5 9,8% 32,8% 80,6 85,4 88,2 2,3% 32,9% Consultants and professional services: Business and advisory services
2,5 1,2 0,4 2,9 4,2% 0,8% 3,9 3,2 4,4 15,1% 1,4%
Contractors 1,0 0,6 0,9 3,9 57,4% 0,8% 8,0 8,5 8,9 31,5% 2,9% Travel and subsistence 5,2 5,5 1,1 2,5 -22,1% 1,7% 4,6 3,8 4,1 18,3% 1,5% Operating payments 0,8 2,5 3,2 3,9 67,2% 1,2% 3,9 3,7 3,6 -2,6% 1,5% Transfers and subsidies 0,1 0,1 0,8 2,2 149,8% 0,4% – – – -100,0% 0,2% Public corporations and private enterprises – – – 2,2 – 0,3% – – – -100,0% 0,2% Households 0,1 0,1 0,8 – -100,0% 0,1% – – – – – Payments for capital assets 27,4 26,5 9,5 17,1 -14,6% 9,5% 10,6 10,6 10,9 -14,0% 4,8% Machinery and equipment 24,9 9,0 9,4 12,6 -20,3% 6,6% 10,6 10,6 10,9 -4,8% 4,4% Software and other intangible assets 2,5 17,5 – 4,5 21,3% 2,9% – – – -100,0% 0,4% Payments for financial assets 1,2 15,1 0,4 – -100,0% 2,0% – – – – – Total 199,6 202,9 210,7 235,6 5,7% 100,0% 250,0 261,6 276,0 5,4% 100,0% Proportion of total programme expenditure to vote expenditure
5,4% 11,5% 12,2% 10,5% 11,1% 10,5% 12,1%
Details of selected transfers and subsidies Public corporations and private enterprises Private enterprises Other transfers to private enterprises Current – – – 2,2 – 0,3% – – – -100,0% 0,2% Motion Boikanyo – – – 2,2 – 0,3% – – – -100,0% 0,2%

The South Africa I know, the home I understand
48
g) Expenditure trend analysis
The programme has spent R140,928 million of the allocated budget as at the end of January 2015. Of the total expenditure, R86,008 million was spent on compensation of employees, whilst R40,769 million was spent on goods and services, R11,861 million was spent on capital assets payment and R2,150 million was incurred on transfers representing a claim against state. The main cost drivers within operational costs are computer services (R29,043 million) for software licence renewals, communication (R5,493 million) and machinery and equipment (R10,616 million).
h) Personnel information
The graphic below outlines the personnel profile and related costs in terms of funded posts by level over the medium term:

The South Africa I know, the home I understand
49
2.6 Programme 6: Statistical Collection and Outreach
a) Programme purpose and objectives
Purpose: Provide data collection and dissemination services to inform policy processes and decision-making. Engage stakeholders through platforms and provide effective communication services. Promote statistical development and cooperation in South Africa, Africa and the world. Objectives • Increase awareness and the use of official statistics by government and the public by:
o reaching out to stakeholders and responding to user enquiries, improving accessibility and ease of use of statistical information, educating users, and conducting publicity campaigns on an ongoing basis.
• Manage external and internal communications on statistical matters by issuing daily, weekly and monthly information updates through the media on an ongoing basis.
• Provide integrated data collection services and disseminate quality statistics to provincial and local stakeholders and the public, by ensuring an average annual collection rate of 85 per cent.
• Ensure alignment with international standards, best practice and statistical skills development by increasing participation, sharing and learning in international statistical initiatives on an ongoing basis.
b) Reconciling performance targets and outputs with the budget for each subprogramme
Programme Management for Statistical Collection and Outreach provides strategic direction and leadership to the programme at a cost of R8,9 million.
Corporate Communications manages external and internal communications in the department. Key activities include compiling of internal and external publications and coordinating of training and campaigns to position and enhance the public image and credibility of the organisation. Key outputs for 2015/16 include improved relationships with media through training initiatives, new social media platforms for dissemination of statistics and campaigns for CS2016 and the new building projects at a cost of R17,2 million. Stakeholder Relations and Marketing maintains relations with stakeholders across the country. Key activities include marketing statistical products, educational campaigns on statistical usage and the conducting of an annual stakeholder satisfaction survey. Key outputs for 2015/16 include reports on user enquiries, stakeholder satisfaction, the CRM system, and segmentation of stakeholders and sector strategies at a cost of R19,9 million. Provincial and District Offices provides integrated data collection and dissemination services, and promotes the use and coordination of official statistics to provincial and local stakeholders. Key activities include data collection for surveys and collaboration and technical support to SANSS partners. Key outputs for 2015/16 include administering survey instruments for surveys, raising the profile and status of statistics at provincial and municipal levels, coordinating the Maths4Stats project, and providing training on the statistical quality assurance framework at a cost of R497 million.

The South Africa I know, the home I understand
50
International Statistical Development and Cooperation manages relations with international statistical agencies, promotes statistical development in Africa, builds partnerships and promotes the development of capacity for young statisticians on the African continent. Key activities include coordination of international collaboration and partnerships, and leading statistical development efforts in Africa. Key outputs for 2015/16 include frameworks for hosting international events and international engagements, a repository of lessons learnt in the 2010 Round of Population and Housing Censuses in Africa and reports on Stats SA's participation in the African Statistical system, increasing African statistics, international best practice, technical support provided in the implementation of SHaSA, and support for the development of an African Addendum for 2020 RPHC at a cost of R10,5 million.
c) Linking programmes strategic outcomes and objectives
Below is an outline how Programme 6 contributes to the achievement of strategic outcomes and objectives: Strategic outcome Strategic objective Informed nation Increase the use of official and other statistics Trusted statistics Innovate the statistics value chain
Increase stakeholder focus/Improve brand positioning Partners in statistics Strengthen international collaboration and partnerships
Lead statistical development in the region and on the continent A capable organisation Sustainable and responsive statistical infrastructure
d) Strategic intent of Statistical Collection and Outreach In order to ensure that South Africa is informed and empowered to make decisions based on statistical evidence, the communications, marketing and stakeholder management functions need to be in touch with the needs of all users. The key strategic thrust is to ensure that statistics are made easy to understand, well known by the users and public, reliable and are available timely and widely used. This dissemination agenda will be key to ensure increased public confidence and trust in statistics. The ease with which data can be accessed from Stats SA's database and the intuitive feel will receive priority attention during 2014/15. Stats SA will look into expanding the municipal dashboard broken down to municipal ward level, augmented by a map overlay. Further innovation to bring about the necessary technological changes will enhance dissemination and encourage easy access for the users. Increased use will require availing small area data for enhanced planning, monitoring and evaluation at district and local levels. The key strategic focus of provincial and district offices will be on constantly delivering cost-effective data collection services and dissemination of statistics at provincial and local levels. The use of technology will be a key thrust in improving data collection and improving administrative records at these levels. This will in turn give rise to active participation by other data producers at sub-national level. An improved geographic frame will be very critical for enhancing the use of technology, both in data collection and collation of administrative records. The provincial and district offices will have to meet the 'appetite' for province-specific surveys by the users. Both the conception of province-specific surveys and the absorptive capacity to use statistical data at sub-provincial levels will require developments in human capacity, both within Stats SA
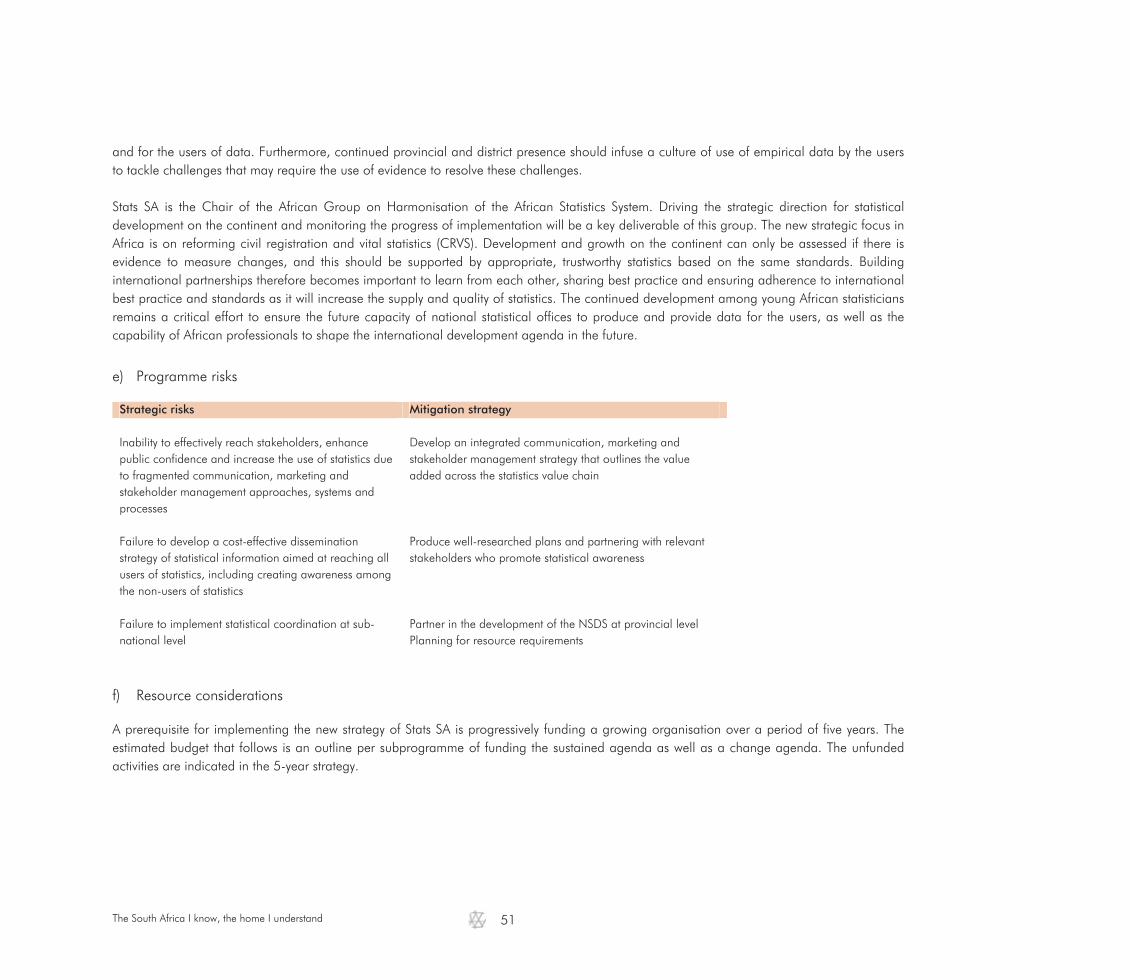
The South Africa I know, the home I understand
51
and for the users of data. Furthermore, continued provincial and district presence should infuse a culture of use of empirical data by the users to tackle challenges that may require the use of evidence to resolve these challenges. Stats SA is the Chair of the African Group on Harmonisation of the African Statistics System. Driving the strategic direction for statistical development on the continent and monitoring the progress of implementation will be a key deliverable of this group. The new strategic focus in Africa is on reforming civil registration and vital statistics (CRVS). Development and growth on the continent can only be assessed if there is evidence to measure changes, and this should be supported by appropriate, trustworthy statistics based on the same standards. Building international partnerships therefore becomes important to learn from each other, sharing best practice and ensuring adherence to international best practice and standards as it will increase the supply and quality of statistics. The continued development among young African statisticians remains a critical effort to ensure the future capacity of national statistical offices to produce and provide data for the users, as well as the capability of African professionals to shape the international development agenda in the future.
e) Programme risks Strategic risks Mitigation strategy Inability to effectively reach stakeholders, enhance public confidence and increase the use of statistics due to fragmented communication, marketing and stakeholder management approaches, systems and processes
Develop an integrated communication, marketing and stakeholder management strategy that outlines the value added across the statistics value chain
Failure to develop a cost-effective dissemination strategy of statistical information aimed at reaching all users of statistics, including creating awareness among the non-users of statistics
Produce well-researched plans and partnering with relevant stakeholders who promote statistical awareness
Failure to implement statistical coordination at sub-national level
Partner in the development of the NSDS at provincial level Planning for resource requirements
f) Resource considerations
A prerequisite for implementing the new strategy of Stats SA is progressively funding a growing organisation over a period of five years. The estimated budget that follows is an outline per subprogramme of funding the sustained agenda as well as a change agenda. The unfunded activities are indicated in the 5-year strategy.
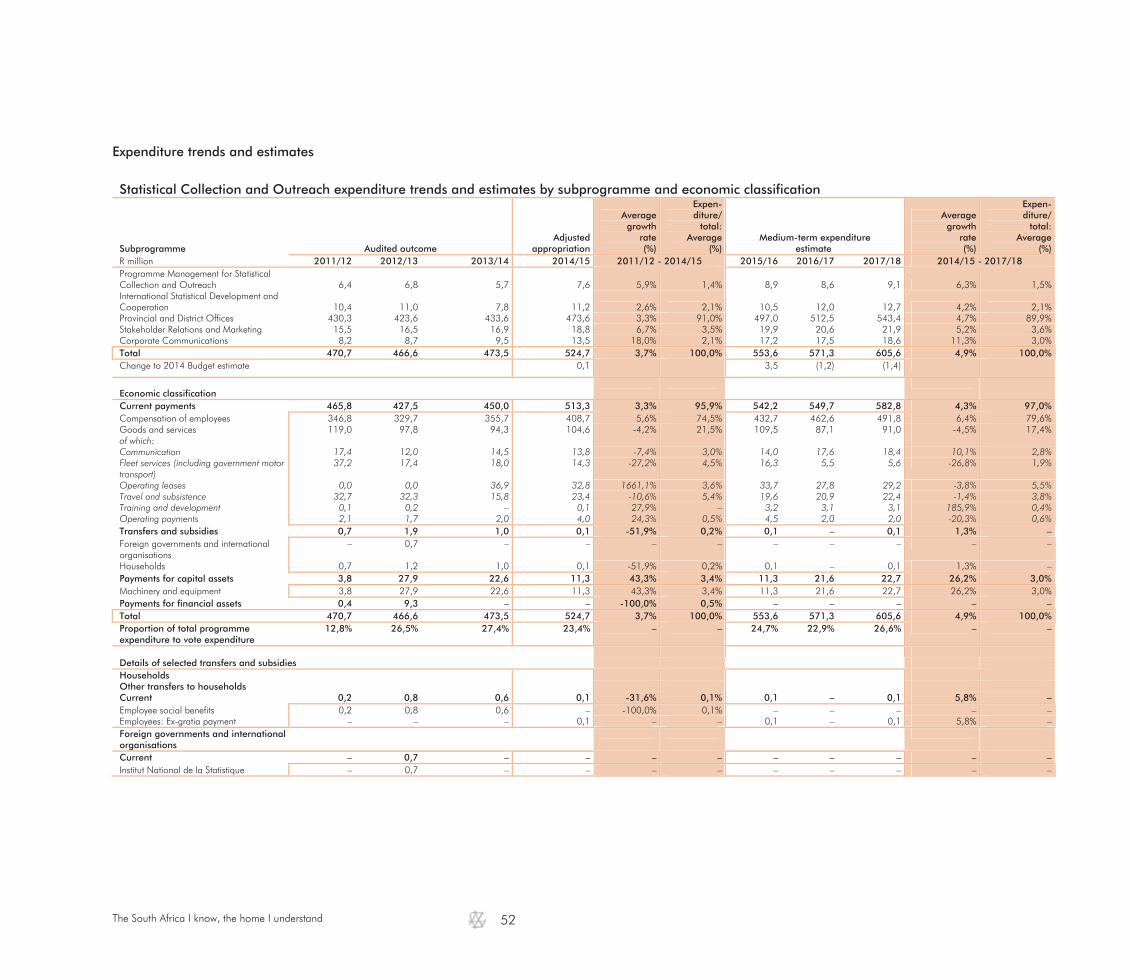
The South Africa I know, the home I understand
52
Expenditure trends and estimates Statistical Collection and Outreach expenditure trends and estimates by subprogramme and economic classification
Subprogramme Audited outcome Adjusted
appropriation
Averagegrowth
rate(%)
Expen-diture/
total:Average
(%) Medium-term expenditure
estimate
Averagegrowth
rate(%)
Expen- diture/
total: Average
(%) R million 2011/12 2012/13 2013/14 2014/15 2011/12 - 2014/15 2015/16 2016/17 2017/18 2014/15 - 2017/18 Programme Management for Statistical Collection and Outreach 6,4 6,8 5,7 7,6 5,9% 1,4% 8,9 8,6 9,1 6,3% 1,5% International Statistical Development and Cooperation 10,4 11,0 7,8 11,2 2,6% 2,1% 10,5 12,0 12,7 4,2% 2,1% Provincial and District Offices 430,3 423,6 433,6 473,6 3,3% 91,0% 497,0 512,5 543,4 4,7% 89,9% Stakeholder Relations and Marketing 15,5 16,5 16,9 18,8 6,7% 3,5% 19,9 20,6 21,9 5,2% 3,6% Corporate Communications 8,2 8,7 9,5 13,5 18,0% 2,1% 17,2 17,5 18,6 11,3% 3,0% Total 470,7 466,6 473,5 524,7 3,7% 100,0% 553,6 571,3 605,6 4,9% 100,0% Change to 2014 Budget estimate 0,1 3,5 (1,2) (1,4)
Economic classification
Current payments 465,8 427,5 450,0 513,3 3,3% 95,9% 542,2 549,7 582,8 4,3% 97,0% Compensation of employees 346,8 329,7 355,7 408,7 5,6% 74,5% 432,7 462,6 491,8 6,4% 79,6% Goods and services 119,0 97,8 94,3 104,6 -4,2% 21,5% 109,5 87,1 91,0 -4,5% 17,4% of which: Communication 17,4 12,0 14,5 13,8 -7,4% 3,0% 14,0 17,6 18,4 10,1% 2,8% Fleet services (including government motor transport)
37,2 17,4 18,0 14,3 -27,2% 4,5% 16,3 5,5 5,6 -26,8% 1,9%
Operating leases 0,0 0,0 36,9 32,8 1661,1% 3,6% 33,7 27,8 29,2 -3,8% 5,5% Travel and subsistence 32,7 32,3 15,8 23,4 -10,6% 5,4% 19,6 20,9 22,4 -1,4% 3,8% Training and development 0,1 0,2 – 0,1 27,9% – 3,2 3,1 3,1 185,9% 0,4% Operating payments 2,1 1,7 2,0 4,0 24,3% 0,5% 4,5 2,0 2,0 -20,3% 0,6% Transfers and subsidies 0,7 1,9 1,0 0,1 -51,9% 0,2% 0,1 – 0,1 1,3% – Foreign governments and international organisations
– 0,7 – – – – – – – – –
Households 0,7 1,2 1,0 0,1 -51,9% 0,2% 0,1 – 0,1 1,3% – Payments for capital assets 3,8 27,9 22,6 11,3 43,3% 3,4% 11,3 21,6 22,7 26,2% 3,0% Machinery and equipment 3,8 27,9 22,6 11,3 43,3% 3,4% 11,3 21,6 22,7 26,2% 3,0% Payments for financial assets 0,4 9,3 – – -100,0% 0,5% – – – – – Total 470,7 466,6 473,5 524,7 3,7% 100,0% 553,6 571,3 605,6 4,9% 100,0% Proportion of total programme expenditure to vote expenditure
12,8% 26,5% 27,4% 23,4% – – 24,7% 22,9% 26,6% – –
Details of selected transfers and subsidies Households Other transfers to households Current 0,2 0,8 0,6 0,1 -31,6% 0,1% 0,1 – 0,1 5,8% – Employee social benefits 0,2 0,8 0,6 – -100,0% 0,1% – – – – – Employees: Ex-gratia payment – – – 0,1 – – 0,1 – 0,1 5,8% – Foreign governments and international organisations
Current – 0,7 – – – – – – – – – Institut National de la Statistique – 0,7 – – – – – – – – –
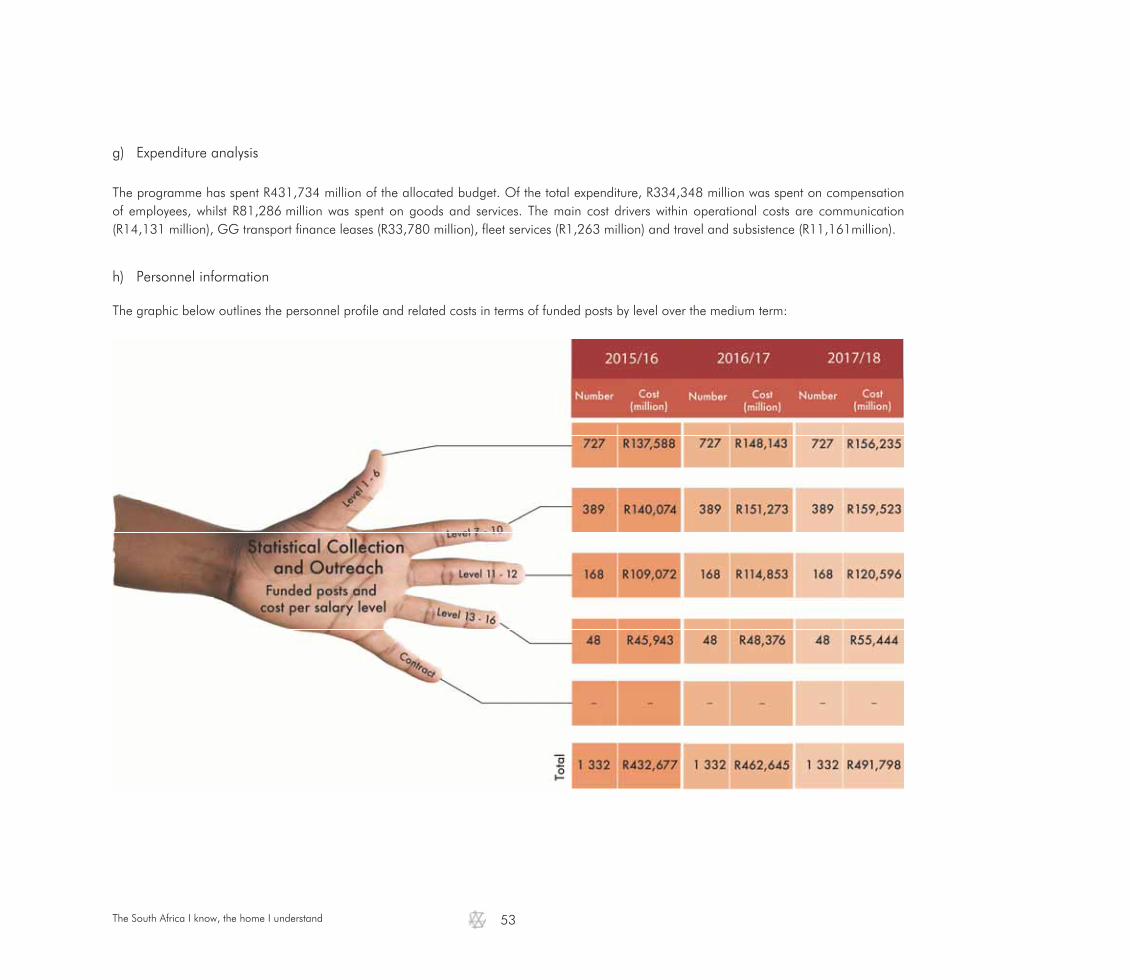
The South Africa I know, the home I understand
53
g) Expenditure analysis
The programme has spent R431,734 million of the allocated budget. Of the total expenditure, R334,348 million was spent on compensation of employees, whilst R81,286 million was spent on goods and services. The main cost drivers within operational costs are communication (R14,131 million), GG transport finance leases (R33,780 million), fleet services (R1,263 million) and travel and subsistence (R11,161million).
h) Personnel information
The graphic below outlines the personnel profile and related costs in terms of funded posts by level over the medium term:
The South Africa I know, the home I understand
54
2.7 Programme 7: Survey Operations a) Programme purpose and objectives
Purpose: Coordinate survey operations for household surveys, conduct independent survey monitoring and evaluation; and provide processing services to produce official statistics. Objectives • Increase the statistical information base for use by government, the private sector and the general public by conducting a population census
every 10 years and large scale population surveys between censuses. • Ensure the efficiency and effectiveness of survey operations conducted by the department by coordinating household survey operations with
an average collection rate of 85 per cent on an annual basis. • Improve the quality and timeliness of the editing and processing of statistical data by standardising the use of IT within the department on
an ongoing basis. • Conduct independent household survey monitoring and evaluation activities.
b) Reconciling performance targets and outputs with the budget for each subprogramme
Programme Management for Survey Operations provides strategic direction and leadership to the programme at a cost of R13,9 million. Censuses and Community Survey Operations conducts periodic population censuses and large scale population surveys. Key activities include integrated planning across different clusters and coordinating the collection and processing of data. Key outputs for 2015/16 include reports on coordination and testing of plans and data collection for CS2016, and data collection for the DHS at a cost of R114,5 million. Household Survey Operations coordinates and integrates collection activities across household surveys. Key activities include coordinating and monitoring data collection. Key outputs for 2015/16 include reports on questionnaires collected, master sample maintenance, training in survey operations, data collection systems in Stats SA and international practice on data collection methodologies at a cost of R22,4 million. Corporate Data Processing manages the editing and processing of data. Key activities include the processing of survey instruments such as questionnaires and diaries. Key outputs for 2015/16 include reports on processing and editing of questionnaires, and reports on strengthening a common data processing platform, pre-testing of digital data collection, and enhancing the data collection platform at a cost of R66,7 million. Survey Coordination, Monitoring and Evaluation monitors the quality of field operations of household surveys and censuses and conducts independent evaluations. Key activities include monitoring and evaluating household surveys. Key outputs for 2015/16 include reports on monitoring and evaluation of GHS, QLFS, CS2016, and DHS at a cost of R18,4 million.
The South Africa I know, the home I understand
55
c) Linking programmes strategic outcomes and objectives
Below is an outline how Programme 7 contributes to the achievement of strategic outcomes and objectives:
Strategic outcome Strategic objective
An informed nation Revolutionise data systems
Trusted statistics Innovate the statistics value chain
d) Strategic intent of Survey Operations
The overall strategic intent of the Survey Operations cluster is to provide cost-effective and efficient data collection and processing services as well as conducting independent monitoring and evaluation activities of household-based censuses and surveys in order to improve the quality and accuracy of data collected. This will be achieved through deploying an integrated survey operations model, systems and methods, as well as building capacity to run large scale survey operations such as a census. Over the medium term, this cluster will focus on the following activities to maintain and improve the way data are collected and processed through:
• Sustaining continuous data collection of existing surveys • Planning and driving a large scale population survey • Driving the implementation of a continuous population survey • Integrating survey and census data processing • Increasing processing of administrative data • Researching and introducing innovative data collection methodologies • Introducing a new listing methodology • Implementing common survey standards and framework for data collection and processing • Sustaining and improving process monitoring and evaluation of censuses and surveys • Improving the interface between Statistical Collection and Outreach, Population and Social Statistics and Survey Operations clusters.
The South Africa I know, the home I understand
56
e) Programme risks
Strategic risks Mitigation strategy Funding not secured to undertake a large scale population survey
Submit and secure commitment from Council, Minister and Treasury for undertaking a large scale population survey in 2016
Listing and maintenance of the new master sample for all household surveys
Reprioritisation of activities to secure funding for listing and maintenance of the new master sample
f) Resource considerations
A prerequisite for implementing the new strategy of Stats SA is progressively funding a growing organisation over a period of five years. The estimated budget that follows is an outline per subprogramme of funding the sustained agenda as well as a change agenda. The unfunded activities are indicated in the 5-year strategy.
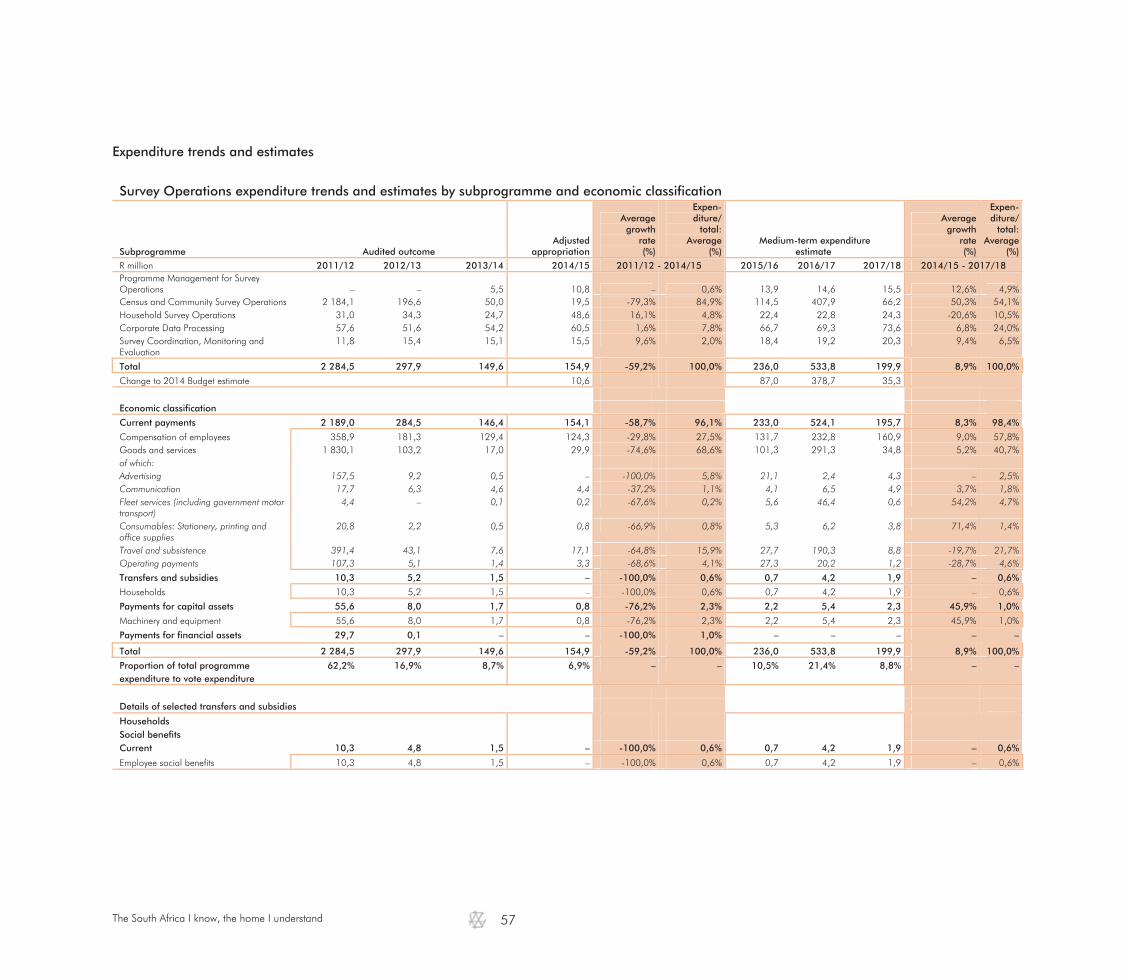
The South Africa I know, the home I understand
57
Expenditure trends and estimates
Survey Operations expenditure trends and estimates by subprogramme and economic classification
Subprogramme Audited outcome Adjusted
appropriation
Averagegrowth
rate(%)
Expen-diture/
total:Average
(%) Medium-term expenditure
estimate
Averagegrowth
rate(%)
Expen- diture/
total: Average
(%) R million 2011/12 2012/13 2013/14 2014/15 2011/12 - 2014/15 2015/16 2016/17 2017/18 2014/15 - 2017/18 Programme Management for Survey Operations – – 5,5 10,8 – 0,6% 13,9 14,6 15,5 12,6% 4,9% Census and Community Survey Operations 2 184,1 196,6 50,0 19,5 -79,3% 84,9% 114,5 407,9 66,2 50,3% 54,1% Household Survey Operations 31,0 34,3 24,7 48,6 16,1% 4,8% 22,4 22,8 24,3 -20,6% 10,5% Corporate Data Processing 57,6 51,6 54,2 60,5 1,6% 7,8% 66,7 69,3 73,6 6,8% 24,0% Survey Coordination, Monitoring and Evaluation
11,8 15,4 15,1 15,5 9,6% 2,0% 18,4 19,2 20,3 9,4% 6,5%
Total 2 284,5 297,9 149,6 154,9 -59,2% 100,0% 236,0 533,8 199,9 8,9% 100,0%
Change to 2014 Budget estimate 10,6 87,0 378,7 35,3
Economic classification
Current payments 2 189,0 284,5 146,4 154,1 -58,7% 96,1% 233,0 524,1 195,7 8,3% 98,4%
Compensation of employees 358,9 181,3 129,4 124,3 -29,8% 27,5% 131,7 232,8 160,9 9,0% 57,8% Goods and services 1 830,1 103,2 17,0 29,9 -74,6% 68,6% 101,3 291,3 34,8 5,2% 40,7% of which: Advertising 157,5 9,2 0,5 – -100,0% 5,8% 21,1 2,4 4,3 – 2,5% Communication 17,7 6,3 4,6 4,4 -37,2% 1,1% 4,1 6,5 4,9 3,7% 1,8% Fleet services (including government motor transport)
4,4 – 0,1 0,2 -67,6% 0,2% 5,6 46,4 0,6 54,2% 4,7%
Consumables: Stationery, printing and office supplies
20,8 2,2 0,5 0,8 -66,9% 0,8% 5,3 6,2 3,8 71,4% 1,4%
Travel and subsistence 391,4 43,1 7,6 17,1 -64,8% 15,9% 27,7 190,3 8,8 -19,7% 21,7% Operating payments 107,3 5,1 1,4 3,3 -68,6% 4,1% 27,3 20,2 1,2 -28,7% 4,6%
Transfers and subsidies 10,3 5,2 1,5 – -100,0% 0,6% 0,7 4,2 1,9 – 0,6%
Households 10,3 5,2 1,5 – -100,0% 0,6% 0,7 4,2 1,9 – 0,6%
Payments for capital assets 55,6 8,0 1,7 0,8 -76,2% 2,3% 2,2 5,4 2,3 45,9% 1,0%
Machinery and equipment 55,6 8,0 1,7 0,8 -76,2% 2,3% 2,2 5,4 2,3 45,9% 1,0%
Payments for financial assets 29,7 0,1 – – -100,0% 1,0% – – – – –
Total 2 284,5 297,9 149,6 154,9 -59,2% 100,0% 236,0 533,8 199,9 8,9% 100,0%
Proportion of total programme expenditure to vote expenditure
62,2% 16,9% 8,7% 6,9% – – 10,5% 21,4% 8,8% – –
Details of selected transfers and subsidies
Households Social benefits Current 10,3 4,8 1,5 – -100,0% 0,6% 0,7 4,2 1,9 – 0,6%
Employee social benefits 10,3 4,8 1,5 – -100,0% 0,6% 0,7 4,2 1,9 – 0,6%
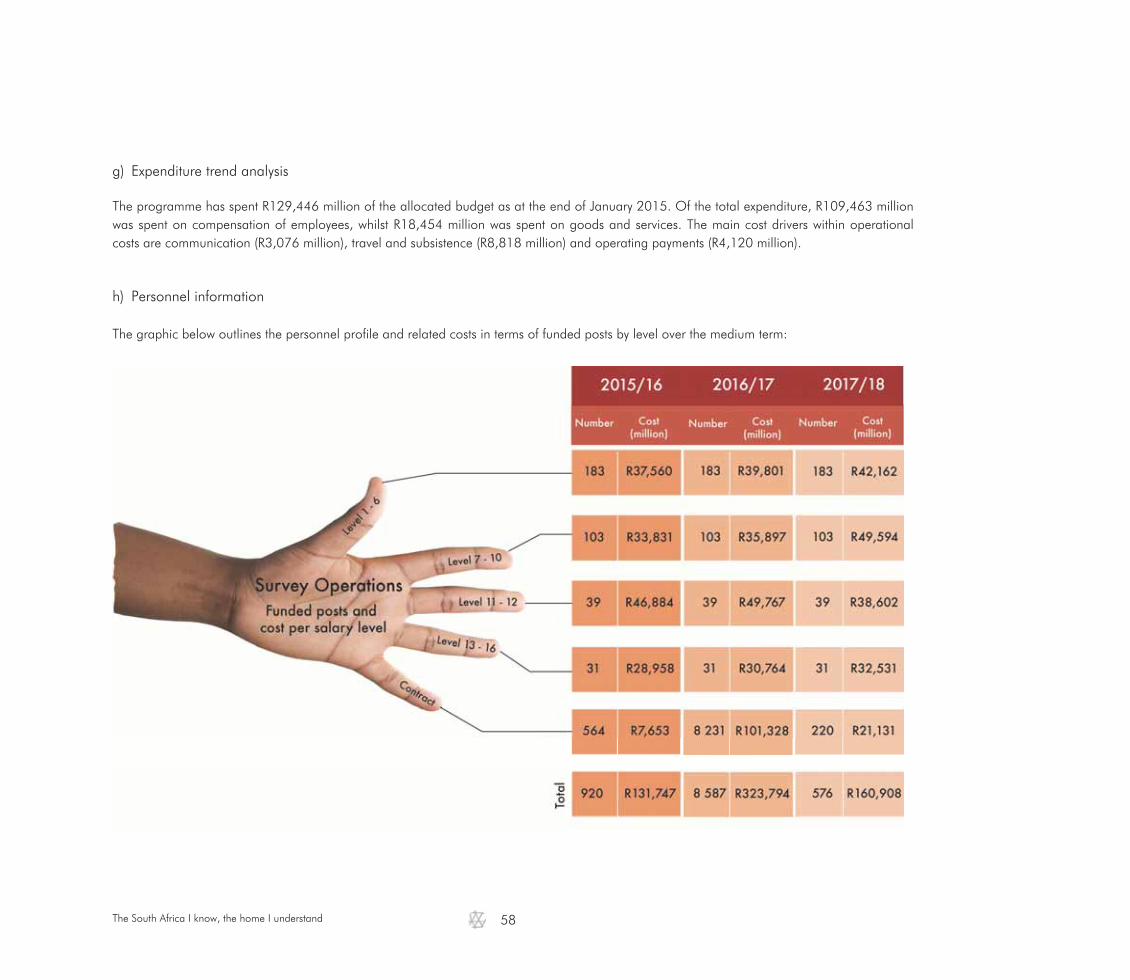
The South Africa I know, the home I understand
58
g) Expenditure trend analysis
The programme has spent R129,446 million of the allocated budget as at the end of January 2015. Of the total expenditure, R109,463 million was spent on compensation of employees, whilst R18,454 million was spent on goods and services. The main cost drivers within operational costs are communication (R3,076 million), travel and subsistence (R8,818 million) and operating payments (R4,120 million).
h) Personnel information
The graphic below outlines the personnel profile and related costs in terms of funded posts by level over the medium term:


Annual performance planChapter 3
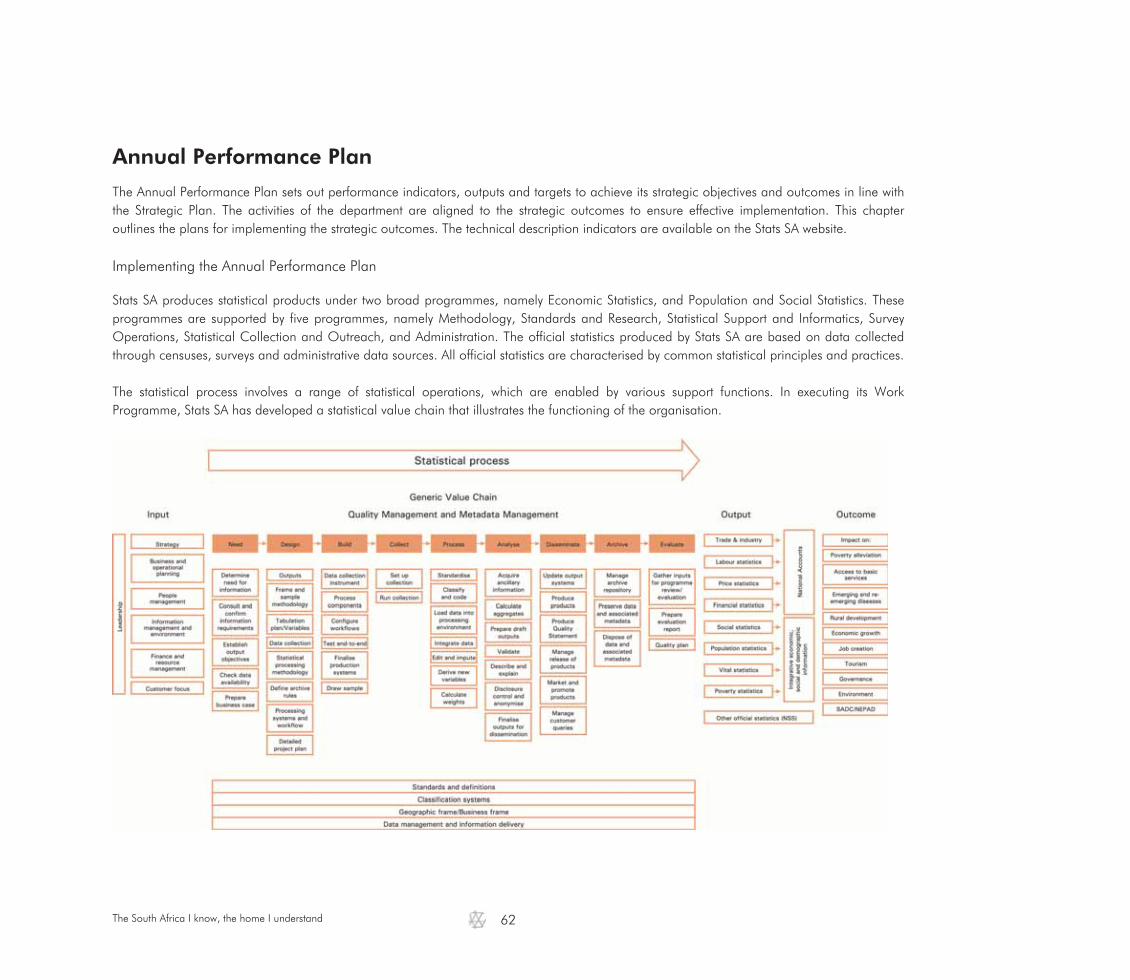
The South Africa I know, the home I understand
62
Annual Performance Plan
The Annual Performance Plan sets out performance indicators, outputs and targets to achieve its strategic objectives and outcomes in line with the Strategic Plan. The activities of the department are aligned to the strategic outcomes to ensure effective implementation. This chapter outlines the plans for implementing the strategic outcomes. The technical description indicators are available on the Stats SA website. Implementing the Annual Performance Plan
Stats SA produces statistical products under two broad programmes, namely Economic Statistics, and Population and Social Statistics. These programmes are supported by five programmes, namely Methodology, Standards and Research, Statistical Support and Informatics, Survey Operations, Statistical Collection and Outreach, and Administration. The official statistics produced by Stats SA are based on data collected through censuses, surveys and administrative data sources. All official statistics are characterised by common statistical principles and practices. The statistical process involves a range of statistical operations, which are enabled by various support functions. In executing its Work Programme, Stats SA has developed a statistical value chain that illustrates the functioning of the organisation.
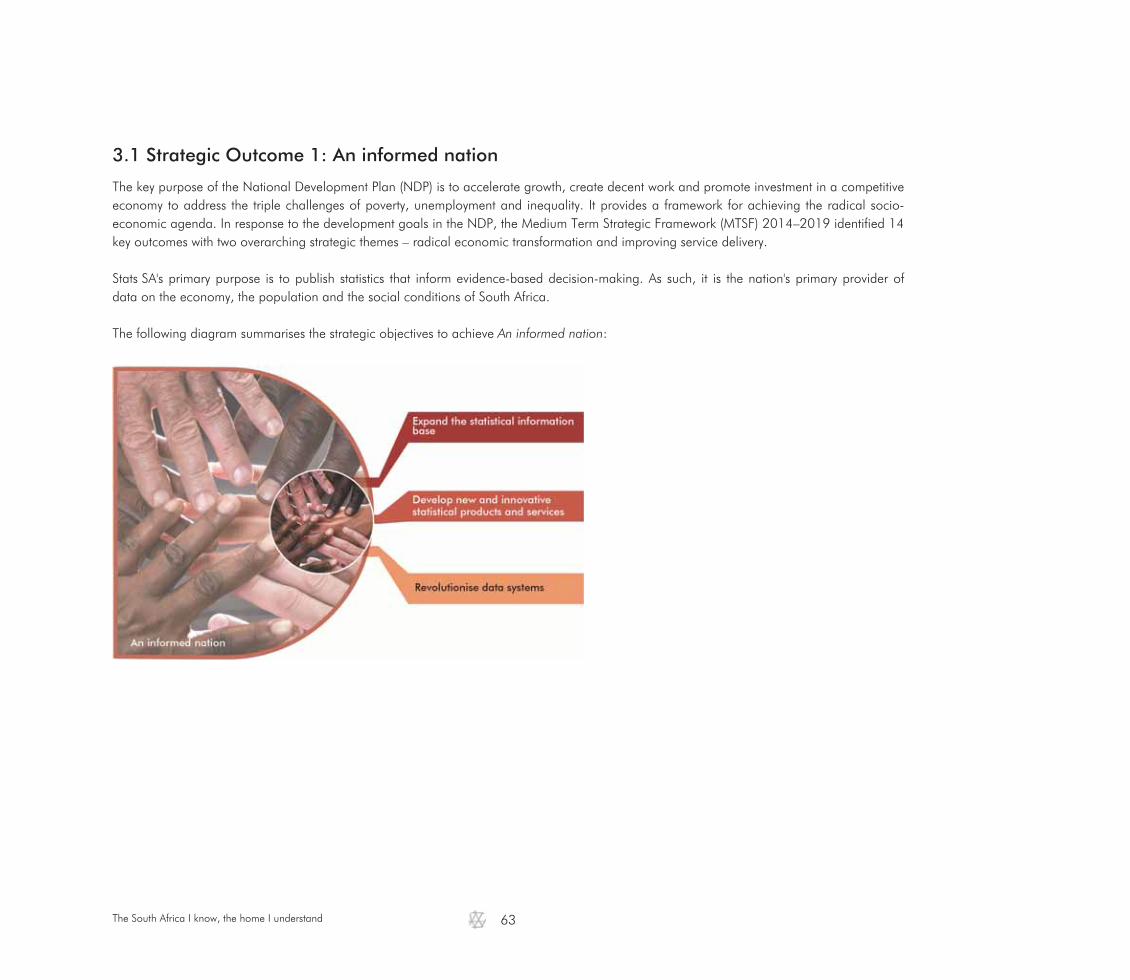
The South Africa I know, the home I understand
63
3.1 Strategic Outcome 1: An informed nation The key purpose of the National Development Plan (NDP) is to accelerate growth, create decent work and promote investment in a competitive economy to address the triple challenges of poverty, unemployment and inequality. It provides a framework for achieving the radical socio-economic agenda. In response to the development goals in the NDP, the Medium Term Strategic Framework (MTSF) 2014–2019 identified 14 key outcomes with two overarching strategic themes – radical economic transformation and improving service delivery. Stats SA's primary purpose is to publish statistics that inform evidence-based decision-making. As such, it is the nation's primary provider of data on the economy, the population and the social conditions of South Africa. The following diagram summarises the strategic objectives to achieve An informed nation:
The South Africa I know, the home I understand
64
Below is a detailed outline of each strategic objective.
3.1.1 Expand the statistical information base Strategic objective 1.1: Expand the statistical information base by increasing its depth, breadth and geographic spread Objective statement: Inform socio-economic planning, monitoring and decision-making by providing accurate, relevant and timely
economic, population and social statistics through the application of internationally recognised practices by publishing monthly, quarterly, annual and periodic statistical information
Baseline: Number of statistical releases on a monthly, quarterly and annual basis: 159 releases Justification: This objective will contribute to measuring the progress, development and transformation of the economy,
society and environment Links: This objective links to the NDP, MTSF and SDGs

The South Africa I know, the home I understand
65
Expanding the statistical information base to measure the development and transformation of the economy and society is not the responsibility of Stats SA alone. It requires a national effort by organs of state in collaboration with Stats SA. In response to the demand for statistical information by users at national, continental and international levels, Stats SA defined the following statistical themes to coordinate the statistical landscape in the country.
Measurable development outcomes Statistical themes
Decent employment through inclusive economic growth
Economic dynamics Price stability Employment, job creation and decent work
Population Dynam
ics
An efficient, competitive and responsive economic infrastructure network Vibrant, equitable, sustainable rural communities contributing towards food security for all Rural development and food security Protect and enhance environmental assets and natural resources Sustainable resource management A long and healthy life for South Africans Health All people in South Africa are and feel safe Safety and security Quality basic education Education
Skilled and capable workforce to support an inclusive growth path
Sustainable human settlements and improved quality of household life Living conditions, service delivery and poverty A comprehensive, responsive and sustainable social protection system (new)
Responsive, accountable, effective and efficient local government system Create a better South Africa, a better Africa and a better world Peace and stability An efficient, effective and development-oriented public service Governance A diverse, socially cohesive society with a common national identity Active citizenship/social cohesion
Statistical information is collected through either surveys/censuses conducted mostly by Stats SA, or administrative records maintained by line ministries. Stats SA is mandated through the Statistics Act to coordinate these statistics in the country. Key deliverables to expand the statistical information base under each statistical theme are outlined below:
i) Economic dynamics
Policy context: An inclusive and dynamic economy requires that the country should urgently launch the virtuous cycle that allows it to move to a new growth trajectory. Critically, economic policy must reduce unnecessary hindrances to growth and increase growth-enhancing investment, while fundamentally changing the structure of our economy. Growth requires new kinds of production and more equitable ownership in order to enhance employment creation and broaden access to the benefits of the economic development (MTSF: 2014–2019). Investment and initiative by both the private and the public sectors are required for our economic growth and fiscal sustainability. The National Development Plan calls for private and public sector investment to reach 30 per cent of GDP. Progress has been made and public sector spending on infrastructure has doubled over the past five years. However, there is still a long way to go if we are to achieve investment-led growth, which is the centrepiece of our development strategy (MTBPS: 2014).
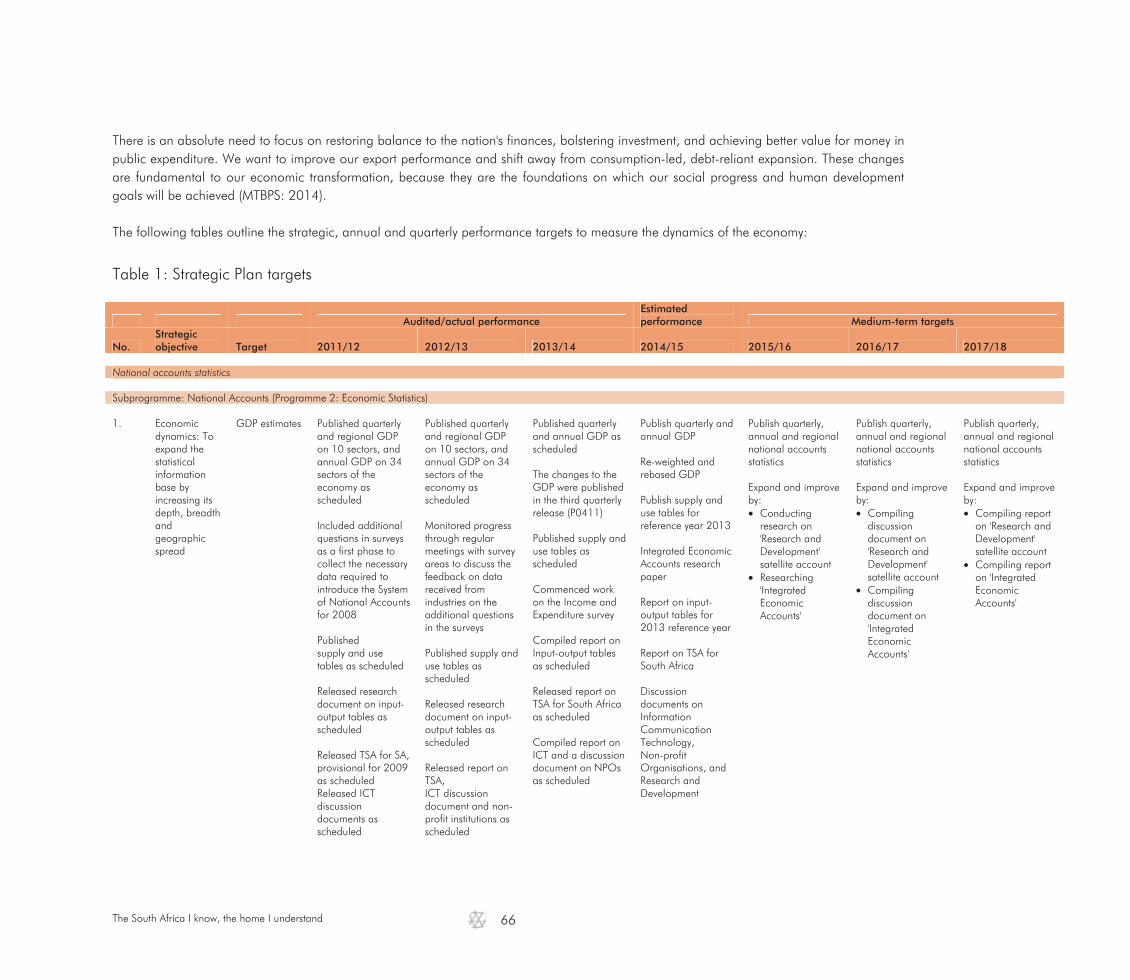
The South Africa I know, the home I understand
66
There is an absolute need to focus on restoring balance to the nation's finances, bolstering investment, and achieving better value for money in public expenditure. We want to improve our export performance and shift away from consumption-led, debt-reliant expansion. These changes are fundamental to our economic transformation, because they are the foundations on which our social progress and human development goals will be achieved (MTBPS: 2014). The following tables outline the strategic, annual and quarterly performance targets to measure the dynamics of the economy:
Table 1: Strategic Plan targets
Audited/actual performance Estimated performance Medium-term targets
No. Strategic objective Target 2011/12 2012/13 2013/14 2014/15 2015/16 2016/17 2017/18
National accounts statistics Subprogramme: National Accounts (Programme 2: Economic Statistics) 1. Economic
dynamics: To expand the statistical information base by increasing its depth, breadth and geographic spread
GDP estimates Published quarterly and regional GDP on 10 sectors, and annual GDP on 34 sectors of the economy as scheduled Included additional questions in surveys as a first phase to collect the necessary data required to introduce the System of National Accounts for 2008 Published supply and use tables as scheduled Released research document on input-output tables as scheduled Released TSA for SA, provisional for 2009 as scheduled Released ICT discussion documents as scheduled
Published quarterly and regional GDP on 10 sectors, and annual GDP on 34 sectors of the economy as scheduled Monitored progress through regular meetings with survey areas to discuss the feedback on data received from industries on the additional questions in the surveys Published supply and use tables as scheduled Released research document on input-output tables as scheduled Released report on TSA, ICT discussion document and non-profit institutions as scheduled
Published quarterly and annual GDP as scheduled The changes to the GDP were published in the third quarterly release (P0411) Published supply and use tables as scheduled Commenced work on the Income and Expenditure survey Compiled report on Input-output tables as scheduled Released report on TSA for South Africa as scheduled Compiled report on ICT and a discussion document on NPOs as scheduled
Publish quarterly and annual GDP Re-weighted and rebased GDP Publish supply and use tables for reference year 2013 Integrated Economic Accounts research paper Report on input-output tables for 2013 reference year Report on TSA for South Africa Discussion documents on Information Communication Technology, Non-profit Organisations, and Research and Development
Publish quarterly, annual and regional national accounts statistics Expand and improve by: Conducting
research on 'Research and Development' satellite account
Researching 'Integrated Economic Accounts'
Publish quarterly, annual and regional national accounts statistics Expand and improve by: Compiling
discussion document on 'Research and Development' satellite account
Compiling discussion document on 'Integrated Economic Accounts'
Publish quarterly, annual and regional national accounts statistics Expand and improve by: Compiling report
on 'Research and Development' satellite account
Compiling report on 'Integrated Economic Accounts'

The South Africa I know, the home I understand
67
Table 1: Strategic Plan targets (continued)
Audited/actual performance Estimated performance Medium-term targets
No. Strategic objective Target 2011/12 2012/13 2013/14 2014/15 2015/16 2016/17 2017/18
National accounts statistics Subprogramme: Economic Analysis (Programme 2: Economic Statistics) 2. Economic
dynamics: To expand the statistical information base by increasing its depth, breadth and geographic spread
GDP estimates from the expenditure approach
Completed research reports on the independent calculation of all GDP estimates
A capacity building programme was initiated in 2012 to publish the complete quarterly national accounts of South Africa
Produced four GDP expenditure simulated estimates for all quarters of 2013
Shadow expenditure approach estimates annually
Expand national accounts statistics by: Introducing a set
of shadow GDP expenditure estimates
Compiling detailed Supply-and-Use Tables
Expand national accounts statistics by: Continuing
production of shadow accounts and initiating review process
Reviewing and improving data sources (based on research matrix)
Expand national accounts statistics by: Developing and
implementing certification process for shadow estimates
Reviewing and improving data sources
3. Economic
dynamics: To expand the statistical information base by increasing its depth, breadth and geographic spread
Research reports on economic activity
Completed research reports on calculation of GDP estimates on income approach Completed 5 integrative research reports Assessed quality of data sources
Completed research reports on calculation of GDP estimates on income approach as scheduled Completed as part of integrative research report on regional estimates Completed 5 research reports Assessed quality of data sources
Compiled 3 research papers covering the government sector, estimates of owner-occupied dwellings, and domestic workers Compiled report on the state of South Africa's economy Compiled 3 research reports on integrated economic indicators Compiled quarterly flash estimates on GDP
Develop methodology and plans to compile independent expenditure approach quarterly Develop strategy for expanding the regional statistics information base based on enterprises in the business sampling frame Integrative research report
Expand economic statistics by: Researching the
development of regional economic indicators
Publishing thematic reports on the dynamics of the economy
Expand economic statistics by: Compiling a
discussion document on regional economic indicators
Publishing thematic reports on the dynamics of the economy
Expand economic statistics by: Implementing
research outcomes on regional economic indicators
Publishing thematic reports on the dynamics of the economy

The South Africa I know, the home I understand
68
Table 1: Strategic Plan targets (continued)
Audited/actual performance Estimated performance Medium-term targets
No. Strategic objective Target 2011/12 2012/13 2013/14 2014/15 2015/16 2016/17 2017/18
Industrial statistics: Agriculture, hunting, forestry and fishing; Mining and quarrying; Manufacturing; Electricity, gas and water supply; Construction; Wholesale and retail trade, repair of motor vehicles, motorcycles and personal and household goods; Transport, storage and communication; Financial intermediation, insurance, real estate and business services; Community, social and personal services; Hotels and restaurants Subprogramme: Short-term Indicator Statistics (Programme 2: Economic Statistics) 4. Economic
dynamics: To expand the statistical information base by increasing its depth, breadth and geographic spread
Statistical information on turnover and volumes
Published monthly, quarterly and annual statistical releases on 8 economic sectors as scheduled Introduced quality improvements: • Seasonal
adjustments • Deflators
Published monthly, quarterly and annual statistical releases on 8 economic sectors as scheduled Compiled research reports on Transport, Communication and Real Estate
Published monthly, quarterly and annual statistical releases on 8 economic sectors as scheduled Finalised the report on the fisheries sector feasibility study in March 2014
Publish monthly, quarterly and annual statistical releases on 8 economic sectors Enhance surveys on: Real estate,
community, social and personal service
Publish monthly, quarterly and annual industry and trade statistics Expand and improve by: Seasonal
adjustment using X-12 (Manufacturing production and sales; Utilisation of manufacturing capacity; Building statistics)
Introducing deflation (Tourist accommodation (2012); Food and beverages (2012))
Weights for manufacturing utilisation of production capacity (2012)
Publish monthly, quarterly and annual industry and trade statistics Expand and improve by: Piloting the
research on retail product
Seasonal adjustment using X-12: (Tourist accommodation; Food and beverages)
Weights for deflators (Retail 2012)
Weights for indices (Manufacturing (2013); Mining (2013); Manufacturing production capacity (2013))
Publish monthly, quarterly and annual industry and trade statistics Expand and improve by: Publishing the
results of the retail products
Introducing new survey(s) to measure services sector (selected in SIC 7, 8 or 9)
Seasonal adjustment using X-12 (Land transport)
SASQAF self-assessment (Mining)
Review M&E research findings on imputing size group 4 cases
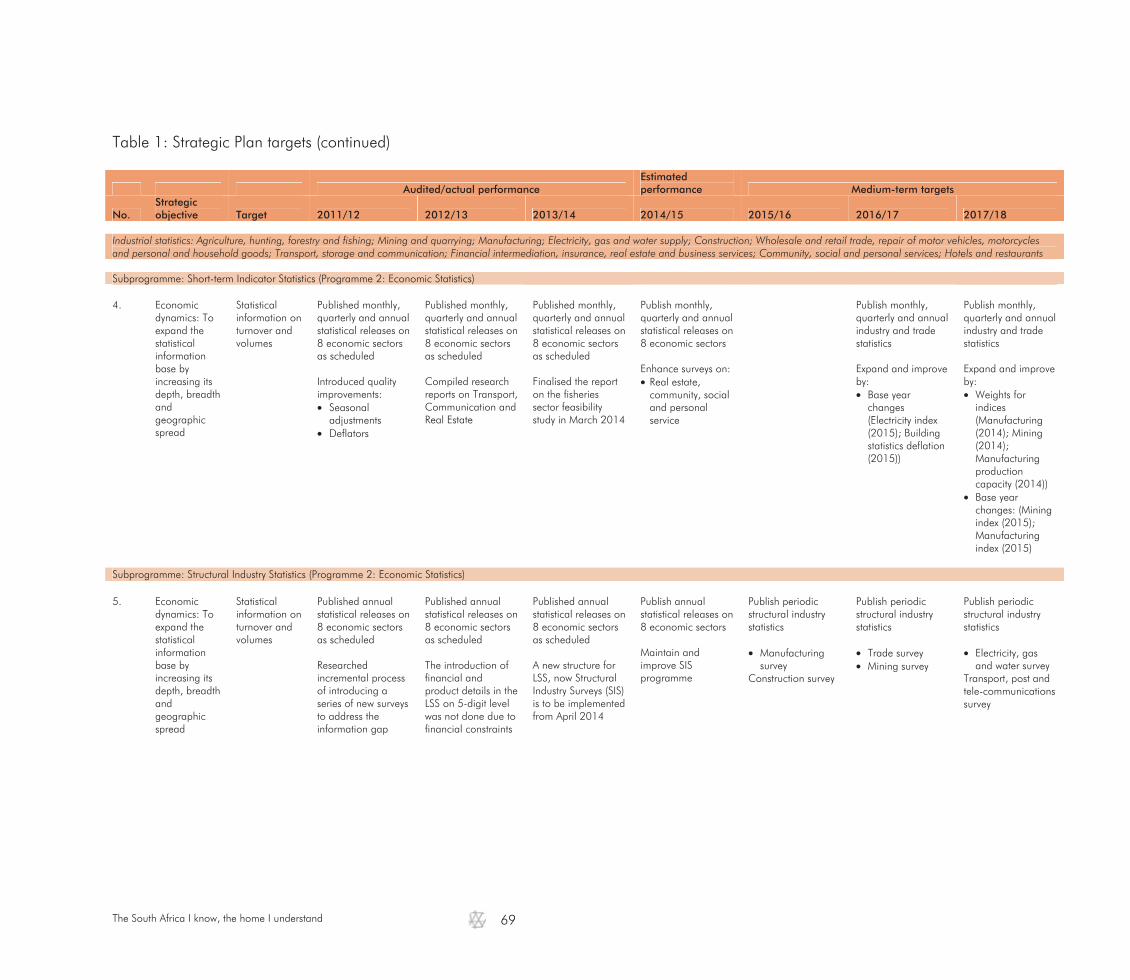
The South Africa I know, the home I understand
69
Table 1: Strategic Plan targets (continued)
Audited/actual performance Estimated performance Medium-term targets
No. Strategic objective Target 2011/12 2012/13 2013/14 2014/15 2015/16 2016/17 2017/18
Industrial statistics: Agriculture, hunting, forestry and fishing; Mining and quarrying; Manufacturing; Electricity, gas and water supply; Construction; Wholesale and retail trade, repair of motor vehicles, motorcycles and personal and household goods; Transport, storage and communication; Financial intermediation, insurance, real estate and business services; Community, social and personal services; Hotels and restaurants Subprogramme: Short-term Indicator Statistics (Programme 2: Economic Statistics) 4. Economic
dynamics: To expand the statistical information base by increasing its depth, breadth and geographic spread
Statistical information on turnover and volumes
Published monthly, quarterly and annual statistical releases on 8 economic sectors as scheduled Introduced quality improvements: Seasonal
adjustments Deflators
Published monthly, quarterly and annual statistical releases on 8 economic sectors as scheduled Compiled research reports on Transport, Communication and Real Estate
Published monthly, quarterly and annual statistical releases on 8 economic sectors as scheduled Finalised the report on the fisheries sector feasibility study in March 2014
Publish monthly, quarterly and annual statistical releases on 8 economic sectors Enhance surveys on: Real estate, community, social and personal service
Publish monthly, quarterly and annual industry and trade statistics Expand and improve by: Base year
changes (Electricity index (2015); Building statistics deflation (2015))
Publish monthly, quarterly and annual industry and trade statistics Expand and improve by: Weights for
indices (Manufacturing (2014); Mining (2014); Manufacturing production capacity (2014))
Base year changes: (Mining index (2015); Manufacturing index (2015)
Subprogramme: Structural Industry Statistics (Programme 2: Economic Statistics) 5. Economic
dynamics: To expand the statistical information base by increasing its depth, breadth and geographic spread
Statistical information on turnover and volumes
Published annual statistical releases on 8 economic sectors as scheduled Researched incremental process of introducing a series of new surveys to address the information gap
Published annual statistical releases on 8 economic sectors as scheduled The introduction of financial and product details in the LSS on 5-digit level was not done due to financial constraints
Published annual statistical releases on 8 economic sectors as scheduled A new structure for LSS, now Structural Industry Surveys (SIS) is to be implemented from April 2014
Publish annual statistical releases on 8 economic sectors Maintain and improve SIS programme
Publish periodic structural industry statistics Manufacturing
survey Construction survey
Publish periodic structural industry statistics Trade survey Mining survey
Publish periodic structural industry statistics Electricity, gas
and water survey Transport, post and tele-communications survey
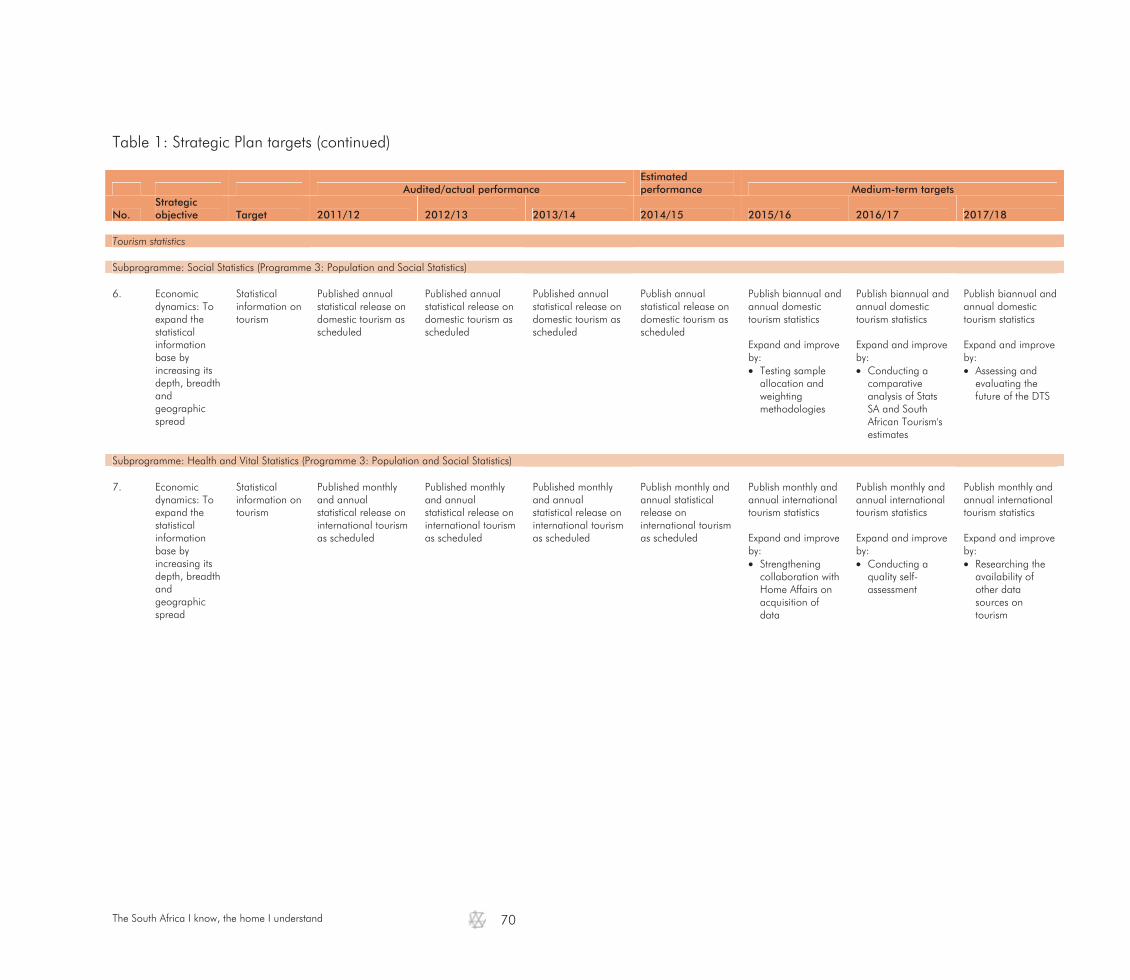
The South Africa I know, the home I understand
70
Table 1: Strategic Plan targets (continued)
Audited/actual performance Estimated performance Medium-term targets
No. Strategic objective Target 2011/12 2012/13 2013/14 2014/15 2015/16 2016/17 2017/18
Tourism statistics Subprogramme: Social Statistics (Programme 3: Population and Social Statistics) 6. Economic
dynamics: To expand the statistical information base by increasing its depth, breadth and geographic spread
Statistical information on tourism
Published annual statistical release on domestic tourism as scheduled
Published annual statistical release on domestic tourism as scheduled
Published annual statistical release on domestic tourism as scheduled
Publish annual statistical release on domestic tourism as scheduled
Publish biannual and annual domestic tourism statistics Expand and improve by: Testing sample
allocation and weighting methodologies
Publish biannual and annual domestic tourism statistics Expand and improve by: Conducting a
comparative analysis of Stats SA and South African Tourism's estimates
Publish biannual and annual domestic tourism statistics Expand and improve by: Assessing and
evaluating the future of the DTS
Subprogramme: Health and Vital Statistics (Programme 3: Population and Social Statistics) 7. Economic
dynamics: To expand the statistical information base by increasing its depth, breadth and geographic spread
Statistical information on tourism
Published monthly and annual statistical release on international tourism as scheduled
Published monthly and annual statistical release on international tourism as scheduled
Published monthly and annual statistical release on international tourism as scheduled
Publish monthly and annual statistical release on international tourism as scheduled
Publish monthly and annual international tourism statistics Expand and improve by: Strengthening
collaboration with Home Affairs on acquisition of data
Publish monthly and annual international tourism statistics Expand and improve by: Conducting a
quality self-assessment
Publish monthly and annual international tourism statistics Expand and improve by: Researching the
availability of other data sources on tourism

The South Africa I know, the home I understand
71
Table 1: Strategic Plan targets (continued)
Audited/actual performance Estimated performance Medium-term targets
No. Strategic objective Target 2011/12 2012/13 2013/14 2014/15 2015/16 2016/17 2017/18
Transport statistics Subprogramme: Social Statistics (Programme 3: Population and Social Statistics) 8. Economic
dynamics: To expand the statistical information base by increasing its depth, breadth and geographic spread
Statistical information on the transport sector
Publish 5-yearly transport statistics (no publication) Expand and improve by: Publishing a
thematic report on transport
Developing and reviewing editing, analysis and reporting systems and processes for Road Traffic Management Corporation (RTMC)
Publish 5-yearly transport statistics (no publication) Expand and improve by: Driving the NHTS
pilot for digital data collection
Providing technical support to improve RTMC data systems
Publish 5-yearly transport statistics (no publication) Expand and improve by: Providing
technical support to improve RTMC data systems
Financial statistics Subprogramme: Private Sector Financial Statistics (Programme 2: Economic Statistics) 9. Economic
dynamics: To expand the statistical information base by increasing its depth, breadth and geographic spread
Financial statistics of private sector enterprises
Published quarterly and annual statistical releases as scheduled Commenced with the review of the Annual Financial Statistics (AFS) and Large Sample Survey (LSS) programme
Published quarterly and annual statistical releases as scheduled Introduced collection of all sectors in the AFS on 4-digit level
Published quarterly and annual statistical releases as schedule The introduction of business demographics was not done
Publish quarterly and annual statistics of private sector enterprises
Publish quarterly and annual private sector financial statistics Expand and improve by Reviewing QFS at
lower SIC level Engaging
stakeholders on research initiatives
Publish quarterly and annual private sector financial statistics Expand and improve by Reviewing sample
specifications and estimates at lower SIC level
Engaging stakeholders on research initiatives
Publish quarterly and annual private sector financial statistics Expand and improve by Reviewing sample
specifications and estimates at lower SIC level
Engaging stakeholders and promoting surveys

The South Africa I know, the home I understand
72
Table 1: Strategic Plan targets (concluded)
Audited/actual performance Estimated performance Medium-term targets
No. Strategic objective Target 2011/12 2012/13 2013/14 2014/15 2015/16 2016/17 2017/18
Subprogramme: Government Financial Statistics (Programme 2: Economic Statistics) 10. Economic
dynamics: To expand the statistical information base by increasing its depth, breadth and geographic spread
Financial statistics of: • National
government • Extra
budgetary accounts and funds
• Provincial government
• Higher education institutions
• Consolida-ted general government
• Capital expenditure of public sector
• Municipali-ties
Published quarterly and annual statistical releases as scheduled Researched expansion of existing datasets particularly for the national accounts
Published quarterly and annual statistical releases as scheduled The Public Sector Classification Committee has commenced its technical mandate during 2012 and has begun classifying the various institutions
Published quarterly and annual statistical releases as scheduled Research was not conducted Research was conducted in 2013/14
Publish quarterly and annual statistics of government Introduce quarterly estimate of general government expenditure
Publish quarterly and annual government financial statistics Expand and improve by: Researching the
feasibility of QFSM data at lower level
Coordinating and participating in Government financial statistics user specific groups
Improving response rates for QFSM and reducing the time frame for annual surveys
Publish quarterly and annual government financial statistics Expand and improve by Piloting QFSM
data at lower level Researching
quarterly estimates of general government expenditure
Collaborating and partnering with National Treasury and DCoG on data coordination from municipalities
Publish quarterly and annual government financial statistics Expand and improve by Publishing QFSM
data at lower level Publishing time
series data for GFS surveys
Designing methodology of quarterly estimates of general government expenditure
Developing and hosting selected databases for municipal data

The South Africa I know, the home I understand
73
Table 2: Annual Performance Plan targets: 2015/16
Audited/actual performance Estimated performance Medium-term targets
No. Performance indicator 2011/12 2012/13 2013/14 2014/15 2015/16 2016/17 2017/18 National accounts statistics Subprogramme: National Accounts Statistics ( Programme 2: Economic Statistics) 1.1 Number and timeliness of quarterly and annual releases/ reports 12 12 10 10 9 9 9 1.2 Number and timeliness of technical documents/reports on improving national
accounts statistics 2 2 2 Subprogramme: Economic Analysis (Programme 2: Economic Statistics) 2.1 Number and timeliness of research reports on national accounts statistics 4 3 1 1 3 2 2 2.2 Number and timeliness of quarterly flash estimates on GDP 4 4 4 4 4 4 4 3.1 Number and timeliness of research reports on economic statistics 5 4 4 4 4 4 4 Industrial statistics: Agriculture, hunting, forestry and fishing; Mining and quarrying; Manufacturing; Electricity, gas and water supply; Construction; Wholesale and retail trade, repair of motor vehicles, motorcycles and personal and household goods; Transport, storage and communication; Financial intermediation, insurance, real estate and business services; Community, social and personal services; Hotels and restaurants Subprogramme: Short-term Indicators Statistics (Programme 2: Economic Statistics) 4.1 Number and timeliness of monthly, quarterly and annual releases/reports 161 150 150 150 150 150 150 4.2 Number and timeliness of technical documents/reports on improving industry
statistics 3 5 7
Subprogramme: Structural Industry Statistics (Programme 2: Economic Statistics) 5.1 Number and timeliness of annual and periodic releases/reports 10 7 9 9 3 5 5 5.2 Number and timeliness of technical documents/reports on improving industry
statistics 2 2 2
Tourism statistics Subprogramme: Social Statistics (Programme 3: Population and Social Statistics) 6.1 Number and timeliness of annual releases on domestic tourism 1 1 1 3 2 2 2 6.2 Number and timeliness of technical documents/reports on improving domestic
tourism statistics 1 1 1

The South Africa I know, the home I understand
74
Table 2: Annual Performance Plan targets: 2015/16 (concluded)
Audited/actual performance Estimated performance Medium-term targets
No. Performance indicator 2011/12 2012/13 2013/14 2014/15 2015/16 2016/17 2017/18 Tourism statistics Subprogramme: Health and Vital Statistics (Programme 2: Population and Social Statistics) 7.1 Number and timeliness of monthly, and annual releases on international tourism 13 13 13 13 13 13 13 7.2 Number and timeliness of technical documents/reports on improving international
tourism statistics 1 1 1 Transport statistics Subprogramme: Social Statistics (Programme 3: Population and Social Statistics) 8.1 Number and timeliness of technical documents/reports on improving transport
statistics (5 years) 2 2 1 Financial statistics Subprogramme: Private Sector Financial Statistics (Programme 2: Economic Statistics) 9.1 Number and timeliness of annual and quarterly releases on financial statistics of
private sector enterprises 5 5 5 5 5 5 5
9.2 Number and timeliness of technical documents/reports on improving private
sector financial statistics 2 2 2
Subprogramme: Government Financial Statistics (Programme 2: Economic Statistics) 10.1 Number and timeliness of quarterly and annual releases 11 11 11 11 11 11 11 10.2 Number and timeliness of technical documents/reports on improving government
financial statistics
3 3 3

The South Africa I know, the home I understand
75
Table 3: Quarterly performance targets: 2015/16
Quarterly targets
No. Performance indicator Reporting period
Annual target Quarter 1 Quarter 2 Quarter 3 Quarter 4
National accounts statistics Subprogramme: National Accounts (Programme 2: Economic Statistics) 1.1.1 Number and timeliness of quarterly releases Quarterly 4 1 1 1 1 1.1.2 Number and timeliness of annual reports Annually 5 Report on supply and use
of tables by February 2016
Report on input-output
tables by March 2016 Report on satellite
accounts (ICT) by March 2016
Report on satellite
accounts (non-profit institutions) by March 2016
Report on Tourism
Satellite Accounts (TSA) for SA by March 2016
1.2.1 Number and timeliness of technical
documents/reports on improving national accounts statistics
Annually 2 Report on 'Research and Development' of satellite accounts by February 2016
Research report on
economic accounts by March 2016
Subprogramme: Economic Analysis (Programme 2: Economic Statistics) 2.1.1 Number and timeliness of research reports on
national accounts statistics Annually 2 Research/ simulation
report on GDP through the expenditure approach by March 2016
Report on the
compilation of a detailed SUT by March 2016

The South Africa I know, the home I understand
76
Table 3: Quarterly performance targets: 2015/16 (continued)
Quarterly targets
No. Performance indicator Reporting period
Annual target Quarter 1 Quarter 2 Quarter 3 Quarter 4
National accounts statistics Subprogramme: Economic Analysis (Programme 2: Economic Statistics) 2.1.1 Number and timeliness of research reports on
national accounts statistics (continued) Annually 1 Report on improving
data sources for all GDP approaches by March 2016
2.2.1 Number of quarterly flash estimates on GDP Quarterly 4 1 1 1 1 3.1.1 Number and timeliness of research report on
economic statistics Annually 4 2 integrative reports on
factors affecting economic activities by September 2015
2 integrative reports on factors affecting economic activities by March 2016
Industrial statistics: Agriculture, hunting, forestry and fishing; Mining and quarrying; Manufacturing; Electricity, gas and water supply; Construction; Wholesale and retail trade, repair of motor vehicles, motorcycles and personal and household goods; Transport, storage and communication; Financial intermediation, insurance, real estate and business services; Community, social and personal services; Hotels and restaurants Subprogramme: Short-term Indicators and Structural Industry Statistics (Programme 2: Economic Statistics) Mining and quarrying 4.1.1 Number and timeliness of monthly releases on
mining: production and sales, 6 weeks after the reference month based on administrative sources
Quarterly 12 3 3 3 3
Manufacturing 4.1.2 Number and timeliness of monthly releases on
manufacturing: production and sales with collection rate of at least 80% (75% in special months), 6 weeks after the reference month
Quarterly 12 3 3 3 3
4.1.3 Number and timeliness of quarterly releases on
manufacturing: utilisation of production capacity by large enterprises with a collection rate of at least 80% (75% in special months), 10 weeks after the reference month
Quarterly 4 1 1 1 1
5.2.1 Number and timeliness of releases/reports (SIS) Periodic 1 Report on the 2014
manufacturing survey by November 2015
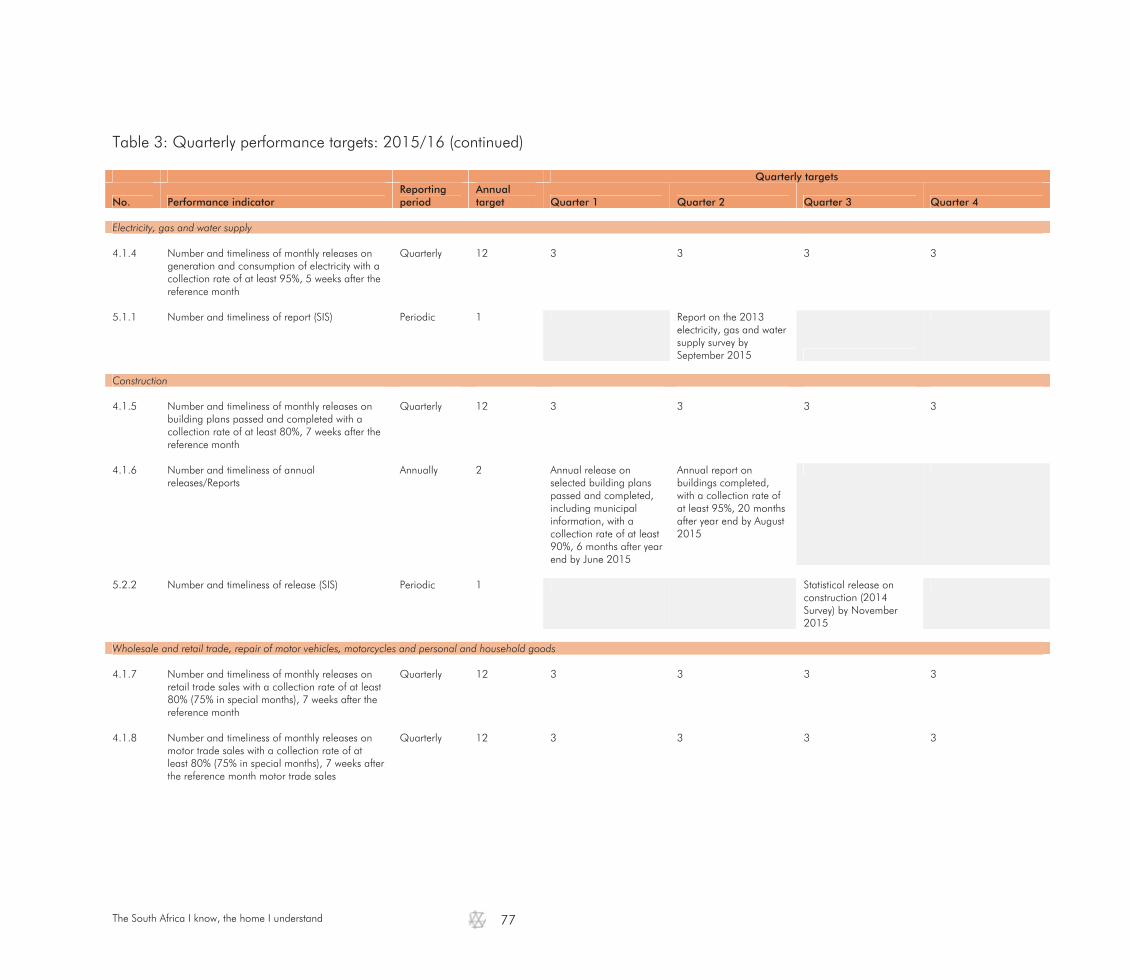
The South Africa I know, the home I understand
77
Table 3: Quarterly performance targets: 2015/16 (continued)
Quarterly targets
No. Performance indicator Reporting period
Annual target Quarter 1 Quarter 2 Quarter 3 Quarter 4
Electricity, gas and water supply 4.1.4 Number and timeliness of monthly releases on
generation and consumption of electricity with a collection rate of at least 95%, 5 weeks after the reference month
Quarterly 12 3 3 3 3
5.1.1 Number and timeliness of report (SIS) Periodic 1 Report on the 2013
electricity, gas and water supply survey by September 2015
Construction 4.1.5 Number and timeliness of monthly releases on
building plans passed and completed with a collection rate of at least 80%, 7 weeks after the reference month
Quarterly 12 3 3 3 3
4.1.6 Number and timeliness of annual
releases/Reports Annually 2 Annual release on
selected building plans passed and completed, including municipal information, with a collection rate of at least 90%, 6 months after year end by June 2015
Annual report on buildings completed, with a collection rate of at least 95%, 20 months after year end by August 2015
5.2.2 Number and timeliness of release (SIS) Periodic 1 Statistical release on
construction (2014 Survey) by November 2015
Wholesale and retail trade, repair of motor vehicles, motorcycles and personal and household goods 4.1.7 Number and timeliness of monthly releases on
retail trade sales with a collection rate of at least 80% (75% in special months), 7 weeks after the reference month
Quarterly 12 3 3 3 3
4.1.8 Number and timeliness of monthly releases on
motor trade sales with a collection rate of at least 80% (75% in special months), 7 weeks after the reference month motor trade sales
Quarterly 12 3 3 3 3
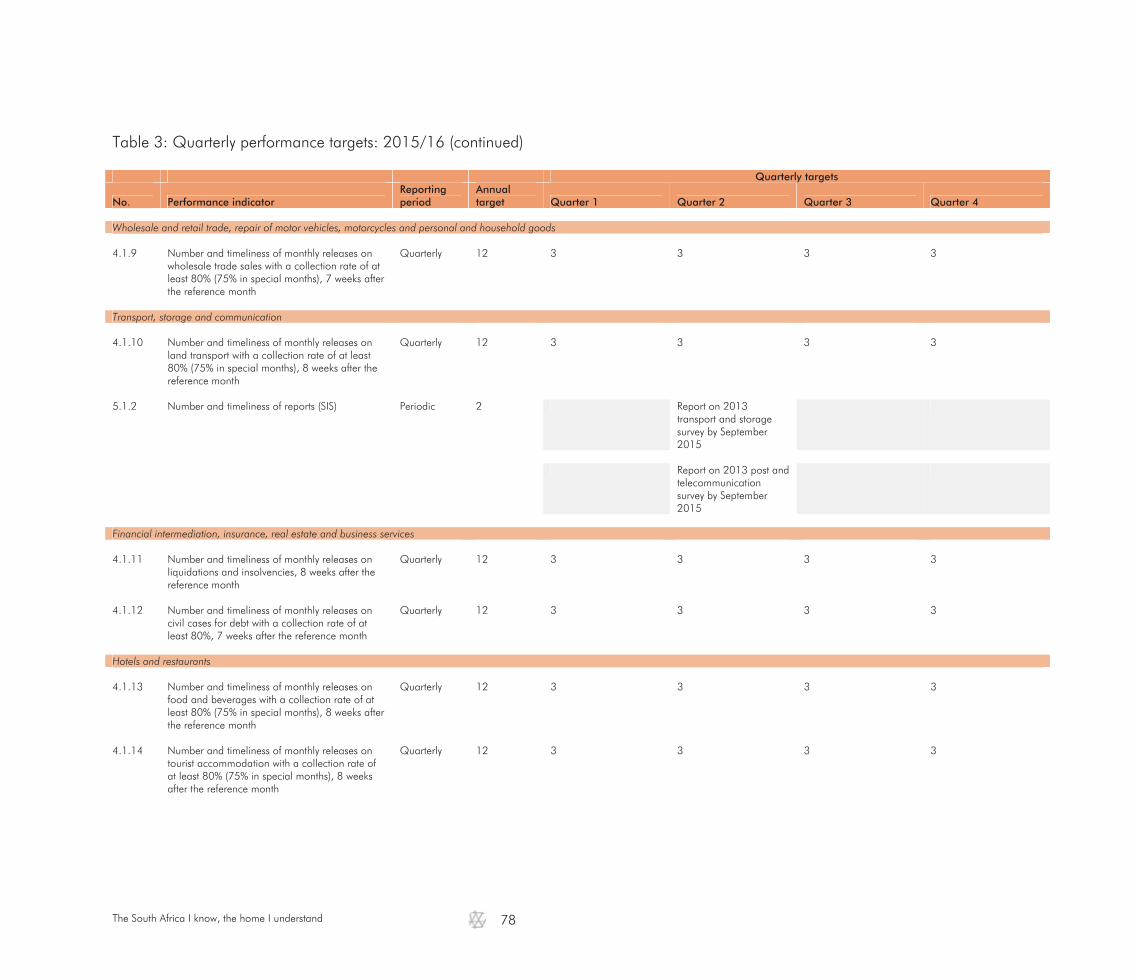
The South Africa I know, the home I understand
78
Table 3: Quarterly performance targets: 2015/16 (continued)
Quarterly targets
No. Performance indicator Reporting period
Annual target Quarter 1 Quarter 2 Quarter 3 Quarter 4
Wholesale and retail trade, repair of motor vehicles, motorcycles and personal and household goods 4.1.9 Number and timeliness of monthly releases on
wholesale trade sales with a collection rate of at least 80% (75% in special months), 7 weeks after the reference month
Quarterly 12 3 3 3 3
Transport, storage and communication 4.1.10 Number and timeliness of monthly releases on
land transport with a collection rate of at least 80% (75% in special months), 8 weeks after the reference month
Quarterly 12 3 3 3 3
5.1.2 Number and timeliness of reports (SIS) Periodic 2 Report on 2013
transport and storage survey by September 2015
Report on 2013 post and
telecommunication survey by September 2015
Financial intermediation, insurance, real estate and business services 4.1.11 Number and timeliness of monthly releases on
liquidations and insolvencies, 8 weeks after the reference month
Quarterly 12 3 3 3 3
4.1.12 Number and timeliness of monthly releases on
civil cases for debt with a collection rate of at least 80%, 7 weeks after the reference month
Quarterly 12 3 3 3 3
Hotels and restaurants 4.1.13 Number and timeliness of monthly releases on
food and beverages with a collection rate of at least 80% (75% in special months), 8 weeks after the reference month
Quarterly 12 3 3 3 3
4.1.14 Number and timeliness of monthly releases on
tourist accommodation with a collection rate of at least 80% (75% in special months), 8 weeks after the reference month
Quarterly 12 3 3 3 3

The South Africa I know, the home I understand
79
Table 3: Quarterly performance targets: 2015/16 (continued)
Quarterly targets
No. Performance indicator Reporting period
Annual target Quarter 1 Quarter 2 Quarter 3 Quarter 4
Improving industry statistics 4.2.1 Number of technical documents/ reports on
improving industry statistics Periodic 3 Report on Seasonal
adjustment using X-12 (Manufacturing production and sales; Utilisation of manufacturing capacity; Building statistics) by March 2016
Report on deflation
(Tourist accommodation [2012]; Food and beverages [2012])
Report on Weights for
manufacturing utilisation of production capacity (2012)
Tourism statistics Subprogramme: Social Statistics (Programme 3: Population and Social Statistics) 6.1.1 Number and timeliness of reports and releases Annually 2 Annual report on
domestic tourism survey by June 2015
Biannual report on domestic tourism by December 2015
6.2.1 Number and timeliness of technical
documents/reports on improving domestic tourism statistics
Periodic 1 Report on testing sample allocation and weighting methodologies
Subprogramme: Health and Vital Statistics (Programme 3: Population and Social Statistics) 7.1.1 Number and timeliness of monthly releases 3
months after the reference period Monthly 12 3 3 3 3
7.1.2 Number and timeliness of reports Annually 1 Annual report on
international tourism by June 2015
7.2.1 Number and timeliness of technical
documents/reports on improving international tourism statistics
Periodic 1 Report on strengthening collaborations with Home Affairs on acquisition of data by March 2016

The South Africa I know, the home I understand
80
Table 3: Quarterly performance targets: 2015/16 (continued)
Quarterly targets
No. Performance indicator Reporting period
Annual target Quarter 1 Quarter 2 Quarter 3 Quarter 4
Transport statistics Subprogramme: Social Statistics (Programme 3: Population and Social Statistics) 8.1.1 Number and timeliness of technical
documents/reports on improving transport statistics
Periodic 2 Technical document on RTMC editing, analysis and reporting systems by June 2015
Thematic report on transport by March 2016
Financial statistics Subprogramme: Private Sector Financial Statistics (Programme 2: Economic Statistics) 9.1.1 Number and timeliness of annual releases Annually 1 Annual release on
financial statistics of private sector enterprises 2014 by November 2015 (AFS)
9.1.2 Number and timeliness of quarterly releases on
financial statistics of private sector enterprises published with a quarterly lag
Quarterly 4 1 1 1 1
9.2.1 Number and timeliness of technical
documents/reports on improving private sector financial statistics
Periodic 2 Report on reviewing QFS at lower SIC level by March 2016
Report on engaging
stakeholders on research initiatives by March 2016
Subprogramme: Government Financial Statistics (Programme 2: Economic Statistics) 10.1.1 Number and timeliness of releases Annually 2 Annual release on the
financial statistics of national government with audited data by June 2015
Annual release on
financial statistics of extra-budgetary accounts and funds with audited data by August 2015

The South Africa I know, the home I understand
81
Table 3: Quarterly performance targets: 2015/16 (continued)
Quarterly targets
No. Performance indicator Reporting period
Annual target Quarter 1 Quarter 2 Quarter 3 Quarter 4
Financial statistics Subprogramme: Government Financial Statistics (Programme 2: Economic Statistics) 10.1.1 Number and timeliness of releases (continued) Annually 5 Annual release on
financial statistics of provincial government for 2013/14 with audited data by August 2015
Annual release on
financial statistics of higher education institutions for 2014 with audited data by October 2015
Annual release on
financial statistics of consolidated general government for 2013/14 with audited data by November 2015
Annual release on the
capital expenditure of the public sector for 2013/14 with a response rate of 95% by July 2015
Annual release on the
financial census of municipalities for 2013/14 with a response rate of 95% by June 2015
10.1.2 Number and timeliness of quarterly releases on
financial statistics of municipalities published with a response rate of at least 80% with a quarterly lag
Quarterly 4 1 1 1 1
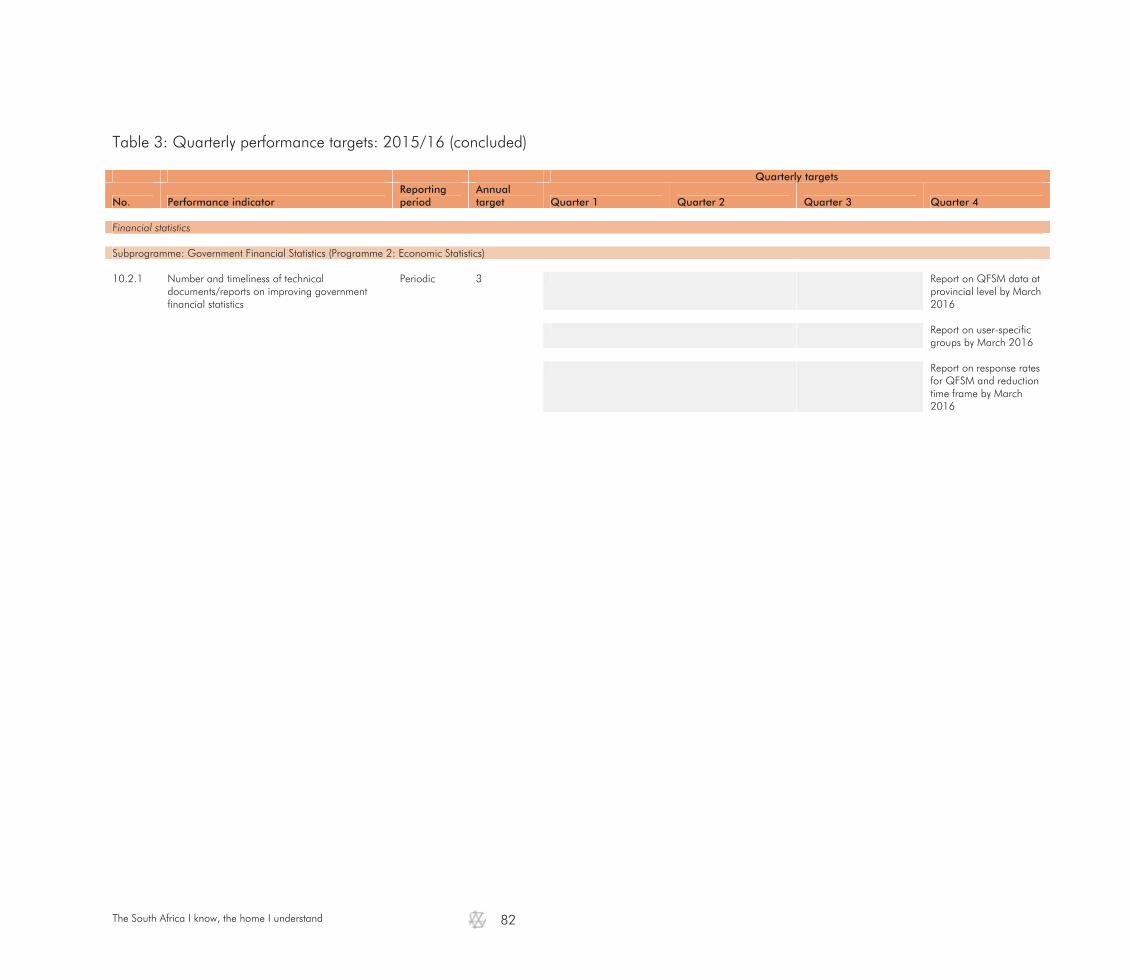
The South Africa I know, the home I understand
82
Table 3: Quarterly performance targets: 2015/16 (concluded)
Quarterly targets
No. Performance indicator Reporting period
Annual target Quarter 1 Quarter 2 Quarter 3 Quarter 4
Financial statistics Subprogramme: Government Financial Statistics (Programme 2: Economic Statistics) 10.2.1 Number and timeliness of technical
documents/reports on improving government financial statistics
Periodic 3 Report on QFSM data at provincial level by March 2016
Report on user-specific
groups by March 2016 Report on response rates
for QFSM and reduction time frame by March 2016

The South Africa I know, the home I understand
83
ii) Price stability
Policy context: Government remains committed to macroeconomic stability, supported by prudent fiscal management and sound monetary policy. As a long-term strategy, government will continue to pursue a counter-cyclical fiscal and monetary policy (MTSF: 2014–2019). In many countries, growth has slowed and the economic outlook is uncertain. Across the world, tough questions are being asked about how to generate growth, and how to reduce inequality. Governments everywhere face difficult choices because the gap between what is required and what can be afforded is very wide and so we have to be steadfast in our resolve to do more, together, with less. In 2014 it was expected that the economy will grow by 2,7 per cent, but was later revised to an estimated 1,4 per cent. The Treasury projects that growth will reach 3 per cent in 2017 (MTBPS: 2014). This downward revision is partly because of a weak global environment, including the slowdown in Europe, China and other emerging economies, but it also reflects obstacles to our own development which include energy constraints, labour market disruptions, skills shortages, administrative shortcomings and difficulties in our industrial transformation (MTBPS:2014). The following tables outline the strategic, annual and quarterly performance targets to measure price stability:
Table 1: Strategic Plan targets
Audited/actual performance
Estimated performance Medium-term targets
No. Strategic objective Target 2011/12 2012/13 2013/14 2014/15 2015/16 2016/17 2017/18
Consumer and producer price statistics Subprogramme: Price Statistics (Programme 2: Economic Statistics) 11. Price stability:
To expand the statistical information base by increasing its depth, breadth and geographic spread
Statistical information on consumer price changes
Published 12 statistical releases as scheduled with an average imputation rate of 0,9% Published rebased CPI as scheduled Researched measurement of domestic worker wages Implemented improvements on collection methodology
Published 12 statistical releases as scheduled with an average imputation rate of 0,8% Published rebased CPI as scheduled
Published 12 statistical releases as scheduled with an average imputation rate of 0,16% Rebased and reweighted the CPI in 2012/13
Publish monthly CPI with imputation rate of less than 1% Biennial updating of weights
Publish monthly CPI Expand and improve by: Reviewing CPI
systems
Publish monthly CPI Expand and improve by: Researching
reweighting of CPI
Publish monthly CPI Expand and improve by: Reweighting the CPI
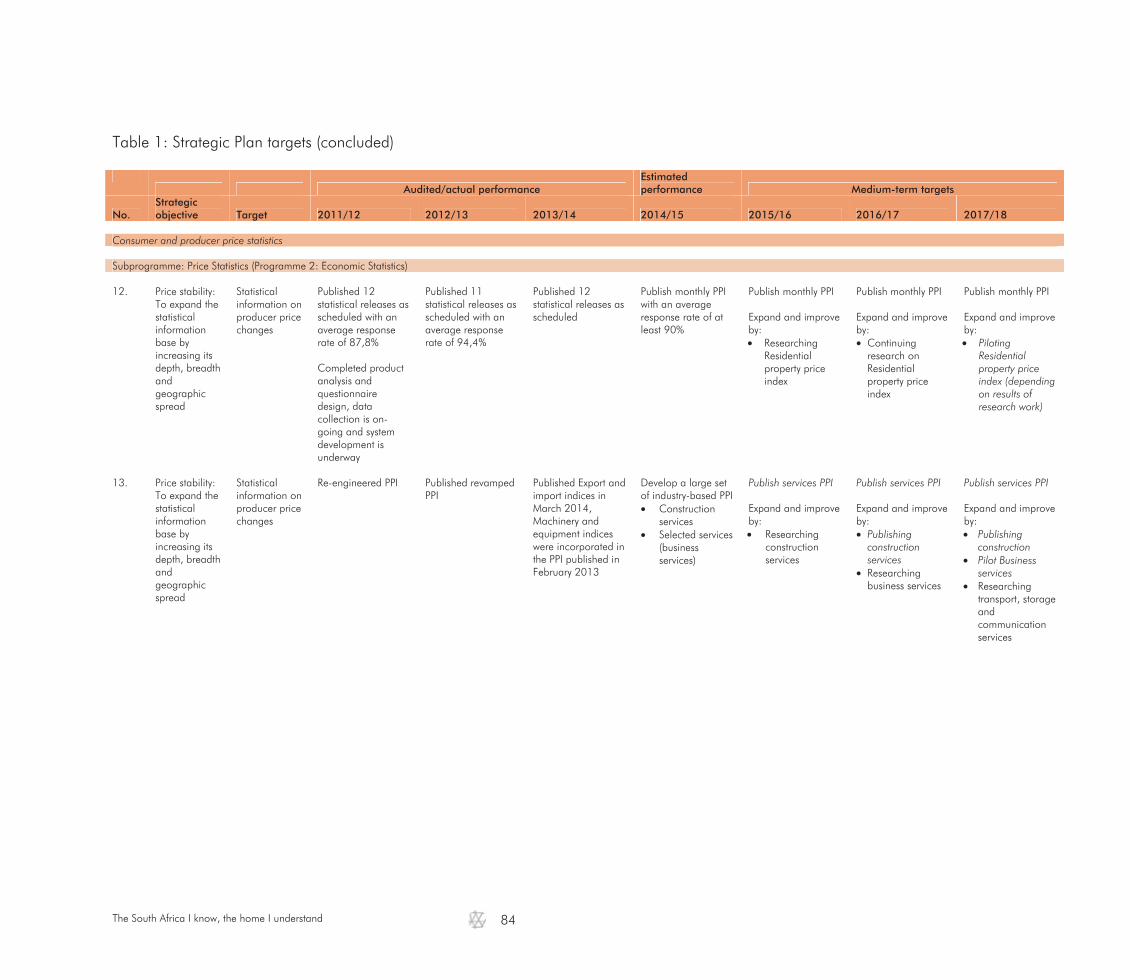
The South Africa I know, the home I understand
84
Table 1: Strategic Plan targets (concluded)
Audited/actual performance
Estimated performance Medium-term targets
No. Strategic objective Target 2011/12 2012/13 2013/14 2014/15 2015/16 2016/17 2017/18
Consumer and producer price statistics Subprogramme: Price Statistics (Programme 2: Economic Statistics) 12. Price stability:
To expand the statistical information base by increasing its depth, breadth and geographic spread
Statistical information on producer price changes
Published 12 statistical releases as scheduled with an average response rate of 87,8% Completed product analysis and questionnaire design, data collection is on-going and system development is underway
Published 11 statistical releases as scheduled with an average response rate of 94,4%
Published 12 statistical releases as scheduled
Publish monthly PPI with an average response rate of at least 90%
Publish monthly PPI Expand and improve by: Researching
Residential property price index
Publish monthly PPI Expand and improve by: Continuing
research on Residential property price index
Publish monthly PPI Expand and improve by: Piloting
Residential property price index (depending on results of research work)
13. Price stability:
To expand the statistical information base by increasing its depth, breadth and geographic spread
Statistical information on producer price changes
Re-engineered PPI Published revamped PPI
Published Export and import indices in March 2014, Machinery and equipment indices were incorporated in the PPI published in February 2013
Develop a large set of industry-based PPI Construction
services Selected services
(business services)
Publish services PPI Expand and improve by: Researching
construction services
Publish services PPI Expand and improve by: Publishing
construction services
Researching business services
Publish services PPI Expand and improve by: Publishing
construction Pilot Business
services Researching
transport, storage and communication services
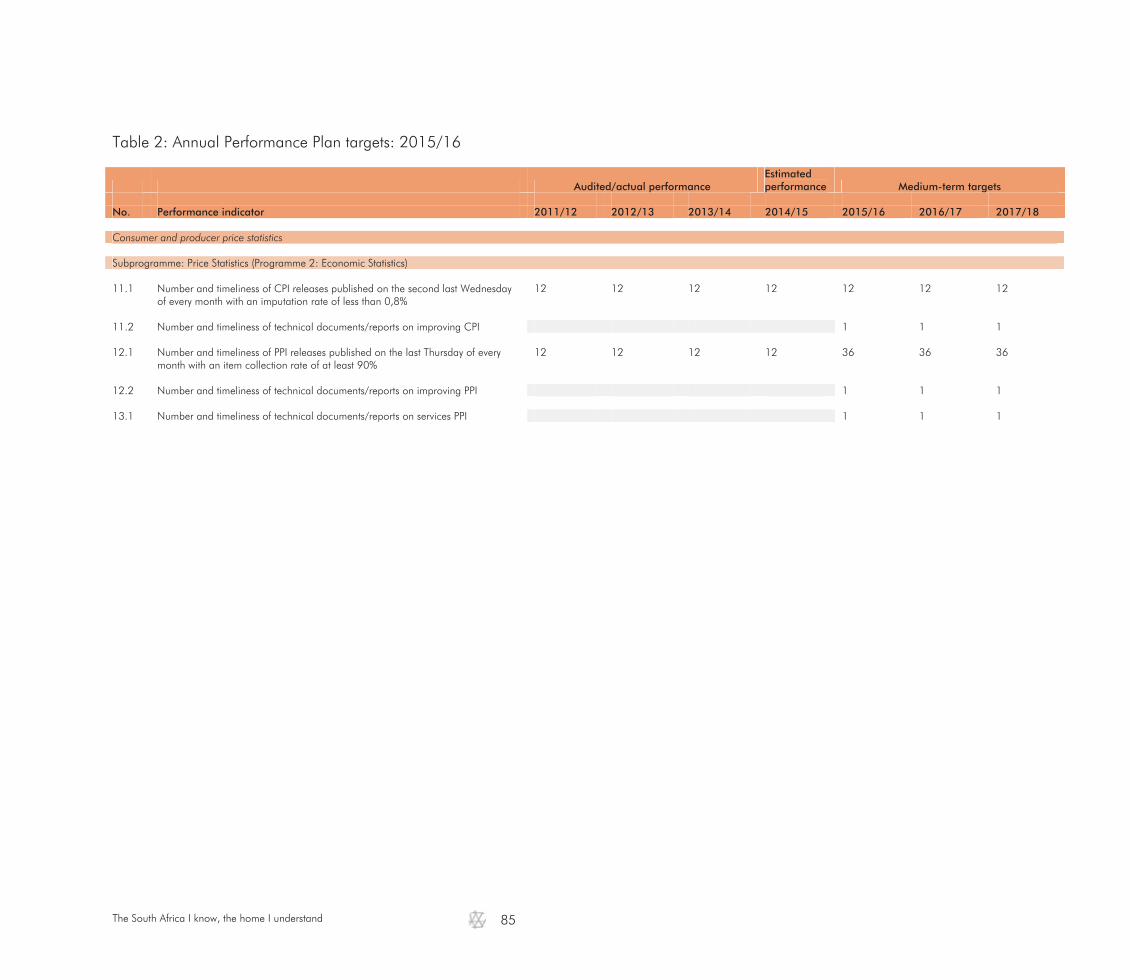
The South Africa I know, the home I understand
85
Table 2: Annual Performance Plan targets: 2015/16
Audited/actual performance Estimated performance Medium-term targets
No. Performance indicator 2011/12 2012/13 2013/14 2014/15 2015/16 2016/17 2017/18 Consumer and producer price statistics Subprogramme: Price Statistics (Programme 2: Economic Statistics) 11.1 Number and timeliness of CPI releases published on the second last Wednesday
of every month with an imputation rate of less than 0,8% 12 12 12 12 12 12 12
11.2 Number and timeliness of technical documents/reports on improving CPI 1 1 1 12.1 Number and timeliness of PPI releases published on the last Thursday of every
month with an item collection rate of at least 90% 12 12 12 12 36 36 36
12.2 Number and timeliness of technical documents/reports on improving PPI 1 1 1 13.1 Number and timeliness of technical documents/reports on services PPI 1 1 1

The South Africa I know, the home I understand
86
Table 3: Quarterly performance targets: 2015/16
Quarterly targets
No. Performance indicator Reporting period
Annual target Quarter 1 Quarter 2 Quarter 3 Quarter 4
Consumer and producer price statistics Subprogramme: Price Statistics (Programme 2: Economic Statistics) 11.1.1 Number and timeliness of CPI releases published
on the second last Wednesday of every month with an imputation rate of less than 1%
Quarterly 12 3 3 3 3
11.2.1 Number and timeliness of technical
documents/reports on improving CPI Periodic 1 Report on the review of
CPI systems by March 2016
12.1.1 Number and timeliness of PPI releases published
on the last Thursday of every month with an item collection rate of at least 85%
Quarterly 36 9 9 9 9
12.2.1 Number and timeliness of technical
documents/reports on improving PPI Periodic 1 Research report on
residential property price index by March 2016
13.1.1 Number and timeliness of technical
documents/reports on services PPI Periodic 1 Research report on
construction services by March 2016
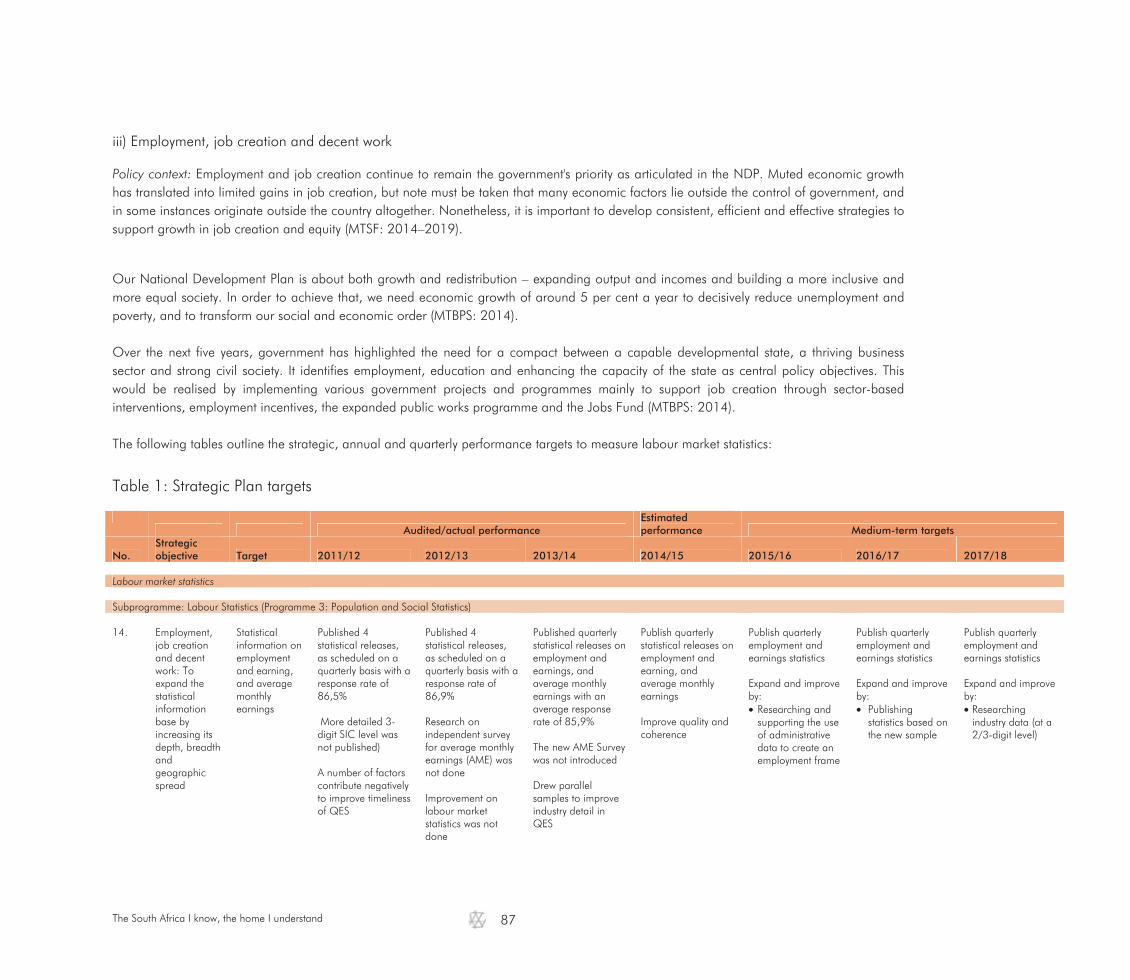
The South Africa I know, the home I understand
87
iii) Employment, job creation and decent work
Policy context: Employment and job creation continue to remain the government's priority as articulated in the NDP. Muted economic growth has translated into limited gains in job creation, but note must be taken that many economic factors lie outside the control of government, and in some instances originate outside the country altogether. Nonetheless, it is important to develop consistent, efficient and effective strategies to support growth in job creation and equity (MTSF: 2014–2019).
Our National Development Plan is about both growth and redistribution – expanding output and incomes and building a more inclusive and more equal society. In order to achieve that, we need economic growth of around 5 per cent a year to decisively reduce unemployment and poverty, and to transform our social and economic order (MTBPS: 2014). Over the next five years, government has highlighted the need for a compact between a capable developmental state, a thriving business sector and strong civil society. It identifies employment, education and enhancing the capacity of the state as central policy objectives. This would be realised by implementing various government projects and programmes mainly to support job creation through sector-based interventions, employment incentives, the expanded public works programme and the Jobs Fund (MTBPS: 2014). The following tables outline the strategic, annual and quarterly performance targets to measure labour market statistics:
Table 1: Strategic Plan targets
Audited/actual performance
Estimated performance Medium-term targets
No. Strategic objective Target 2011/12 2012/13 2013/14 2014/15 2015/16 2016/17 2017/18
Labour market statistics Subprogramme: Labour Statistics (Programme 3: Population and Social Statistics) 14. Employment,
job creation and decent work: To expand the statistical information base by increasing its depth, breadth and geographic spread
Statistical information on employment and earning, and average monthly earnings
Published 4 statistical releases, as scheduled on a quarterly basis with a response rate of 86,5% More detailed 3-digit SIC level was not published) A number of factors contribute negatively to improve timeliness of QES
Published 4 statistical releases, as scheduled on a quarterly basis with a response rate of 86,9% Research on independent survey for average monthly earnings (AME) was not done Improvement on labour market statistics was not done
Published quarterly statistical releases on employment and earnings, and average monthly earnings with an average response rate of 85,9% The new AME Survey was not introduced Drew parallel samples to improve industry detail in QES
Publish quarterly statistical releases on employment and earning, and average monthly earnings Improve quality and coherence
Publish quarterly employment and earnings statistics Expand and improve by: Researching and supporting the use of administrative data to create an employment frame
Publish quarterly employment and earnings statistics Expand and improve by: Publishing
statistics based on the new sample
Publish quarterly employment and earnings statistics Expand and improve by: Researching industry data (at a 2/3-digit level)
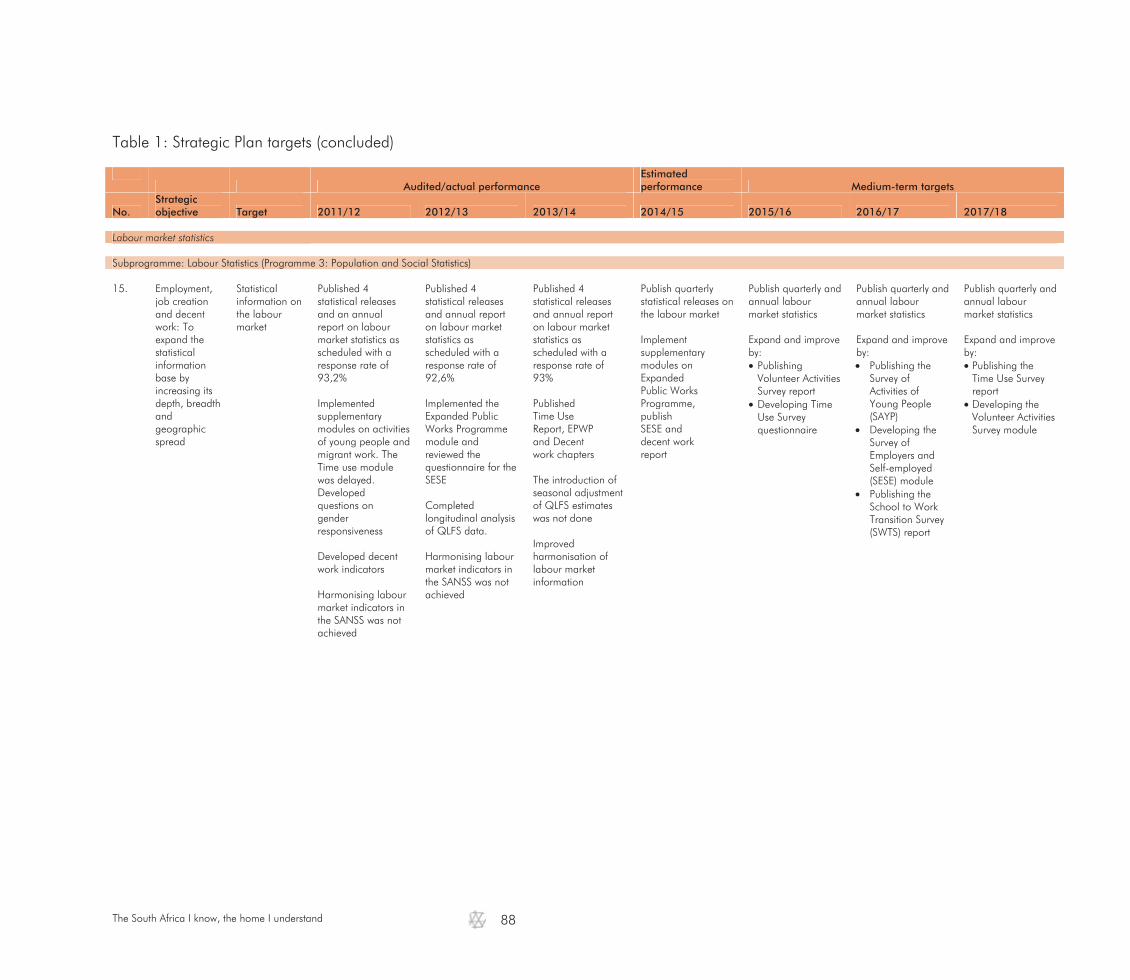
The South Africa I know, the home I understand
88
Table 1: Strategic Plan targets (concluded)
Audited/actual performance
Estimated performance Medium-term targets
No. Strategic objective Target 2011/12 2012/13 2013/14 2014/15 2015/16 2016/17 2017/18
Labour market statistics Subprogramme: Labour Statistics (Programme 3: Population and Social Statistics) 15. Employment,
job creation and decent work: To expand the statistical information base by increasing its depth, breadth and geographic spread
Statistical information on the labour market
Published 4 statistical releases and an annual report on labour market statistics as scheduled with a response rate of 93,2% Implemented supplementary modules on activities of young people and migrant work. The Time use module was delayed. Developed questions on gender responsiveness Developed decent work indicators Harmonising labour market indicators in the SANSS was not achieved
Published 4 statistical releases and annual report on labour market statistics as scheduled with a response rate of 92,6% Implemented the Expanded Public Works Programme module and reviewed the questionnaire for the SESE Completed longitudinal analysis of QLFS data. Harmonising labour market indicators in the SANSS was not achieved
Published 4 statistical releases and annual report on labour market statistics as scheduled with a response rate of 93% Published Time Use Report, EPWP and Decent work chapters The introduction of seasonal adjustment of QLFS estimates was not done Improved harmonisation of labour market information
Publish quarterly statistical releases on the labour market Implement supplementary modules on Expanded Public Works Programme, publish SESE and decent work report
Publish quarterly and annual labour market statistics Expand and improve by: Publishing Volunteer Activities Survey report
Developing Time Use Survey questionnaire
Publish quarterly and annual labour market statistics Expand and improve by: Publishing the
Survey of Activities of Young People (SAYP)
Developing the Survey of Employers and Self-employed (SESE) module
Publishing the School to Work Transition Survey (SWTS) report
Publish quarterly and annual labour market statistics Expand and improve by: Publishing the Time Use Survey report
Developing the Volunteer Activities Survey module

The South Africa I know, the home I understand
89
Table 2: Annual Performance Plan targets: 2015/16
Audited/actual performance Estimated performance Medium-term targets
No. Performance indicator 2011/12 2012/13 2013/14 2014/15 2015/16 2016/17 2017/18 Labour market statistics Subprogramme: Labour Statistics (Programme 3: Population and Social Statistics) 14.1 Number and timeliness of quarterly releases on employment and earnings and
average monthly earnings with a response rate of at least 80%, 12 weeks after the reference month
4 4 4 4 4 4 4
14.2 Number and timeliness of technical documents/reports on improving employment
and earnings statistics 1 1 1
15.1 Number and timeliness of quarterly, annual and periodic releases and reports on
the labour market 7 8 8 8 5 5 5
15.2 Number and timeliness of technical documents/reports on improving labour
market statistics 2 3 2
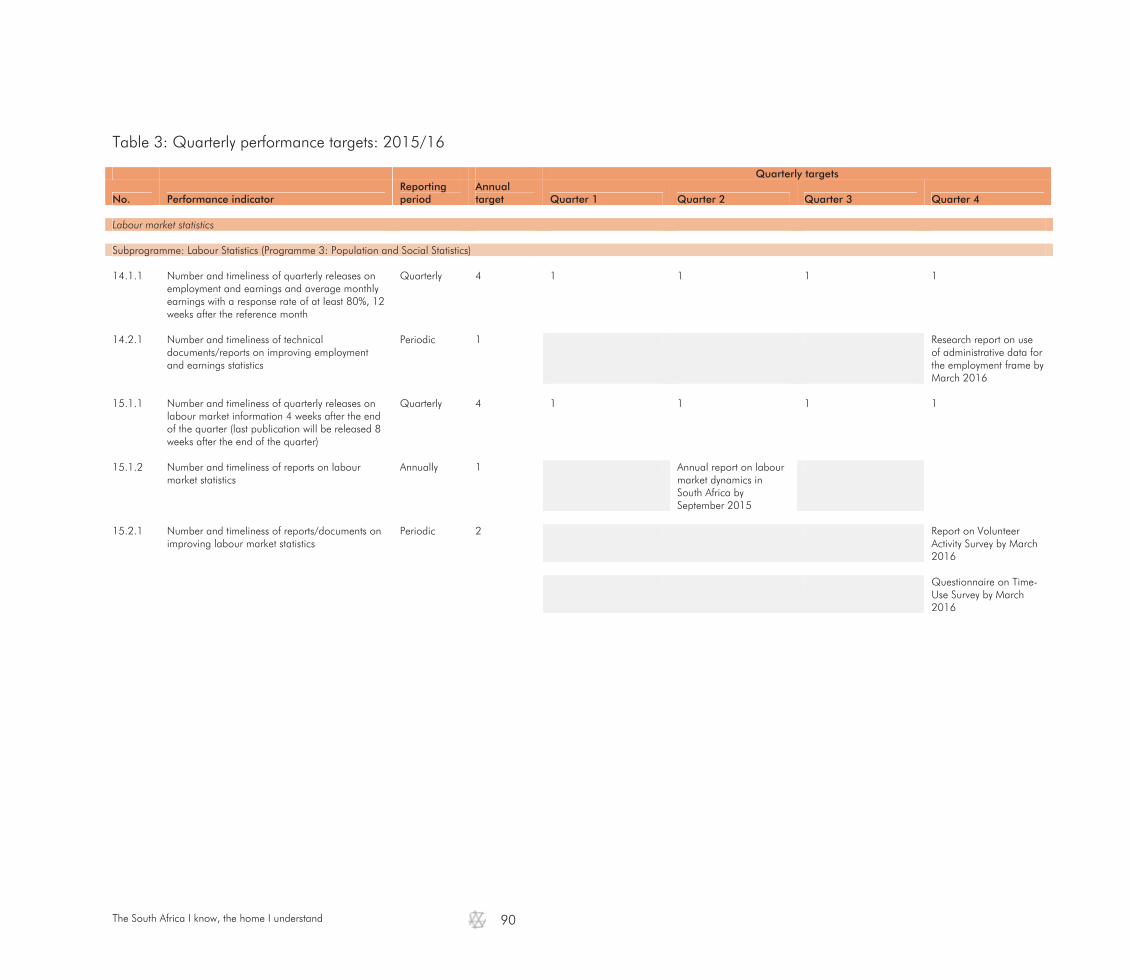
The South Africa I know, the home I understand
90
Table 3: Quarterly performance targets: 2015/16
Quarterly targets
No. Performance indicator Reporting period
Annual target Quarter 1 Quarter 2 Quarter 3 Quarter 4
Labour market statistics Subprogramme: Labour Statistics (Programme 3: Population and Social Statistics) 14.1.1 Number and timeliness of quarterly releases on
employment and earnings and average monthly earnings with a response rate of at least 80%, 12 weeks after the reference month
Quarterly 4 1 1 1 1
14.2.1 Number and timeliness of technical
documents/reports on improving employment and earnings statistics
Periodic 1 Research report on use of administrative data for the employment frame by March 2016
15.1.1 Number and timeliness of quarterly releases on
labour market information 4 weeks after the end of the quarter (last publication will be released 8 weeks after the end of the quarter)
Quarterly 4 1 1 1 1
15.1.2 Number and timeliness of reports on labour
market statistics Annually 1 Annual report on labour
market dynamics in South Africa by September 2015
15.2.1 Number and timeliness of reports/documents on
improving labour market statistics Periodic 2 Report on Volunteer
Activity Survey by March 2016
Questionnaire on Time-
Use Survey by March 2016
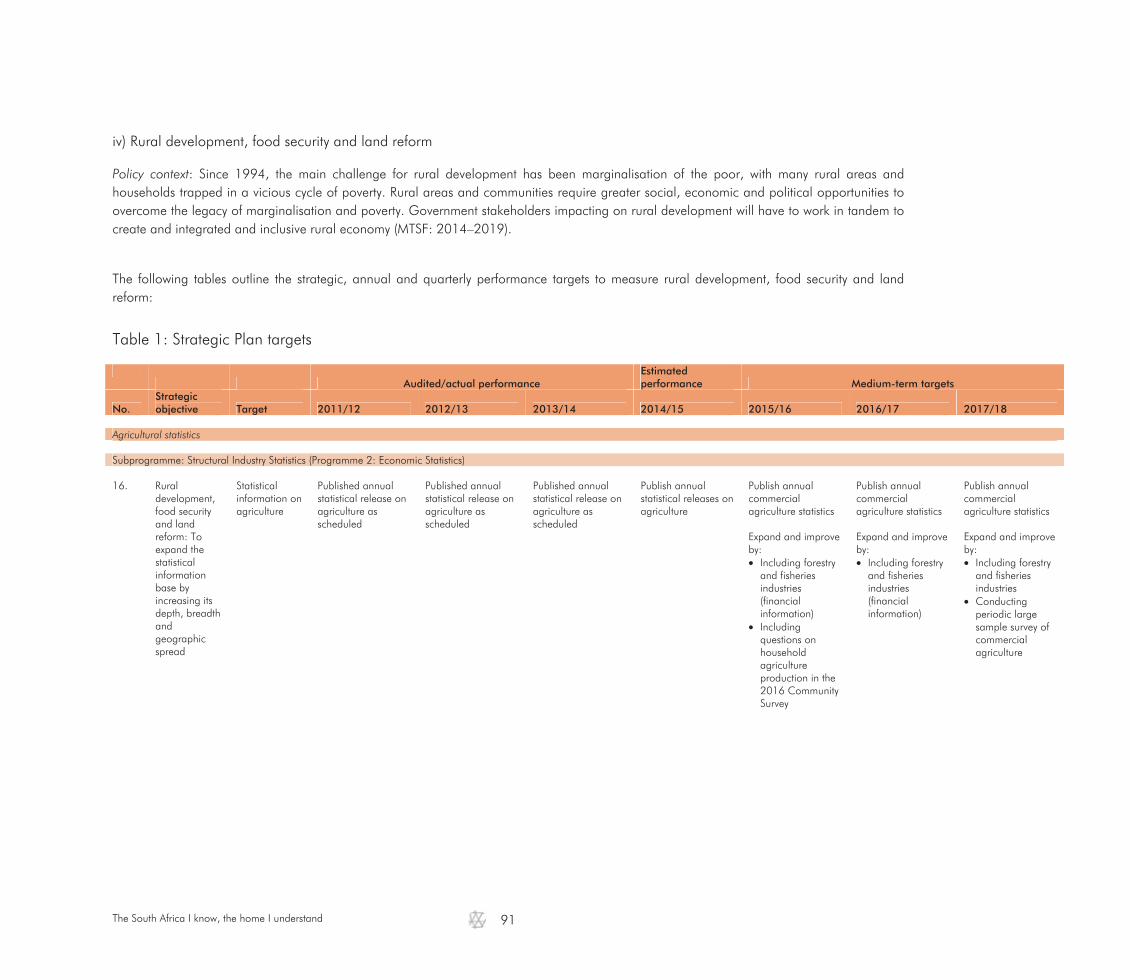
The South Africa I know, the home I understand
91
iv) Rural development, food security and land reform
Policy context: Since 1994, the main challenge for rural development has been marginalisation of the poor, with many rural areas and households trapped in a vicious cycle of poverty. Rural areas and communities require greater social, economic and political opportunities to overcome the legacy of marginalisation and poverty. Government stakeholders impacting on rural development will have to work in tandem to create and integrated and inclusive rural economy (MTSF: 2014–2019).
The following tables outline the strategic, annual and quarterly performance targets to measure rural development, food security and land reform:
Table 1: Strategic Plan targets
Audited/actual performance
Estimated performance Medium-term targets
No. Strategic objective Target 2011/12 2012/13 2013/14 2014/15 2015/16 2016/17 2017/18
Agricultural statistics Subprogramme: Structural Industry Statistics (Programme 2: Economic Statistics) 16. Rural
development, food security and land reform: To expand the statistical information base by increasing its depth, breadth and geographic spread
Statistical information on agriculture
Published annual statistical release on agriculture as scheduled
Published annual statistical release on agriculture as scheduled
Published annual statistical release on agriculture as scheduled
Publish annual statistical releases on agriculture
Publish annual commercial agriculture statistics Expand and improve by: Including forestry
and fisheries industries (financial information)
Including questions on household agriculture production in the 2016 Community Survey
Publish annual commercial agriculture statistics Expand and improve by: Including forestry
and fisheries industries (financial information)
Publish annual commercial agriculture statistics Expand and improve by: Including forestry
and fisheries industries
Conducting periodic large sample survey of commercial agriculture

The South Africa I know, the home I understand
92
Table 2: Annual Performance Plan targets: 2015/16
Audited/actual performance Estimated performance Medium-term targets
No. Performance indicator 2011/12 2012/13 2013/14 2014/15 2015/16 2016/17 2017/18 Agriculture statistics Subprogramme: Structural Industry Statistics (Programme 2: Economic Statistics) 16.1.
Number and timeliness of releases/reports 1 1 1 1 1 1 1
16.2 Number and timeliness of technical documents/reports on improving agriculture
statistics 2 1 2
Table 3: Quarterly performance targets: 2015/16
Quarterly targets
No. Performance indicator Reporting period
Annual target Quarter 1 Quarter 2 Quarter 3 Quarter 4
Agriculture statistics Subprogramme: Structural Industry Statistics (Programme 2: Economic Statistics) 16.1.1 Number and timeliness of releases/reports Annually 1 Report on the 2014
agriculture survey by November 2015
16.2.1 Number and timeliness of technical
documents/reports on improving agriculture statistics
Periodic 2
CS2016 questionnaire includes questions on household agriculture production November 2015
Agriculture survey questionnaire includes forestry and fisheries industries (financial information)

The South Africa I know, the home I understand
93
v) Sustainable resource management
Policy context: South Africa has made a pledge to reduce carbon intensity by reducing emissions by 35% in 2020 and 43% in 2025. Actions will include interventions that will mitigate against the effects of climate change. There is also recognition that actions related to adoption will depend on strong policies supported by a sound technical understanding and operational capacity to deal with developmental challenges. Moreover, developmental planning should ensure the management of natural resources and environmental risks in order to pursue developmental planning goals. The desired outcome is a built environment that is low carbon, energy efficient and that minimises waste and equity (MTSF: 2014–2019).
The following tables outline the strategic, annual and quarterly performance targets to measure sustainable resource management:
Table 1: Strategic Plan targets
Audited/actual performance
Estimated performance Medium-term targets
No. Strategic objective Target 2011/12 2012/13 2013/14 2014/15 2015/16 2016/17 2017/18
Environmental economic accounts Subprogramme: National Accounts (Programme 2: Economic Statistics) 17. Sustainable
resource management: To expand the statistical information base by increasing its depth, breadth and geographic spread
Research reports on economic activity
Published discussion documents on the availability of water, minerals, energy and fisheries as scheduled
Published discussion documents on Mineral, Fisheries and Environmental Economic Accounts (EEA)
Released EEA compendium (and Excel sheets) as scheduled
Produce EEA compendium and EEA indicators
Publish EEA statistics Expand and improve on: Ecosystems
services Emissions
Publish EEA statistics Expand and improve on: Ecosystems
services Emissions
Publish EEA statistics Expand and improve by: Researching
complementary data sources

The South Africa I know, the home I understand
94
Table 2: Annual Performance Plan targets: 2015/16
Audited/actual performance Estimated performance Medium-term targets
No. Performance indicator 2011/12 2012/13 2013/14 2014/15 2015/16 2016/17 2017/18 Environmental economic accounts Subprogramme: National Accounts (Programme 2: Economic Statistics) 17.1 Number and timeliness of research reports on EEA 4 3 1 1 1 1 1 17.2 Number and timeliness of technical documents/reports improving EEA 2 2 1
Table 3: Quarterly performance targets: 2015/16
Quarterly targets
No. Performance indicator Reporting period
Annual target Quarter 1 Quarter 2 Quarter 3 Quarter 4
Environmental economic accounts Subprogramme: National Accounts (Programme 2: Economic Statistics) 17.1.1 Number and timeliness of research reports on EEA Annually 1 Report on EEA indicators
by March 2016 17.2.1 Number and timeliness of technical documents/reports
improving EEA Periodic 2 Research report on 'Eco
Systems Services' by March 2016
Research report on
'Emissions' by March 2016

The South Africa I know, the home I understand
95
vi) Living circumstances, service delivery and poverty
Policy context: Despite the size of the fiscal stimulus, reinforced by accommodative monetary policy, South Africa's economic recovery has been tepid. Investment, trade and employment growth have remained hesitant. Part of the explanation is the weakness of the global recovery. Over the past decade, government has made substantial inroads in the provision of general public services.
Expanded access to services has improved living conditions in poor communities across the country. Yet, the broadening of access has not always been accompanied by commensurate improvements in quality, and a focus over the medium term is to improve the quality and pace of service delivery. Statistical information as the basis for evidence-based policy-making, is required to measure progress or lack thereof. The quality of our education system and our health services needs to be improved. These remain the top priorities of government spending. R800 billion is proposed over the MTEF period for education and skills development. Post-school education and training has received the fastest-growing share of the budget over the past three years, and will continue to expand. Alongside these priorities, there will be real growth in spending on local development and social infrastructure. Support will also be provided to the municipalities to improve revenue collection and management of infrastructure financed from both revenue and grants. The local government equitable share continues to finance the provision of free basic services to the poor households but municipalities must work harder to broaden access (MTBPS: 2014). The following tables outline the strategic, annual and quarterly performance targets to measure living circumstances, service delivery and poverty: Table 1: Strategic Plan targets
Audited/actual performance
Estimated performance Medium-term targets
No. Strategic objective Target 2011/12 2012/13 2013/14 2014/15 2015/16 2016/17 2017/18
Life circumstances, service delivery and poverty Subprogramme: Social Statistics (Programme 3: Population and Social Statistics) 18. Life
circumstances, service delivery and poverty: To expand the statistical information base by increasing its depth, breadth and geographic spread
Statistical information on the life circumstances of South Africans
Annual report and development indicators on GHS were not published as scheduled Published GHS Series Volume III: as scheduled Introduced enhanced collection methodology for GHS Improved processing and analysis turnaround times of GHS
Published thematic reports on food, security and agriculture and the social profile of South Africans
Researched and tested a continuous household survey methodology as part of an integrated household survey programme that included the GHS
Test GHS as part of the integrated household survey programme
Publish annual social and household service delivery statistics Expand and improve by: Publishing a
thematic report on housing
Assessing impact of digital data collection on estimates
Publish annual social and household service delivery statistics
Expand and improve by: Publishing a
thematic report on water and sanitation
Publishing a statistical report on service delivery based on CS2016 data
Commence with GHS at municipal level
Publish annual social and household service delivery statistics
Expand and improve by: Collecting
expanded energy service delivery module
Publishing report on the environment

The South Africa I know, the home I understand
96
Table 1: Strategic Plan targets (concluded)
Audited/actual performance
Estimated performance Medium-term targets
No. Strategic objective Target 2011/12 2012/13 2013/14 2014/15 2015/16 2016/17 2017/18
Life circumstances, service delivery and poverty Subprogramme: Poverty and Inequality Statistics (Programme 3: Population and Social Statistics) 19. Life
circumstances, service delivery and poverty: To expand the statistical information base by increasing its depth, breadth and geographic spread
Statistical information on the poverty levels in SA
Conducted research to introduce a continuous survey with a core module that collects detailed expenditure information that provides information to both the LCS and IES Finalised collection phase Processed and analysed data collected from households
Development and testing of new content and methodologies was conducted. New sections on health and subjective poverty, as well as improvements to the coding of expenditure items in the diary were tested Published IES statistical release
The Living Conditions Survey (LCS) was not conducted in 2013/14 Tested proposed methodology for the CPS, conducted national debriefing and reviewed the CPS instruments
Process and analyse data collected in the field Conduct stakeholder consultations for the IES Development of survey materials, i.e. data collection instruments and manuals Testing and consultation for the CPS
Publish periodic statistics on life circumstances, poverty and inequality Expand and improve by: Editing and
imputing LCS Assessing poverty
indicators included in the GHS 2014
Testing small area estimation techniques
Publishing a thematic report urban nodes
Publish periodic statistics on life circumstances, poverty and inequality Expand and improve by: Producing poverty
indicators at lower levels of geography (depending on research outcomes)
Publish periodic statistics on life circumstances, poverty and inequality statistics Expand and improve by: Developing and
testing modules for CPS
Producing poverty indicators using CS2016 data
Publishing a thematic report on subjective poverty
Publishing a thematic report on men, women and children
Commence with CPS at provincial level
Subprogramme: Government Financial Statistics (Programme 2: Economics Statistics) 20. Life
circumstances, service delivery and poverty: To expand the statistical information base by increasing its depth, breadth and geographic spread
Statistical information on service delivery of municipalities
Published municipal survey on non-financial statistics as scheduled
Published municipal survey on non-financial statistics as scheduled
Published municipal survey on non-financial statistics as scheduled
Publish municipal survey on non-financial statistics
Publish annual non-financial statistics Expand and improve by: Researching
spatial analysis relating to basic and free basic services provided by the municipality
Publish annual non-financial statistics Expand and improve by: Piloting spatial
analysis relating to basic and free basic services provided by the municipality
Publish annual non-financial statistics Expand and improve by: Publishing spatial
analysis relating to basic and free basic services provided by the municipality
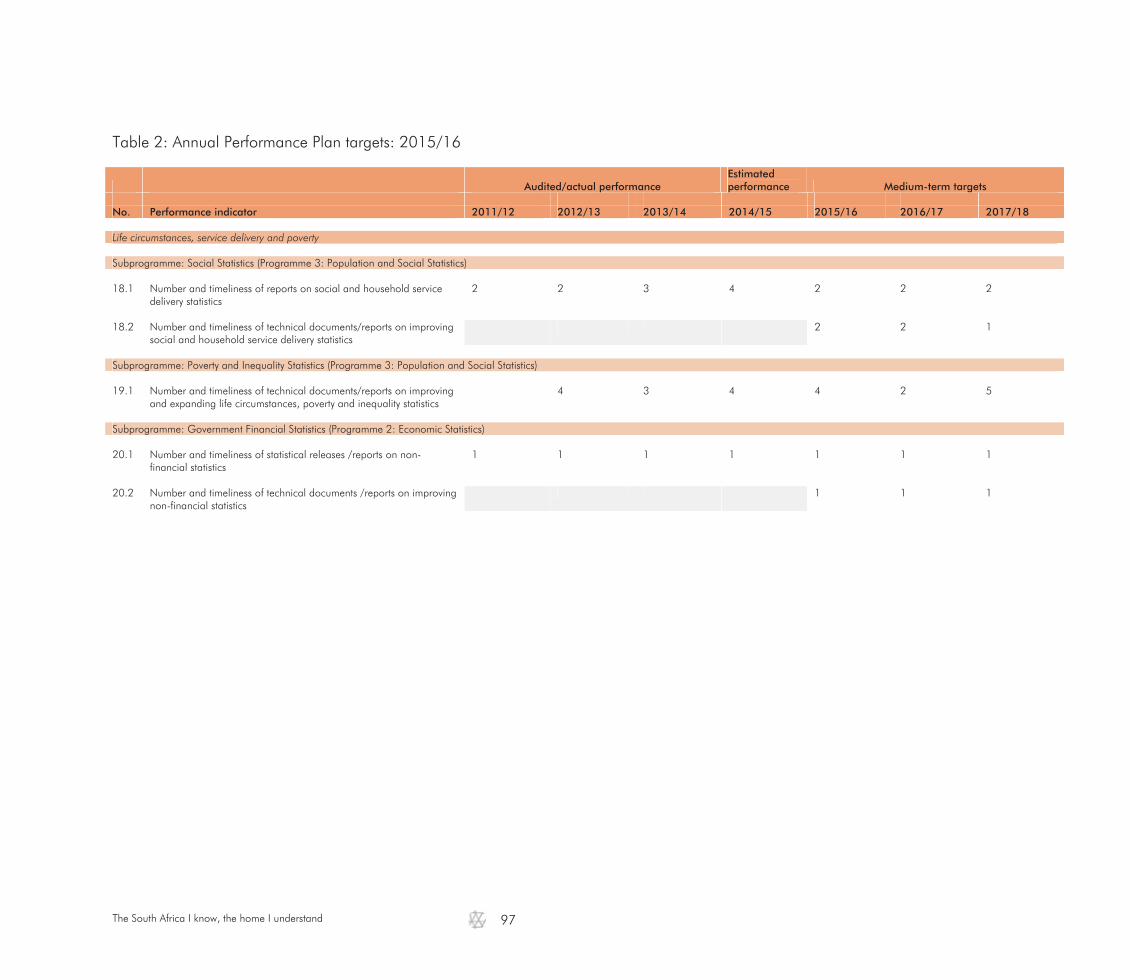
The South Africa I know, the home I understand
97
Table 2: Annual Performance Plan targets: 2015/16
Audited/actual performance Estimated performance Medium-term targets
No. Performance indicator 2011/12 2012/13 2013/14 2014/15 2015/16 2016/17 2017/18 Life circumstances, service delivery and poverty Subprogramme: Social Statistics (Programme 3: Population and Social Statistics) 18.1 Number and timeliness of reports on social and household service
delivery statistics 2 2 3 4 2 2 2
18.2 Number and timeliness of technical documents/reports on improving
social and household service delivery statistics 2 2 1
Subprogramme: Poverty and Inequality Statistics (Programme 3: Population and Social Statistics) 19.1 Number and timeliness of technical documents/reports on improving
and expanding life circumstances, poverty and inequality statistics 4 3 4 4 2 5
Subprogramme: Government Financial Statistics (Programme 2: Economic Statistics) 20.1 Number and timeliness of statistical releases /reports on non-
financial statistics 1 1 1 1 1 1 1
20.2 Number and timeliness of technical documents /reports on improving
non-financial statistics 1 1 1
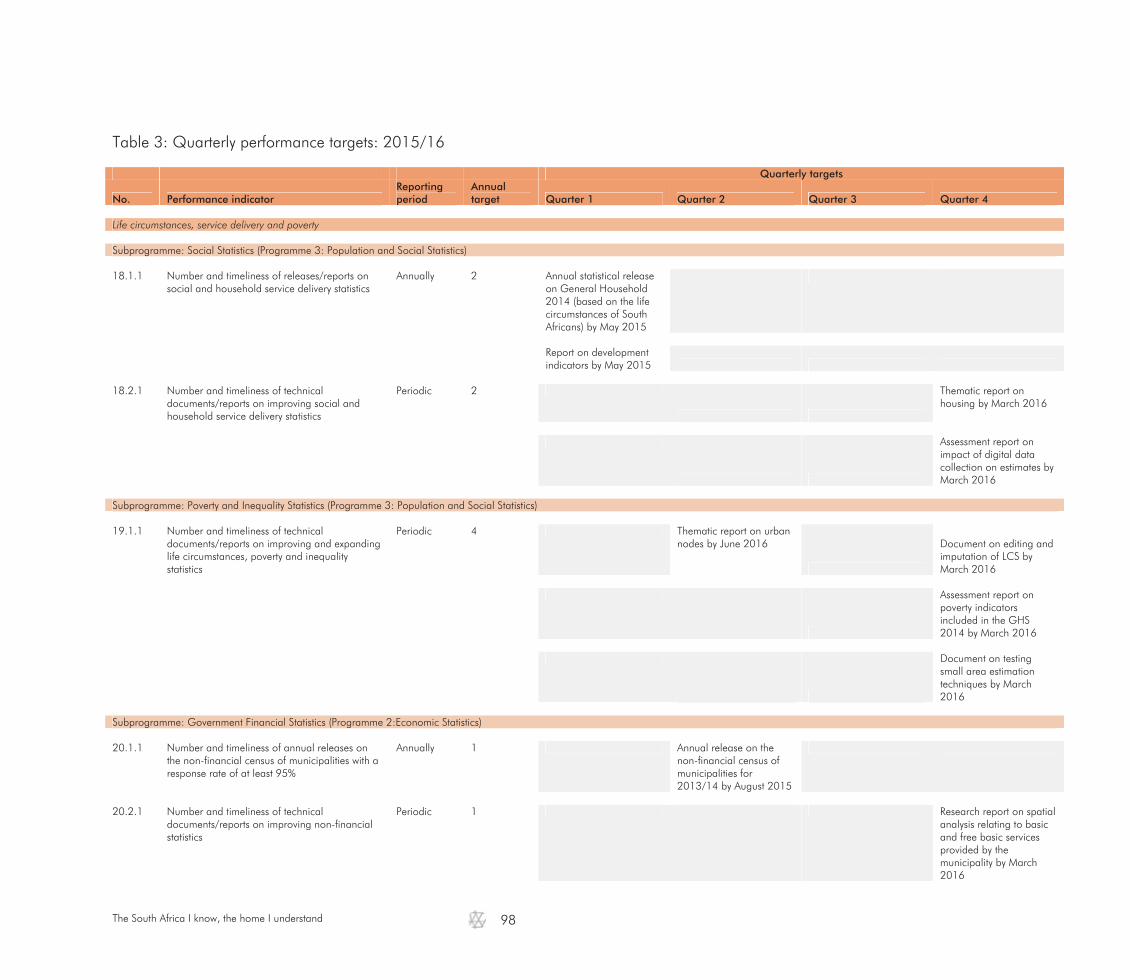
The South Africa I know, the home I understand
98
Table 3: Quarterly performance targets: 2015/16
Quarterly targets
No. Performance indicator Reporting period
Annual target Quarter 1 Quarter 2 Quarter 3 Quarter 4
Life circumstances, service delivery and poverty Subprogramme: Social Statistics (Programme 3: Population and Social Statistics) 18.1.1 Number and timeliness of releases/reports on
social and household service delivery statistics Annually 2 Annual statistical release
on General Household 2014 (based on the life circumstances of South Africans) by May 2015
Report on development
indicators by May 2015 18.2.1 Number and timeliness of technical
documents/reports on improving social and household service delivery statistics
Periodic 2
Thematic report on housing by March 2016
Assessment report on impact of digital data collection on estimates by March 2016
Subprogramme: Poverty and Inequality Statistics (Programme 3: Population and Social Statistics) 19.1.1 Number and timeliness of technical
documents/reports on improving and expanding life circumstances, poverty and inequality statistics
Periodic 4 Thematic report on urban nodes by June 2016
Document on editing and imputation of LCS by March 2016
Assessment report on poverty indicators included in the GHS 2014 by March 2016
Document on testing small area estimation techniques by March 2016
Subprogramme: Government Financial Statistics (Programme 2:Economic Statistics) 20.1.1 Number and timeliness of annual releases on
the non-financial census of municipalities with a response rate of at least 95%
Annually 1 Annual release on the non-financial census of municipalities for 2013/14 by August 2015
20.2.1 Number and timeliness of technical
documents/reports on improving non-financial statistics
Periodic 1 Research report on spatial analysis relating to basic and free basic services provided by the municipality by March 2016
The South Africa I know, the home I understand
99
vii) Population dynamics
Policy context: National, provincial and local governments are working together to improve the quality of service delivery. The main beneficiaries of such initiatives include orphans and vulnerable children, older persons, people with disabilities and other vulnerable groups. Notable outputs benefiting the poorest members of society include increased enrolment ratios for both primary and secondary schooling, and greater access to health care. The changing patterns of migration, mortality and fertility are key datasets where policy responses would seek understanding for informed and appropriate interventions.
Quality health care has mostly been accessible to those who can afford and access it, and not those who need it. Until recently, South Africa's performance against key health indicators has consistently compared poorly with other countries with similar or lower levels of investment and expenditure MTSF. The trajectory for the 2030 vision therefore commences with strengthening of the health system to ensure that all is efficient and responsive and offers financial risk protection. The critical focus areas proposed by the NDP 2030 are consistent with the WHO perspective (MTSF: 2014–2019). We have achieved much over the past twenty years by expanding education and health care, broadened economic participation and extended income support to the most vulnerable. We also acknowledge the importance of our social grant programmes and welfare services in combating poverty, and the role of public health services and child-focused programmes in reducing vulnerability. The main concern, however, is that despite various government initiatives we are still not making enough progress in raising incomes or reducing poverty. Far too many people are unemployed, which deepens inequality and heightens vulnerability (MTBPS: 2014). The following tables outline the strategic, annual and quarterly performance targets to measure population dynamics:

The South Africa I know, the home I understand
100
Table 1: Strategic Plan targets
Audited/actual performance
Estimated performance Medium-term targets
No. Strategic objective Target 2011/12 2012/13 2013/14 2014/15 2015/16 2016/17 2017/18
Population statistics Subprogramme: Population Statistics (Programme 3: Population and Social Statistics) 21. Population
dynamics: To expand the statistical information base by increasing its depth, breadth and geographic spread
Statistical information on the population and households
Processed and analysed data collected from households
Released and published Census 2011 results at all levels
Identify emerging issues emanating from thematic analysis for in-depth investigation
Compile population statistics documents Finalise CS2016
questionnaire and conduct behind the glass testing of new questions
Design CS2016 products plan
Compile a tabulation plan for CS2016
Conduct analysis of CS 2016 test data
Conduct questionnaire validation and product prototypes development
Publish periodic population statistics Publish results of
CS2016 including metadata and data quality statement
Expand and improve by: Assessing data
quality of CS2016 data
Compiling a discussion document on data quality of CS2016 data
Conducting research on emerging population and spatial development issues
Publish periodic population statistics Conduct thematic
in-depth analysis on CS2016 data
Compile thematic reports on CS 2016 data
Expand and improve by: Identifying
emerging population and socio economic issues
Conducting research on emerging population and socio-economic issues including selected SADC countries
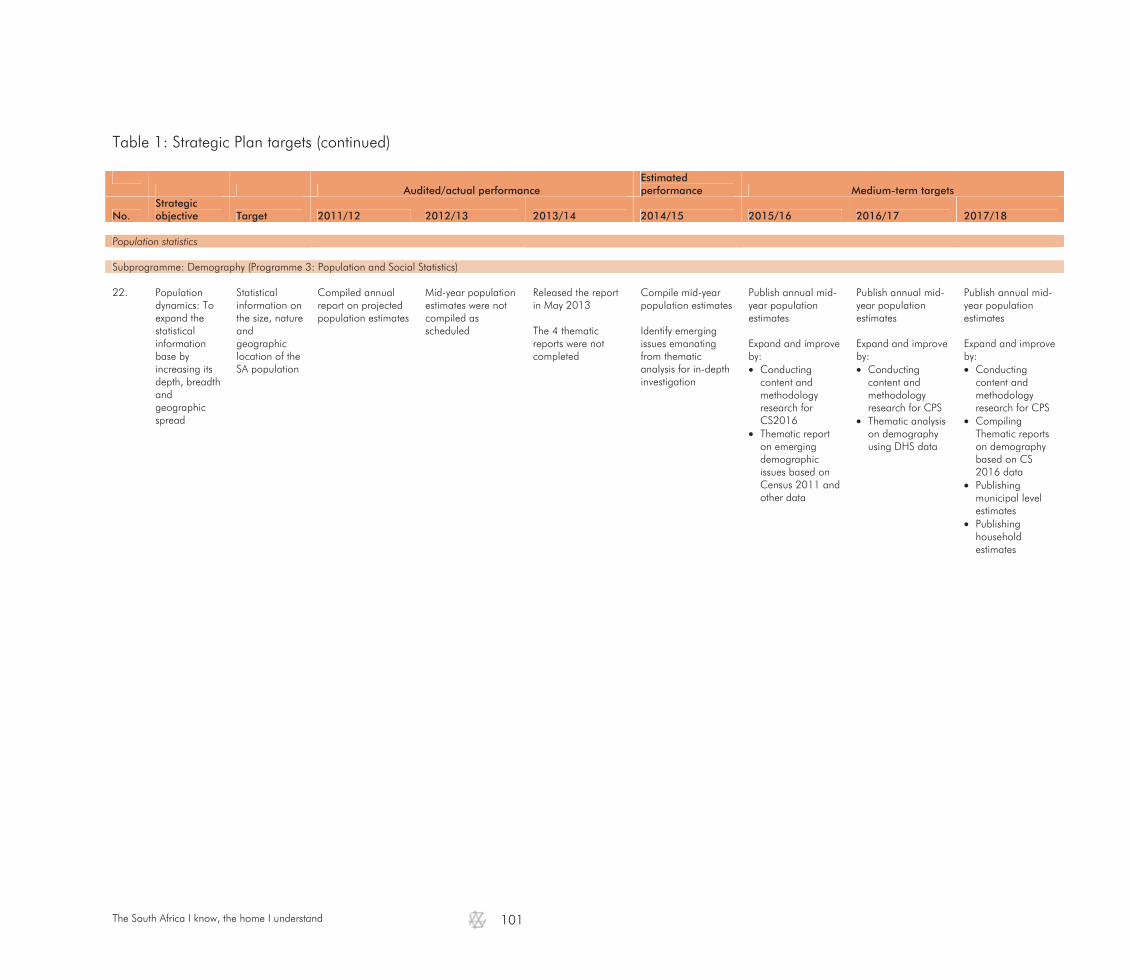
The South Africa I know, the home I understand
101
Table 1: Strategic Plan targets (continued)
Audited/actual performance
Estimated performance Medium-term targets
No. Strategic objective Target 2011/12 2012/13 2013/14 2014/15 2015/16 2016/17 2017/18
Population statistics Subprogramme: Demography (Programme 3: Population and Social Statistics) 22. Population
dynamics: To expand the statistical information base by increasing its depth, breadth and geographic spread
Statistical information on the size, nature and geographic location of the SA population
Compiled annual report on projected population estimates
Mid-year population estimates were not compiled as scheduled
Released the report in May 2013 The 4 thematic reports were not completed
Compile mid-year population estimates Identify emerging issues emanating from thematic analysis for in-depth investigation
Publish annual mid-year population estimates Expand and improve by: Conducting
content and methodology research for CS2016
Thematic report on emerging demographic issues based on Census 2011 and other data
Publish annual mid-year population estimates Expand and improve by: Conducting
content and methodology research for CPS
Thematic analysis on demography using DHS data
Publish annual mid-year population estimates Expand and improve by: Conducting
content and methodology research for CPS
Compiling Thematic reports on demography based on CS 2016 data
Publishing municipal level estimates
Publishing household estimates
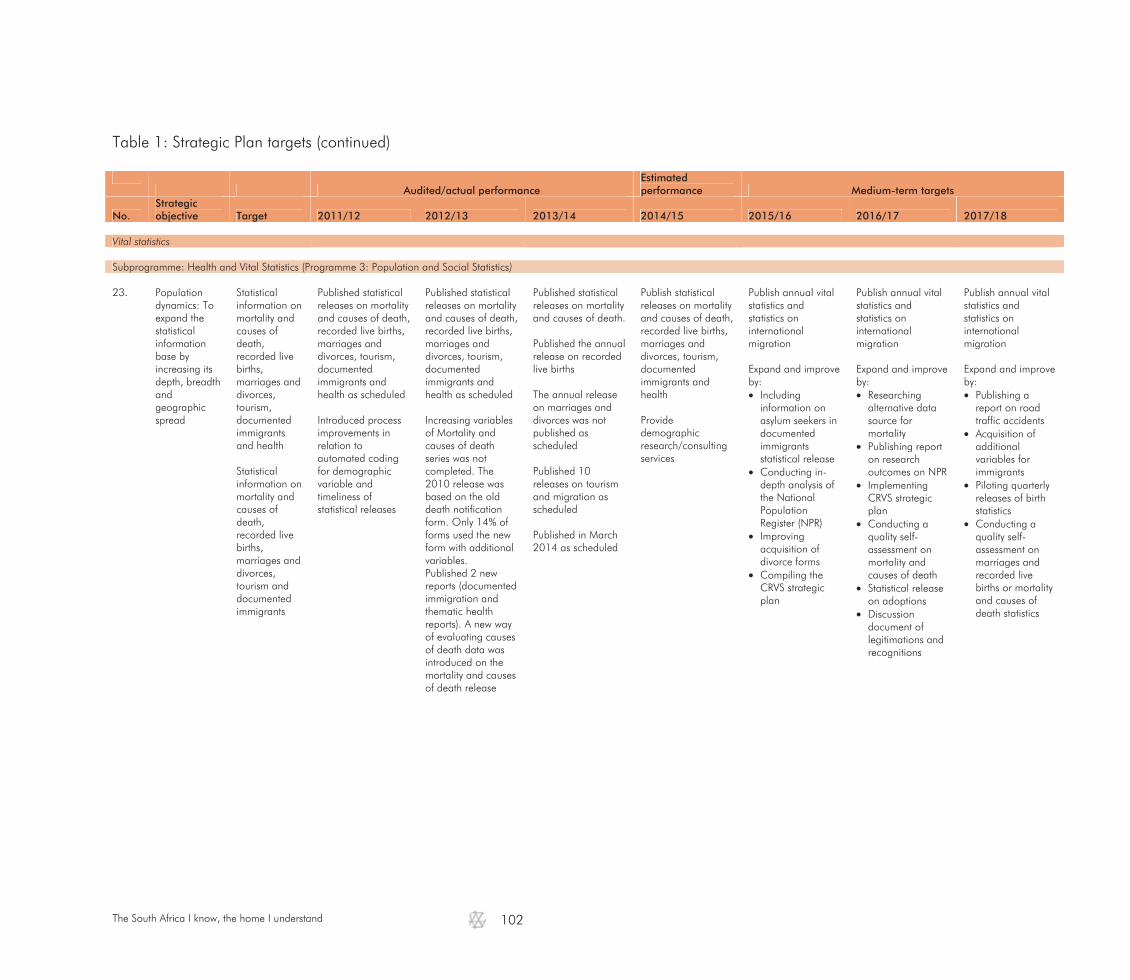
The South Africa I know, the home I understand
102
Table 1: Strategic Plan targets (continued)
Audited/actual performance
Estimated performance Medium-term targets
No. Strategic objective Target 2011/12 2012/13 2013/14 2014/15 2015/16 2016/17 2017/18
Vital statistics Subprogramme: Health and Vital Statistics (Programme 3: Population and Social Statistics) 23. Population
dynamics: To expand the statistical information base by increasing its depth, breadth and geographic spread
Statistical information on mortality and causes of death, recorded live births, marriages and divorces, tourism, documented immigrants and health Statistical information on mortality and causes of death, recorded live births, marriages and divorces, tourism and documented immigrants
Published statistical releases on mortality and causes of death, recorded live births, marriages and divorces, tourism, documented immigrants and health as scheduled Introduced process improvements in relation to automated coding for demographic variable and timeliness of statistical releases
Published statistical releases on mortality and causes of death, recorded live births, marriages and divorces, tourism, documented immigrants and health as scheduled Increasing variables of Mortality and causes of death series was not completed. The 2010 release was based on the old death notification form. Only 14% of forms used the new form with additional variables. Published 2 new reports (documented immigration and thematic health reports). A new way of evaluating causes of death data was introduced on the mortality and causes of death release
Published statistical releases on mortality and causes of death. Published the annual release on recorded live births The annual release on marriages and divorces was not published as scheduled Published 10 releases on tourism and migration as scheduled Published in March 2014 as scheduled
Publish statistical releases on mortality and causes of death, recorded live births, marriages and divorces, tourism, documented immigrants and health Provide demographic research/consulting services
Publish annual vital statistics and statistics on international migration Expand and improve by: Including
information on asylum seekers in documented immigrants statistical release
Conducting in-depth analysis of the National Population Register (NPR)
Improving acquisition of divorce forms
Compiling the CRVS strategic plan
Publish annual vital statistics and statistics on international migration Expand and improve by: Researching
alternative data source for mortality
Publishing report on research outcomes on NPR
Implementing CRVS strategic plan
Conducting a quality self-assessment on mortality and causes of death
Statistical release on adoptions
Discussion document of legitimations and recognitions
Publish annual vital statistics and statistics on international migration Expand and improve by: Publishing a
report on road traffic accidents
Acquisition of additional variables for immigrants
Piloting quarterly releases of birth statistics
Conducting a quality self-assessment on marriages and recorded live births or mortality and causes of death statistics
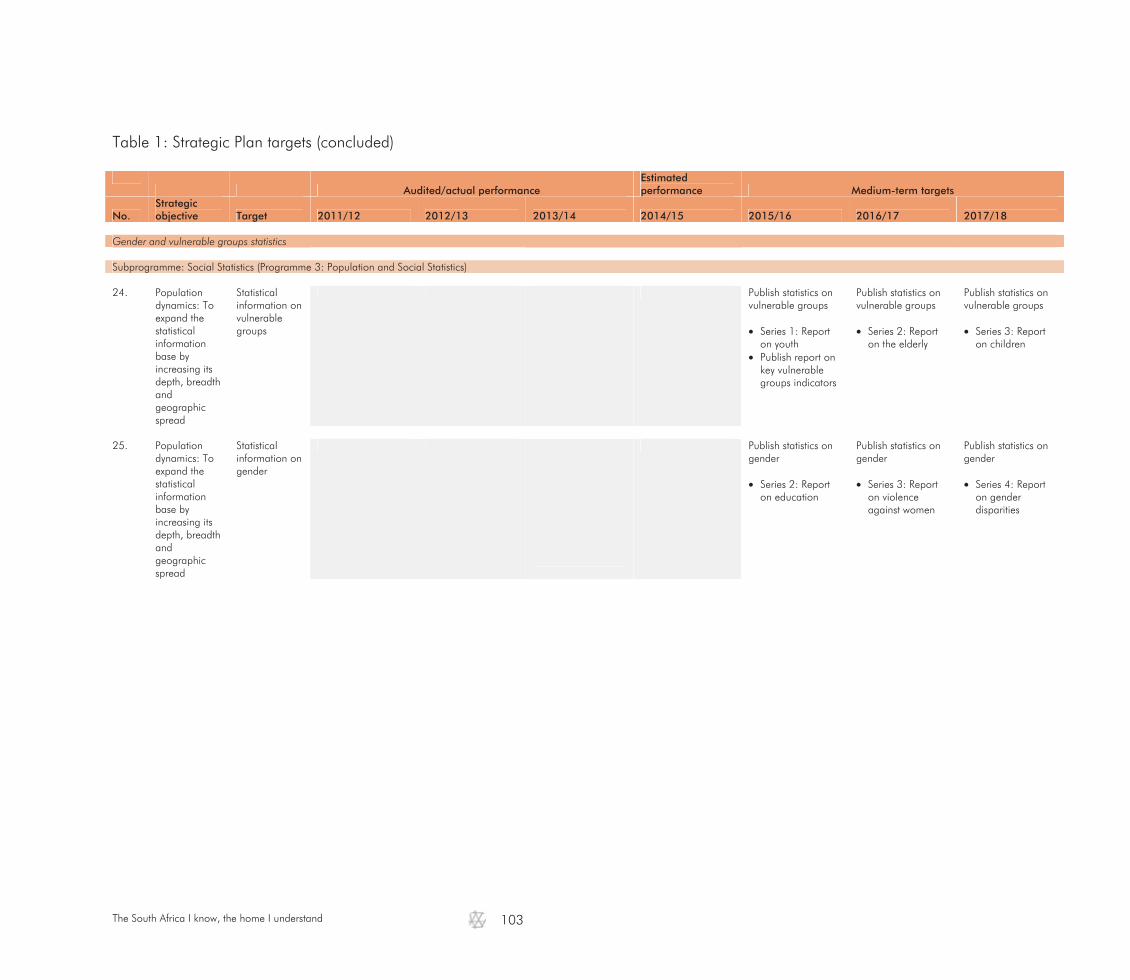
The South Africa I know, the home I understand
103
Table 1: Strategic Plan targets (concluded)
Audited/actual performance
Estimated performance Medium-term targets
No. Strategic objective Target 2011/12 2012/13 2013/14 2014/15 2015/16 2016/17 2017/18
Gender and vulnerable groups statistics Subprogramme: Social Statistics (Programme 3: Population and Social Statistics) 24. Population
dynamics: To expand the statistical information base by increasing its depth, breadth and geographic spread
Statistical information on vulnerable groups
Publish statistics on vulnerable groups Series 1: Report
on youth Publish report on
key vulnerable groups indicators
Publish statistics on vulnerable groups Series 2: Report
on the elderly
Publish statistics on vulnerable groups Series 3: Report
on children
25. Population
dynamics: To expand the statistical information base by increasing its depth, breadth and geographic spread
Statistical information on gender
Publish statistics on gender Series 2: Report
on education
Publish statistics on gender Series 3: Report
on violence against women
Publish statistics on gender Series 4: Report
on gender disparities
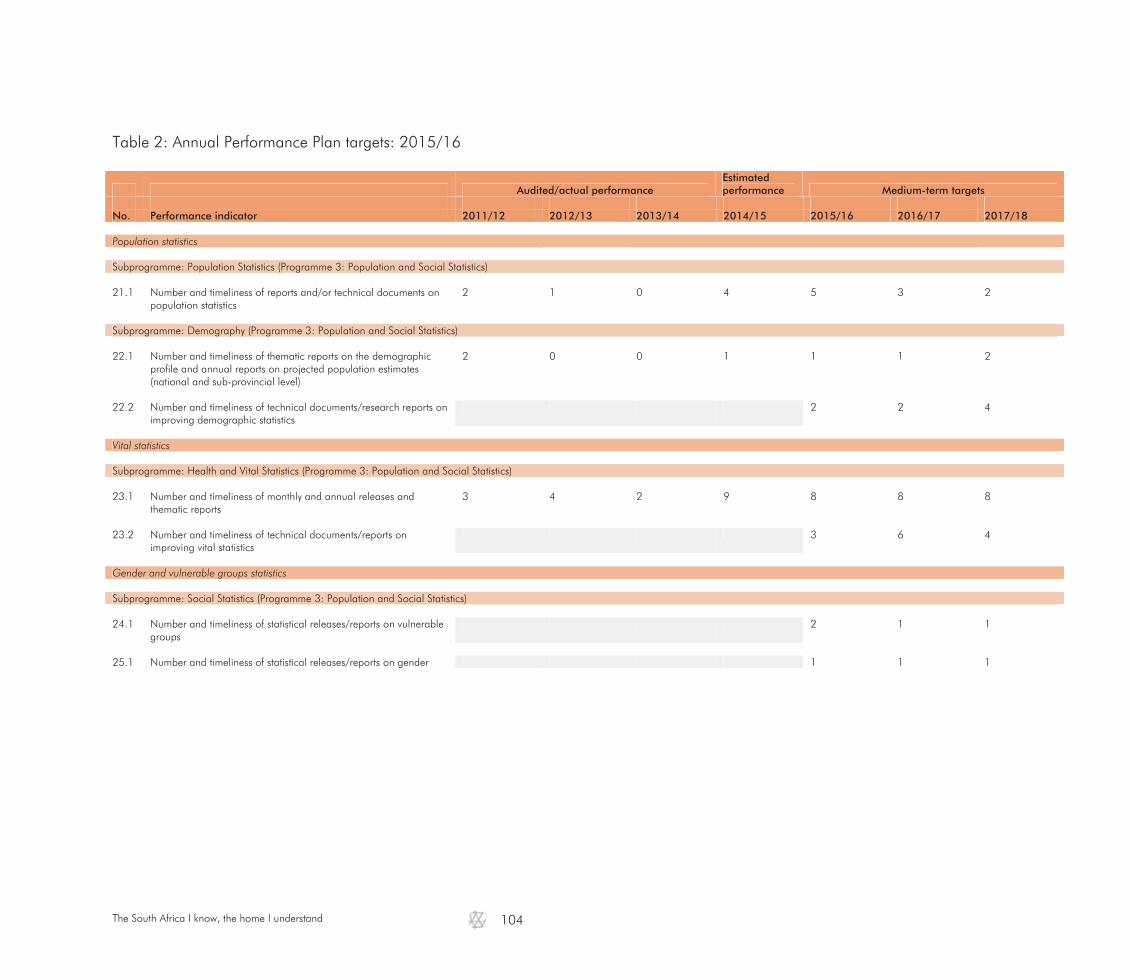
The South Africa I know, the home I understand
104
Table 2: Annual Performance Plan targets: 2015/16
Audited/actual performance Estimated performance Medium-term targets
No. Performance indicator 2011/12 2012/13 2013/14 2014/15 2015/16 2016/17 2017/18 Population statistics Subprogramme: Population Statistics (Programme 3: Population and Social Statistics) 21.1 Number and timeliness of reports and/or technical documents on
population statistics 2 1 0 4 5 3 2
Subprogramme: Demography (Programme 3: Population and Social Statistics) 22.1 Number and timeliness of thematic reports on the demographic
profile and annual reports on projected population estimates (national and sub-provincial level)
2 0 0 1 1
1 2
22.2 Number and timeliness of technical documents/research reports on
improving demographic statistics 2 2 4
Vital statistics Subprogramme: Health and Vital Statistics (Programme 3: Population and Social Statistics) 23.1 Number and timeliness of monthly and annual releases and
thematic reports 3 4 2 9 8 8 8
23.2 Number and timeliness of technical documents/reports on
improving vital statistics 3 6 4
Gender and vulnerable groups statistics Subprogramme: Social Statistics (Programme 3: Population and Social Statistics) 24.1 Number and timeliness of statistical releases/reports on vulnerable
groups 2 1 1
25.1 Number and timeliness of statistical releases/reports on gender 1 1 1

The South Africa I know, the home I understand
105
Table 3: Quarterly performance targets: 2015/16
Quarterly targets
No. Performance indicator Reporting period
Annual target Quarter 1 Quarter 2 Quarter 3 Quarter 4
Population statistics Subprogramme: Population Statistics (Programme 3: Population and Social Statistics) 21.1.1 Number and timeliness of reports and/or
technical documents on population statistics Periodic 5 Revised CS2016
questionnaire based on behind-the-glass-test by March 2016
Designed CS2016 products plan by March 2016
Tabulation plan for CS2016 by March 2016
Analysis report on conducting of CS2016 data by March 2016
Questionnaire validation and product prototypes development by March 2016
Subprogramme: Demography (Programme 3: Population and Social Statistics) 22.1.1 Number and timeliness of annual reports
estimating the population (national, provincial and sub-provincial level)
Annually 1 Annual population estimates by July 2015
22.2.1 Number and timeliness of technical
documents/research reports on improving demographic statistics
Periodic 2 Thematic report on emerging demographic issues based on Census 2011 and other data by March 2016
Content and methodology
research report for CS2016 by March 2016
Vital statistics Subprogramme: Health and Vital Statistics (Programme 3: Population and Social Statistics) 23.1.1 Number and timeliness of statistical releases Annually 2
Annual release on Recorded live births (2014) by August 2015
Annual release on Mortality and Causes of death (2014) by November 2015
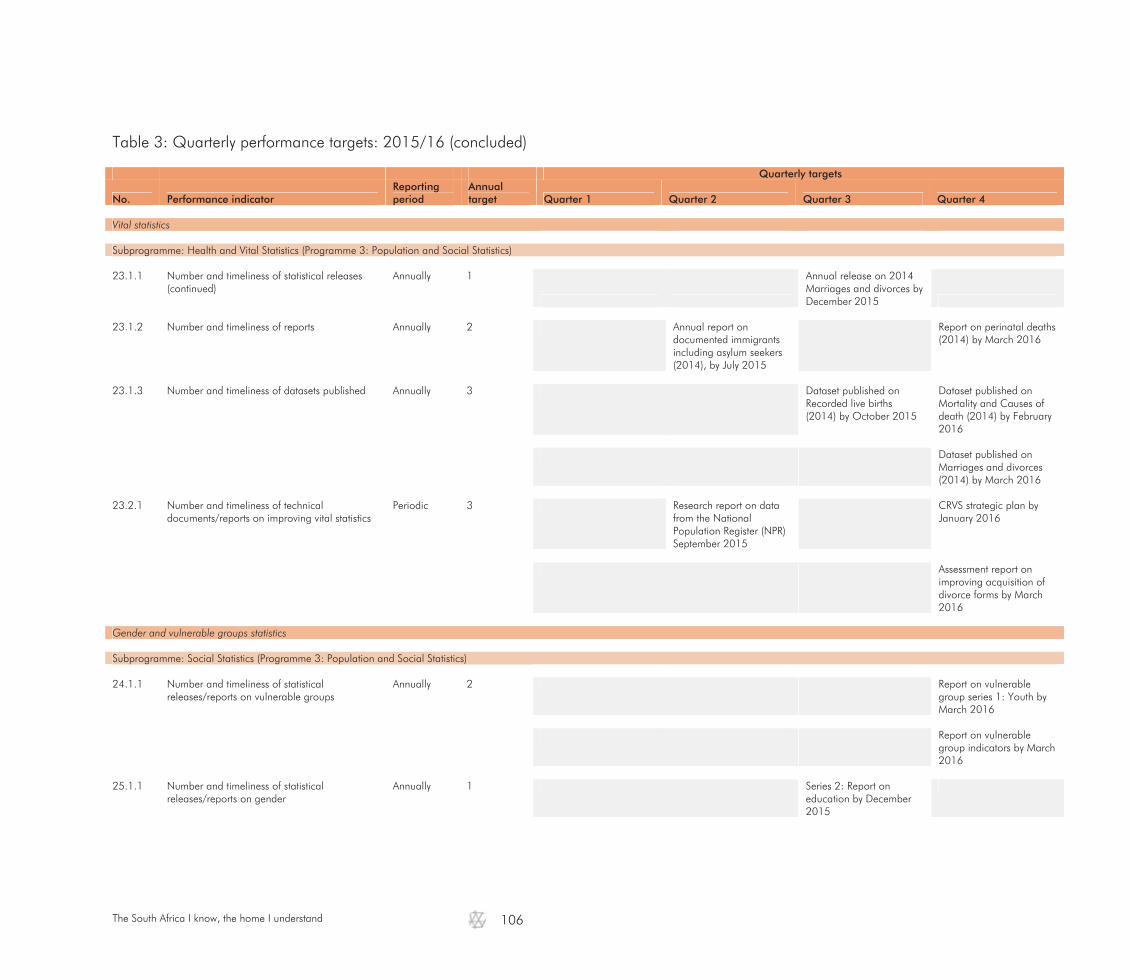
The South Africa I know, the home I understand
106
Table 3: Quarterly performance targets: 2015/16 (concluded)
Quarterly targets
No. Performance indicator Reporting period
Annual target Quarter 1 Quarter 2 Quarter 3 Quarter 4
Vital statistics Subprogramme: Health and Vital Statistics (Programme 3: Population and Social Statistics) 23.1.1 Number and timeliness of statistical releases
(continued) Annually 1
Annual release on 2014 Marriages and divorces by December 2015
23.1.2 Number and timeliness of reports Annually 2 Annual report on
documented immigrants including asylum seekers (2014), by July 2015
Report on perinatal deaths (2014) by March 2016
23.1.3 Number and timeliness of datasets published Annually 3 Dataset published on
Recorded live births (2014) by October 2015
Dataset published on Mortality and Causes of death (2014) by February 2016
Dataset published on
Marriages and divorces (2014) by March 2016
23.2.1 Number and timeliness of technical
documents/reports on improving vital statistics Periodic 3 Research report on data
from the National Population Register (NPR) September 2015
CRVS strategic plan by January 2016
Assessment report on
improving acquisition of divorce forms by March 2016
Gender and vulnerable groups statistics Subprogramme: Social Statistics (Programme 3: Population and Social Statistics) 24.1.1 Number and timeliness of statistical
releases/reports on vulnerable groups Annually 2 Report on vulnerable
group series 1: Youth by March 2016
Report on vulnerable
group indicators by March 2016
25.1.1 Number and timeliness of statistical
releases/reports on gender Annually 1 Series 2: Report on
education by December 2015
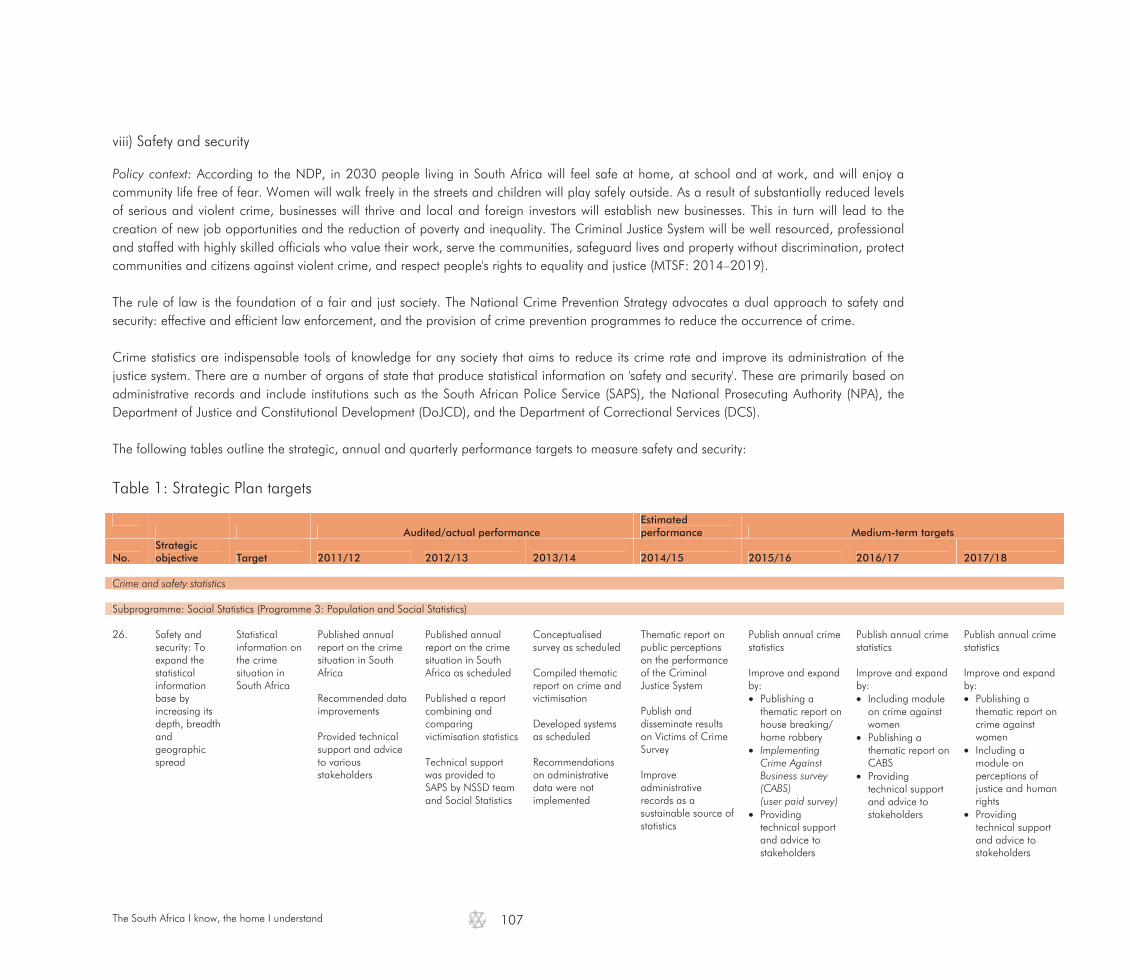
The South Africa I know, the home I understand
107
viii) Safety and security
Policy context: According to the NDP, in 2030 people living in South Africa will feel safe at home, at school and at work, and will enjoy a community life free of fear. Women will walk freely in the streets and children will play safely outside. As a result of substantially reduced levels of serious and violent crime, businesses will thrive and local and foreign investors will establish new businesses. This in turn will lead to the creation of new job opportunities and the reduction of poverty and inequality. The Criminal Justice System will be well resourced, professional and staffed with highly skilled officials who value their work, serve the communities, safeguard lives and property without discrimination, protect communities and citizens against violent crime, and respect people's rights to equality and justice (MTSF: 2014–2019). The rule of law is the foundation of a fair and just society. The National Crime Prevention Strategy advocates a dual approach to safety and security: effective and efficient law enforcement, and the provision of crime prevention programmes to reduce the occurrence of crime. Crime statistics are indispensable tools of knowledge for any society that aims to reduce its crime rate and improve its administration of the justice system. There are a number of organs of state that produce statistical information on 'safety and security'. These are primarily based on administrative records and include institutions such as the South African Police Service (SAPS), the National Prosecuting Authority (NPA), the Department of Justice and Constitutional Development (DoJCD), and the Department of Correctional Services (DCS). The following tables outline the strategic, annual and quarterly performance targets to measure safety and security: Table 1: Strategic Plan targets
Audited/actual performance
Estimated performance Medium-term targets
No. Strategic objective Target 2011/12 2012/13 2013/14 2014/15 2015/16 2016/17 2017/18
Crime and safety statistics Subprogramme: Social Statistics (Programme 3: Population and Social Statistics) 26. Safety and
security: To expand the statistical information base by increasing its depth, breadth and geographic spread
Statistical information on the crime situation in South Africa
Published annual report on the crime situation in South Africa Recommended data improvements Provided technical support and advice to various stakeholders
Published annual report on the crime situation in South Africa as scheduled Published a report combining and comparing victimisation statistics Technical support was provided to SAPS by NSSD team and Social Statistics
Conceptualised survey as scheduled Compiled thematic report on crime and victimisation Developed systems as scheduled Recommendations on administrative data were not implemented
Thematic report on public perceptions on the performance of the Criminal Justice System Publish and disseminate results on Victims of Crime Survey Improve administrative records as a sustainable source of statistics
Publish annual crime statistics Improve and expand by: Publishing a
thematic report on house breaking/ home robbery
Implementing Crime Against Business survey (CABS) (user paid survey)
Providing technical support and advice to stakeholders
Publish annual crime statistics Improve and expand by: Including module
on crime against women
Publishing a thematic report on CABS
Providing technical support and advice to stakeholders
Publish annual crime statistics Improve and expand by: Publishing a
thematic report on crime against women
Including a module on perceptions of justice and human rights
Providing technical support and advice to stakeholders

The South Africa I know, the home I understand
108
Table 2: Annual Performance Plan targets: 2015/16
Audited/actual performance Estimated performance Medium-term targets
No. Performance indicator 2011/12 2012/13 2013/14 2014/15 2015/16 2016/17 2017/18 Crime and safety statistics Subprogramme: Social Statistics (Programme 3: Population and Social Statistics) 26.1 Number and timeliness of statistical releases/reports on crime 2 3 3 2 1 1 1 26.2 Number and timeliness of technical documents/reports on improving
crime statistics 2 2 2
Table 3: Quarterly performance targets: 2015/16
Quarterly targets
No. Performance indicator Reporting period
Annual target Quarter 1 Quarter 2 Quarter 3 Quarter 4
Crime and safety statistics Subprogramme: Social Statistics (Programme 3: Population and Social Statistics) 26.1.1 Number and timeliness of statistical
releases/reports on crime Annually 1
Annual statistical release on Victims of Crime by December 2015
26.2.1 Number and timeliness of technical
documents/reports on improving crime statistics Periodic 2
Report on Crime series 3: Housebreaking and home robbery by March 2016
Report on technical support provided to stakeholders by March 2016

The South Africa I know, the home I understand
109
ix) Health
Policy context: Since the advent of the democratic dispensation in 1994, progressive policies were introduced to transform the health system into an integrated, comprehensive national health system. Despite this, and significant investment and expenditure, the South African health sector has largely been beset with various challenges that include burden of diseases, poor quality of public health care, inefficient health systems and spiralling private health care costs (MTSF: 2014–2019).
The quality of health services needs to be improved and remains one of the top priorities of government spending. Building capacity and strengthening accountability of the public sector is critical, particularly at local government level and in state-owned companies (MTBPS: 2014). The following tables outline the strategic, annual and quarterly performance targets to measure health services: Table 1: Strategic Plan targets
Audited/actual performance
Estimated performance Medium-term targets
No. Strategic objective Target 2011/12 2012/13 2013/14 2014/15 2015/16 2016/17 2017/18
Health statistics Subprogramme: Health and Vital Statistics (Programme 3: Population and Social Statistics) 27. Health: To
expand the statistical information base by increasing its depth, breadth and geographic spread
Statistical information on health
Publish annual reports on health statistics Improve and expand by: Collaborating
with DoH and MRC on conducting the Demographic and Health Survey (DHS)
Publish annual reports on health statistics Improve and expand by: Publishing DHS
report
Publish annual reports on health statistics Improve and expand by: Publishing a
thematic report on the population, health and nutrition
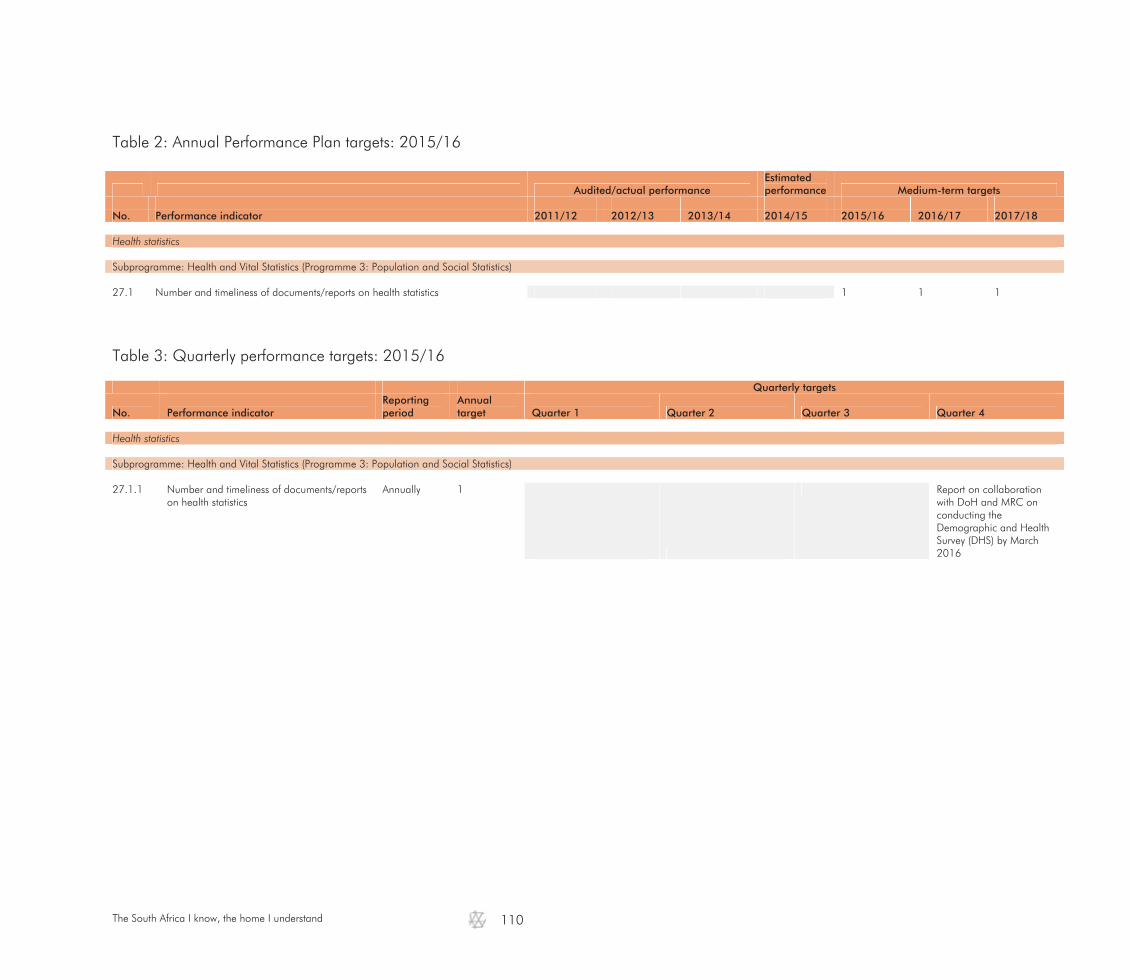
The South Africa I know, the home I understand
110
Table 2: Annual Performance Plan targets: 2015/16
Audited/actual performance Estimated performance Medium-term targets
No. Performance indicator 2011/12 2012/13 2013/14 2014/15 2015/16 2016/17 2017/18 Health statistics Subprogramme: Health and Vital Statistics (Programme 3: Population and Social Statistics) 27.1 Number and timeliness of documents/reports on health statistics 1 1 1
Table 3: Quarterly performance targets: 2015/16
Quarterly targets
No. Performance indicator Reporting period
Annual target Quarter 1 Quarter 2 Quarter 3 Quarter 4
Health statistics Subprogramme: Health and Vital Statistics (Programme 3: Population and Social Statistics) 27.1.1 Number and timeliness of documents/reports
on health statistics Annually 1
Report on collaboration with DoH and MRC on conducting the Demographic and Health Survey (DHS) by March 2016

The South Africa I know, the home I understand
111
x) Education
Policy context: Education is seen as an important instrument in equalising individuals' life chances, preparing next generations to be economically mobile and successful and critical to poverty reduction. To achieve this, South Africans will have access to education and training of the highest quality, leading to significantly improved learning outcomes. The performance of South African learners in international standardised tests will be comparable to the performance of learners from other countries at similar level of development and with similar level of access. The education system will play a greater role in building an inclusive society, providing equal opportunities and helping all South Africans to realise their full potential, in particular those previously disadvantaged (MTSF: 2014–2019). The following tables outline the strategic, annual and quarterly performance targets to measure education: Table 1: Strategic Plan targets
Audited/actual performance
Estimated performance Medium-term targets
No. Strategic objective Target 2011/12 2012/13 2013/14 2014/15 2015/16 2016/17 2017/18
Education Statistics Subprogramme: Social Statistics (Programme 3: Population and Social Statistics) 28. Education: To
expand the statistical information base by increasing its depth, breadth and geographic spread
Statistical information on education
Publish education statistics (annual education statistics are published as part of the GHS release) Thematic report
on schooling in the Eastern Cape
Publish education statistics (annual education statistics are published through the GHS release) Thematic report
on education
Publish education statistics (annual education statistics are published through the GHS release) Thematic report
on early childhood development
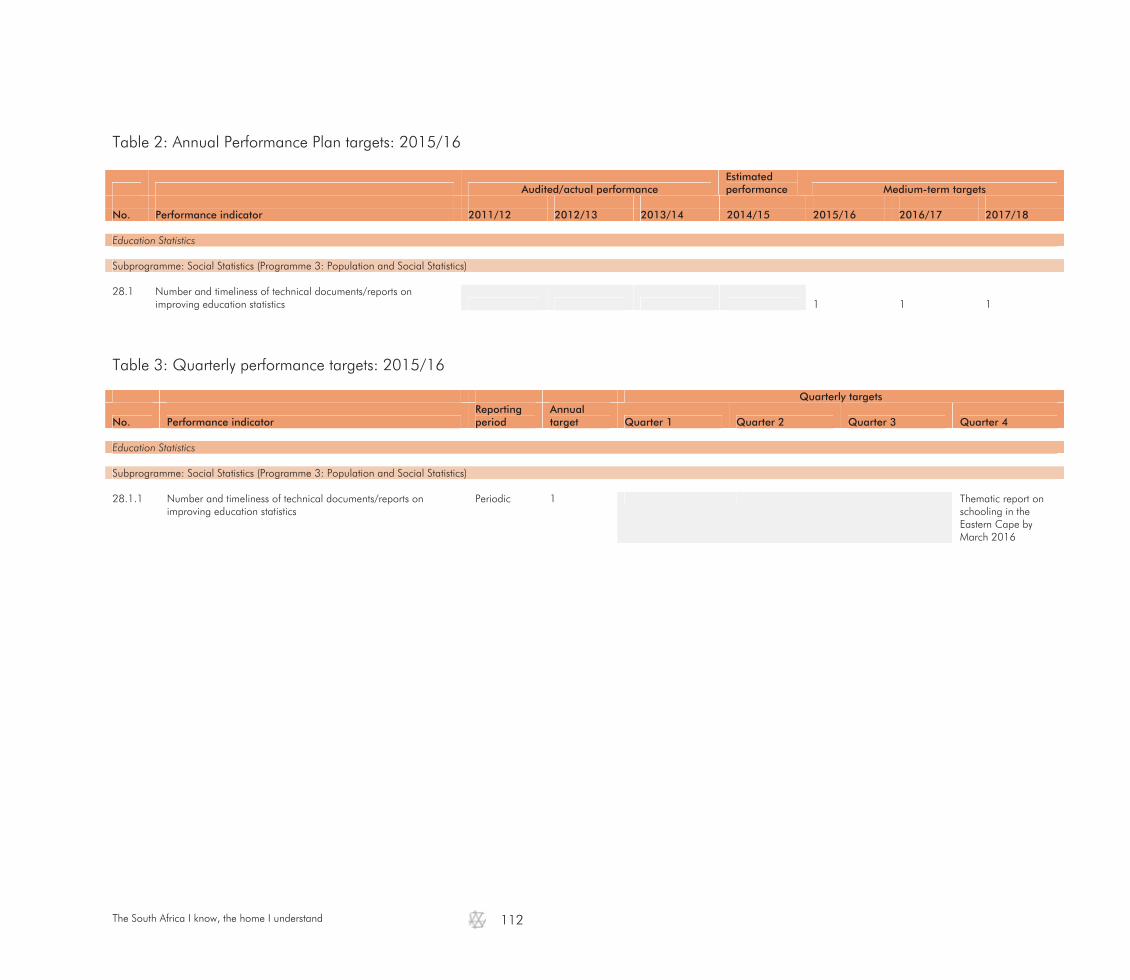
The South Africa I know, the home I understand
112
Table 2: Annual Performance Plan targets: 2015/16
Audited/actual performance Estimated performance Medium-term targets
No. Performance indicator 2011/12 2012/13 2013/14 2014/15 2015/16 2016/17 2017/18 Education Statistics Subprogramme: Social Statistics (Programme 3: Population and Social Statistics) 28.1 Number and timeliness of technical documents/reports on
improving education statistics 1 1 1
Table 3: Quarterly performance targets: 2015/16
Quarterly targets
No. Performance indicator Reporting period
Annual target Quarter 1 Quarter 2 Quarter 3 Quarter 4
Education Statistics Subprogramme: Social Statistics (Programme 3: Population and Social Statistics) 28.1.1 Number and timeliness of technical documents/reports on
improving education statistics Periodic 1 Thematic report on
schooling in the Eastern Cape by March 2016
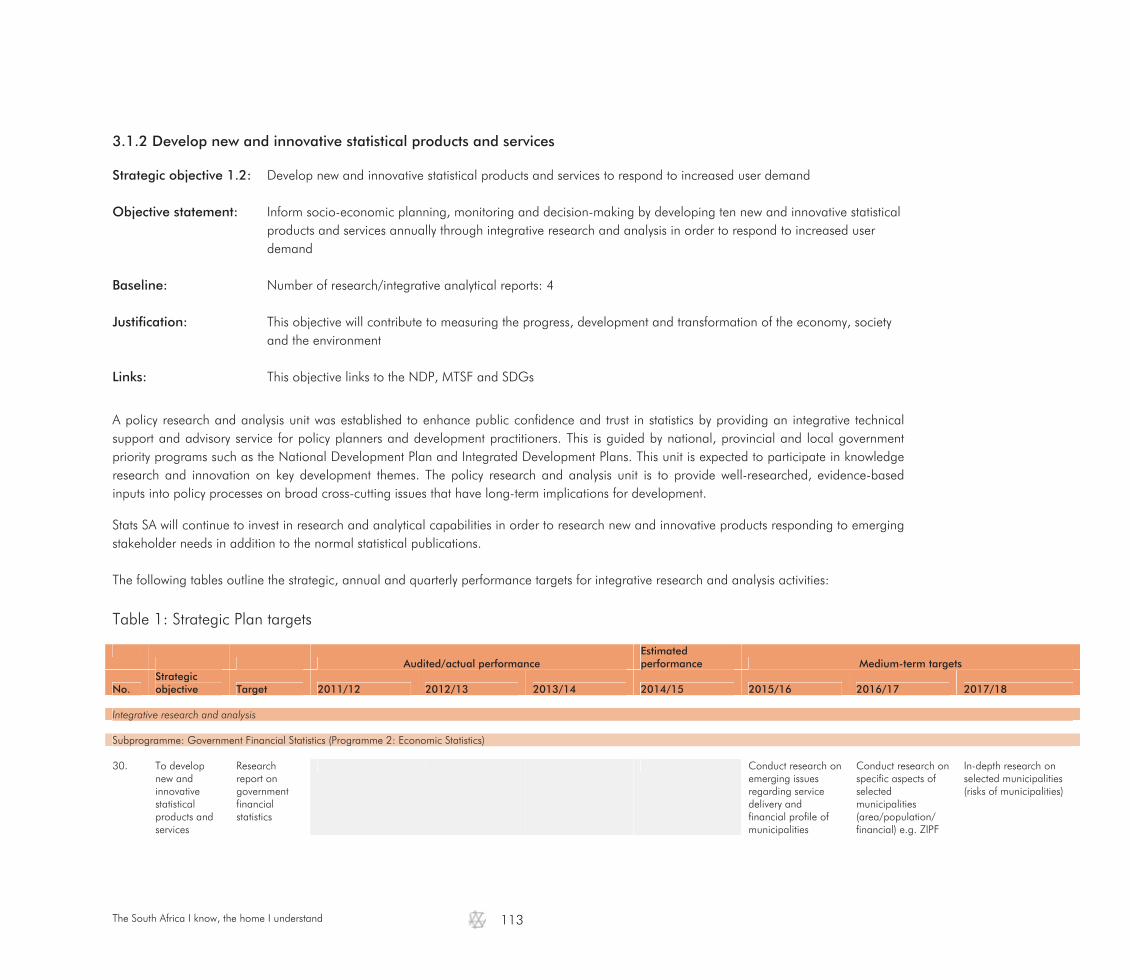
The South Africa I know, the home I understand
113
3.1.2 Develop new and innovative statistical products and services
Strategic objective 1.2: Develop new and innovative statistical products and services to respond to increased user demand Objective statement: Inform socio-economic planning, monitoring and decision-making by developing ten new and innovative statistical
products and services annually through integrative research and analysis in order to respond to increased user demand
Baseline: Number of research/integrative analytical reports: 4 Justification: This objective will contribute to measuring the progress, development and transformation of the economy, society
and the environment Links: This objective links to the NDP, MTSF and SDGs
A policy research and analysis unit was established to enhance public confidence and trust in statistics by providing an integrative technical support and advisory service for policy planners and development practitioners. This is guided by national, provincial and local government priority programs such as the National Development Plan and Integrated Development Plans. This unit is expected to participate in knowledge research and innovation on key development themes. The policy research and analysis unit is to provide well-researched, evidence-based inputs into policy processes on broad cross-cutting issues that have long-term implications for development.
Stats SA will continue to invest in research and analytical capabilities in order to research new and innovative products responding to emerging stakeholder needs in addition to the normal statistical publications. The following tables outline the strategic, annual and quarterly performance targets for integrative research and analysis activities: Table 1: Strategic Plan targets
Audited/actual performance
Estimated performance Medium-term targets
No. Strategic objective Target 2011/12 2012/13 2013/14 2014/15 2015/16 2016/17 2017/18
Integrative research and analysis Subprogramme: Government Financial Statistics (Programme 2: Economic Statistics) 30. To develop
new and innovative statistical products and services
Research report on government financial statistics
Conduct research on emerging issues regarding service delivery and financial profile of municipalities
Conduct research on specific aspects of selected municipalities (area/population/ financial) e.g. ZIPF
In-depth research on selected municipalities (risks of municipalities)
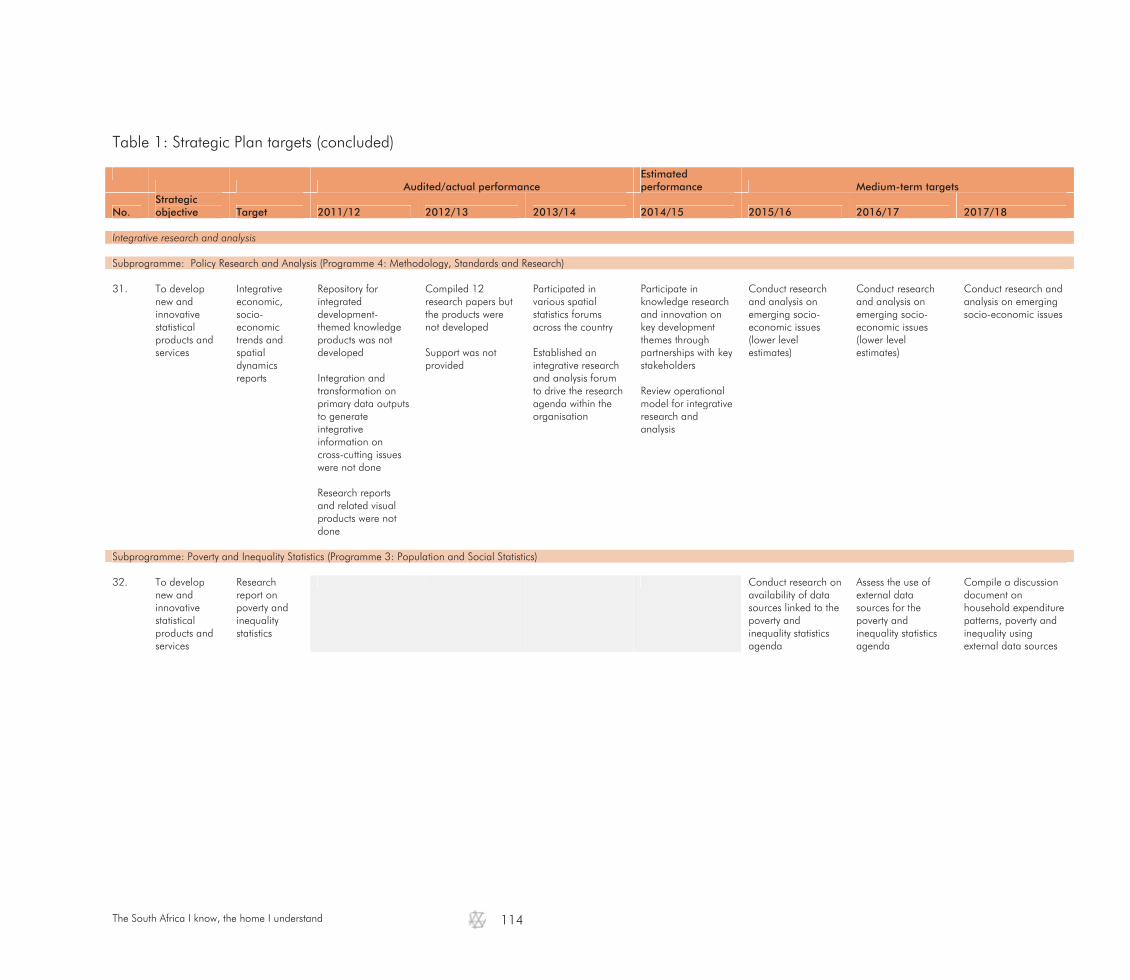
The South Africa I know, the home I understand
114
Table 1: Strategic Plan targets (concluded)
Audited/actual performance
Estimated performance Medium-term targets
No. Strategic objective Target 2011/12 2012/13 2013/14 2014/15 2015/16 2016/17 2017/18
Integrative research and analysis Subprogramme: Policy Research and Analysis (Programme 4: Methodology, Standards and Research) 31. To develop
new and innovative statistical products and services
Integrative economic, socio-economic trends and spatial dynamics reports
Repository for integrated development-themed knowledge products was not developed Integration and transformation on primary data outputs to generate integrative information on cross-cutting issues were not done Research reports and related visual products were not done
Compiled 12 research papers but the products were not developed Support was not provided
Participated in various spatial statistics forums across the country Established an integrative research and analysis forum to drive the research agenda within the organisation
Participate in knowledge research and innovation on key development themes through partnerships with key stakeholders Review operational model for integrative research and analysis
Conduct research and analysis on emerging socio-economic issues (lower level estimates)
Conduct research and analysis on emerging socio-economic issues (lower level estimates)
Conduct research and analysis on emerging socio-economic issues
Subprogramme: Poverty and Inequality Statistics (Programme 3: Population and Social Statistics) 32. To develop
new and innovative statistical products and services
Research report on poverty and inequality statistics
Conduct research on availability of data sources linked to the poverty and inequality statistics agenda
Assess the use of external data sources for the poverty and inequality statistics agenda
Compile a discussion document on household expenditure patterns, poverty and inequality using external data sources

The South Africa I know, the home I understand
115
Table 2: Annual Performance Plan targets: 2015/16
Audited/actual performance Estimated performance Medium-term targets
No. Performance indicator 2011/12 2012/13 2013/14 2014/15 2015/16 2016/17 2017/18 Integrative research and analysis Subprogramme: Government Financial Statistics (Programme 2: Economic Statistics) 30.1 Number of research documents/reports on government
financial statistics 1 1 1
Subprogramme: Policy Research and Analysis (Programme 4: Methodology, Evaluation and Research) 31.1 Number of research reports on policy research and analysis 12 12 5 6 6 6 6 Subprogramme: Poverty and Inequality Statistics (Programme 3: Population and Social Statistics) 32.1 Number of research documents/reports on poverty and
inequality statistics
1 1 1
Table 3: Quarterly performance targets: 2015/16
Quarterly targets
No. Performance indicator Reporting period
Annual target Quarter 1 Quarter 2 Quarter 3 Quarter 4
Integrative research and analysis Subprogramme: Government Financial Statistics (Programme 2: Economic Statistics) 30.1.1 Number of research reports on government financial statistics Periodic 1 Research report on
emerging issues regarding service delivery and financial profile of municipalities by March 2016
Subprogramme: Policy Research and Analysis (Programme 4: Methodology, Evaluation and Research) 31.1.1 Number of research reports on government's socio-economic
planning: applications of estimation models/the development of estimates
Quarterly
4 1 1 1 1
31.1.2 Number of research reports on spatial analysis Annually 2 Research report on
spatial analysis by September 2015
Research report on spatial analysis by March 2016
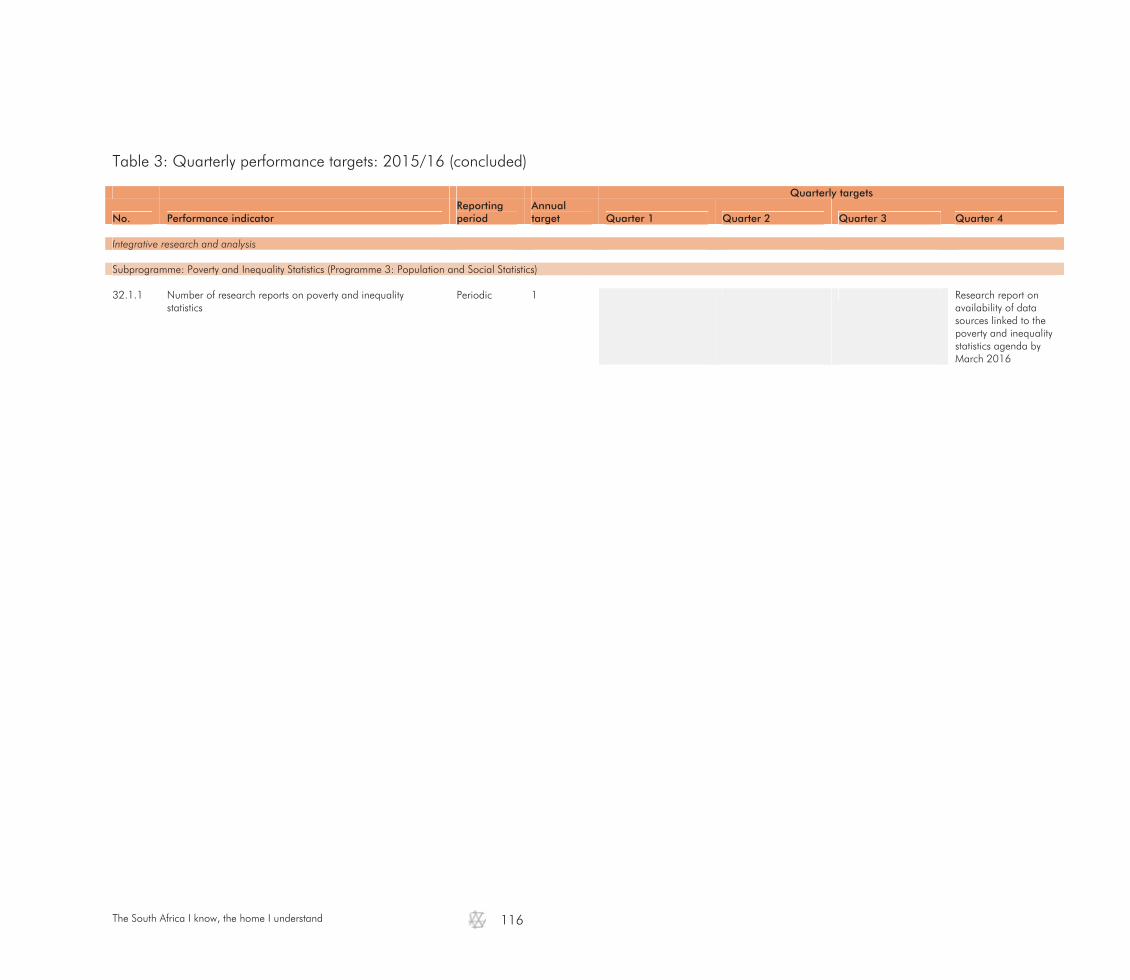
The South Africa I know, the home I understand
116
Table 3: Quarterly performance targets: 2015/16 (concluded)
Quarterly targets
No. Performance indicator Reporting period
Annual target Quarter 1 Quarter 2 Quarter 3 Quarter 4
Integrative research and analysis Subprogramme: Poverty and Inequality Statistics (Programme 3: Population and Social Statistics) 32.1.1 Number of research reports on poverty and inequality
statistics Periodic 1 Research report on
availability of data sources linked to the poverty and inequality statistics agenda by March 2016
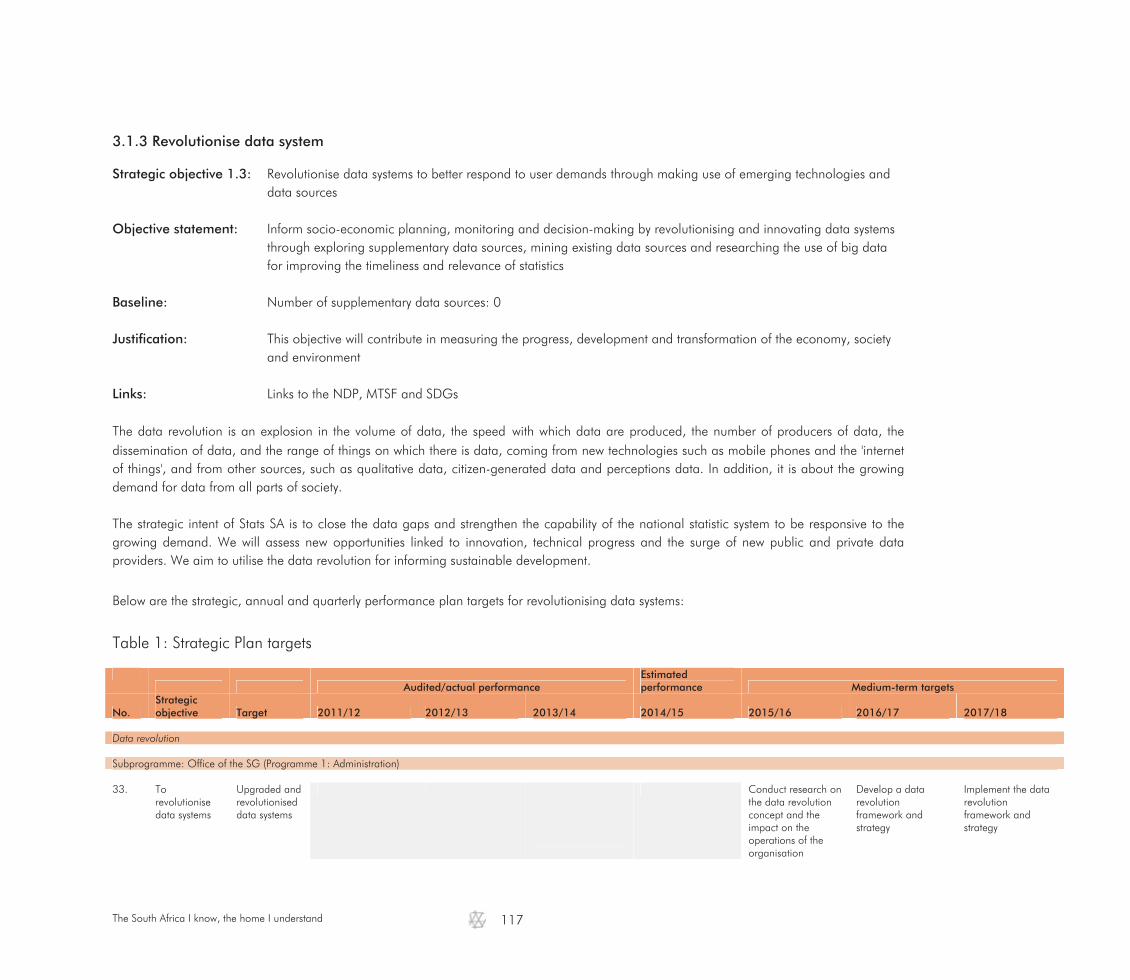
The South Africa I know, the home I understand
117
3.1.3 Revolutionise data system
Strategic objective 1.3: Revolutionise data systems to better respond to user demands through making use of emerging technologies and data sources
Objective statement: Inform socio-economic planning, monitoring and decision-making by revolutionising and innovating data systems
through exploring supplementary data sources, mining existing data sources and researching the use of big data for improving the timeliness and relevance of statistics
Baseline: Number of supplementary data sources: 0 Justification: This objective will contribute in measuring the progress, development and transformation of the economy, society
and environment Links: Links to the NDP, MTSF and SDGs The data revolution is an explosion in the volume of data, the speed with which data are produced, the number of producers of data, the dissemination of data, and the range of things on which there is data, coming from new technologies such as mobile phones and the 'internet of things', and from other sources, such as qualitative data, citizen-generated data and perceptions data. In addition, it is about the growing demand for data from all parts of society. The strategic intent of Stats SA is to close the data gaps and strengthen the capability of the national statistic system to be responsive to the growing demand. We will assess new opportunities linked to innovation, technical progress and the surge of new public and private data providers. We aim to utilise the data revolution for informing sustainable development.
Below are the strategic, annual and quarterly performance plan targets for revolutionising data systems:
Table 1: Strategic Plan targets
Audited/actual performance
Estimated performance Medium-term targets
No. Strategic objective Target 2011/12 2012/13 2013/14 2014/15 2015/16 2016/17 2017/18
Data revolution Subprogramme: Office of the SG (Programme 1: Administration) 33. To
revolutionise data systems
Upgraded and revolutionised data systems
Conduct research on the data revolution concept and the impact on the operations of the organisation
Develop a data revolution framework and strategy
Implement the data revolution framework and strategy

The South Africa I know, the home I understand
118
Table 2: Annual Performance Plan targets: 2015/16
Audited/actual performance Estimated performance Medium-term targets
No. Performance indicator 2011/12 2012/13 2013/14 2014/15 2015/16 2016/17 2017/18 Data revolution Subprogramme: Office of the SG (Programme 1: Administration) 33.1 Number and timeliness of technical documents/reports on
data revolution 1 1 1
Table 3: Quarterly performance targets: 2015/16
Quarterly targets
No. Performance indicator Reporting period
Annual target Quarter 1 Quarter 2 Quarter 3 Quarter 4
Data revolution Subprogramme: Office of the SG (Programme 1: Administration) 33.1.1 Number and timeliness of technical documents/reports on
data revolution Periodic 1 Concept note on data
revolution by March 2016

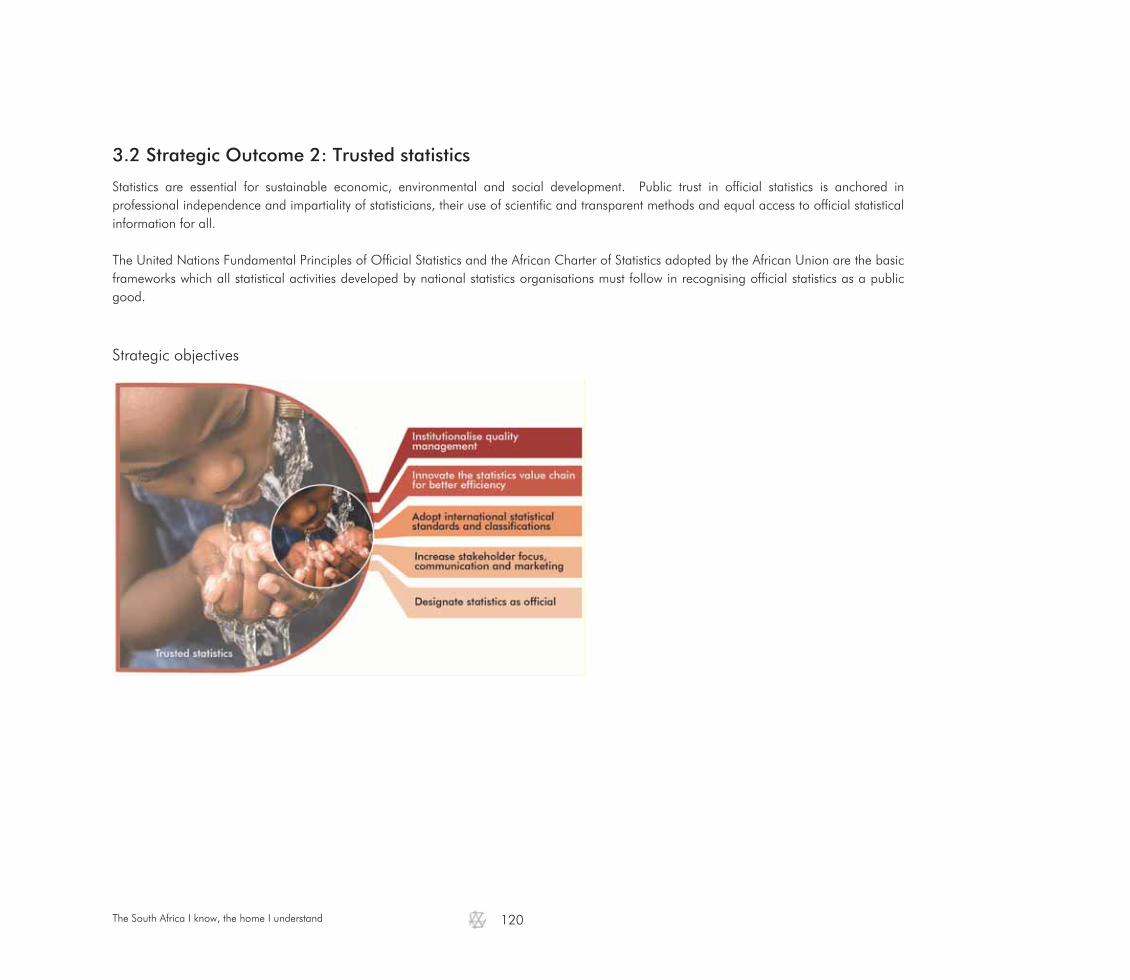
The South Africa I know, the home I understand
120
3.2 Strategic Outcome 2: Trusted statistics Statistics are essential for sustainable economic, environmental and social development. Public trust in official statistics is anchored in professional independence and impartiality of statisticians, their use of scientific and transparent methods and equal access to official statistical information for all. The United Nations Fundamental Principles of Official Statistics and the African Charter of Statistics adopted by the African Union are the basic frameworks which all statistical activities developed by national statistics organisations must follow in recognising official statistics as a public good.
Strategic objectives
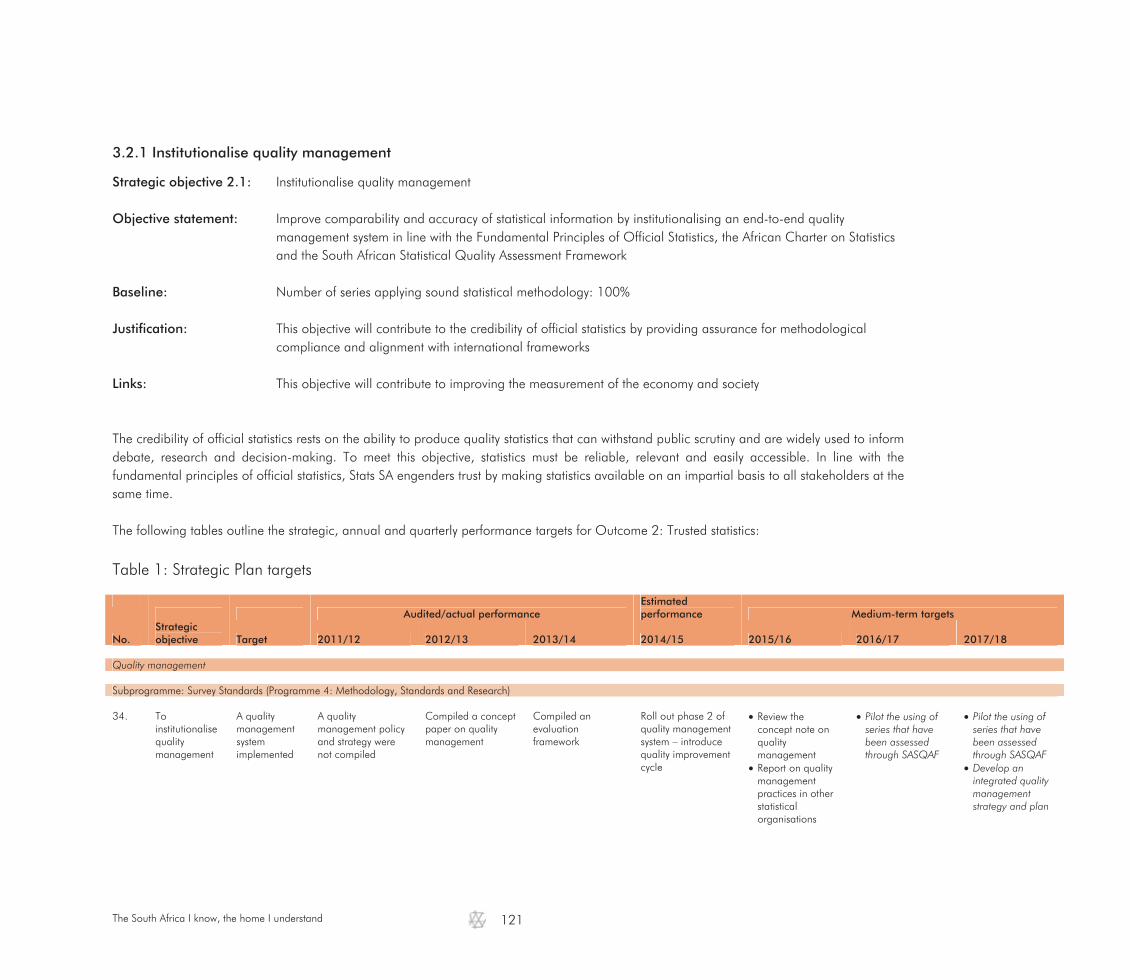
The South Africa I know, the home I understand
121
3.2.1 Institutionalise quality management Strategic objective 2.1: Institutionalise quality management Objective statement: Improve comparability and accuracy of statistical information by institutionalising an end-to-end quality
management system in line with the Fundamental Principles of Official Statistics, the African Charter on Statistics and the South African Statistical Quality Assessment Framework
Baseline: Number of series applying sound statistical methodology: 100% Justification: This objective will contribute to the credibility of official statistics by providing assurance for methodological
compliance and alignment with international frameworks Links: This objective will contribute to improving the measurement of the economy and society
The credibility of official statistics rests on the ability to produce quality statistics that can withstand public scrutiny and are widely used to inform debate, research and decision-making. To meet this objective, statistics must be reliable, relevant and easily accessible. In line with the fundamental principles of official statistics, Stats SA engenders trust by making statistics available on an impartial basis to all stakeholders at the same time. The following tables outline the strategic, annual and quarterly performance targets for Outcome 2: Trusted statistics: Table 1: Strategic Plan targets
Audited/actual performance
Estimated performance Medium-term targets
No. Strategic objective Target 2011/12 2012/13 2013/14 2014/15 2015/16 2016/17 2017/18
Quality management Subprogramme: Survey Standards (Programme 4: Methodology, Standards and Research) 34. To
institutionalise quality management
A quality management system implemented
A quality management policy and strategy were not compiled
Compiled a concept paper on quality management
Compiled an evaluation framework
Roll out phase 2 of quality management system – introduce quality improvement cycle
Review the concept note on quality management
Report on quality management practices in other statistical organisations
Pilot the using of series that have been assessed through SASQAF
Pilot the using of series that have been assessed through SASQAF
Develop an integrated quality management strategy and plan

The South Africa I know, the home I understand
122
Table 1: Strategic Plan targets (concluded)
Audited/actual performance
Estimated performance Medium-term targets
No. Strategic objective Target 2011/12 2012/13 2013/14 2014/15 2015/16 2016/17 2017/18
Quality management Subprogramme: Methodology and Evaluation (Programme 4: Methodology, Standards and Research) 35. To
institutionalise quality management
Independent evaluations conducted
Provided methodological support, standards development and systems solutions to clusters and SANSS Compiled research reports Compiled PES (pilot) report
Provided methodology, standards development and systems solutions support to Economic and Social Statistics, and SANSS partners Published results of PES as scheduled
Provided methodology support as per user requests and standards development and systems solutions support to clusters and SANSS
Provide and sustain systems solution support, methodological support and standards development support Sustain methodological support to the SANS
Evaluate adherence to statistical methods, standards and practices Improve by: Building
evaluation capacity for economic statistics
Conducting CS 2016 evaluation
Evaluate adherence to statistical methods, standards and practices Improve by: Developing
evaluation schedule
Conducting CS2016 evaluation and compiling report
Evaluate adherence to statistical methods, standards and practices Improve by: Reviewing
evaluation framework
Assessing the impact of evaluations conducted
Subprogramme: Survey Coordination, Monitoring and Evaluation (Programme 7: Survey Operations) 36. To
institutionalise quality management
Independent survey monitoring and evaluation reports on surveys
Compiled 4 quality assurance reports for household surveys, namely the GHS, QLFS, DTS and VOCS Conducted Census 2011, PES and IES monitoring and evaluation
Compiled 6 quality assurance reports for household surveys, namely LCS Pilot, GHS, QLFS, (3) and DTS
Published 8 quality assurance reports on QLFS (4), DTS, GHS, VOCS and NHTS
Publish quality assurance reports on survey operations
Conduct independent process monitoring and evaluation of household-based surveys and censuses Improve by: Conducting tests
on monitoring and evaluation methodologies for CS2016
Monitoring CS 2016 and DHS
Monitoring DHS (user paid survey)
Conduct independent process monitoring and evaluation of household-based surveys and censuses Improve by: Pronouncing on
the quality of household surveys
Conducting the CS2016 monitoring
Conducting verification of out-of-scope cases
ConductingCS2016 evaluation study
Conduct independent process monitoring and evaluation of household-based surveys and censuses Improve by: Strengthening and
expanding survey quality control/assurance and audit
Pronouncing on the quality of household surveys
Monitoring and evaluation of GHS (municipal level)
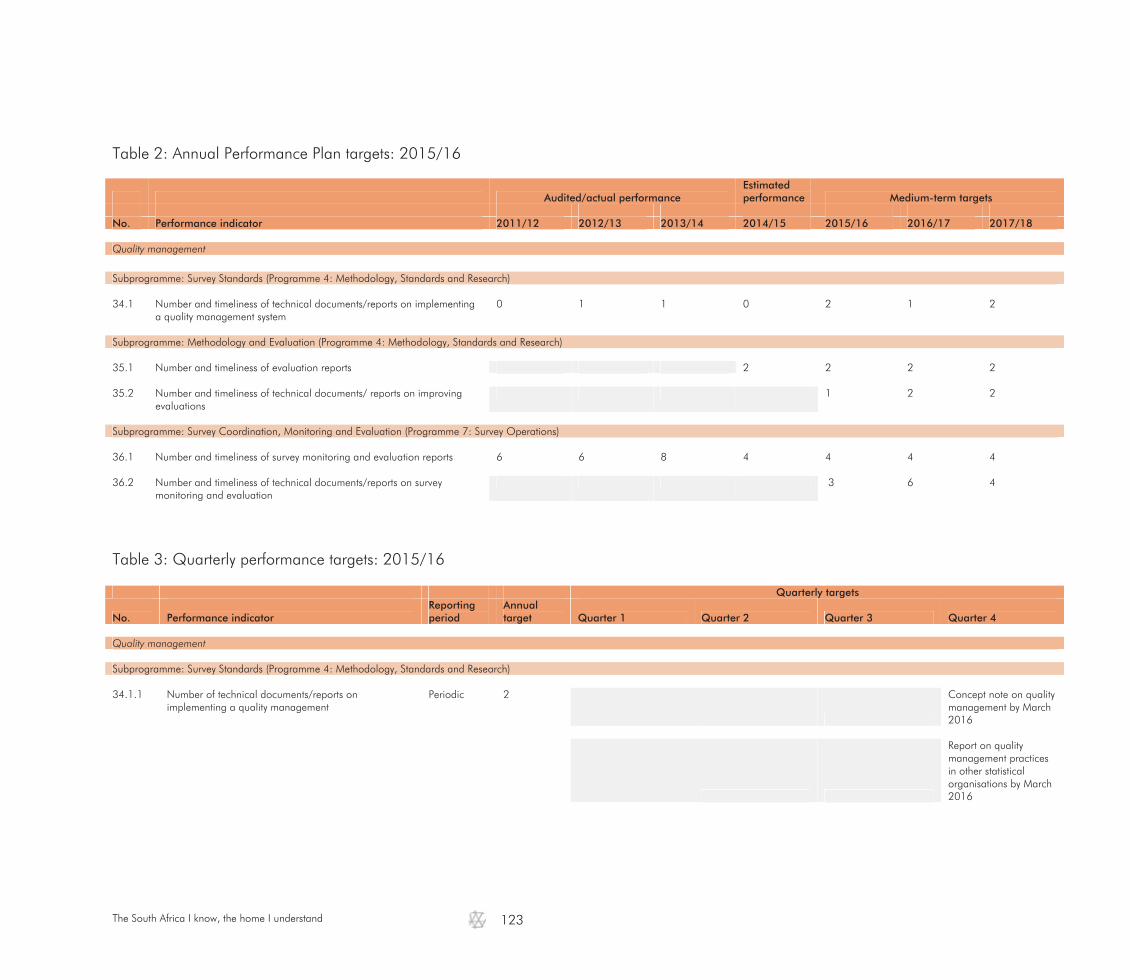
The South Africa I know, the home I understand
123
Table 2: Annual Performance Plan targets: 2015/16
Audited/actual performance Estimated performance Medium-term targets
No. Performance indicator 2011/12 2012/13 2013/14 2014/15 2015/16 2016/17 2017/18 Quality management Subprogramme: Survey Standards (Programme 4: Methodology, Standards and Research) 34.1 Number and timeliness of technical documents/reports on implementing
a quality management system 0 1 1 0 2 1 2
Subprogramme: Methodology and Evaluation (Programme 4: Methodology, Standards and Research) 35.1 Number and timeliness of evaluation reports 2 2 2 2 35.2 Number and timeliness of technical documents/ reports on improving
evaluations 1 2 2
Subprogramme: Survey Coordination, Monitoring and Evaluation (Programme 7: Survey Operations) 36.1 Number and timeliness of survey monitoring and evaluation reports 6 6 8 4 4 4 4 36.2 Number and timeliness of technical documents/reports on survey
monitoring and evaluation 3 6 4
Table 3: Quarterly performance targets: 2015/16
Quarterly targets
No. Performance indicator Reporting period
Annual target Quarter 1 Quarter 2 Quarter 3 Quarter 4
Quality management Subprogramme: Survey Standards (Programme 4: Methodology, Standards and Research) 34.1.1 Number of technical documents/reports on
implementing a quality management Periodic 2
Concept note on quality management by March 2016
Report on quality management practices in other statistical organisations by March 2016

The South Africa I know, the home I understand
124
Table 3: Quarterly performance targets: 2015/16 (concluded)
Quarterly targets
No. Performance indicator Reporting period
Annual target Quarter 1 Quarter 2 Quarter 3 Quarter 4
Quality management Subprogramme: Methodology and Evaluation (Programme 4: Methodology, Standards and Research) 35.1.1 Number and timeliness of evaluation reports Annual 2
Report on domestic tourism survey by March 2016
CS2016 evaluation report by March 2016
35.2.1 Number and timeliness of technical documents/ reports
on improving evaluation Periodic 1
Report on building evaluation capacity for economic statistics by March 2016
Subprogramme: Survey Coordination, Monitoring and Evaluation (Programme 7: Survey Operations) 36.1.1 Number and timeliness of survey monitoring and
evaluation reports Annually 4 Report on monitoring
and evaluation of CDC by June 2016
Report on monitoring and evaluation of LCS by September 2016
Report on monitoring and evaluation of GHS by March 2016
Report on monitoring
and evaluation of QLFS by March 2016
36.2.1 Number and timeliness of technical documents/reports
on survey monitoring and evaluation Periodic 3
Report on tests conducted on monitoring and evaluation methodologies on CS2016 and DHS by March 2016
Progress report on monitoring CS2016 by March 2016
Report on monitoring DHS by March 2016

The South Africa I know, the home I understand
125
3.2.2 Innovate the statistics value chain for better efficiency Strategic objective 2.2: Innovate the statistics value chain for better efficiency Objective statement: Innovate the statistics value chain by enhancing the efficiency of survey operations in terms of cost, quality and
time through new methodologies, integration of operations and modernisation Baseline: Response rate of questionnaires collected: 85% Justification: This objective will create better value for money by ensuring lean and efficient operations across the value chain Links: This objective will contribute to improving the measurement of the economy and society
Stats SA's current survey operations systems are inefficient and dated. To improve efficiency, Stats SA is investing in a programme to modernise production systems by leveraging on opportunities that new technologies offer. This strategic change will enable a more agile and lower-cost response to emerging needs. The following tables outline the strategic, annual and quarterly performance targets to measure improved efficiency in survey operations:

The South Africa I know, the home I understand
126
Table 1: Strategic Plan targets
Audited/actual performance
Estimated performance Medium-term targets
No. Strategic objective Target 2011/12 2012/13 2013/14 2014/15 2015/16 2016/17 2017/18
Plan, design, build, collect, process and disseminate Subprogramme: Methodology and Evaluation (Programme 4: Methodology, Standards and Research) 37. To innovate
the statistics value chain
Provided methodology support as per user requests
Provided methodology support as per user requests
Provided methodology support as per user requests
Provided methodology support as per user requests
Provide methodology support as per user requests
Provide methodological expertise and support Improve support by: Implementing
small area estimation for other household-based surveys
Exploring model-based small area estimation
Provide methodological expertise and support Improve support by: Implementing
small area estimation
Conducting comparative studies for validating SAE
Researching impact of SIC7 on time series data
Assessing the quality of master sample frame
Designing methodologist capacity building programme
Provide methodological expertise and support Improve support by: Implementing
seasonal adjustment for QLFS
Validating the impact of SIC7 on time series data
Conducting comparative studies of SAE
Researching expansion of economic statistics scope of sampling frame

The South Africa I know, the home I understand
127
Table 1: Strategic Plan targets (continued)
Audited/actual performance
Estimated performance Medium-term targets
No. Strategic objective Target 2011/12 2012/13 2013/14 2014/15 2015/16 2016/17 2017/18
Plan, design, build, collect, process and disseminate Subprogramme: Census and Community Survey (Programme 7: Survey Operations) 38. To innovate
the statistics value chain
Statistical information on the size, nature and geographic location of the South African population
Appointed approximately 150 000 fieldworkers for Census 2011, and listed approximately 120 000 EAs Conducted Population Census 2011 and completed reverse logistics Compiled proposal on cycle of population censuses
Processed and analysed census data collected from households
Released and published Census 2011 results at all levels
Finalise planning documents for a large sample survey or Community Survey Train users on statistical analysis and use of Census data for evidence-based decisions
Drive CS2016 through planning, organising, leading and coordination Coordinating and
testing plans for CS2016
Driving data collection for CS2016
Driving data collection for DHS
Drive CS2016 through planning, organising, leading and coordination Driving data
collection for CS2016
Collaborating and partnering in design of innovative data collection methodolo-gies for Censuses/ surveys
Drive municipal collections (GHS) through planning, organising, leading and coordination Review and
improve data collection methodologies
Subprogramme: Household Survey Operations (Programme 7: Survey Operations) 39. To innovate
the statistics value chain
Quality-checked QLFS, GHS, DTS, IES, LCS, and VOCS questionnaires
Strengthened internal capacity to manage a national survey operations programme Completed 256 000 questionnaires Implemented integrated fieldwork strategy. Established a periodic household survey programme
Established 54 districts offices that are operational to provide an infrastructure across the country for data collection The economic survey programme was not established
Developed a Survey Operations Strategy that outlines the national surveys programme Implemented a permanent fieldwork force to conduct household surveys
National surveys programme established Integrated fieldwork force as part of national footprint
Coordinate and monitor data collection for household surveys. Train and conduct quality assurance Improve by: Assessing data
collection systems in Stats SA
Researching international practice on data collection methodologies
Developing quality assurance tools
Coordinate and monitor data collection for household surveys. Train and conduct quality assurance Improve by: Developing a
data collection strategy
Collaborating and partnering in design of digital data collection system
Driving the implementation of the quality assurance tool
Coordinate and monitor data collection for household surveys. Train and conduct quality assurance Improve by: Driving the
implementation of the digital data collection system (QLFS, VOCS and DTS)
Driving GHS collection at municipal level
Commence with CPS at provincial level
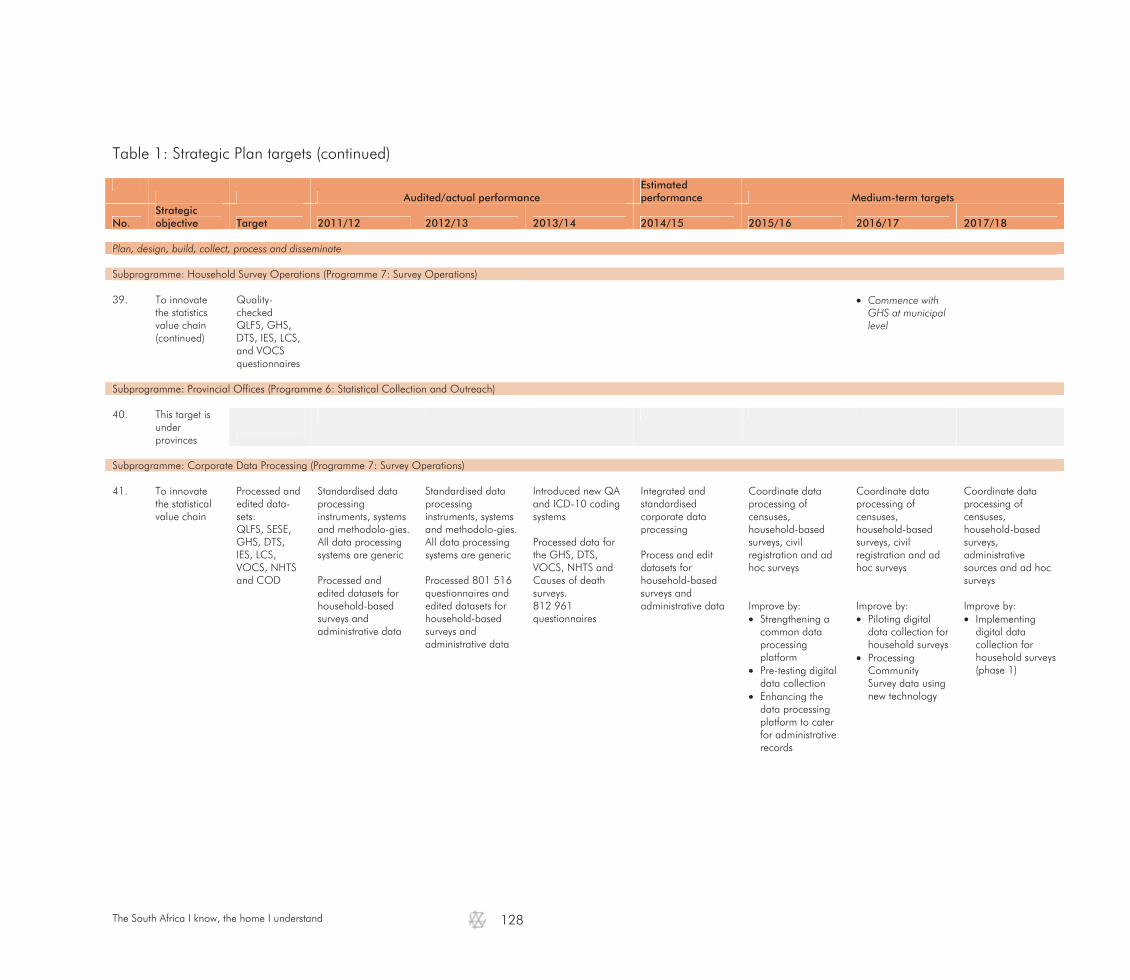
The South Africa I know, the home I understand
128
Table 1: Strategic Plan targets (continued)
Audited/actual performance
Estimated performance Medium-term targets
No. Strategic objective Target 2011/12 2012/13 2013/14 2014/15 2015/16 2016/17 2017/18
Plan, design, build, collect, process and disseminate Subprogramme: Household Survey Operations (Programme 7: Survey Operations) 39. To innovate
the statistics value chain (continued)
Quality-checked QLFS, GHS, DTS, IES, LCS, and VOCS questionnaires
Commence with GHS at municipal level
Subprogramme: Provincial Offices (Programme 6: Statistical Collection and Outreach) 40. This target is
under provinces
Subprogramme: Corporate Data Processing (Programme 7: Survey Operations) 41. To innovate
the statistical value chain
Processed and edited data-sets: QLFS, SESE, GHS, DTS, IES, LCS, VOCS, NHTS and COD
Standardised data processing instruments, systems and methodolo-gies. All data processing systems are generic Processed and edited datasets for household-based surveys and administrative data
Standardised data processing instruments, systems and methodolo-gies. All data processing systems are generic Processed 801 516 questionnaires and edited datasets for household-based surveys and administrative data
Introduced new QA and ICD-10 coding systems Processed data for the GHS, DTS, VOCS, NHTS and Causes of death surveys. 812 961 questionnaires
Integrated and standardised corporate data processing Process and edit datasets for household-based surveys and administrative data
Coordinate data processing of censuses, household-based surveys, civil registration and ad hoc surveys Improve by: Strengthening a
common data processing platform
Pre-testing digital data collection
Enhancing the data processing platform to cater for administrative records
Coordinate data processing of censuses, household-based surveys, civil registration and ad hoc surveys Improve by: Piloting digital
data collection for household surveys
Processing Community Survey data using new technology
Coordinate data processing of censuses, household-based surveys, administrative sources and ad hoc surveys Improve by: Implementing
digital data collection for household surveys (phase 1)
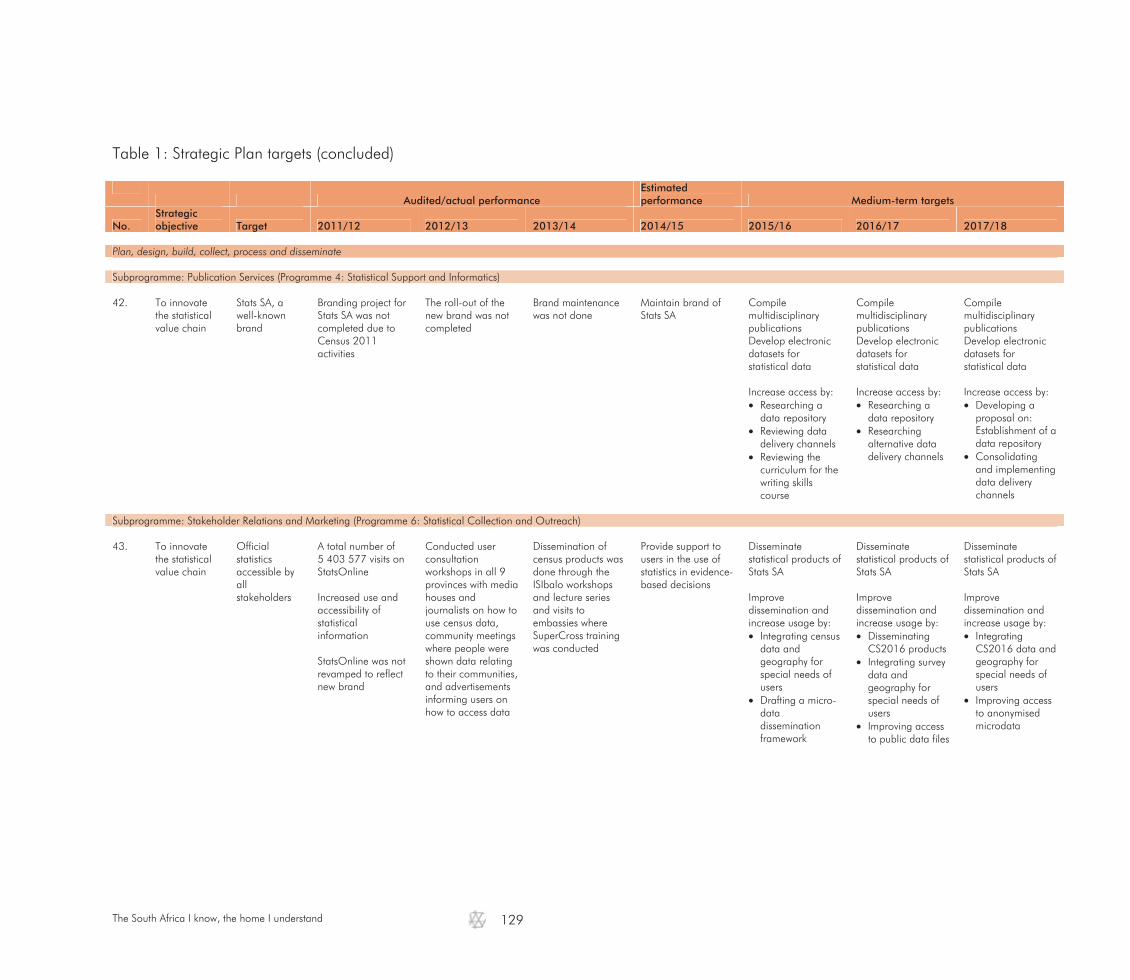
The South Africa I know, the home I understand
129
Table 1: Strategic Plan targets (concluded)
Audited/actual performance
Estimated performance Medium-term targets
No. Strategic objective Target 2011/12 2012/13 2013/14 2014/15 2015/16 2016/17 2017/18
Plan, design, build, collect, process and disseminate Subprogramme: Publication Services (Programme 4: Statistical Support and Informatics) 42. To innovate
the statistical value chain
Stats SA, a well-known brand
Branding project for Stats SA was not completed due to Census 2011 activities
The roll-out of the new brand was not completed
Brand maintenance was not done
Maintain brand of Stats SA
Compile multidisciplinary publications Develop electronic datasets for statistical data Increase access by: Researching a
data repository Reviewing data
delivery channels Reviewing the
curriculum for the writing skills course
Compile multidisciplinary publications Develop electronic datasets for statistical data Increase access by: Researching a
data repository Researching
alternative data delivery channels
Compile multidisciplinary publications Develop electronic datasets for statistical data Increase access by: Developing a
proposal on: Establishment of a data repository
Consolidating and implementing data delivery channels
Subprogramme: Stakeholder Relations and Marketing (Programme 6: Statistical Collection and Outreach) 43. To innovate
the statistical value chain
Official statistics accessible by all stakeholders
A total number of 5 403 577 visits on StatsOnline Increased use and accessibility of statistical information StatsOnline was not revamped to reflect new brand
Conducted user consultation workshops in all 9 provinces with media houses and journalists on how to use census data, community meetings where people were shown data relating to their communities, and advertisements informing users on how to access data
Dissemination of census products was done through the ISIbalo workshops and lecture series and visits to embassies where SuperCross training was conducted
Provide support to users in the use of statistics in evidence-based decisions
Disseminate statistical products of Stats SA Improve dissemination and increase usage by: Integrating census
data and geography for special needs of users
Drafting a micro-data dissemination framework
Disseminate statistical products of Stats SA Improve dissemination and increase usage by: Disseminating
CS2016 products Integrating survey
data and geography for special needs of users
Improving access to public data files
Disseminate statistical products of Stats SA Improve dissemination and increase usage by: Integrating
CS2016 data and geography for special needs of users
Improving access to anonymised microdata

The South Africa I know, the home I understand
130
Table 2: Annual Performance Plan targets: 2015/16
Audited/actual performance Estimated performance Medium-term targets
No. Performance indicator 2011/12 2012/13 2013/14 2014/15 2015/16 2016/17 2017/18 Plan, design, build, collect, process and disseminate Subprogramme: Methodology and Evaluation (Programme 4: Methodology, Standards and Research) 37.1 Percentage methodological support provided on time 90% 100% 100% 90% 90% 90% 90% 37.2 Number and timeliness of research reports to improve
methodological practice and systems 3 7 5 9 4 4 4
37.3 Number and timeliness of technical documents/reports on
emerging methodologies
2 5 4 Subprogramme: Census and Community Survey (Programme 7: Survey Operations) 38.1 Number and timeliness of technical documents/reports on
census/survey operations (including DHS) 11 1 6 4 3 2 2
Subprogramme: Household Survey Operations (Programme 7: Survey Operations) 39.1 Number and timeliness of questionnaires checked for quality 257 432
224 500 235 798 256 000 39 200 39 200 39 200
39.2 Number and timeliness of reports on maintenance of the
master sample 3 080 PSUs 3 080 PSUs 3 080 PSUs 3 080 PSUs 2 2 2
39.3 Number of staff trained in survey operations 320 320 320 39.4 Number and timeliness of technical documents/reports on
improving household survey operations
3 4 3 Subprogramme: Corporate Data Processing (Programme 7: Survey Operations) 41.1 Number of questionnaires processed and edited 257 432
224 500 288 561 248 000 315 704 248 000 248 000
41.2 Number and timeliness of PSUs processed 3 080 3 080
(1 786 captured)
3 080 3 080 3324 3324 3324
41.3 Number of death notification forms processed and edited for
mortality and causes of death 600 000 600 000 524 000 560 000 500000 500000 500 000
41.4 Number and timeliness of technical documents/reports on
improving data processing
3 2 1

The South Africa I know, the home I understand
131
Table 2: Annual Performance Plan targets: 2015/16 (concluded)
Audited/actual performance Estimated performance Medium-term targets
No. Performance indicator 2011/12 2012/13 2013/14 2014/15 2015/16 2016/17 2017/18 Plan, design, build, collect, process and disseminate Subprogramme: Publication Services (Programme 5: Statistical Support and Informatics) 42.1 Number and timeliness of publications compiled 17 16 16 16 16 16 42.2 Number of time series updated on system (economic and
social surveys and administrative records) 196 196 200 200 200
42.3 Number of technical documents/reports on improving
publication services 3 2 2
Subprogramme: Stakeholder Relations and Marketing (Programme 6: Statistical Collection and Outreach) 43.1 Number of visitor sessions to Website 5 403 577 4 013 532 1 131 185
1 000 000 1 000 000 1 000 000 1 000 000
43.2 Number of publications downloaded from Website 323 404 1 280 739 839 447 200 000 150 000 150 000 150 000 43.3 Number of technical documents/reports on improving
dissemination and usage 2 3 2

The South Africa I know, the home I understand
132
Table 3: Quarterly performance targets: 2015/16
Quarterly targets
No. Performance indicator Reporting period
Annual target Quarter 1 Quarter 2 Quarter 3 Quarter 4
Plan, design, build, collect, process and disseminate Subprogramme: Methodology and Evaluation (Programme 4: Methodology, Standards and Research) 37.1.1 Percentage methodological support provided
on time Annually 90% 90% methodological
support provided to stakeholders by March 2016
37.2.1 Number and timeliness of research reports to
improve methodological practice and systems Annually 4 Seasonal adjustment
methodological note for monthly food and beverages survey by March 2016
Seasonal adjustment
methodological note for monthly accommodation survey by March 2016
Seasonal adjustment
methodological note for quarterly manufacturing capacity utilisation survey by March 2016
Model based SAE by
March 2016 37.3.1 Number and timeliness of technical
documents/reports on emerging methodologies
Periodic 2
Report on implementing small area estimations for household surveys by March 2016
Report on exploring model-based small area estimation March 2016

The South Africa I know, the home I understand
133
Table 3: Quarterly performance targets: 2015/16 (continued)
Quarterly targets
No. Performance indicator Reporting period
Annual target Quarter 1 Quarter 2 Quarter 3 Quarter 4
Plan, design, build, collect, process and disseminate Subprogramme: Census and Community Survey (Programme 7: Survey Operations) 38.1.1 Number and timeliness of technical
documents/reports on census/survey operations
Periodic 3
Report on coordination and testing of plans for CS2016 by March 2016
Report on data collection for CS2016 by March 2016
Report on data collection for DHS by March 2016
Subprogramme: Household Survey Operations (Programme 7: Survey Operations) 39.1.1 Number and timeliness of questionnaires
checked for quality (QLFS, GHS, DTS, VOCs, LCS, EPWP)
Annually 39 200 (20% of total question-naires collected)
Approximately 39 200 questionnaires checked by March 2016
39.2.1 Number and timeliness of reports on
maintenance of the master sample Annually
2
2 reports on maintenance of the master sample of by March 2016
39.3.1 Number of staff trained in survey operations Quarterly 320 120 staff (SAYP) by June
2015 120 staff (master sample maintenance) by September 2015
40 staff (CDC-GHS & DTS) by December 2015
40 staff (CDC-VOCs) by March 2016
39.4.1 Number and timeliness of technical
documents/reports on improving household survey operations
Periodic 3
Assessment report on data collection systems in Stats SA by March 2016
Report on international practice on data collection methodologies by March 2016
Document on quality assurance tools by March 2016
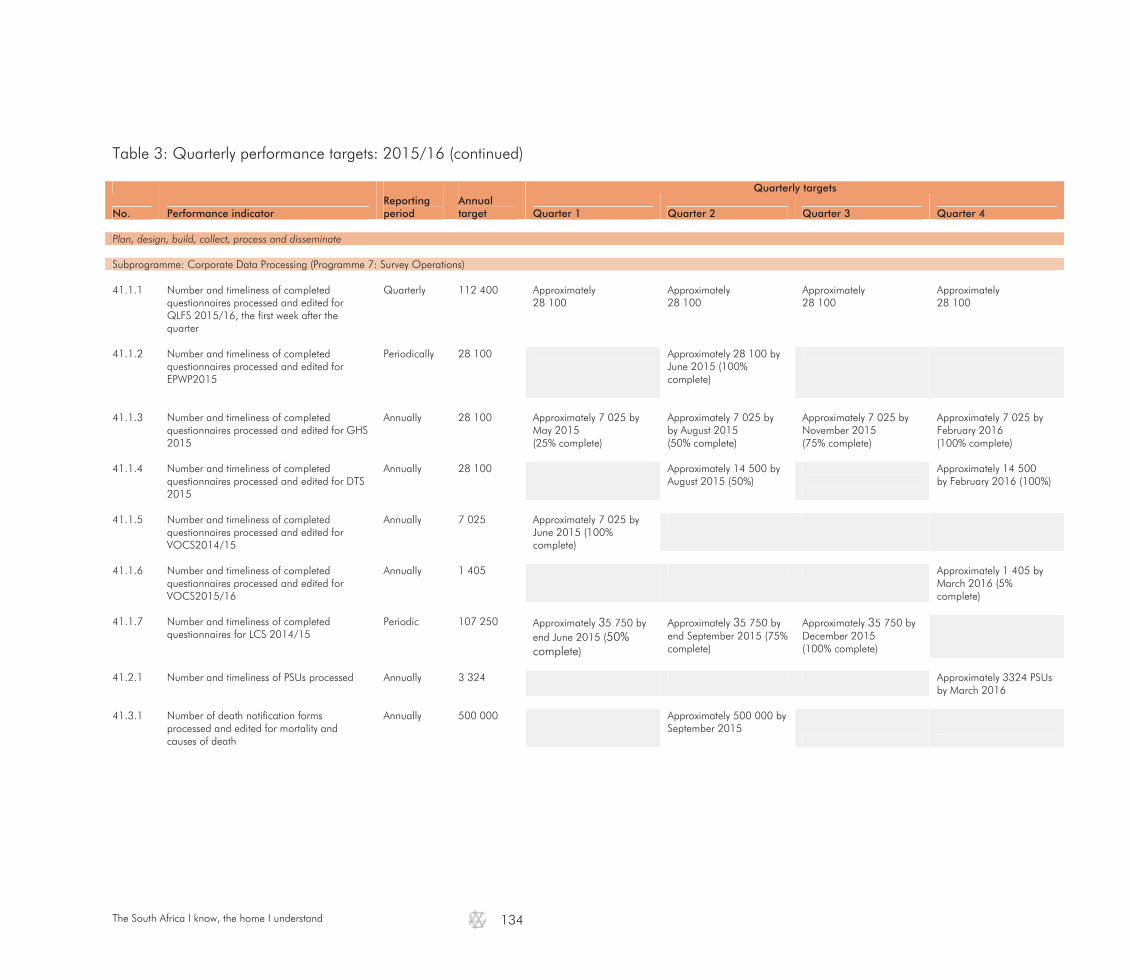
The South Africa I know, the home I understand
134
Table 3: Quarterly performance targets: 2015/16 (continued)
Quarterly targets
No. Performance indicator Reporting period
Annual target Quarter 1 Quarter 2 Quarter 3 Quarter 4
Plan, design, build, collect, process and disseminate Subprogramme: Corporate Data Processing (Programme 7: Survey Operations) 41.1.1
Number and timeliness of completed questionnaires processed and edited for QLFS 2015/16, the first week after the quarter
Quarterly 112 400 Approximately 28 100
Approximately 28 100
Approximately 28 100
Approximately 28 100
41.1.2 Number and timeliness of completed
questionnaires processed and edited for EPWP2015
Periodically 28 100 Approximately 28 100 by June 2015 (100% complete)
41.1.3 Number and timeliness of completed
questionnaires processed and edited for GHS 2015
Annually 28 100 Approximately 7 025 by May 2015 (25% complete)
Approximately 7 025 by by August 2015 (50% complete)
Approximately 7 025 by November 2015 (75% complete)
Approximately 7 025 by February 2016 (100% complete)
41.1.4 Number and timeliness of completed
questionnaires processed and edited for DTS 2015
Annually 28 100 Approximately 14 500 by August 2015 (50%)
Approximately 14 500 by February 2016 (100%)
41.1.5 Number and timeliness of completed
questionnaires processed and edited for VOCS2014/15
Annually 7 025 Approximately 7 025 by June 2015 (100% complete)
41.1.6 Number and timeliness of completed
questionnaires processed and edited for VOCS2015/16
Annually 1 405 Approximately 1 405 by March 2016 (5% complete)
41.1.7 Number and timeliness of completed
questionnaires for LCS 2014/15
Periodic 107 250 Approximately 35 750 by end June 2015 (50% complete)
Approximately 35 750 by end September 2015 (75% complete)
Approximately 35 750 by December 2015 (100% complete)
41.2.1 Number and timeliness of PSUs processed Annually 3 324 Approximately 3324 PSUs
by March 2016 41.3.1 Number of death notification forms
processed and edited for mortality and causes of death
Annually 500 000 Approximately 500 000 by September 2015
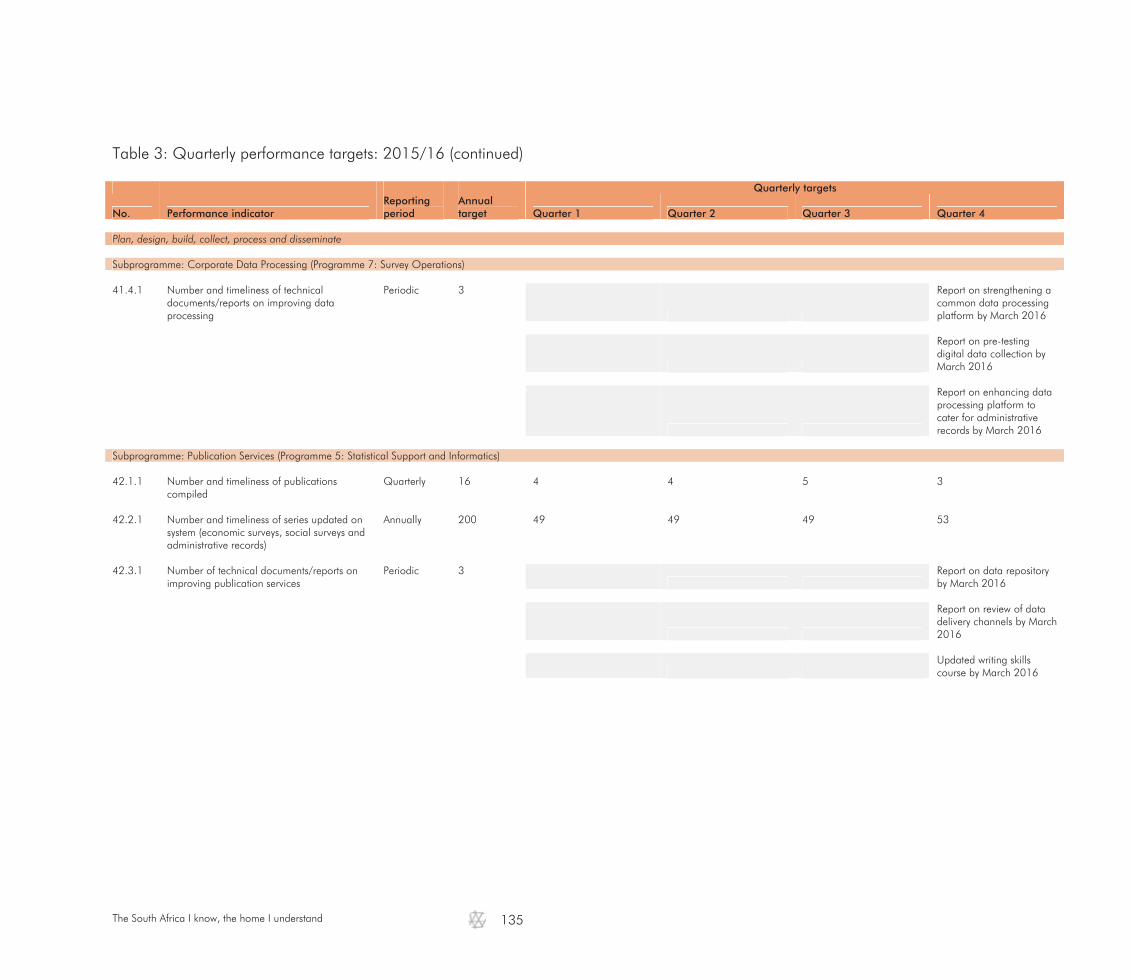
The South Africa I know, the home I understand
135
Table 3: Quarterly performance targets: 2015/16 (continued)
Quarterly targets
No. Performance indicator Reporting period
Annual target Quarter 1 Quarter 2 Quarter 3 Quarter 4
Plan, design, build, collect, process and disseminate Subprogramme: Corporate Data Processing (Programme 7: Survey Operations) 41.4.1 Number and timeliness of technical
documents/reports on improving data processing
Periodic 3
Report on strengthening a common data processing platform by March 2016
Report on pre-testing digital data collection by March 2016
Report on enhancing data processing platform to cater for administrative records by March 2016
Subprogramme: Publication Services (Programme 5: Statistical Support and Informatics) 42.1.1 Number and timeliness of publications
compiled Quarterly 16 4 4 5 3
42.2.1 Number and timeliness of series updated on
system (economic surveys, social surveys and administrative records)
Annually 200 49 49 49 53
42.3.1 Number of technical documents/reports on
improving publication services Periodic 3
Report on data repository by March 2016
Report on review of data delivery channels by March 2016
Updated writing skills course by March 2016
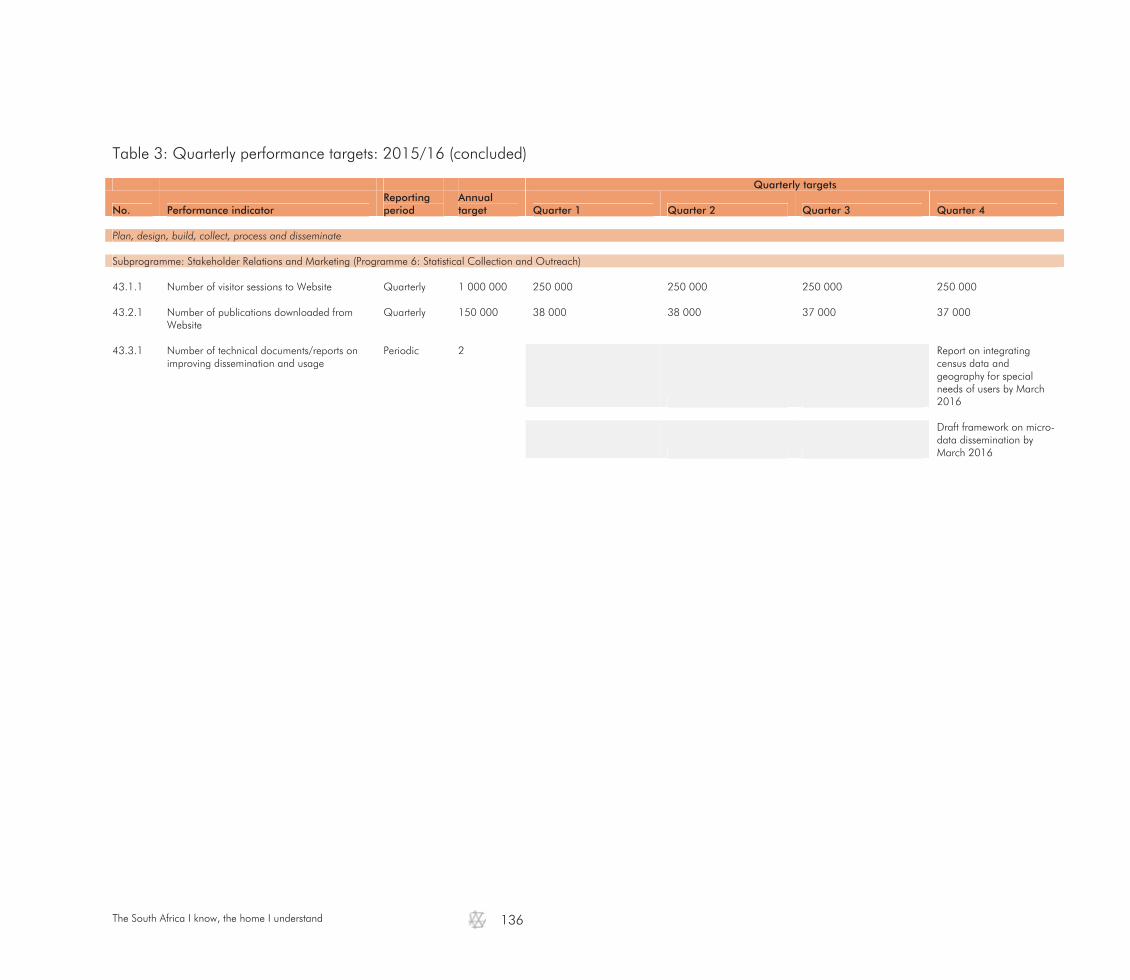
The South Africa I know, the home I understand
136
Table 3: Quarterly performance targets: 2015/16 (concluded)
Quarterly targets
No. Performance indicator Reporting period
Annual target Quarter 1 Quarter 2 Quarter 3 Quarter 4
Plan, design, build, collect, process and disseminate Subprogramme: Stakeholder Relations and Marketing (Programme 6: Statistical Collection and Outreach) 43.1.1 Number of visitor sessions to Website Quarterly 1 000 000 250 000 250 000 250 000 250 000 43.2.1 Number of publications downloaded from
Website Quarterly 150 000 38 000 38 000 37 000 37 000
43.3.1 Number of technical documents/reports on
improving dissemination and usage Periodic 2
Report on integrating census data and geography for special needs of users by March 2016
Draft framework on micro-data dissemination by March 2016
The South Africa I know, the home I understand
137
3.2.3 Adopt international statistical standards and classifications
Strategic objective 2.3: Adopt international statistical standards and classifications Objective statement: Adopt and adapt international statistical standards and classification by
aligning and implementing statistical frameworks, policies, standards and practices in order to improve comparability, methodological soundness and accuracy of statistical information
Baseline: Number of statistical standards developed and adopted: 6 standards Justification: This objective will contribute to the credibility of official statistics by
demonstrating the application of international recognised statistical standards and practices
Links: International statistical standards and frameworks
The use of international concepts, classifications and methods promotes the consistency and efficiency of statistical systems at national, continental and international levels. Clear, well-defined standards provide a framework to ensure data comparability in national and international statistics and lay the foundation for cross-national data of high quality. The following tables outline the strategic, annual and quarterly performance targets for the adoption of international statistical standards and classifications:
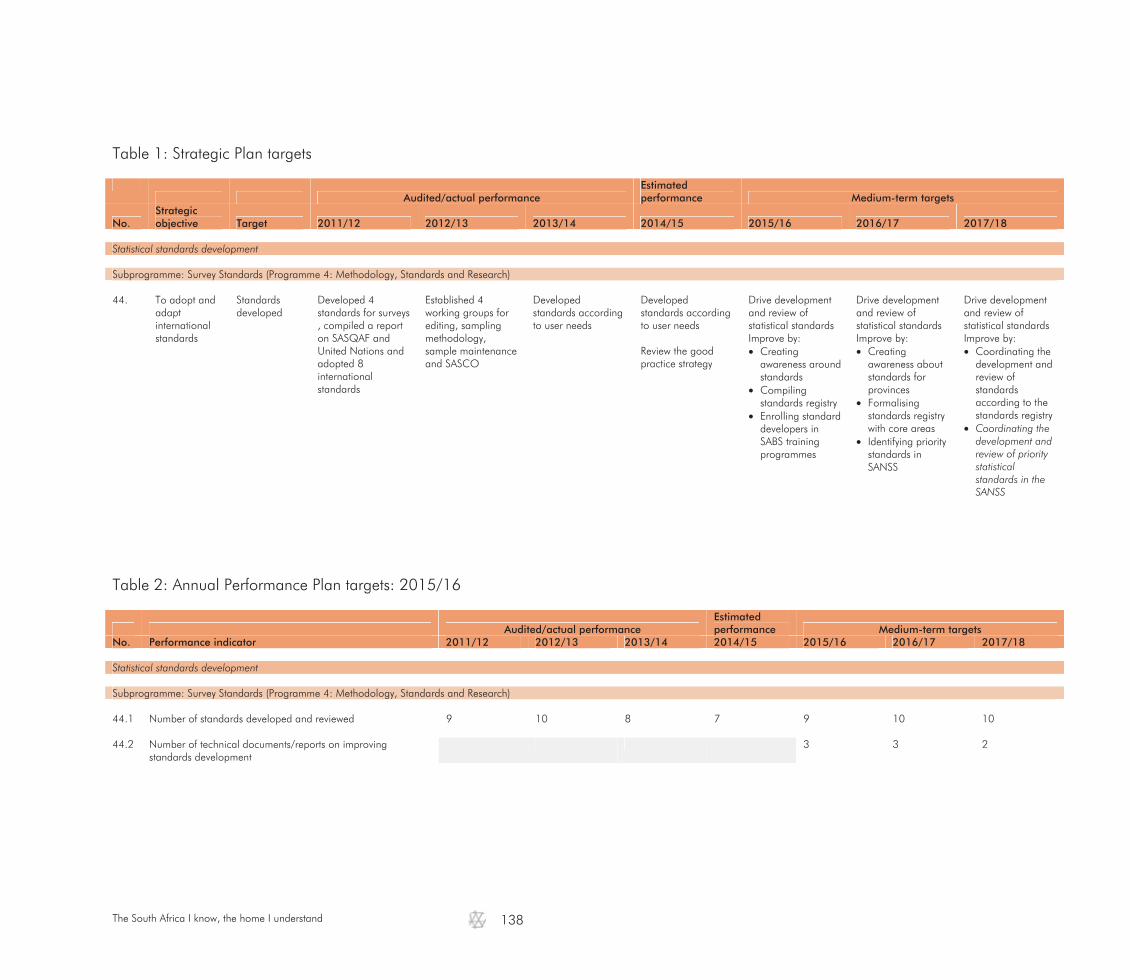
The South Africa I know, the home I understand
138
Table 1: Strategic Plan targets
Table 2: Annual Performance Plan targets: 2015/16
Audited/actual performance Estimated performance Medium-term targets
No. Performance indicator 2011/12 2012/13 2013/14 2014/15 2015/16 2016/17 2017/18 Statistical standards development Subprogramme: Survey Standards (Programme 4: Methodology, Standards and Research) 44.1 Number of standards developed and reviewed 9 10 8 7 9 10 10 44.2 Number of technical documents/reports on improving
standards development 3 3 2
Audited/actual performance
Estimated performance Medium-term targets
No. Strategic objective Target 2011/12 2012/13 2013/14 2014/15 2015/16 2016/17 2017/18
Statistical standards development Subprogramme: Survey Standards (Programme 4: Methodology, Standards and Research) 44. To adopt and
adapt international standards
Standards developed
Developed 4 standards for surveys , compiled a report on SASQAF and United Nations and adopted 8 international standards
Established 4 working groups for editing, sampling methodology, sample maintenance and SASCO
Developed standards according to user needs
Developed standards according to user needs Review the good practice strategy
Drive development and review of statistical standards Improve by: Creating
awareness around standards
Compiling standards registry
Enrolling standard developers in SABS training programmes
Drive development and review of statistical standards Improve by: Creating
awareness about standards for provinces
Formalising standards registry with core areas
Identifying priority standards in SANSS
Drive development and review of statistical standards Improve by: Coordinating the
development and review of standards according to the standards registry
Coordinating the development and review of priority statistical standards in the SANSS
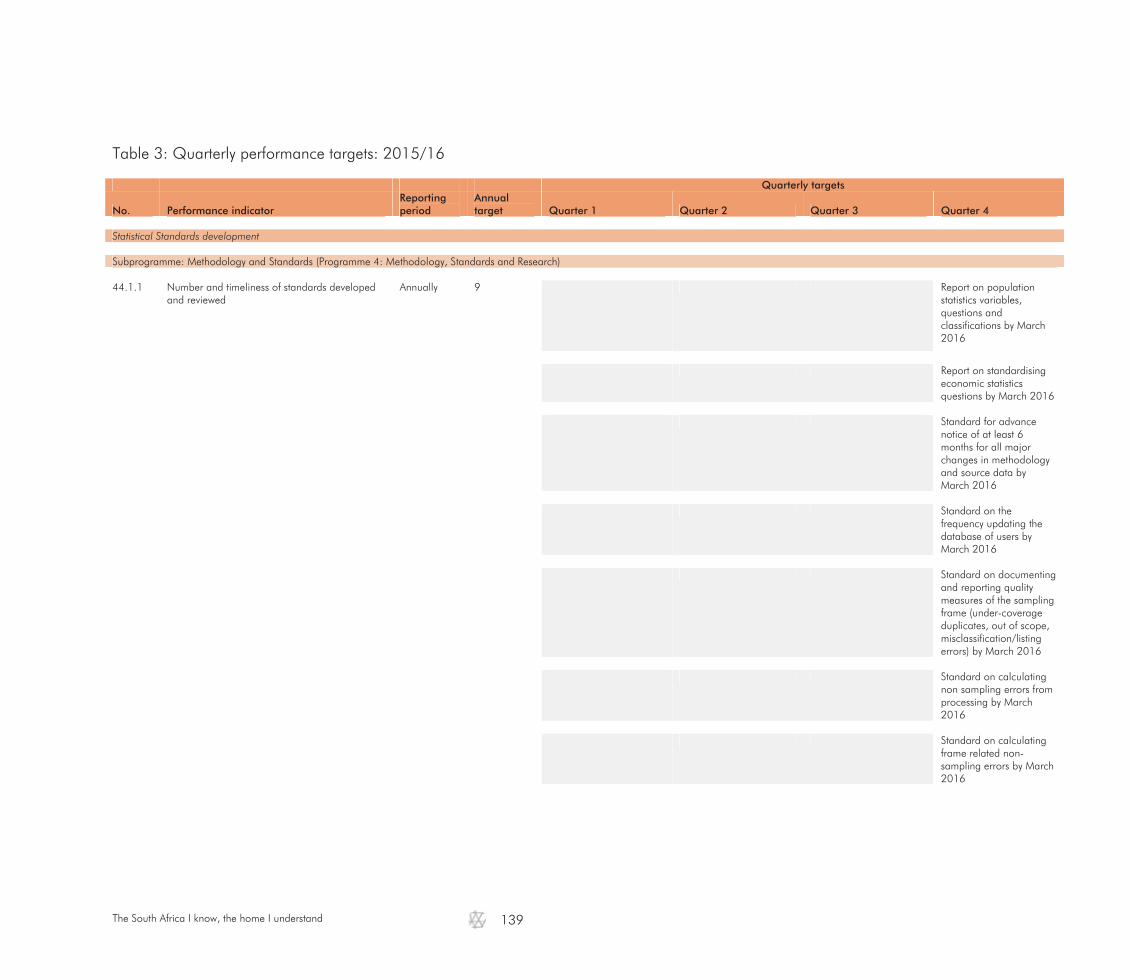
The South Africa I know, the home I understand
139
Table 3: Quarterly performance targets: 2015/16
Quarterly targets
No. Performance indicator Reporting period
Annual target Quarter 1 Quarter 2 Quarter 3 Quarter 4
Statistical Standards development Subprogramme: Methodology and Standards (Programme 4: Methodology, Standards and Research) 44.1.1 Number and timeliness of standards developed
and reviewed Annually 9 Report on population
statistics variables, questions and classifications by March 2016
Report on standardising
economic statistics questions by March 2016
Standard for advance notice of at least 6 months for all major changes in methodology and source data by March 2016
Standard on the
frequency updating the database of users by March 2016
Standard on documenting
and reporting quality measures of the sampling frame (under-coverage duplicates, out of scope, misclassification/listing errors) by March 2016
Standard on calculating
non sampling errors from processing by March 2016
Standard on calculating
frame related non-sampling errors by March 2016
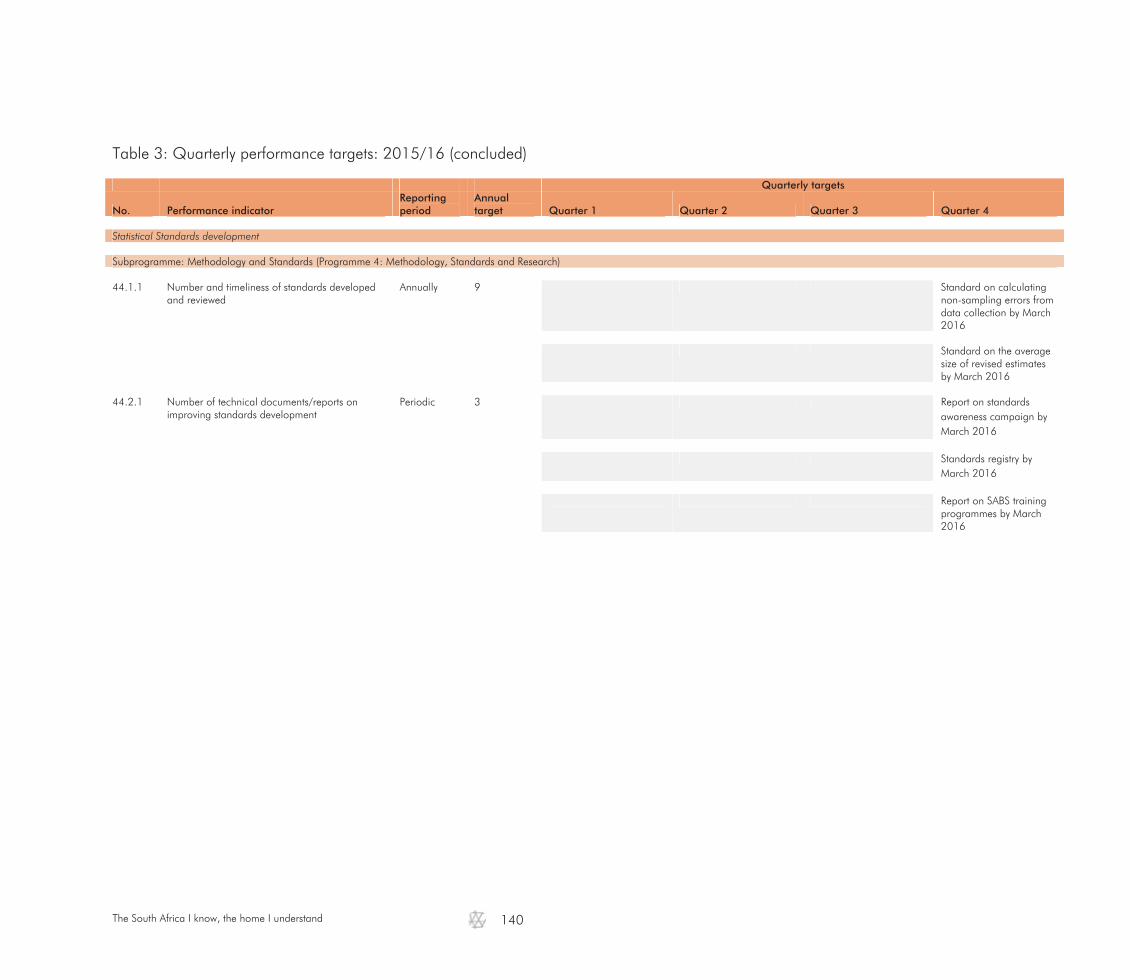
The South Africa I know, the home I understand
140
Table 3: Quarterly performance targets: 2015/16 (concluded)
Quarterly targets
No. Performance indicator Reporting period
Annual target Quarter 1 Quarter 2 Quarter 3 Quarter 4
Statistical Standards development Subprogramme: Methodology and Standards (Programme 4: Methodology, Standards and Research) 44.1.1 Number and timeliness of standards developed
and reviewed Annually 9 Standard on calculating
non-sampling errors from data collection by March 2016
Standard on the average
size of revised estimates by March 2016
44.2.1 Number of technical documents/reports on
improving standards development Periodic 3 Report on standards
awareness campaign by March 2016
Standards registry by
March 2016 Report on SABS training
programmes by March 2016

The South Africa I know, the home I understand
141
3.2.4 Increase stakeholder focus, communication and marketing
Strategic objective 2.4: To increase stakeholder focus, communication and marketing Objective statement: Increase stakeholder engagement and use of statistics to better know and understand the needs of stakeholder
groups and creating public awareness to raise the profile of statistics through integrated stakeholder consultations, marketing and communication of statistical products
Baseline: Number of stakeholder engagements: 9 stakeholder symposia Justification: This objective will contribute to the credibility of official statistics by engaging stakeholders, the media and the
public at large Links: This objective will contribute to improving the measurement of the economy and society It is important for citizens to know the country they live in and understand the dynamics so that their decisions are informed. An informed citizenry is the foundation of a true democracy. 'The South Africa I know, the home I understand' speaks directly to what we aim to achieve through the dissemination of statistical information as it provides an opportunity for the use of statistics for evidence-based decisions by stakeholders, whatever their role in society. The following tables outline the strategic, annual and quarterly performance targets for increasing stakeholder focus, communication and marketing:

The South Africa I know, the home I understand
142
Table 1: Strategic Plan targets
Audited/actual performance
Estimated performance Medium-term targets
No. Strategic objective Target 2011/12 2012/13 2013/14 2014/15 2015/16 2016/17 2017/18
Integrated communications and stakeholder management Subprogramme: Corporate Communication (Programme 6: Statistical Collection and Outreach) 45. Increase
stakeholder focus, marketing and communication
Official statistics trusted by all stakeholders
Rolled out communication and marketing campaign for Census 2011
Conducted communication and marketing campaign for Census 2011
Through the press conferences, the revamped website, Stats SA's iPad applications and the Fieldworker magazine, Stats SA ensured that South Africans are aware of the work of the organisation. There has been an increase in requests for data from both the media and communities
Maintain posture in the public domain
Position and enhance the public image and credibility of the organisation Improve internal and external communication by: Building
relationships and training of community media
Investigating new social media platforms for dissemination of statistics
Introducing innovative communication products and services to Economic Statistics
Investigating new dissemination channels for CS2016
Rolling out CS2016 communication campaign
Rolling out new building change management and communication plan
Position and enhance the public image and credibility of the organisation Improve internal and external communication by: Developing
communication products for municipalities
Developing user friendly electronic products that can be used across multiple channels
Rolling out CS2016 communication campaign
Roll out new building relocation communication plan
Developing new communication channels and tools to improve employee engagement
Position and enhance the public image and credibility of the organisation Improve internal and external communication by: Building
relationships and training of community media
Developing communication products for municipalities and schools
Implementing new channels for dissemination of other series
Develop communication training programme to increase the use of data visuals by employees
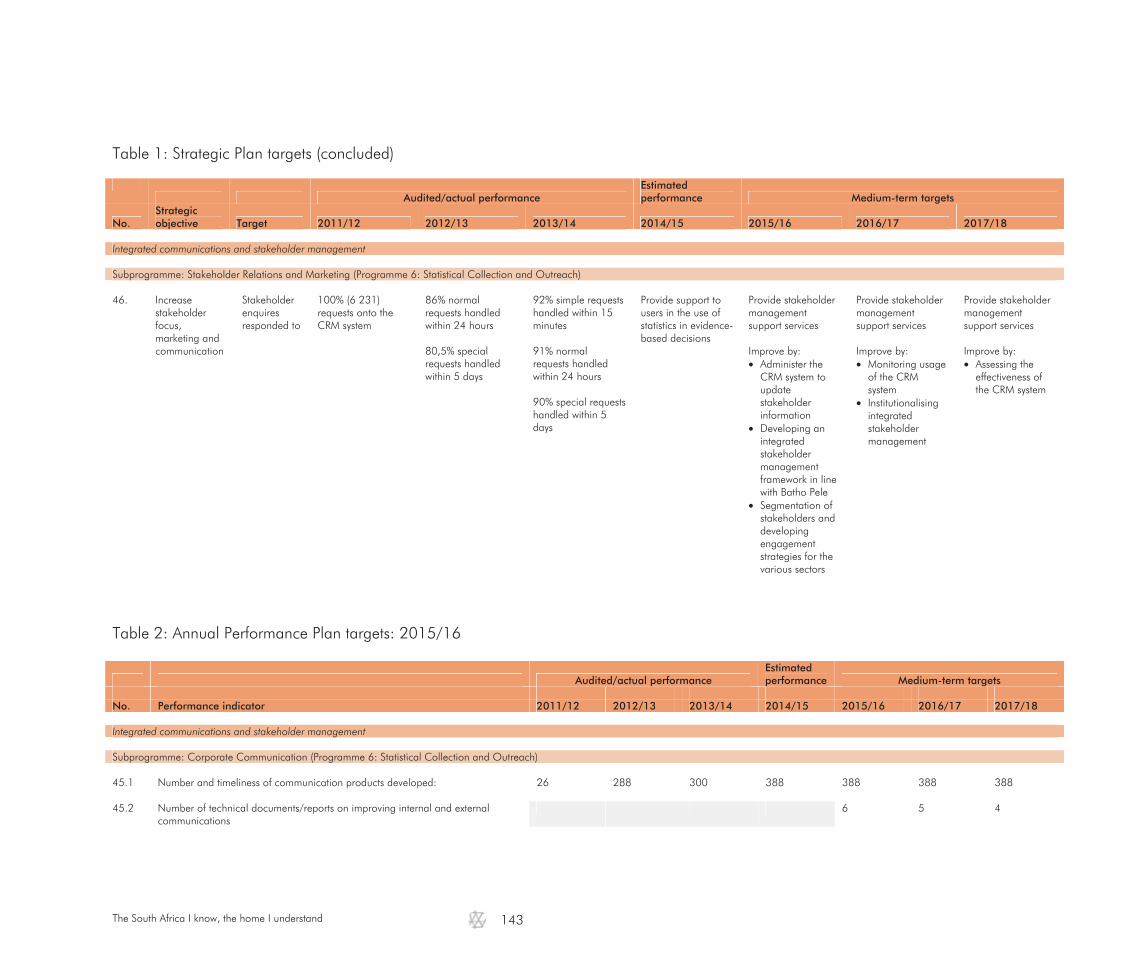
The South Africa I know, the home I understand
143
Table 1: Strategic Plan targets (concluded)
Table 2: Annual Performance Plan targets: 2015/16
Audited/actual performance Estimated performance Medium-term targets
No. Performance indicator 2011/12 2012/13 2013/14 2014/15 2015/16 2016/17 2017/18 Integrated communications and stakeholder management Subprogramme: Corporate Communication (Programme 6: Statistical Collection and Outreach) 45.1 Number and timeliness of communication products developed: 26 288 300 388 388 388 388 45.2 Number of technical documents/reports on improving internal and external
communications 6 5 4
Audited/actual performance
Estimated performance Medium-term targets
No. Strategic objective Target 2011/12 2012/13 2013/14 2014/15 2015/16 2016/17 2017/18
Integrated communications and stakeholder management Subprogramme: Stakeholder Relations and Marketing (Programme 6: Statistical Collection and Outreach) 46. Increase
stakeholder focus, marketing and communication
Stakeholder enquires responded to
100% (6 231) requests onto the CRM system
86% normal requests handled within 24 hours 80,5% special requests handled within 5 days
92% simple requests handled within 15 minutes 91% normal requests handled within 24 hours 90% special requests handled within 5 days
Provide support to users in the use of statistics in evidence-based decisions
Provide stakeholder management support services Improve by: Administer the
CRM system to update stakeholder information
Developing an integrated stakeholder management framework in line with Batho Pele
Segmentation of stakeholders and developing engagement strategies for the various sectors
Provide stakeholder management support services Improve by: Monitoring usage
of the CRM system
Institutionalising integrated stakeholder management
Provide stakeholder management support services Improve by: Assessing the
effectiveness of the CRM system
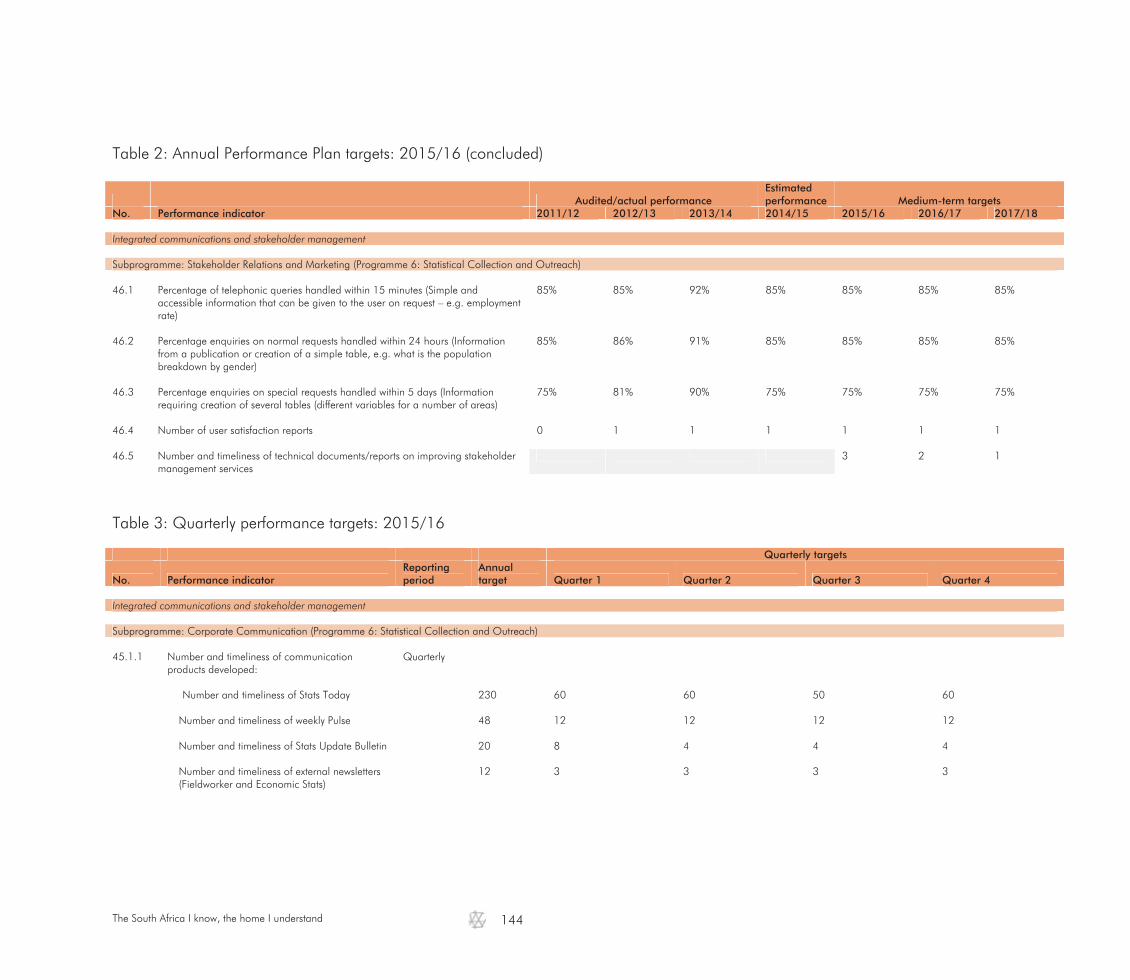
The South Africa I know, the home I understand
144
Table 2: Annual Performance Plan targets: 2015/16 (concluded)
Audited/actual performance Estimated performance Medium-term targets
No. Performance indicator 2011/12 2012/13 2013/14 2014/15 2015/16 2016/17 2017/18 Integrated communications and stakeholder management Subprogramme: Stakeholder Relations and Marketing (Programme 6: Statistical Collection and Outreach) 46.1 Percentage of telephonic queries handled within 15 minutes (Simple and
accessible information that can be given to the user on request – e.g. employment rate)
85% 85% 92% 85% 85% 85% 85%
46.2 Percentage enquiries on normal requests handled within 24 hours (Information
from a publication or creation of a simple table, e.g. what is the population breakdown by gender)
85% 86% 91% 85% 85% 85% 85%
46.3 Percentage enquiries on special requests handled within 5 days (Information
requiring creation of several tables (different variables for a number of areas) 75% 81% 90% 75% 75% 75% 75%
46.4 Number of user satisfaction reports 0 1 1 1 1 1 1 46.5 Number and timeliness of technical documents/reports on improving stakeholder
management services 3 2 1
Table 3: Quarterly performance targets: 2015/16
Quarterly targets
No. Performance indicator Reporting period
Annual target Quarter 1 Quarter 2 Quarter 3 Quarter 4
Integrated communications and stakeholder management Subprogramme: Corporate Communication (Programme 6: Statistical Collection and Outreach) 45.1.1 Number and timeliness of communication
products developed: Quarterly
Number and timeliness of Stats Today 230 60 60 50 60 Number and timeliness of weekly Pulse 48 12 12 12 12 Number and timeliness of Stats Update Bulletin 20 8 4 4 4 Number and timeliness of external newsletters
(Fieldworker and Economic Stats) 12
3 3 3 3
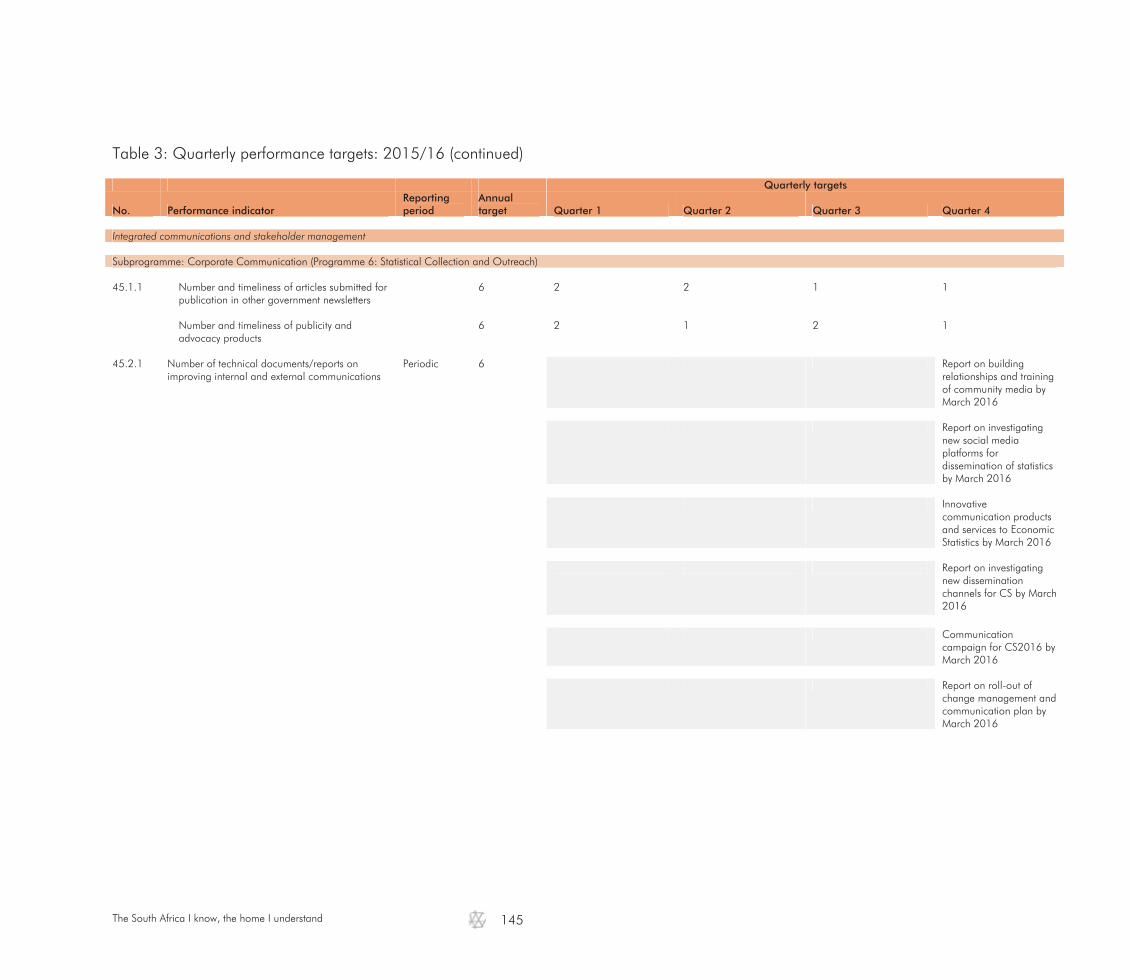
The South Africa I know, the home I understand
145
Table 3: Quarterly performance targets: 2015/16 (continued)
Quarterly targets
No. Performance indicator Reporting period
Annual target Quarter 1 Quarter 2 Quarter 3 Quarter 4
Integrated communications and stakeholder management Subprogramme: Corporate Communication (Programme 6: Statistical Collection and Outreach) 45.1.1 Number and timeliness of articles submitted for
publication in other government newsletters 6 2 2 1 1
Number and timeliness of publicity and
advocacy products 6 2 1 2 1
45.2.1 Number of technical documents/reports on
improving internal and external communications Periodic 6 Report on building
relationships and training of community media by March 2016
Report on investigating
new social media platforms for dissemination of statistics by March 2016
Innovative
communication products and services to Economic Statistics by March 2016
Report on investigating
new dissemination channels for CS by March 2016
Communication
campaign for CS2016 by March 2016
Report on roll-out of
change management and communication plan by March 2016
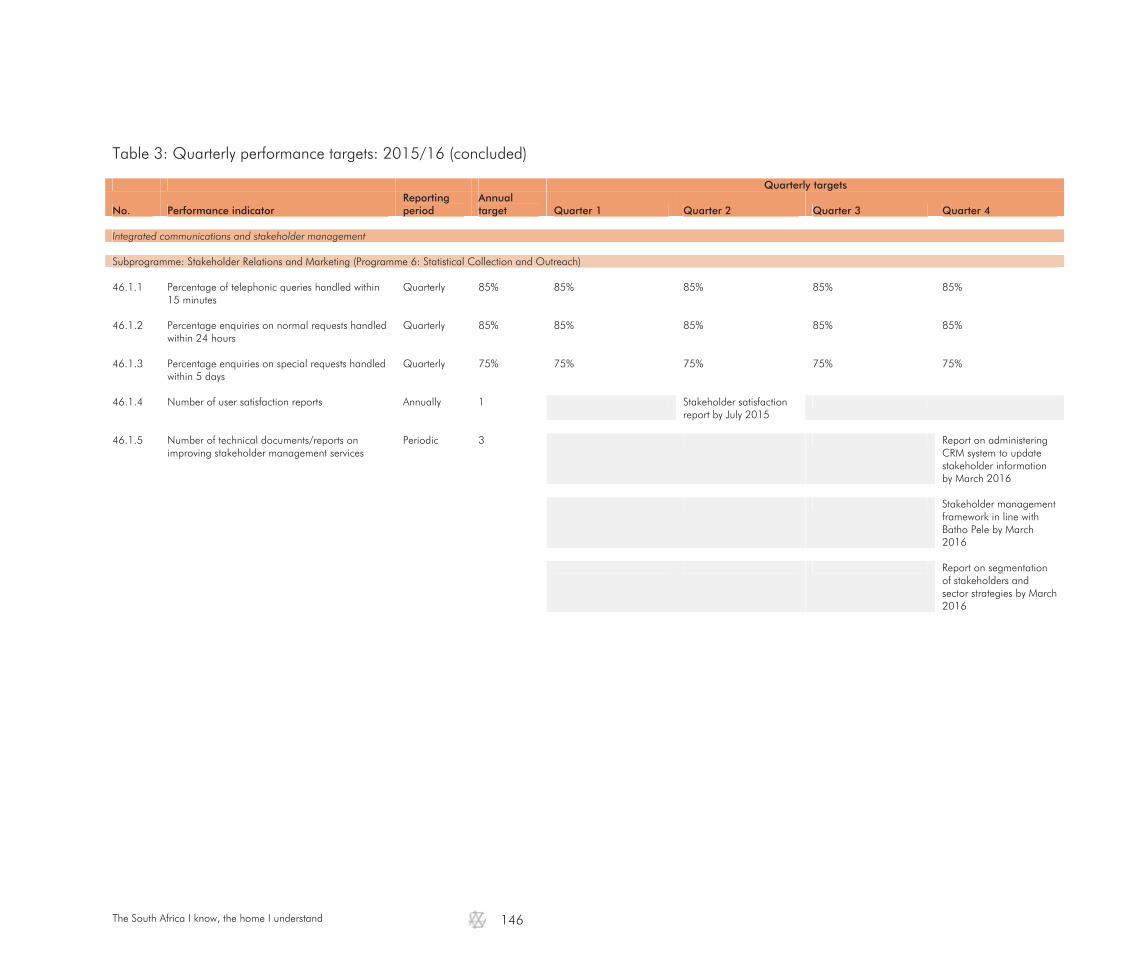
The South Africa I know, the home I understand
146
Table 3: Quarterly performance targets: 2015/16 (concluded)
Quarterly targets
No. Performance indicator Reporting period
Annual target Quarter 1 Quarter 2 Quarter 3 Quarter 4
Integrated communications and stakeholder management Subprogramme: Stakeholder Relations and Marketing (Programme 6: Statistical Collection and Outreach) 46.1.1 Percentage of telephonic queries handled within
15 minutes Quarterly 85% 85% 85% 85% 85%
46.1.2 Percentage enquiries on normal requests handled
within 24 hours Quarterly 85% 85% 85% 85% 85%
46.1.3 Percentage enquiries on special requests handled
within 5 days Quarterly 75% 75% 75% 75% 75%
46.1.4 Number of user satisfaction reports Annually 1 Stakeholder satisfaction
report by July 2015
46.1.5 Number of technical documents/reports on
improving stakeholder management services Periodic 3 Report on administering
CRM system to update stakeholder information by March 2016
Stakeholder management
framework in line with Batho Pele by March 2016
Report on segmentation
of stakeholders and sector strategies by March 2016

The South Africa I know, the home I understand
147
3.2.5 Designate statistics as official
Strategic objective 2.5: To designate statistics as official Objective statement: To designate statistics as official by conducting ten independent assessment of statistical series in the national
statistics system against the South African Quality Assessment Framework (SAQAF) Baseline: Number of series declared official: 2 Justification: This objective will contribute to the credibility of official statistics by giving confidence to users that official statistics
are meeting quality criteria and principles Links: This objective will contribute to improving the measurement of the economy and society
In order to ensure that Stats SA as well as other organs of state produces statistical information in line with professional standards as defined in the South African Statistical Quality Assessment Framework (SASQAF), the organisation introduced an independent assessment process to certify statistics as official. A key strategic focus area to enhance trust and public confidence in statistics is to designate all statistics in the national statistics system as official to inform evidence-based decisions.
The following tables outline the strategic, annual and quarterly performance targets for designating statistics as official:
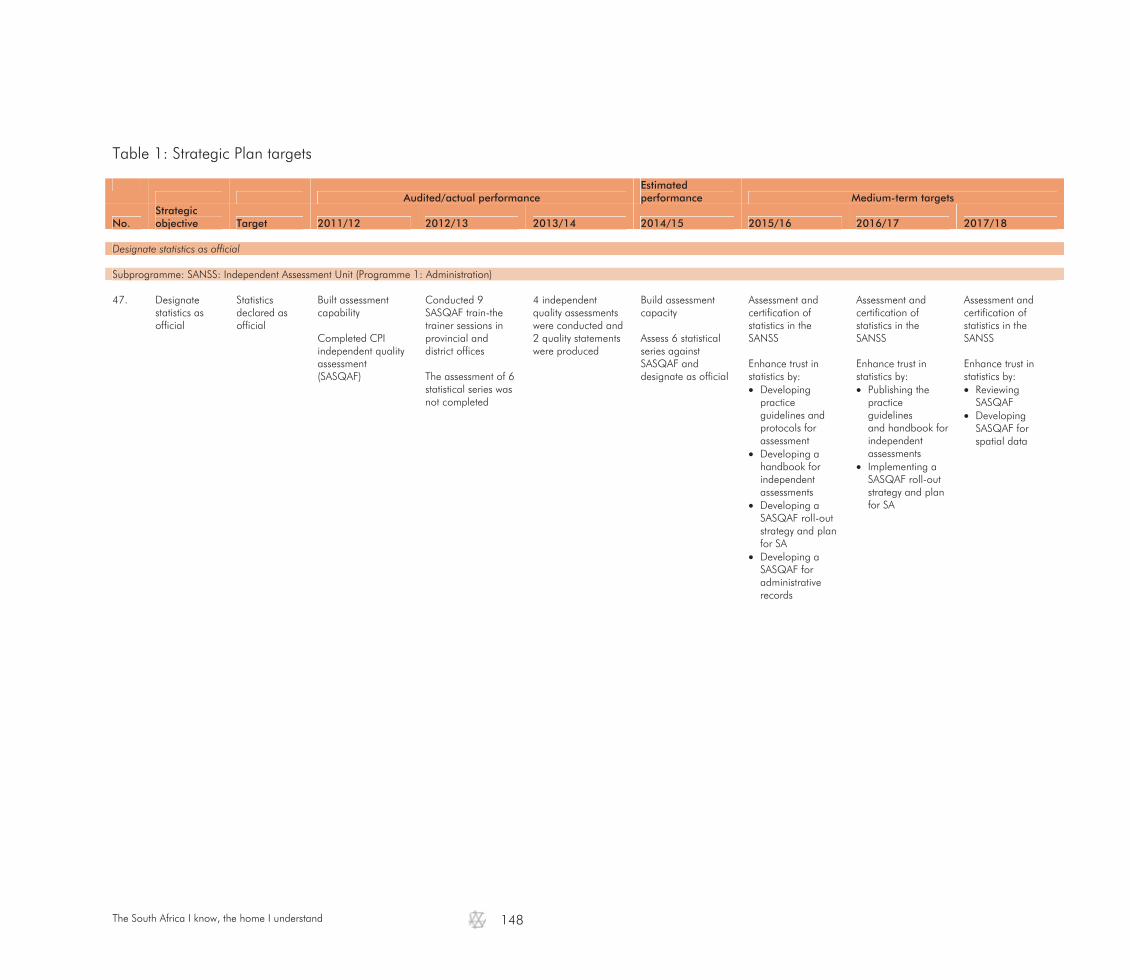
The South Africa I know, the home I understand
148
Table 1: Strategic Plan targets
Audited/actual performance
Estimated performance Medium-term targets
No. Strategic objective Target 2011/12 2012/13 2013/14 2014/15 2015/16 2016/17 2017/18
Designate statistics as official Subprogramme: SANSS: Independent Assessment Unit (Programme 1: Administration) 47. Designate
statistics as official
Statistics declared as official
Built assessment capability Completed CPI independent quality assessment (SASQAF)
Conducted 9 SASQAF train-the trainer sessions in provincial and district offices The assessment of 6 statistical series was not completed
4 independent quality assessments were conducted and 2 quality statements were produced
Build assessment capacity Assess 6 statistical series against SASQAF and designate as official
Assessment and certification of statistics in the SANSS Enhance trust in statistics by: Developing
practice guidelines and protocols for assessment
Developing a handbook for independent assessments
Developing a SASQAF roll-out strategy and plan for SA
Developing a SASQAF for administrative records
Assessment and certification of statistics in the SANSS Enhance trust in statistics by: Publishing the
practice guidelines and handbook for independent assessments
Implementing a SASQAF roll-out strategy and plan for SA
Assessment and certification of statistics in the SANSS Enhance trust in statistics by: Reviewing
SASQAF Developing
SASQAF for spatial data
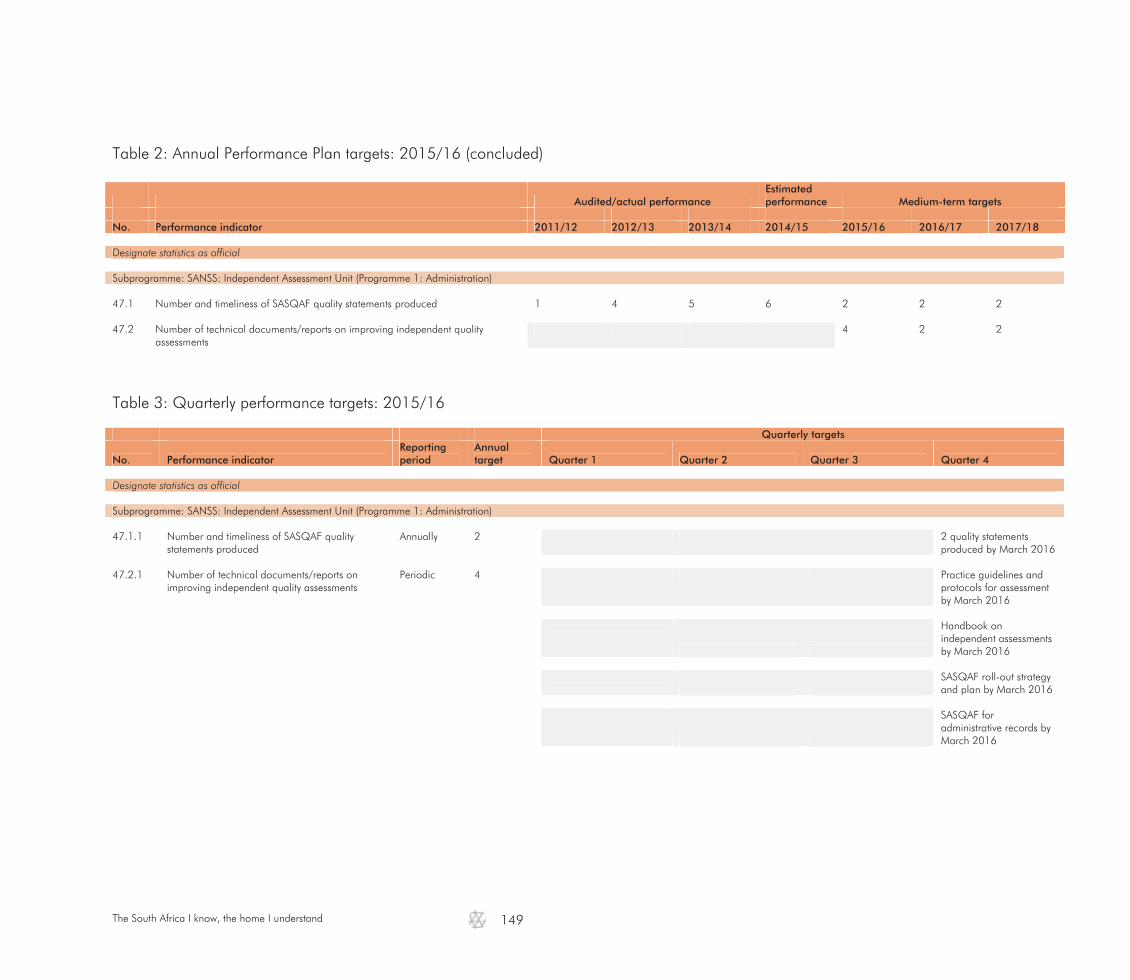
The South Africa I know, the home I understand
149
Table 2: Annual Performance Plan targets: 2015/16 (concluded)
Audited/actual performance Estimated performance Medium-term targets
No. Performance indicator 2011/12 2012/13 2013/14 2014/15 2015/16 2016/17 2017/18 Designate statistics as official Subprogramme: SANSS: Independent Assessment Unit (Programme 1: Administration) 47.1 Number and timeliness of SASQAF quality statements produced 1 4 5 6 2 2 2 47.2 Number of technical documents/reports on improving independent quality
assessments 4 2 2
Table 3: Quarterly performance targets: 2015/16
Quarterly targets
No. Performance indicator Reporting period
Annual target Quarter 1 Quarter 2 Quarter 3 Quarter 4
Designate statistics as official Subprogramme: SANSS: Independent Assessment Unit (Programme 1: Administration) 47.1.1 Number and timeliness of SASQAF quality
statements produced Annually 2 2 quality statements
produced by March 2016 47.2.1 Number of technical documents/reports on
improving independent quality assessments Periodic 4 Practice guidelines and
protocols for assessment by March 2016
Handbook on independent assessments by March 2016
SASQAF roll-out strategy and plan by March 2016
SASQAF for administrative records by March 2016


The South Africa I know, the home I understand
152
3.3 Strategic Outcome 3: Partners in statistics
Coordination in statistical development and strengthening partnerships in statistical systems cannot be overemphasised. The United Nation's Fundamental Principles of Official Statistics provides, inter alia, that coordination among statistical agencies within countries is essential to achieve consistency and efficiency in the statistical system. In South Africa, statistical coordination among organs of state is provided for in section 14 of the Statistics Act (Act No. 6 of 1999).
Partners in statistics does not only refer to the national statistics system, it also includes collaboration and partnerships in Africa and the world.
Strategic objectives
The South Africa I know, the home I understand
153
3.3.1 Strengthen collaboration to build statistical sampling frames Strategic objective 3.1: To strengthen collaboration to build statistical sampling frames Objective statement: Ensure accurate and reliable statistical information by drawing annual samples for all economic and social
statistics surveys based on sound sampling frames by strengthening collaboration with strategic partners Baseline: Annual sampling frame for Economic Statistics based on the business register. Annual sampling frame for Social
and Population Statistics based on the spatial information frame Justification: This objective will contribute in maintaining updated sampling frames for the collection of economic, population
and social statistics Links: This objective will contribute to improving the measurement of the economy and society Geographic frames and geographical services: The spatial information frame contextualises the collection, classification, analysis, and interpretation of data. The dwelling frame is a spatial entity within the frame and is a database of geographically referenced structures with physical addresses. This spatial frame is provided through the geographic infrastructure and geographic knowledge across the statistical value chain which is the geographic systems, geographic frames, geographic methods and standards, geographic support and geographic analysis. The spatial frame is the base for the sampling frame for household surveys and the population census. The strategic intent is to adopt a collaborative mapping approach with partners in the geospatial community, especially municipalities, with the intention to have up-to-date geospatial information available to all stakeholders in South Africa. The key deliverable under this initiative will be an integrated national dataset of dwelling structures in South Africa. Business sampling frame and maintenance: Statistics South Africa conducts various economic surveys on a monthly, quarterly, annual and periodic basis. In order to conduct these sample surveys, a target population of businesses is required. The target population is drawn from the Business Sampling Frame (BSF), internationally known as the 'Statistical Business Register (SBR)'. In addition to the primary use of the BSF, it is also a rich source of information that could be used to generate business register-based statistics. A quality management framework has been introduced and quarterly reports are made available to internal users on agreed performance measures and indicators. The preparation to review the quality management framework will commence in 2015/16.
The maintenance of the current business sampling frame system has become challenging and a new system was developed. Testing of the new system will commence in 2015/16. In general, it will bring added functionality for effective continuous quality improvement of information as well as support the desired statistical unit's model. Research has been undertaken to improve the coverage and content of the business sampling frame. Profiling and delineation is adopted as a maintenance process of large and complex businesses on the BSF. These units

The South Africa I know, the home I understand
154
contribute a high percentage of the country's financial turnover. Due to this economic dominance, statistical offices worldwide pay special attention to them through the above-mentioned process. The profiling turnaround time has improved from three to two years. To note is that the BSF covers all size groups businesses, i.e. micro/very small, small, medium and large businesses that are formally registered with SARS. The following tables outline the strategic, annual and quarterly performance targets for strengthening collaboration to build statistical sampling frames:
Table 1: Strategic Plan targets
Audited/actual performance
Estimated performance Medium-term targets
No. Strategic objective Target 2011/12 2012/13 2013/14 2014/15 2015/16 2016/17 2017/18
Geospatial frame Subprogramme: Geographic Frames and Geographic Services (Programme 5: Statistical Support and Informatics) 48. To strengthen
collaboration to build statistical sampling frames
Spatial information frame
Completed 10,8 million points Developed maintenance of methodologies Assigned geo-referenced addresses to dwellings (300 000 per annum – 900 000 cumulative) Functional digital data capturing system was not provided Finalised map production and EA summary books
Completed 11,3 million points created Maintained 1 000 000 points for the year Assigned geo-referenced addresses to dwellings (358 000 per annum – 1 258 000 cumulative) Published a Digital Atlas during the census release Improved on support and produced/ created 32 000 maps and supported 220 users. Achieved user-satisfaction rate of 95%
Completed 15,4 million points Maintained the dwelling frame Assigned 86 000 addresses to dwellings Improved functionality of Digital Atlas by expanding data comparisons for 1996, 2001, 2007 and 2011
11,9 million points created(cumulative) Maintain a standard geographical frame Assign geo-referenced addresses to dwellings (300 000 per annum – 1 800 000 cumulative) Develop a user-friendly data dictionary interface Maintain place name and EA frames for all municipalities
Provide an updated spatial information frame for the collection of household statistics Improve the SIF by: Publishing a
complete dwelling frame at cities and metro level
Introducing a continuous demarcation methodology (1 province)
Preparing the SIF for CS2016
Compiling geo-spatial research reports to inform the NDP
Developing research and development applications
Provide an updated spatial information frame for the collection of household statistics Improve the SIF by: Publishing a
complete dwelling frame at metro, cities and regional service centres levels
Updating and maintaining the EA layer (2 provinces)
Compiling geo-spatial research reports to inform the NDP
Provide an updated spatial information frame for the collection of household statistics Improve the SIF by: Publishing a
complete dwelling frame at metro, cities, regional service centres, local and niche towns and clustered and dispersed settlements levels
Updating and maintaining the EA layer (4 provinces)
Compiling geo-spatial research reports to inform the NDP
Sub-programme: Provinces (Programme 6: Statistical Collection and Outreach) 49. This target is
under provinces
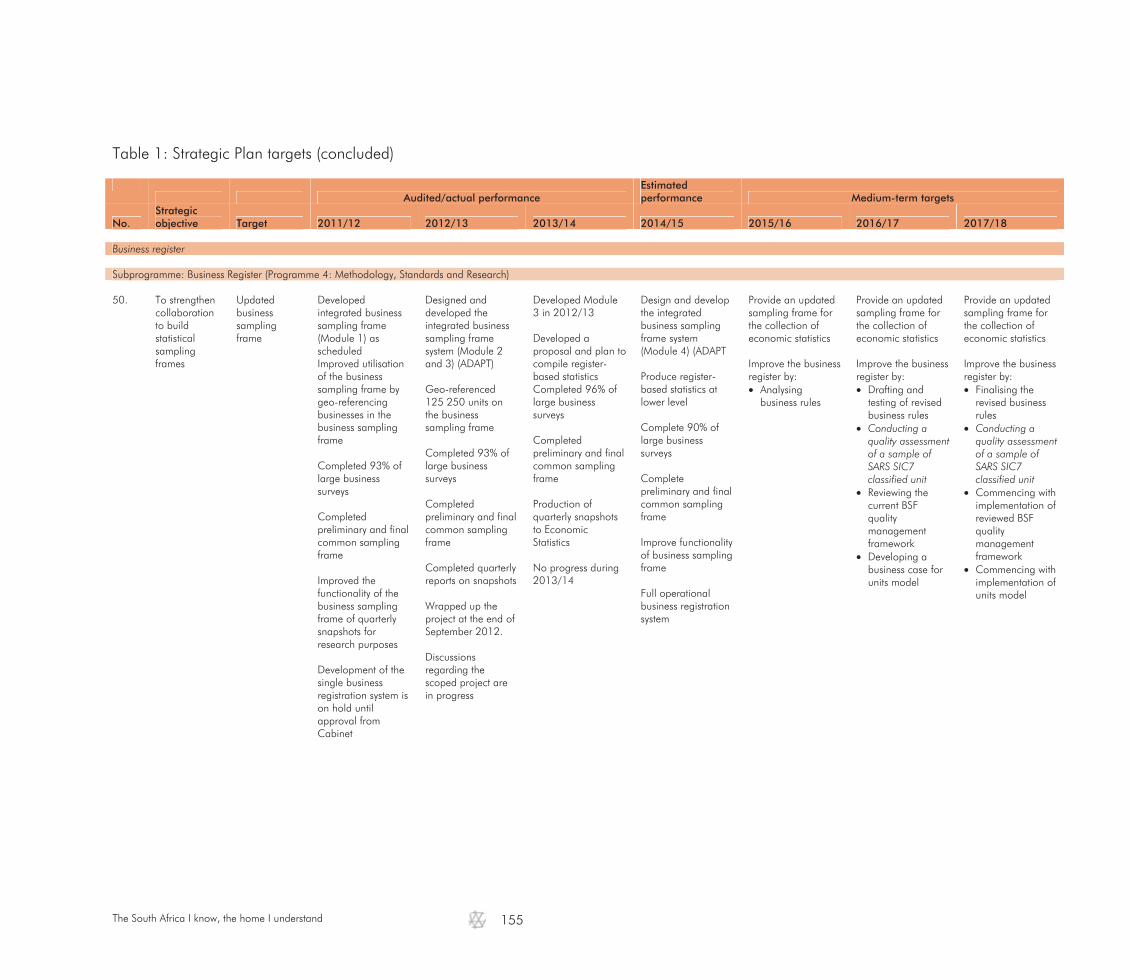
The South Africa I know, the home I understand
155
Table 1: Strategic Plan targets (concluded)
Audited/actual performance
Estimated performance Medium-term targets
No. Strategic objective Target 2011/12 2012/13 2013/14 2014/15 2015/16 2016/17 2017/18
Business register Subprogramme: Business Register (Programme 4: Methodology, Standards and Research) 50. To strengthen
collaboration to build statistical sampling frames
Updated business sampling frame
Developed integrated business sampling frame (Module 1) as scheduled Improved utilisation of the business sampling frame by geo-referencing businesses in the business sampling frame Completed 93% of large business surveys Completed preliminary and final common sampling frame Improved the functionality of the business sampling frame of quarterly snapshots for research purposes Development of the single business registration system is on hold until approval from Cabinet
Designed and developed the integrated business sampling frame system (Module 2 and 3) (ADAPT) Geo-referenced 125 250 units on the business sampling frame Completed 93% of large business surveys Completed preliminary and final common sampling frame Completed quarterly reports on snapshots Wrapped up the project at the end of September 2012. Discussions regarding the scoped project are in progress
Developed Module 3 in 2012/13 Developed a proposal and plan to compile register-based statistics Completed 96% of large business surveys Completed preliminary and final common sampling frame Production of quarterly snapshots to Economic Statistics No progress during 2013/14
Design and develop the integrated business sampling frame system (Module 4) (ADAPT Produce register-based statistics at lower level Complete 90% of large business surveys Complete preliminary and final common sampling frame Improve functionality of business sampling frame Full operational business registration system
Provide an updated sampling frame for the collection of economic statistics Improve the business register by: Analysing
business rules
Provide an updated sampling frame for the collection of economic statistics
Improve the business register by: Drafting and
testing of revised business rules
Conducting a quality assessment of a sample of SARS SIC7 classified unit
Reviewing the current BSF quality management framework
Developing a business case for units model
Provide an updated sampling frame for the collection of economic statistics
Improve the business register by: Finalising the
revised business rules
Conducting a quality assessment of a sample of SARS SIC7 classified unit
Commencing with implementation of reviewed BSF quality management framework
Commencing with implementation of units model
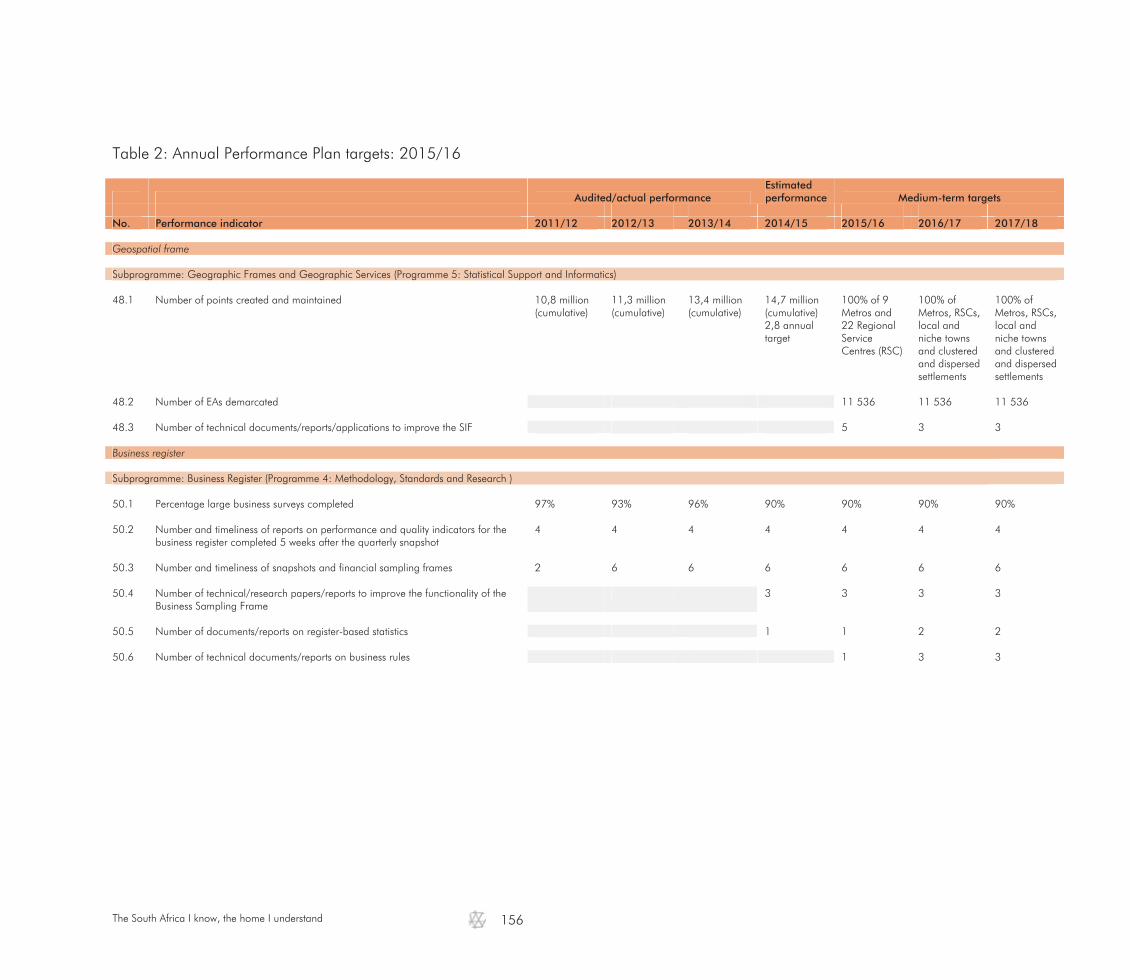
The South Africa I know, the home I understand
156
Table 2: Annual Performance Plan targets: 2015/16
Audited/actual performance Estimated performance Medium-term targets
No. Performance indicator 2011/12 2012/13 2013/14 2014/15 2015/16 2016/17 2017/18 Geospatial frame Subprogramme: Geographic Frames and Geographic Services (Programme 5: Statistical Support and Informatics) 48.1 Number of points created and maintained 10,8 million
(cumulative) 11,3 million (cumulative)
13,4 million (cumulative)
14,7 million (cumulative) 2,8 annual target
100% of 9 Metros and 22 Regional Service Centres (RSC)
100% of Metros, RSCs, local and niche towns and clustered and dispersed settlements
100% of Metros, RSCs, local and niche towns and clustered and dispersed settlements
48.2 Number of EAs demarcated 11 536 11 536 11 536 48.3 Number of technical documents/reports/applications to improve the SIF 5 3 3 Business register Subprogramme: Business Register (Programme 4: Methodology, Standards and Research ) 50.1 Percentage large business surveys completed 97% 93% 96% 90% 90% 90% 90% 50.2 Number and timeliness of reports on performance and quality indicators for the
business register completed 5 weeks after the quarterly snapshot 4 4 4 4 4 4 4
50.3 Number and timeliness of snapshots and financial sampling frames 2 6 6 6 6 6 6 50.4 Number of technical/research papers/reports to improve the functionality of the
Business Sampling Frame 3 3 3 3
50.5 Number of documents/reports on register-based statistics 1 1 2 2 50.6 Number of technical documents/reports on business rules 1 3 3
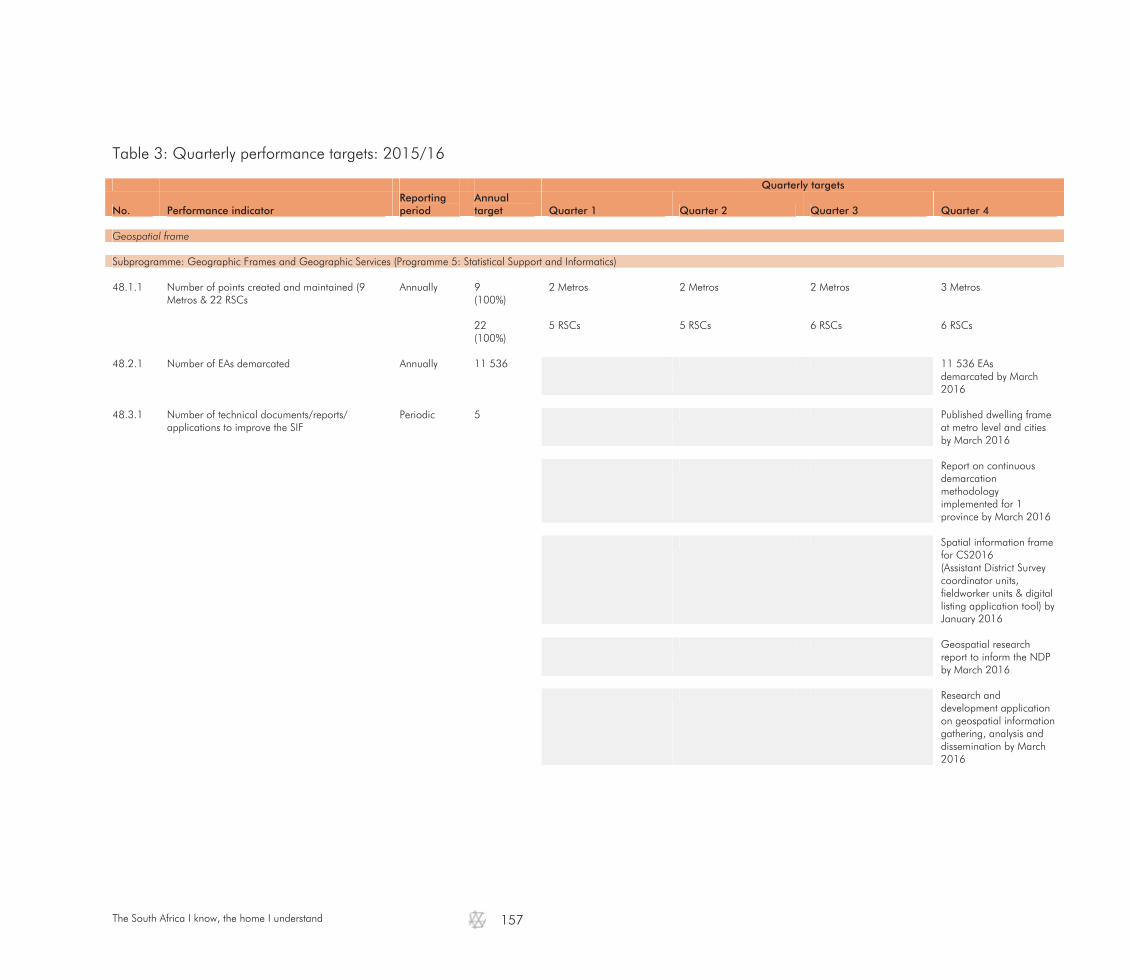
The South Africa I know, the home I understand
157
Table 3: Quarterly performance targets: 2015/16
Quarterly targets
No. Performance indicator Reporting period
Annual target Quarter 1 Quarter 2 Quarter 3 Quarter 4
Geospatial frame Subprogramme: Geographic Frames and Geographic Services (Programme 5: Statistical Support and Informatics) 48.1.1 Number of points created and maintained (9
Metros & 22 RSCs Annually 9
(100%) 2 Metros 2 Metros 2 Metros 3 Metros
22
(100%) 5 RSCs 5 RSCs 6 RSCs 6 RSCs
48.2.1 Number of EAs demarcated Annually 11 536
11 536 EAs
demarcated by March 2016
48.3.1 Number of technical documents/reports/
applications to improve the SIF Periodic 5 Published dwelling frame
at metro level and cities by March 2016
Report on continuous
demarcation methodology implemented for 1 province by March 2016
Spatial information frame
for CS2016 (Assistant District Survey coordinator units, fieldworker units & digital listing application tool) by January 2016
Geospatial research
report to inform the NDP by March 2016
Research and
development application on geospatial information gathering, analysis and dissemination by March 2016
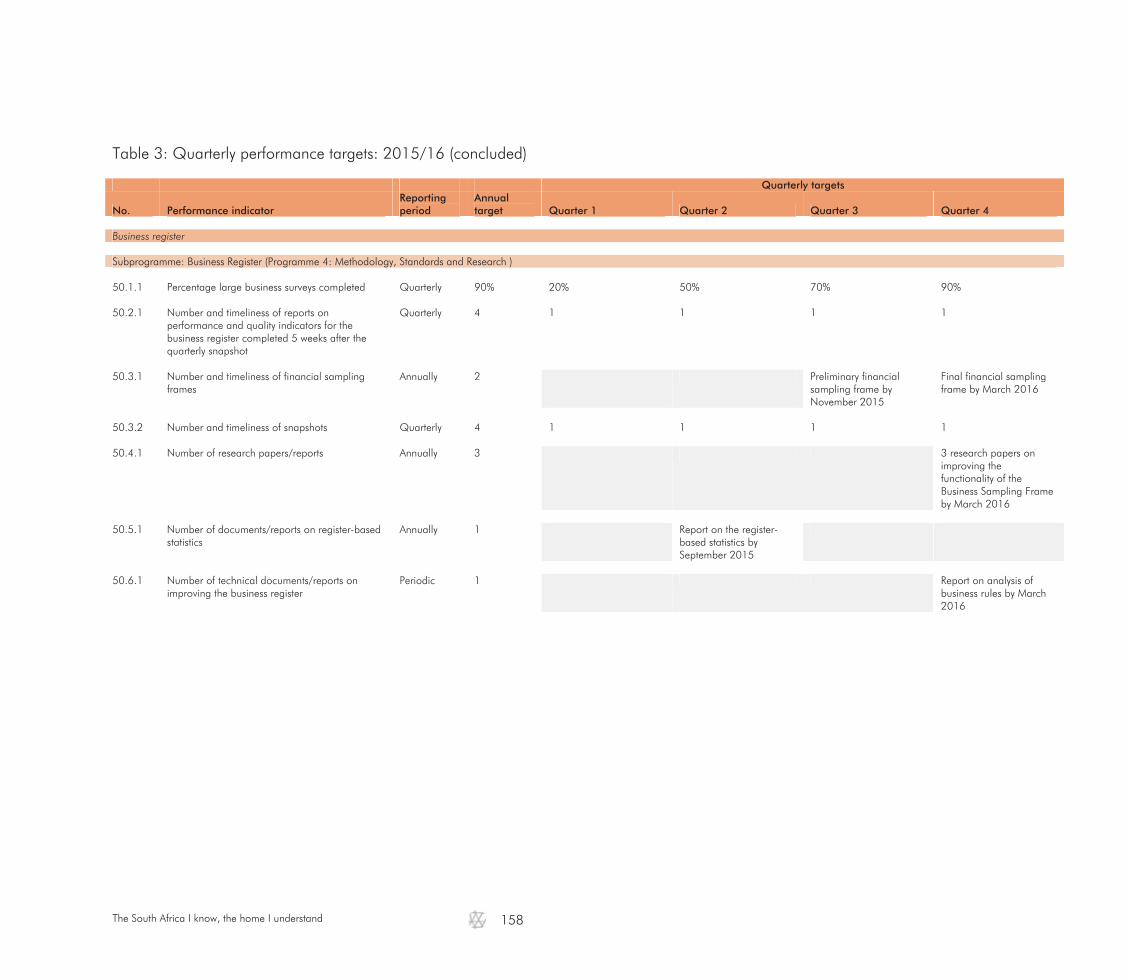
The South Africa I know, the home I understand
158
Table 3: Quarterly performance targets: 2015/16 (concluded)
Quarterly targets
No. Performance indicator Reporting period
Annual target Quarter 1 Quarter 2 Quarter 3 Quarter 4
Business register Subprogramme: Business Register (Programme 4: Methodology, Standards and Research ) 50.1.1 Percentage large business surveys completed Quarterly 90% 20% 50% 70% 90% 50.2.1 Number and timeliness of reports on
performance and quality indicators for the business register completed 5 weeks after the quarterly snapshot
Quarterly 4 1 1 1 1
50.3.1 Number and timeliness of financial sampling
frames Annually 2 Preliminary financial
sampling frame by November 2015
Final financial sampling frame by March 2016
50.3.2 Number and timeliness of snapshots Quarterly 4 1 1 1 1 50.4.1 Number of research papers/reports Annually 3 3 research papers on
improving the functionality of the Business Sampling Frame by March 2016
50.5.1 Number of documents/reports on register-based
statistics Annually 1 Report on the register-
based statistics by September 2015
50.6.1 Number of technical documents/reports on
improving the business register Periodic 1 Report on analysis of
business rules by March 2016
The South Africa I know, the home I understand
159
3.3.2 Lead the coordination of the statistical system in South Africa Strategic objective 3.2: To lead the development and coordination of the statistical system in South Africa Objective statement: To lead the development, coordination and collaboration of the statistical system in South Africa by providing
strategic direction to statistical development; providing technical support and statistical advice to organs of state; coordinating statistical reporting; as well as establishing governance structures for effective coordination of statistical production
Baseline: Number of organs of state receiving technical support and advice in statistical production: 10 Justification: This objective will contribute to ensure relevance, alignment and avoid duplication of statistical production Links: This objective will contribute to improving the measurement of the economy and society
South Africa has a system of national statistics with an array of role players. Key policy issues are wider than the remit of any single government department and must be tackled on a government-wide basis. These cross-cutting issues clearly indicate a need for a set of national statistics within a coordination framework where statistical units, data items, classifications and standards are harmonised across government. The United Nation's Fundamental Principles of Official Statistics provides, inter alia, that coordination among statistical agencies within countries is essential to achieve consistency and efficiency in the statistical system. In South Africa, statistical coordination among organs of state is provided for in section 14 of the Statistics Act (Act No. 6 of 1999). A national strategy for the development of statistics (NSDS) is necessary in order to fully implement the Act, which is a prerequisite if the demand for statistics in the country is to be met. The NSDS will be compiled in collaboration with partners in the SANSS. In terms of the Act, coordination of production involves: Aligning the production of statistics by other organs of state to user needs to ensure relevance, and to avoid duplication; Setting standards to ensure quality statistics are produced; Integrating statistics in policy formulation processes to support development outcomes; Providing technical support to organs of state that produce statistics; and Declaring statistics produced by Stats SA and other organs of state as official statistics.
Over the medium term, some of the initiatives will include: Developing a bill to amend the Statistics Act (Act No. 6 of 1999); Establishing a portal linking other statistical information systems to Stats SA; Expanding statistical subsystems within social and economic statistics systems; and Increasing certification of other statistics as official.

The South Africa I know, the home I understand
160
The SANSS is the organising framework for implementing statistical coordination. The SANSS will play a major role in transforming a statistical system which is characterised by an information gap, a quality gap and a capacity gap, to a system of official statistics that adequately serves a developmental state. The following tables outline the strategic, annual and quarterly performance targets for leading the coordination of the statistical system in South Africa:

The South Africa I know, the home I understand
161
Table 1: Strategic Plan targets
Subprogramme: SANSS (Programme 1: Administration) 51. Lead the
coordination of the statistical system in SA
National Statistics System
The economic and social subsystems were not defined due to human resource constraints Provided technical support to Basic Education in self-assessment against SASQAF Supported the development of a quality improvement plan Mapped health statistics subsystem
Recommended data improvement plans
Established protocols for accessibility of data holdings Creation of links on website with data-originating departments was not completed
Facilitated coordination of statistical frames Strengthened relationship with SARS and the DTI to improve integrated Business Register
Developed conceptual framework for coordinating statistical frames
Implemented data sharing tool with Stats SA IT using Connect-Direct software The forums were not established The independent quality assessment against SASQAF was not conducted Compiled the draft plan for the DBE and will be finalised in May 2013 Technical support to health in self-assessment against SASQAF was not provided The quality improvement plan was not developed Accessibility was not increased Data management was not provided to partners The master sample was made available to partners The study was not conducted
The establishment of statistics units in other government departments was not done Conducted an independent quality assessment for the SNAP survey and compiled an improvement plan An independent quality assessment against SASQAF was not done The quality improvement plan was not done Compiled quality improvement plan to be implemented by partner Obtained data from DHA for vital statistics, SARS Developed indicators on welfare of children with DWCPD A report was not published in 2013/14
Establish statistics units in other government departments Sustain statistical support and advice Publish results of the independent quality assessment Maintain and update MSSI Link Ulwazi portal to Umkhanyakude website Provide support to Home Affairs to implement recommendations
Coordinate the production of statistics in the economic and social subsystems Improve coordination by: Developing a
National Strategy for Development of Statistics (NSDS)
Developing a 'clearance' protocol
Applying SASQAF Lite on relevant data
Coordinate the production of statistics in the economic statistics system Improve coordination by: Developing a
National Strategy for Development of Statistics (NSDS)
Implement a 'clearance' protocol
Applying SASQAF Lite on relevant data
Developing an economic subsystem strategy
Developing a social subsystem strategy
Coordinate the production of statistics in the economic statistics system Improve coordination by: Implementing the
National Strategy for Development of Statistics (NSDS)
Apply the 'clearance' protocol
Applying SASQAF Lite on relevant data
Implementing an economic subsystem strategy
Implementing a social subsystem strategy
Audited/actual performance
Estimated performance Medium-term targets
No. Strategic objective Target 2011/12 2012/13 2013/14 2014/15 2015/16 2016/17 2017/18
Economic and social statistics subsystems

The South Africa I know, the home I understand
162
Table 1: Strategic Plan targets (continued)
Information management in the SANSS 52. Lead the
coordination of the statistical system in SA
National Statistics System
Statistical programme for education sector was not approved. The District Health Information System (DHIS) subsystem was mapped and SASQAF diagnostic tool was applied to DHIS facilities. A report was submitted to DOH Statistical programme for crime statistics was not achieved due to human resource constraints Statistical programme for Department of Science and Technology was not approved because the plan was not received from DST
Developed a Statistical Planning Tool which will be workshopped and completed by the DBE Developed a Statistical Planning Tool which will be workshopped and completed by the National Department of Health Developed Statistical Planning Tool which will be workshopped and completed by SAPS Developed a Statistical Planning Tool which will be workshopped and completed by DST
Statistical Planning documents (tools) were developed, shared and reviewed with the DBE. The statistical programme for the education sector was not published The statistical programme for health statistics was not published The inclusion of a statistical programme for crime statistics in performance plans of relevant Ministries was not done The statistical programme for science and technology surveys was not done
Draft sector strategy for education Draft crime statistics strategy
Facilitate information sharing amongst SANSS partners Improve information sharing by: Developing a blue
print for a SANSS wide data repository
Expanding the use of the E-data transfer tool amongst SANSS members
Expanding the use of a dissemination tool amongst SANSS members
Facilitate information sharing amongst SANSS partners Improve information sharing by: Developing a
data repository Expanding the use
of the E-data transfer tool amongst SANSS members
Expanding the use of a dissemination tool amongst SANSS members
Facilitate information sharing amongst SANSS partners Improve information sharing by: Piloting a data
repository Expanding the use
of the E-data transfer tool amongst SANSS members
Expanding the use of a dissemination tool amongst SANSS members
Statistical reporting 53. Lead the
coordination of the statistical system in SA
International statistical reporting
Updated MDG indicators and identified data gaps Compiled an indicator database that meets South Africa's statistical reporting obligations
The MDG report was not compiled The MDG process was developed in 2010 MDG 2010 database was created and will be updated with 2013 data
Updated and compiled MDG 2013 report Compiled an MDG process flow for 2014 Updated the indicator database with 2013 MDG data
Publish 3rd MDG country report for 2014 Institutionalise MDG process Maintain and update an indicator database that meets South Africa's statistical reporting obligations
Facilitate production of statistics according to national, regional and international requirements Improve by: Developing
protocols for the development, compliance and reporting of indicators
Facilitate production of statistics according to national, regional and international requirements Improve by: Piloting protocols
for the development, compliance and reporting of indicators
Facilitate production of statistics according to national, regional and international requirements Improve by: Implementing and
maintain protocols for the development, compliance and reporting of indicators
Audited/actual performance
Estimated performance Medium-term targets
No. Strategic objective Target 2011/12 2012/13 2013/14 2014/15 2015/16 2016/17 2017/18
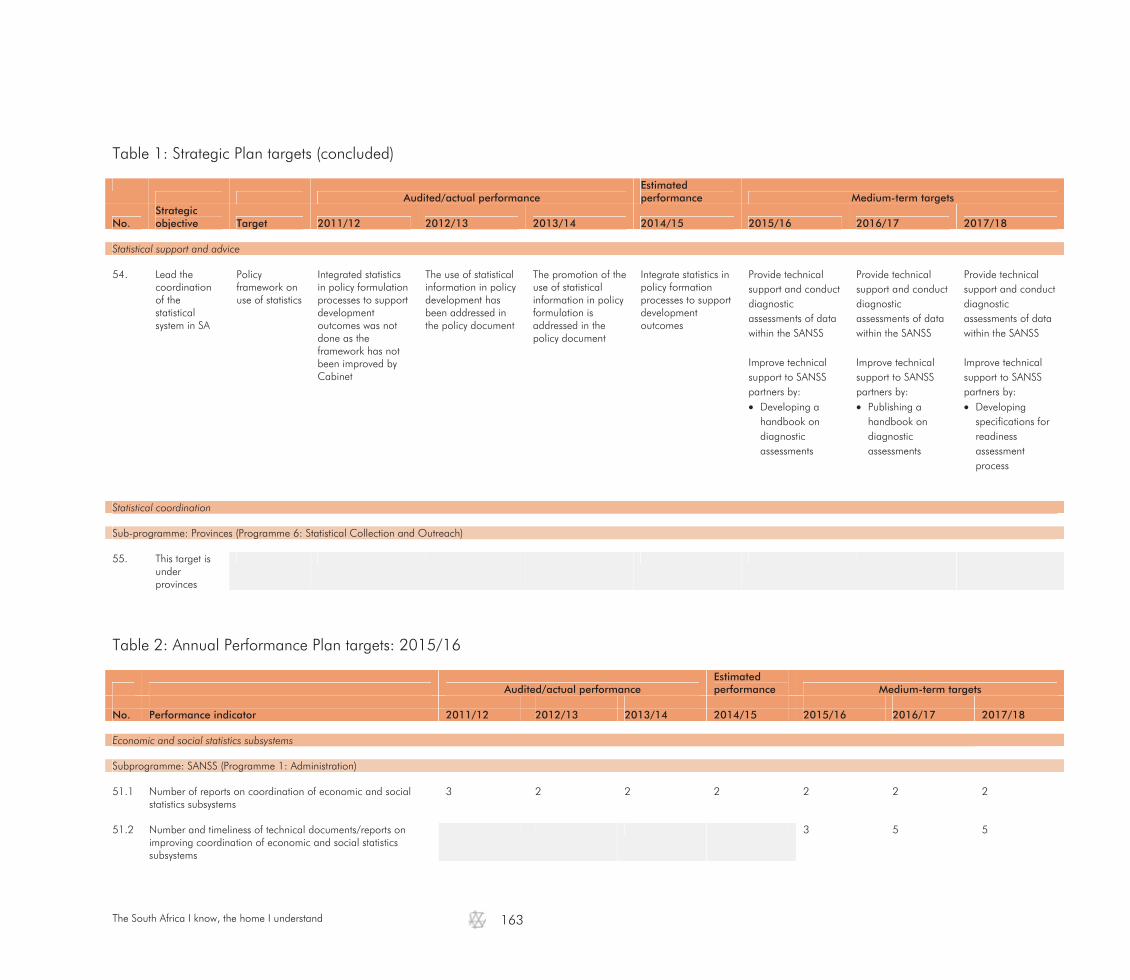
The South Africa I know, the home I understand
163
Table 1: Strategic Plan targets (concluded)
Table 2: Annual Performance Plan targets: 2015/16
Audited/actual performance Estimated performance Medium-term targets
No. Performance indicator 2011/12 2012/13 2013/14 2014/15 2015/16 2016/17 2017/18 Economic and social statistics subsystems Subprogramme: SANSS (Programme 1: Administration) 51.1 Number of reports on coordination of economic and social
statistics subsystems 3 2 2 2 2 2 2
51.2 Number and timeliness of technical documents/reports on
improving coordination of economic and social statistics subsystems
3 5 5
Audited/actual performance
Estimated performance Medium-term targets
No. Strategic objective Target 2011/12 2012/13 2013/14 2014/15 2015/16 2016/17 2017/18
Statistical support and advice 54. Lead the
coordination of the statistical system in SA
Policy framework on use of statistics
Integrated statistics in policy formulation processes to support development outcomes was not done as the framework has not been improved by Cabinet
The use of statistical information in policy development has been addressed in the policy document
The promotion of the use of statistical information in policy formulation is addressed in the policy document
Integrate statistics in policy formation processes to support development outcomes
Provide technical support and conduct diagnostic assessments of data within the SANSS Improve technical support to SANSS partners by: Developing a
handbook on diagnostic assessments
Provide technical support and conduct diagnostic assessments of data within the SANSS Improve technical support to SANSS partners by: Publishing a
handbook on diagnostic assessments
Provide technical support and conduct diagnostic assessments of data within the SANSS Improve technical support to SANSS partners by: Developing
specifications for readiness assessment process
Statistical coordination Sub-programme: Provinces (Programme 6: Statistical Collection and Outreach) 55. This target is
under provinces
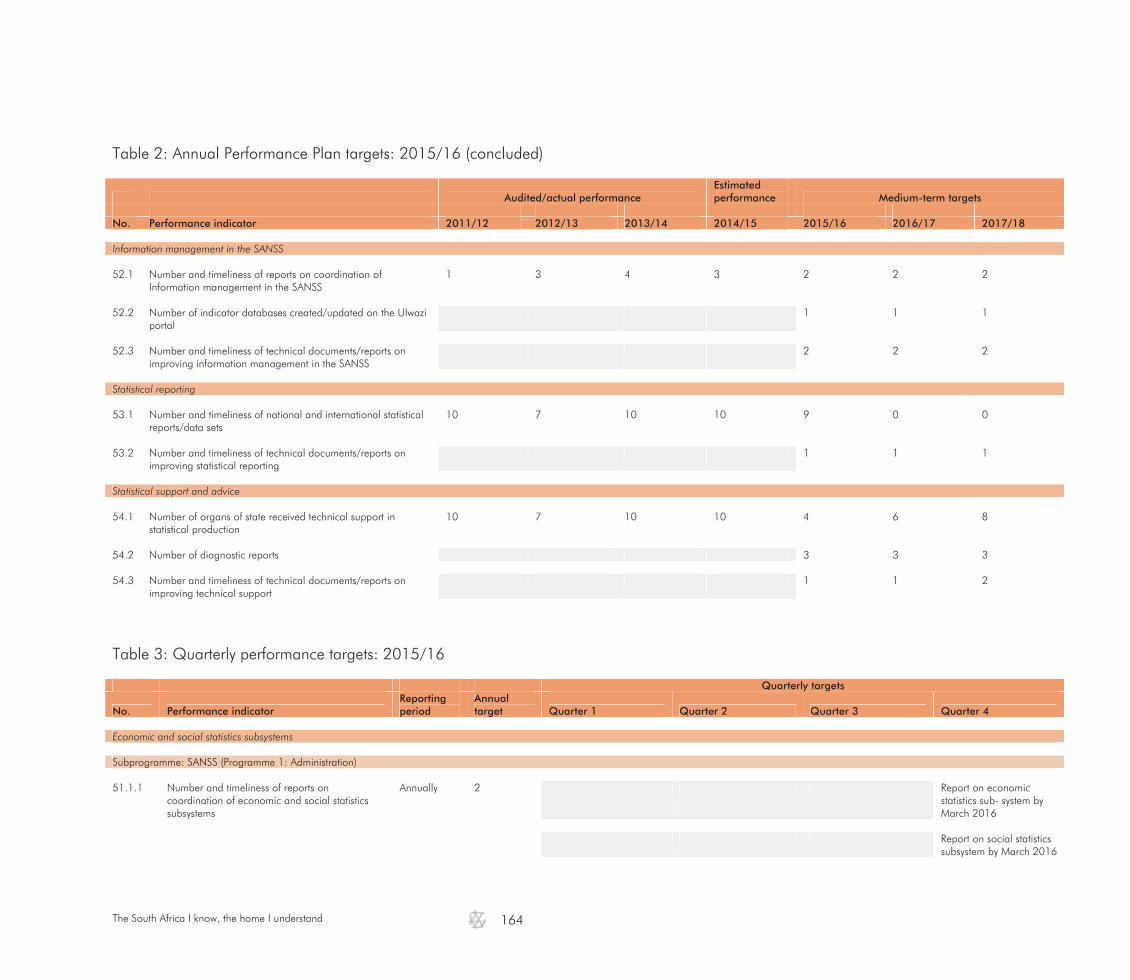
The South Africa I know, the home I understand
164
Table 2: Annual Performance Plan targets: 2015/16 (concluded)
Audited/actual performance Estimated performance Medium-term targets
No. Performance indicator 2011/12 2012/13 2013/14 2014/15 2015/16 2016/17 2017/18 Information management in the SANSS 52.1 Number and timeliness of reports on coordination of
Information management in the SANSS 1 3 4 3 2 2 2
52.2 Number of indicator databases created/updated on the Ulwazi
portal 1 1 1
52.3 Number and timeliness of technical documents/reports on
improving information management in the SANSS 2 2 2
Statistical reporting 53.1 Number and timeliness of national and international statistical
reports/data sets 10 7 10 10 9 0 0
53.2 Number and timeliness of technical documents/reports on
improving statistical reporting 1 1 1
Statistical support and advice 54.1 Number of organs of state received technical support in
statistical production 10 7 10 10 4 6 8
54.2 Number of diagnostic reports 3 3 3 54.3 Number and timeliness of technical documents/reports on
improving technical support 1 1 2
Table 3: Quarterly performance targets: 2015/16
Quarterly targets
No. Performance indicator Reporting period
Annual target Quarter 1 Quarter 2 Quarter 3 Quarter 4
Economic and social statistics subsystems Subprogramme: SANSS (Programme 1: Administration) 51.1.1 Number and timeliness of reports on
coordination of economic and social statistics subsystems
Annually 2 Report on economic statistics sub- system by March 2016
Report on social statistics
subsystem by March 2016

The South Africa I know, the home I understand
165
Table 3: Quarterly performance targets: 2015/16 (continued)
Quarterly targets
No. Performance indicator Reporting period
Annual target Quarter 1 Quarter 2 Quarter 3 Quarter 4
Economic and social statistics subsystems Subprogramme: SANSS (Programme 1: Administration) 51.2.1 Number of technical documents/reports on
improving coordination of economic and social subsystems
Periodic 3 National Strategy for Development of Statistics (1st draft) by March 2016
Clearance protocol by
March 2016 Report on applying
SASQAF Lite on relevant data by March 2016
Information management in the SANSS 52.1.1 Number of reports on coordination of
Information management in the SANSS Annually 2 Report on coordination of
Information management in the SANSS by September 2015
Report on coordination of Information management in the SANSS by March 2016
52.2.1 Number of indicator databases created/updated
on the Ulwazi portal Periodic 1 Blueprint for a SANSS-
wide data repository by March 2016
52.3.1 Number and timeliness of technical
documents/reports on improving information management in the SANSS
Periodic 2 Report on expanding E-data transfer tool amongst SANSS members by March 2016
Report on expanding the dissemination tool amongst SANSS members by March 2016
Statistical reporting 53.1.1 Number and timeliness of national and
international statistical reports/data sets Annually 9 1 country report by
September 2015 8 Millennium
Development Goal reports by March 2016
53.2.1 Number and timeliness of technical
documents/reports on improving statistical reporting
Periodic 1 Protocol for the development, compliance and reporting of indicators by March 2016
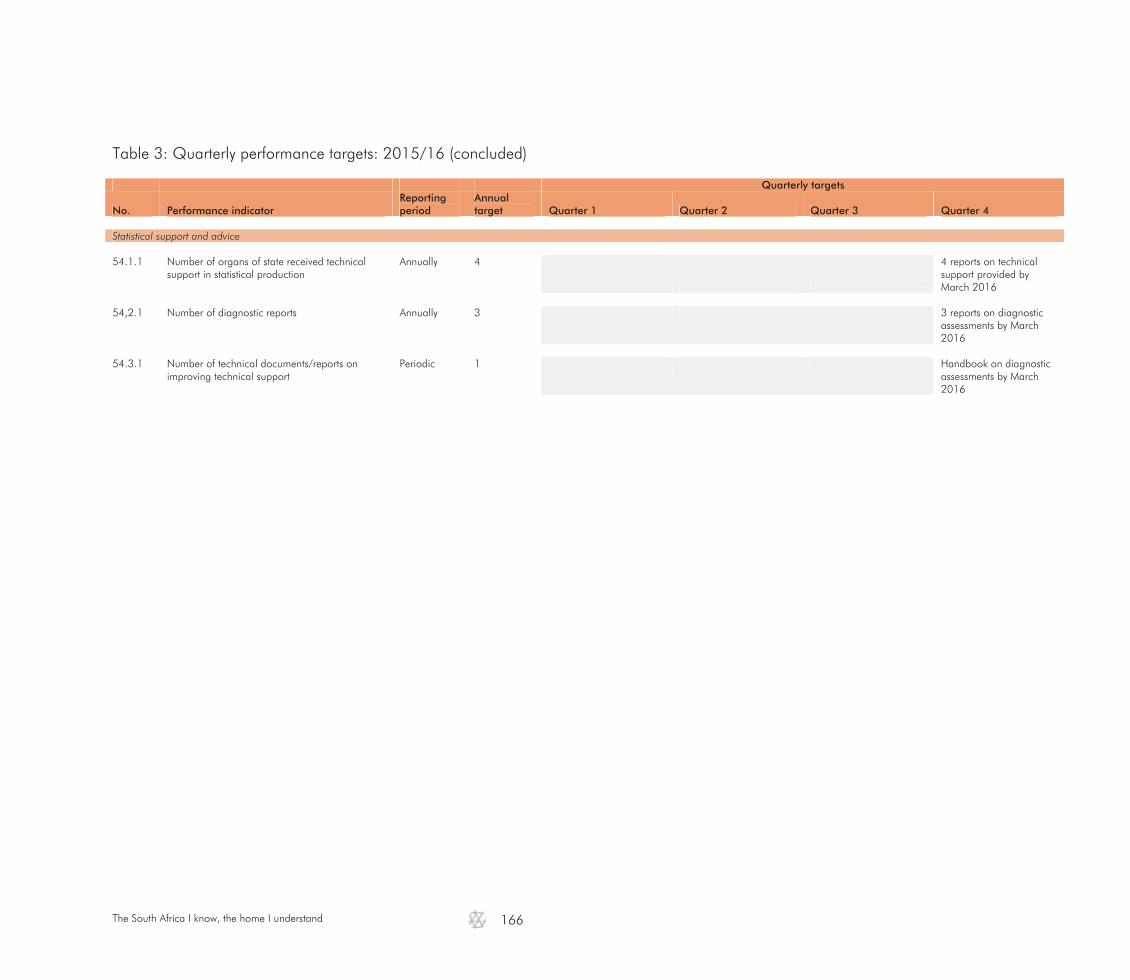
The South Africa I know, the home I understand
166
Table 3: Quarterly performance targets: 2015/16 (concluded)
Quarterly targets
No. Performance indicator Reporting period
Annual target Quarter 1 Quarter 2 Quarter 3 Quarter 4
Statistical support and advice 54.1.1 Number of organs of state received technical
support in statistical production Annually 4
4 reports on technical support provided by March 2016
54,2.1 Number of diagnostic reports Annually 3 3 reports on diagnostic
assessments by March 2016
54.3.1 Number of technical documents/reports on
improving technical support Periodic 1 Handbook on diagnostic
assessments by March 2016

The South Africa I know, the home I understand
167
3.3.3 Promoting international cooperation and participation in statistics
Strategic objective 3.3: To strengthen international collaboration and partnerships and lead statistical development in Africa Objective statement: Strengthen international collaboration and partnerships to learn, share and contribute to international discourse
and practices for statistical development; and lead statistical development in Africa by serving as a centre of excellence in statistical systems and practices
Baseline: Participation in international statistical initiatives: 10 statistical fora Justification: This objective will contribute to Stats SA's implementation of internationally recognised statistical systems,
standards and practices Links: This objective links to the international statistics agenda, the Sustainable Development Goals Agenda, and the
African Integration Agenda 2063
The Statistics Act (Act No. 6 of 1999) provides for the Statistician-General to participate in international statistical activities and build relations with international statistical role players. The Act further directs the Statistician-General to endeavour to fulfil the Republic's international statistical reporting obligations and liaise with other countries and their statistical agencies, as well as to represent Stats SA internationally on statistical matters. South Africa is part of the global statistical community participating in the development of statistical practices and influencing statistical discourse. Stats SA is part of the continental and regional statistics community and plays a leading role in statistical development. We have established strong partnerships with Pan African institutions such as the African Union Commission, the Southern African Development Community, the United Nations Economic Commission for Africa and the African Development Bank. With the advent of the post-2015 sustainable development agenda and the Africa Agenda 2063, the importance of knowing and understanding the impact of the political, economic and social policies and programmes on the people of Africa, the importance of national statistics systems and the harmonisation of the African Statistics System have been emphasised. Stats SA is at the forefront of these developments and including leading the improvement of CRVS systems on the Continent through the ASSD. The following tables outline the strategic, annual and quarterly performance targets for strengthening international collaboration and partnerships in Africa and globally:

The South Africa I know, the home I understand
168
Table 1: Strategic Plan targets
Audited/actual performance
Estimated performance Medium-term targets
No. Strategic objective Target 2011/12 2012/13 2013/14 2014/15 2015/16 2016/17 2017/18
International collaboration and partnerships Subprogramme: International Statistical Development and Cooperation (Programme 6: Statistical Collection and Outreach) 56. Strengthen
international collaboration and partnerships and lead statistical development in Africa
International statistical partnerships
The international calendar was not compiled Contributed and participated in statistical development and international conferences Hosted 8 international statistics agencies Aligned Stats SA's work programme to the UNSC programme Implemented resolutions of the UNSC to align to international best practice
Compiled and continuously updated the international events calendar Participated and contributed in statistical development and international conferences Implemented resolutions of the UNSC to align with international best practice
Compiled events calendar updated with events as they became known Participated and contributed in statistical development and international conferences No UNSC resolutions were received for implementation for the year
Update international events calendar in line with the multi-year work programme of the United Nations Statistics Commission Statistical practice in Stats SA aligned to international best practice Implement resolutions of the UNSC to align with international best practice
Coordinate international collaboration and partnerships Improve by: Developing a
framework for hosting international events
Developing an international engagement framework
Coordinate international collaboration and partnerships Improve by: Implementing
frameworks for the international programme
Developing guidelines for bilateral and multilateral collaboration
Developing an international statistical best practice benchmarking framework
Coordinate international collaboration and partnerships Improve by: Implementing
guidelines for bilateral and multilateral relations
Develop an international programmes communication strategy
Implementing international statistical best practice benchmarking framework
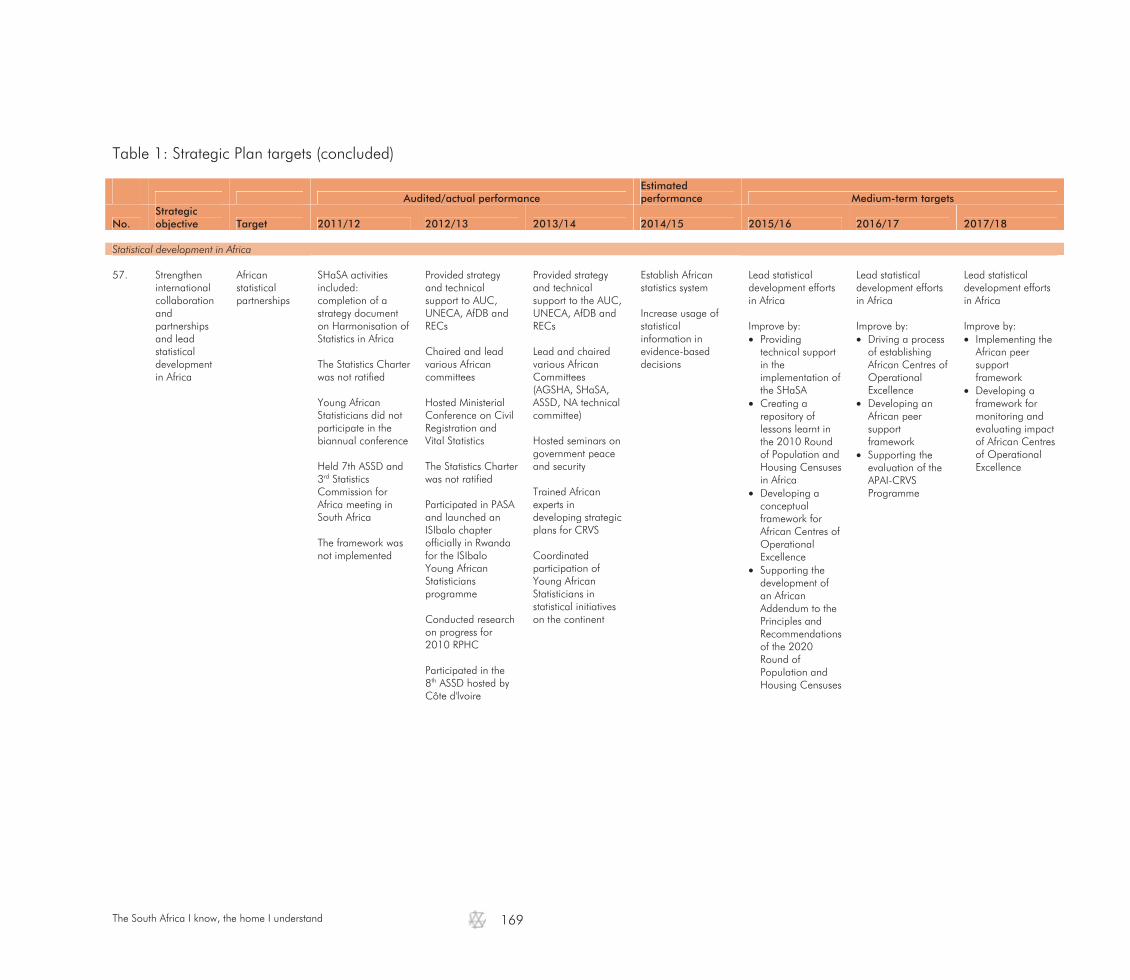
The South Africa I know, the home I understand
169
Table 1: Strategic Plan targets (concluded)
Audited/actual performance
Estimated performance Medium-term targets
No. Strategic objective Target 2011/12 2012/13 2013/14 2014/15 2015/16 2016/17 2017/18
Statistical development in Africa 57. Strengthen
international collaboration and partnerships and lead statistical development in Africa
African statistical partnerships
SHaSA activities included: completion of a strategy document on Harmonisation of Statistics in Africa The Statistics Charter was not ratified Young African Statisticians did not participate in the biannual conference Held 7th ASSD and 3rd Statistics Commission for Africa meeting in South Africa The framework was not implemented
Provided strategy and technical support to AUC, UNECA, AfDB and RECs Chaired and lead various African committees Hosted Ministerial Conference on Civil Registration and Vital Statistics The Statistics Charter was not ratified Participated in PASA and launched an ISIbalo chapter officially in Rwanda for the ISIbalo Young African Statisticians programme Conducted research on progress for 2010 RPHC Participated in the 8th ASSD hosted by Côte d'lvoire
Provided strategy and technical support to the AUC, UNECA, AfDB and RECs Lead and chaired various African Committees (AGSHA, SHaSA, ASSD, NA technical committee) Hosted seminars on government peace and security Trained African experts in developing strategic plans for CRVS Coordinated participation of Young African Statisticians in statistical initiatives on the continent
Establish African statistics system Increase usage of statistical information in evidence-based decisions
Lead statistical development efforts in Africa Improve by: Providing
technical support in the implementation of the SHaSA
Creating a repository of lessons learnt in the 2010 Round of Population and Housing Censuses in Africa
Developing a conceptual framework for African Centres of Operational Excellence
Supporting the development of an African Addendum to the Principles and Recommendations of the 2020 Round of Population and Housing Censuses
Lead statistical development efforts in Africa Improve by: Driving a process
of establishing African Centres of Operational Excellence
Developing an African peer support framework
Supporting the evaluation of the APAI-CRVS Programme
Lead statistical development efforts in Africa Improve by: Implementing the
African peer support framework
Developing a framework for monitoring and evaluating impact of African Centres of Operational Excellence
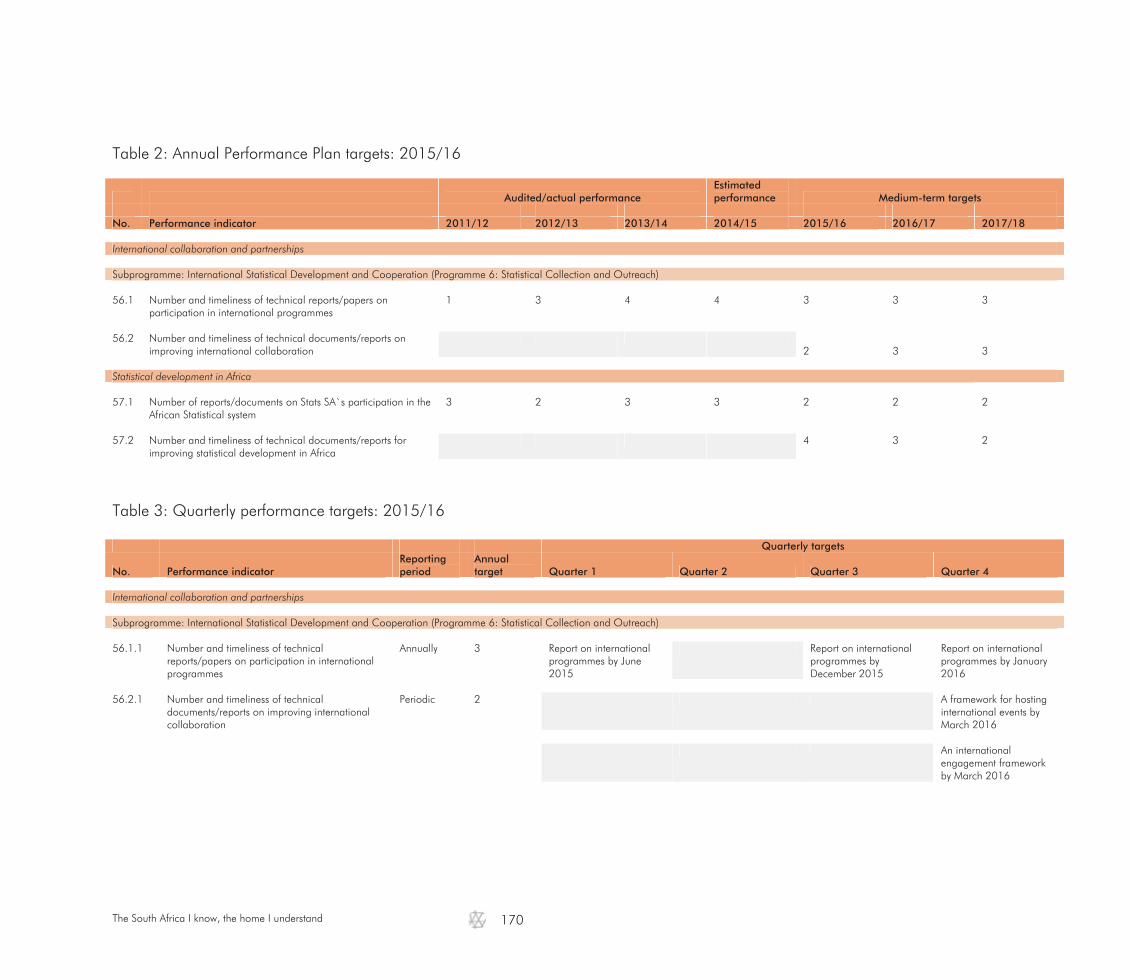
The South Africa I know, the home I understand
170
Table 2: Annual Performance Plan targets: 2015/16
Audited/actual performance Estimated performance Medium-term targets
No. Performance indicator 2011/12 2012/13 2013/14 2014/15 2015/16 2016/17 2017/18 International collaboration and partnerships
Subprogramme: International Statistical Development and Cooperation (Programme 6: Statistical Collection and Outreach) 56.1 Number and timeliness of technical reports/papers on
participation in international programmes 1 3 4 4 3 3 3
56.2 Number and timeliness of technical documents/reports on
improving international collaboration
2 3 3 Statistical development in Africa 57.1 Number of reports/documents on Stats SA`s participation in the
African Statistical system 3 2 3 3 2 2 2
57.2 Number and timeliness of technical documents/reports for
improving statistical development in Africa 4 3 2
Table 3: Quarterly performance targets: 2015/16
Quarterly targets
No. Performance indicator Reporting period
Annual target Quarter 1 Quarter 2 Quarter 3 Quarter 4
International collaboration and partnerships
Subprogramme: International Statistical Development and Cooperation (Programme 6: Statistical Collection and Outreach) 56.1.1 Number and timeliness of technical
reports/papers on participation in international programmes
Annually 3 Report on international programmes by June 2015
Report on international programmes by December 2015
Report on international programmes by January 2016
56.2.1 Number and timeliness of technical
documents/reports on improving international collaboration
Periodic 2 A framework for hosting international events by March 2016
An international
engagement framework by March 2016
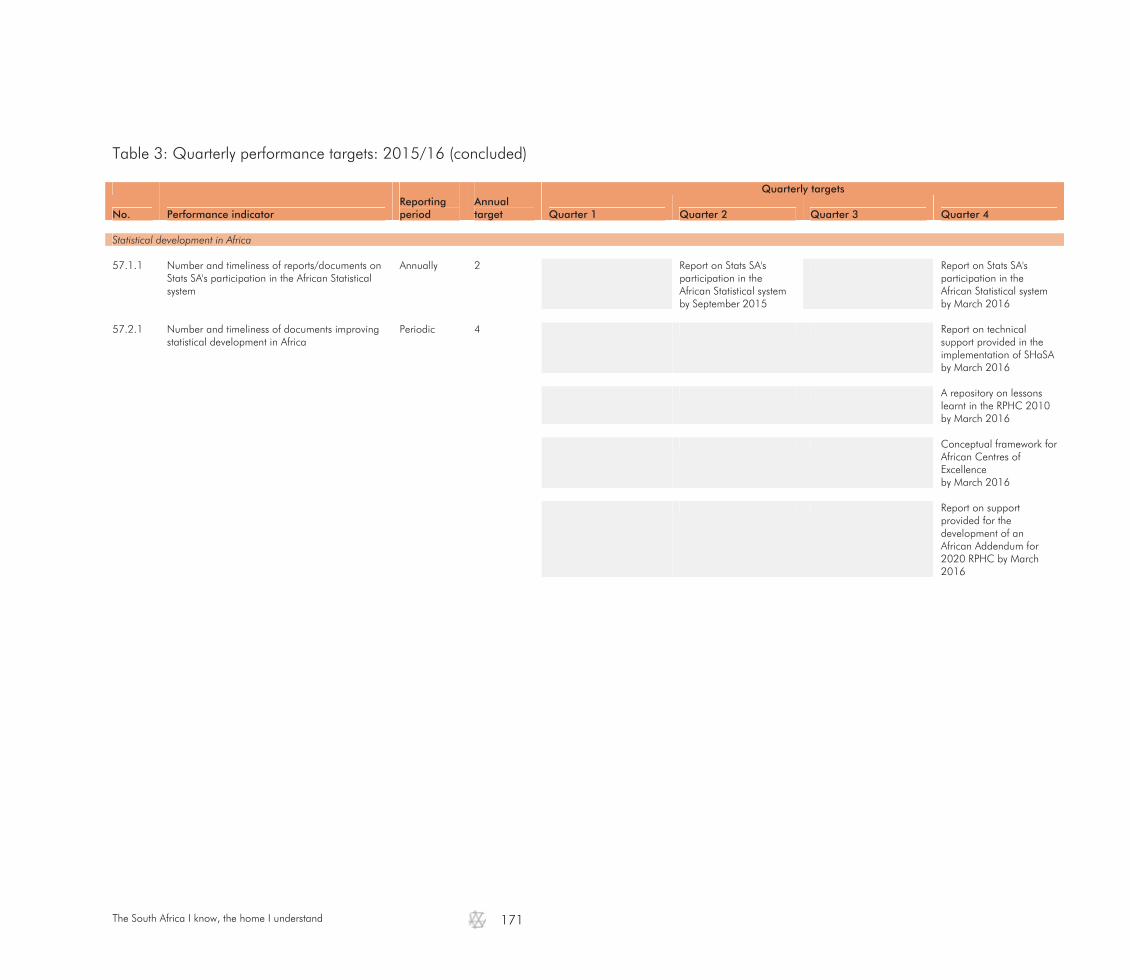
The South Africa I know, the home I understand
171
Table 3: Quarterly performance targets: 2015/16 (concluded)
Quarterly targets
No. Performance indicator Reporting period
Annual target Quarter 1 Quarter 2 Quarter 3 Quarter 4
Statistical development in Africa 57.1.1 Number and timeliness of reports/documents on
Stats SA's participation in the African Statistical system
Annually 2 Report on Stats SA's participation in the African Statistical system by September 2015
Report on Stats SA's participation in the African Statistical system by March 2016
57.2.1 Number and timeliness of documents improving
statistical development in Africa Periodic 4 Report on technical
support provided in the implementation of SHaSA by March 2016
A repository on lessons
learnt in the RPHC 2010 by March 2016
Conceptual framework for
African Centres of Excellence by March 2016
Report on support
provided for the development of an African Addendum for 2020 RPHC by March 2016


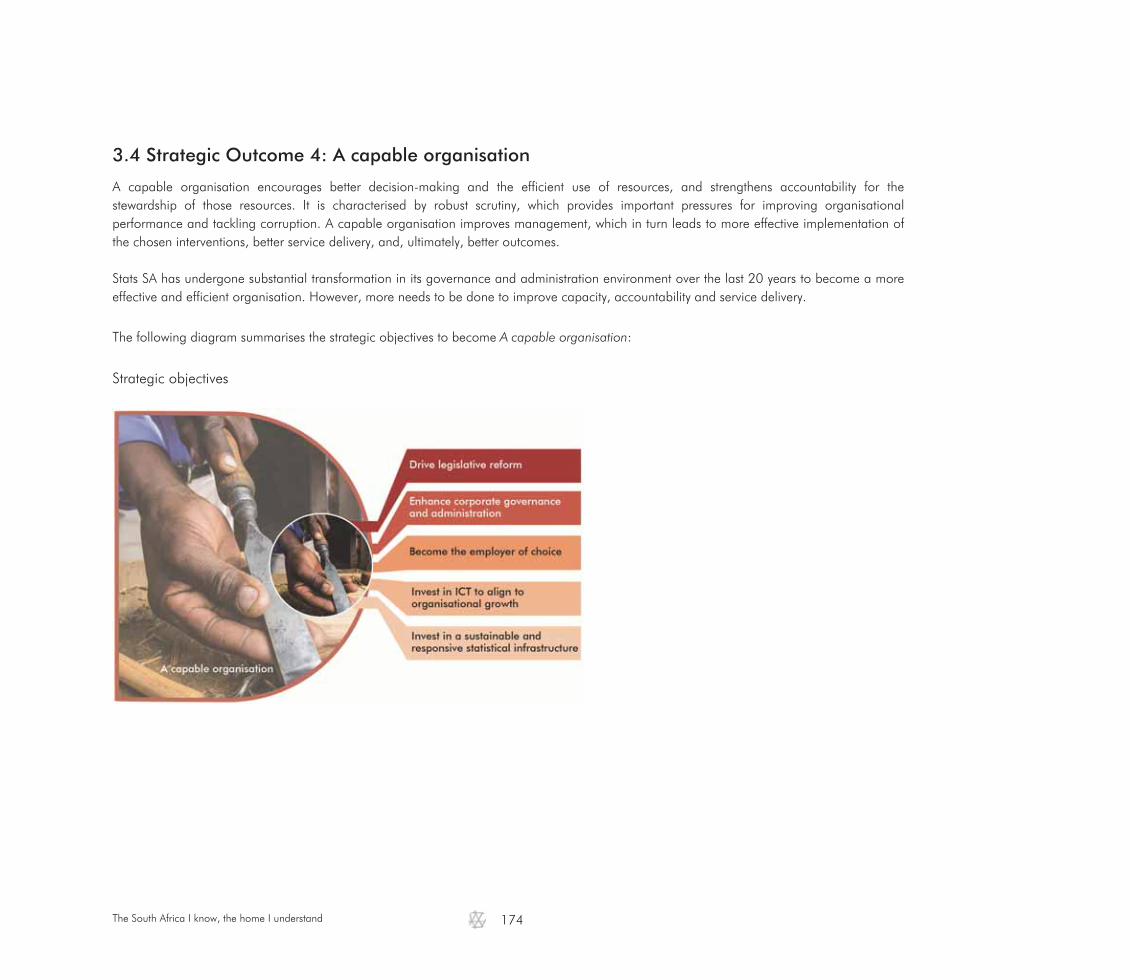
The South Africa I know, the home I understand
174
3.4 Strategic Outcome 4: A capable organisation A capable organisation encourages better decision-making and the efficient use of resources, and strengthens accountability for the stewardship of those resources. It is characterised by robust scrutiny, which provides important pressures for improving organisational performance and tackling corruption. A capable organisation improves management, which in turn leads to more effective implementation of the chosen interventions, better service delivery, and, ultimately, better outcomes. Stats SA has undergone substantial transformation in its governance and administration environment over the last 20 years to become a more effective and efficient organisation. However, more needs to be done to improve capacity, accountability and service delivery.
The following diagram summarises the strategic objectives to become A capable organisation:
Strategic objectives
The South Africa I know, the home I understand
175
3.4.1 Legislative reform
Strategic objective 4.1: To drive legislative reform of the statistical production and coordination environment Objective statement: Drive statistical reform that strengthens statistical production and coordination among organs of state through
facilitating the amendment of the Statistics Legislation by 2017 and the implementation thereof Baseline: Number of legislative documents: Draft policy document Justification: This objective will contribute to Stats SA driving a strategic change agenda for improving statistical coordination
in South Africa Links: This objective links to the Fundamental Principles of Official Statistics and the African Charter for Statistics
(Act No. 6 of 1999) Official statistics in South Africa has national, continental and international audiences and must, therefore, meet international norms and standards. The Statistics Act as it stands now has gone a long way in advancing South African official statistics in the country and globally. However, there are areas in the Act that fall short in the provisions for the effective coordination of official statistics, and amendments to the Act aim to remedy such identified weaknesses. Creating strategic and sustainable change in the statistics environment will require a change in statistics legislation. Amendment of the Statistics Act is a strategic enabler to drive the statistical reform that is required to transform the coordination of the national statistics system in South Africa. The following tables outline the strategic, annual and quarterly performance plan targets for the driving of legislative reform of the statistical production and coordination environment:
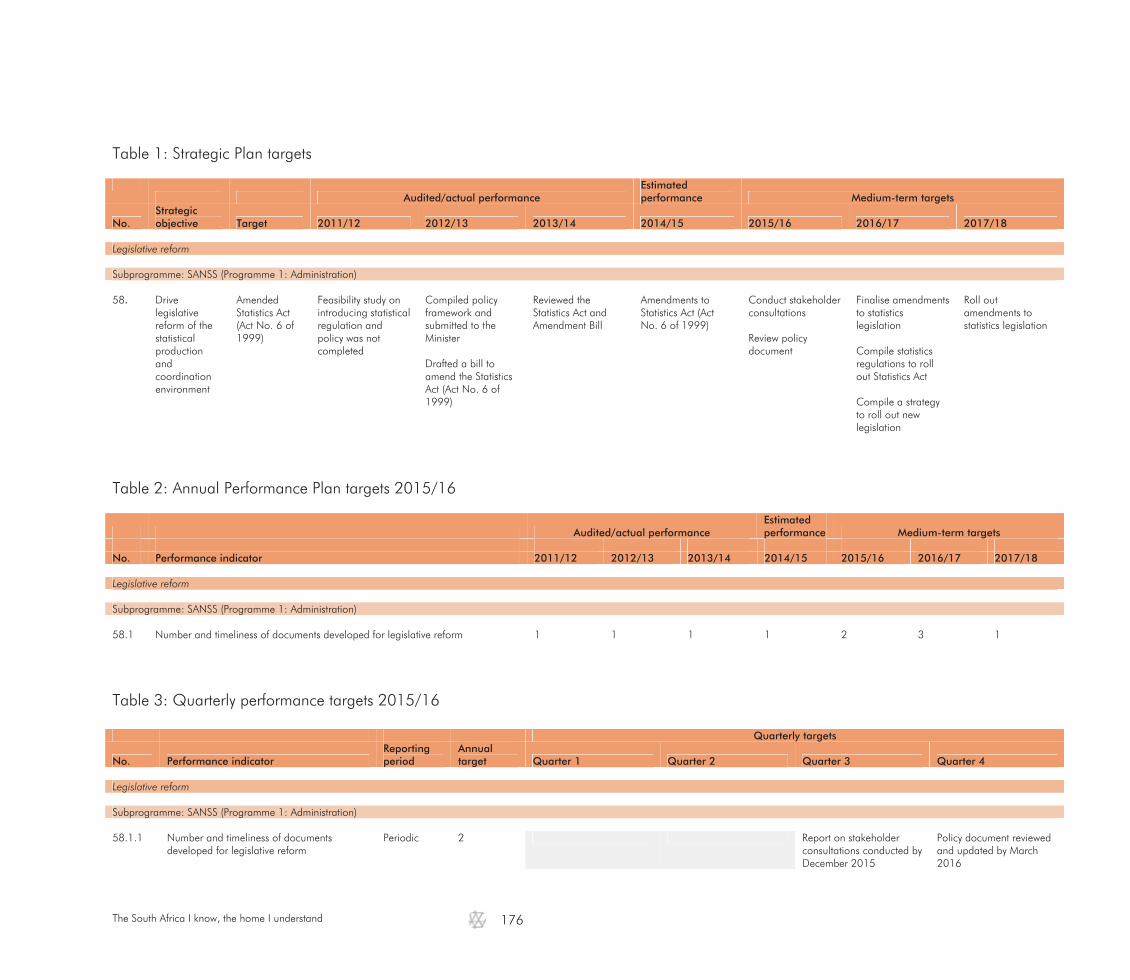
The South Africa I know, the home I understand
176
Table 1: Strategic Plan targets
Audited/actual performance
Estimated performance Medium-term targets
No. Strategic objective Target 2011/12 2012/13 2013/14 2014/15 2015/16 2016/17 2017/18
Legislative reform Subprogramme: SANSS (Programme 1: Administration) 58. Drive
legislative reform of the statistical production and coordination environment
Amended Statistics Act (Act No. 6 of 1999)
Feasibility study on introducing statistical regulation and policy was not completed
Compiled policy framework and submitted to the Minister Drafted a bill to amend the Statistics Act (Act No. 6 of 1999)
Reviewed the Statistics Act and Amendment Bill
Amendments to Statistics Act (Act No. 6 of 1999)
Conduct stakeholder consultations Review policy document
Finalise amendments to statistics legislation Compile statistics regulations to roll out Statistics Act Compile a strategy to roll out new legislation
Roll out amendments to statistics legislation
Table 2: Annual Performance Plan targets 2015/16
Audited/actual performance Estimated performance Medium-term targets
No. Performance indicator 2011/12 2012/13 2013/14 2014/15 2015/16 2016/17 2017/18 Legislative reform Subprogramme: SANSS (Programme 1: Administration) 58.1 Number and timeliness of documents developed for legislative reform 1 1 1 1 2 3 1
Table 3: Quarterly performance targets 2015/16
Quarterly targets
No. Performance indicator Reporting period
Annual target Quarter 1 Quarter 2 Quarter 3 Quarter 4
Legislative reform Subprogramme: SANSS (Programme 1: Administration) 58.1.1 Number and timeliness of documents
developed for legislative reform Periodic 2 Report on stakeholder
consultations conducted by December 2015
Policy document reviewed and updated by March 2016
The South Africa I know, the home I understand
177
3.4.2 Corporate governance and administration Strategic objective 4.2: To enhance corporate governance and administration Objective statement: Enhance corporate governance and administration through increasing the effectiveness of management and
operations systems, strengthening accountability and creating a conducive working environment Baseline: Unqualified audit (financial and performance information) Justification: This objective will contribute to Stats SA becoming a capable organisation with the relevant systems, policies and
management practices in place to support achieving the mandate of the organisation Links: This objective links to the NDP and MTSF
Good governance and administration can promote and accelerate organisational development and growth. Current established structures, processes and systems managed to earn Stats SA an unqualified audit over the past few years, and the organisation intends to build on this strength.
Government will place greater emphasis on longer-term planning and efficient resource allocation. There will be a comprehensive assessment of baseline estimates for 2017/18, emphasising value for money and alignment with policy priorities. Capital injections for state-owned companies will be allocated without impacting on the budget deficit over the next two years, and on the condition that a sound business plan is in place. In order to reduce the budget deficit from 4,1 per cent this year to 2,5 per cent over the next three years, the expenditure ceiling will be lowered by R10 billion in 2015/16 and R15 billion in 2016/17. To effect the lower ceiling, national government will freeze budgets of non-essential goods and services at 2014/15 levels; withdraw funding for posts that have been vacant for some time; and reduce the rate of growth of transfers to public entities, particularly those with cash reserves (MTBPS: 2014). Across national departments, planned expenditure on travel and subsistence, conference venues and catering has been cut. Advertising and communications budgets have been reduced. Allocations for consultant services have been capped. These steps will contribute savings of about R1,3 billion over the next two years. As government, we acknowledge that we too must provide value for money. Although most government spending is effectively managed, there are many opportunities to cut or minimise costs and stop abuse. In these difficult times, Cabinet has decided to take a number of initiatives that will apply to both members of Cabinet and to officials in national, provincial and local governments. This will include state entities and state-owned enterprises. To achieve value for money, we need improvements in financial management right across all spheres of government. We have to see much better accountability and discipline in the stewardship of public resources, as the current wasteful expenditure is unacceptable (MTBPS: 2014). The following tables outline the strategic, annual and quarterly performance plan targets for governance and administration:

The South Africa I know, the home I understand
178
Table 1: Strategic Plan targets
Audited/actual performance
Estimated performance Medium-term targets
No. Strategic objective Target 2011/12 2012/13 2013/14 2014/15 2015/16 2016/17 2017/18
Strategic planning, reporting and monitoring Subprogramme: Strategy (Programme 1: Administration) 59. Enhance
corporate governance and administration
Tabled Work Programme, Annual Report and submitted quarterly reports to the Minister, Treasury, the Statistics Council and the Audit Committee
Improved management of organisational performance Tabled Work Programme, Annual Report and submitted quarterly reports to the Minister, Treasury, the Statistics Council and the Audit Committee
Improved management of organisational performance through better alignment and compilation of Minister's summary report Tabled Work Programme, Annual Report and submitted quarterly reports to the Minister, Treasury, the Statistics Council and the Audit Committee
Presented integrated performance report to Exco on strategic and organisational performance, including risk management Tabled Work Programme, Annual Report and submitted quarterly reports to the Minister, Treasury, DPME, the Statistics Council and the Audit Committee
Goals and milestones as set out in Strategic Plan and Work Programme achieved Compile end-of-term report on implementation of strategic direction
Publish strategic planning and reporting documents Enhance strategic management by: Communicating
the strategic direction to staff
Publish strategic planning and reporting documents Enhance strategic management by: Developing an
evaluation framework
Publish strategic planning and reporting documents Enhance strategic management by: Conducting a
mid-term strategic review to assess performance
Programme and project management Subprogramme: Programme Office (Programme 1: Administration) 60. Enhance
corporate governance and administration
Stats SA clusters empowered in operational planning and reporting Monthly integrated information provided to management Staff trained/capacity built in project management
Compiled and provided monthly integrated programme and project management information The monthly integrated management information reports were submitted to Exco and SMS Trained 277 Census 2011 staff members in project management
Compiled and provided monthly integrated programme and project management information to Exco and SMS Trained 71 staff members in project management Provided project management support to Census 2011 dissemination, new building, collaborative mapping and ISIbalo Institute project
Successfully launched Radikopantsha (management information repository) portal Trained 46 staff in project management Completed assessment for Project Management course for the National Certificate in Official Statistics Provided project management support to 8 priority projects
Enhance monthly integrated programme and project management information Build capacity and provide project management support to a priority project of Stats SA
Build programme and project management capability and provide integrated management information Improve programme and project management by: Enhancing
management information repository (functionality)
Providing project management support to CS2016
Build programme and project management capability and provide integrated management information Improve programme and project management by: Enhancing
management information repository (functionality)
Providing project management support to CS2016
Build programme and project management capability and provide integrated management information Improve programme and project management by: Enhancing
management information (project/ operational level)
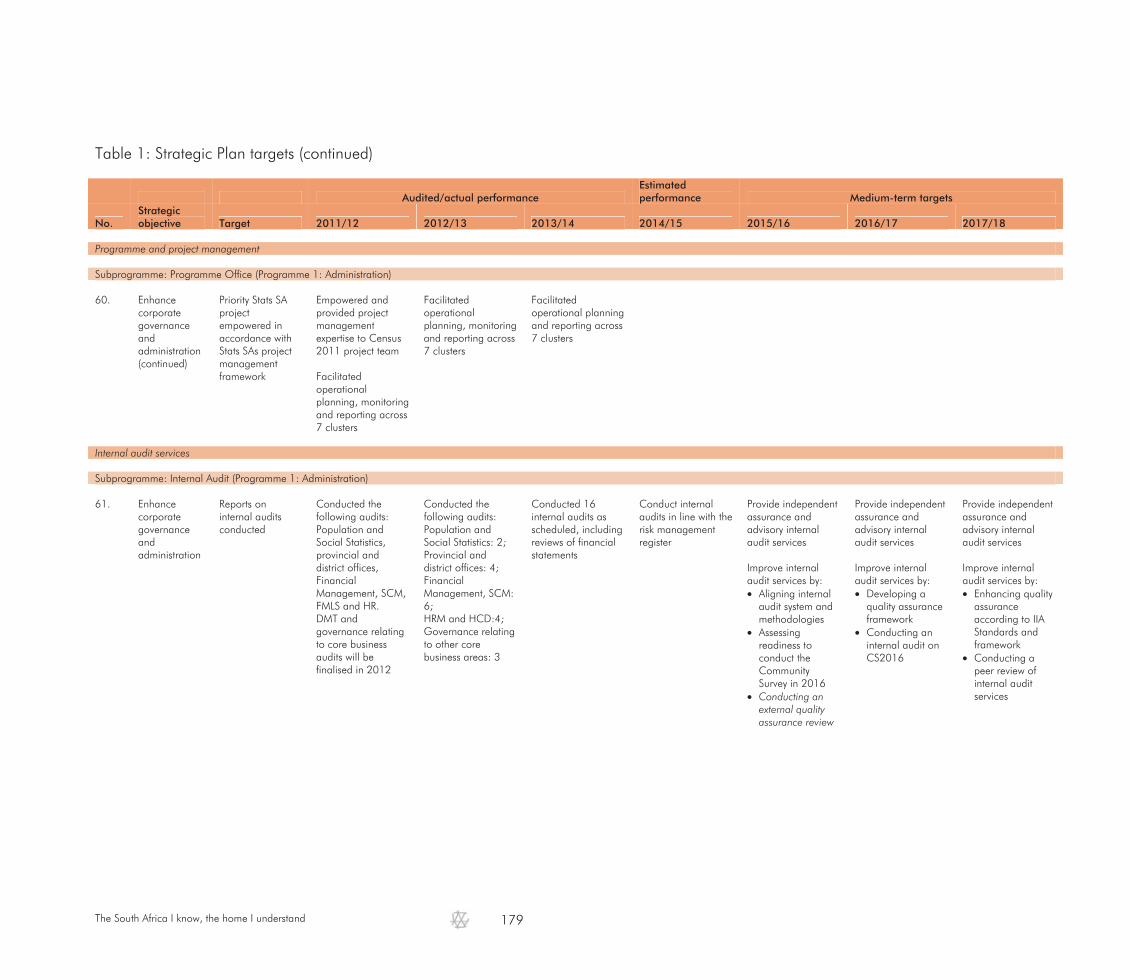
The South Africa I know, the home I understand
179
Table 1: Strategic Plan targets (continued)
Audited/actual performance
Estimated performance Medium-term targets
No. Strategic objective Target 2011/12 2012/13 2013/14 2014/15 2015/16 2016/17 2017/18
Programme and project management Subprogramme: Programme Office (Programme 1: Administration) 60. Enhance
corporate governance and administration (continued)
Priority Stats SA project empowered in accordance with Stats SAs project management framework
Empowered and provided project management expertise to Census 2011 project team Facilitated operational planning, monitoring and reporting across 7 clusters
Facilitated operational planning, monitoring and reporting across 7 clusters
Facilitated operational planning and reporting across 7 clusters
Internal audit services Subprogramme: Internal Audit (Programme 1: Administration) 61. Enhance
corporate governance and administration
Reports on internal audits conducted
Conducted the following audits: Population and Social Statistics, provincial and district offices, Financial Management, SCM, FMLS and HR. DMT and governance relating to core business audits will be finalised in 2012
Conducted the following audits: Population and Social Statistics: 2; Provincial and district offices: 4; Financial Management, SCM: 6; HRM and HCD:4; Governance relating to other core business areas: 3
Conducted 16 internal audits as scheduled, including reviews of financial statements
Conduct internal audits in line with the risk management register
Provide independent assurance and advisory internal audit services Improve internal audit services by: Aligning internal
audit system and methodologies
Assessing readiness to conduct the Community Survey in 2016
Conducting an external quality assurance review
Provide independent assurance and advisory internal audit services Improve internal audit services by: Developing a
quality assurance framework
Conducting an internal audit on CS2016
Provide independent assurance and advisory internal audit services Improve internal audit services by: Enhancing quality
assurance according to IIA Standards and framework
Conducting a peer review of internal audit services

The South Africa I know, the home I understand
180
Table 1: Strategic Plan targets (continued)
Audited/actual performance
Estimated performance Medium-term targets
No. Strategic objective Target 2011/12 2012/13 2013/14 2014/15 2015/16 2016/17 2017/18
Governance, risk and compliance Subprogramme: Corporate Governance (Programme 1: Administration) 62. Enhance
corporate governance and administration
Unqualified audit Compiled and presented quarterly risk reports and top 10 organisational risks to the Risk Management Steering Committee, Audit Committee and Exco Submitted report on incidence of fraud to Exco and OPSC Developed mitigating strategies and action plans to address strategic risks
Compiled and presented improved quarterly risk reports and top 10 organisational risks to the Risk Management Steering Committee, Audit Committee and Exco Monitored top strategic risks monthly. The Risk Unit, Steering Committee and Exco closely monitored key strategic and operational risks relating to census
Reviewed and aligned risk policies, framework and processes to best practice Strategic risks regularly monitored by the Risk Management Steering Committee
Unqualified audit based on good governance Monitor strategic risks
Provide governance, legal, risk management, investigations and compliance services Improve accountability by: Compiling a
compliance plan Compiling a
governance programme
Embedding risk management in planning and decision-making processes (strategic risk register)
Re-engineering investigation processes (fraud prevention plan)
Provide governance, legal, risk management, investigations and compliance services Improve accountability by: Reviewing
compliance plan Reviewing the
governance programme
Strengthening the risk identification and assessment process
Provide governance, legal, risk management, investigations and compliance services Improve accountability by: Embedding
constitutional values into governance practices
Strengthening the risk management culture to enhance risk accountability
Building a resilient anti-corruption environment
Financial administration and management Subprogramme: Financial Administration (Programme 1: Administration) 63. Enhance
corporate governance and administration
Unqualified audit Improved financial processes, systems and controls in preparation for Census 2011 Paid 26 610 Census 2011 fieldwork supervisors and 106 130 fieldworkers
Implemented the accounts payable approach from August 2012 for the payment of supplier accounts Improved turnaround times in delivery and sourcing of quotations, including provinces
Documented and mapped SCM processes to ensure effectiveness and efficiency Interventions were introduced for the payroll certificate compliance which increased compliance by 21,75%
Unqualified audit based on sound financial management and administrative systems Improve productivity through monitoring decentralised functions
Provide financial, supply chain and asset management services Enhance financial management and administration by: Developing and
implementing an asset disposal strategy for the move to the new building
Provide financial, supply chain and asset management services Enhance financial management and administration by: Implementing an
asset disposal strategy for the move to the new building
Provide financial, supply chain and asset management services Enhance financial management and administration by: Researching e-
procurement and e-payroll certification
Implementing the audit progress monitoring system

The South Africa I know, the home I understand
181
Table 1: Strategic Plan targets (continued)
Audited/actual performance
Estimated performance Medium-term targets
No. Strategic objective Target 2011/12 2012/13 2013/14 2014/15 2015/16 2016/17 2017/18
Financial administration and management Subprogramme: Financial administration (Programme 1: Administration) 63. Enhance
corporate governance and administration (continued)
Unqualified audit Submitted biannual financial statements to the Auditor-General and National Treasury and biannual tax reconciliation to SARS as scheduled Integrated demand management plan and acquisition plan was not compiled Improved turnaround times of procurement services Compiled asset reports, management cash flows and submitted to PFAS as scheduled Submitted MTEF, ENE, AENE, monthly EWS reports and the Annual Financial Statements, monthly IYS and Minister's report as scheduled
Submitted MTEF, ENE, AENE, monthly EWS reports and the Annual Financial Statements, monthly IYM and Minister's report as scheduled
Compiled a consolidated demand management plan planning No further decentralisation took place Submit MTEF, ENE, AENE, monthly IYM reports and the Annual Financial Statements as scheduled
Providing financial administration support to CS2016
Developing specifications to modernise financial business processes
Providing financial administration support to CS2016
Testing the audit progress monitoring system
Researching a financial strategy for the SANSS
Testing digital filing system
Drafting a financial strategy for the SANSS

The South Africa I know, the home I understand
182
Table 1: Strategic Plan targets (continued)
Audited/actual performance
Estimated performance Medium-term targets
No. Strategic objective Target 2011/12 2012/13 2013/14 2014/15 2015/16 2016/17 2017/18
Human resource management systems Subprogramme: Human Resource Management (Programme 1: Administration) 64. Enhance
corporate governance and administration
Timely and effective human resource management services
Appointed 26 241 listers, 120 861 fieldworkers, 17 245 supervisors, 1 048 data processors, 1 075 PES fieldworkers and supervisors Handled 46 misconducts and 19 grievances Deployment of public services staff (e.g. teachers) to survey operations as national footprint was not done Expanded organisational structure to implement the SANSS
Recruited in accordance with requirements of Census 2011 Deployed staff to Census 2011 for specified periods to areas where capacity was required, to ensure that Census 2011 was a success Organisational structure was not finalised
Established a national field collection footprint Deployed 2 staff members to work on the social statistics subsystem The organisational structure was approved by the Minister in June 2013
Employer of choice Review organisational structure for effectiveness
Provide efficient client-based human resource services Enhance human resource management by: Reviewing
standard operating procedures and management controls
Aligning the structure to the new strategy
Reviewing manual HRM processes to be computerised
Redeployment of staff affected by the new building
Providing HRM support to CS2016
Provide efficient client-based human resource services Enhance human resource management by: Implementing
revised standard operating procedures and management controls
Developing HRM systems specifications
Identifying staff affected by the organisational strategy
Providing HRM support to CS2016
Provide efficient client-based human resource services Enhance human resource management by: Introducing client
satisfaction survey
Piloting and testing HRM systems
Redeployment of staff affected by technology

The South Africa I know, the home I understand
183
Table 1: Strategic Plan targets (concluded)
Audited/actual performance
Estimated performance Medium-term targets
No. Strategic objective Target 2011/12 2012/13 2013/14 2014/15 2015/16 2016/17 2017/18
Safe and enabling work environment Subprogramme: Facilities Management, Logistics and Security (Programme 1: Administration) 65. Enhance
corporate governance and administration
Timely and efficient logistical, travel and fleet services
Implemented subsidised vehicle system as part of the integrated fieldwork strategy Improved turnaround time of fleet and logistical services Provided fleet, security and logistical support to Census 2011 Provided 7 500 vehicles for Census 2011, signed lease agreements for 63 offices but cancelled 6, and conducted 74 security appraisals Conducted audits on OHSA and completed screening and vetting of Stats SA employees Finalised design of the new building, approved feasibility study on Salvokop and agreement for NZASM was signed with DPW.
Closed down census operations in districts and satellite offices Construction of the new building did not commence
Stats SA entered into a contract for the utilisation of G-fleet to maintain a cost-effective fleet service. The use of travel agency systems has increased efficiency of travel services Closed down census operations in districts and satellite offices Treasury approval (TA111) was issued to Stats SA in March 2014 and the financial close is scheduled for April 2014 The move to the new building has been delayed
Optimal logistical, fleet and travel services meeting user needs in a timely manner Construction of the new building continues
Provide a secure, safe and healthy working environment. Provide efficient logistical services Enhance facility, security and logistics management by: Developing a records management policy and file master plan Developing
security classification mechanisms
Monitoring the construction of the new building
Preparing the organisation for the new environment
Providing logistical services to CS2016
Provide a secure, safe and healthy working environment. Provide efficient logistical services Enhance facility, security and logistics management by: Implementing a functional records management and registry services Establishing and
implementing the security classification system
Relocating Stats SA's head office to new premises
Rolling out post-relocation programme
Providing logistical services to CS 2016
Provide a secure, safe and healthy working environment. Provide efficient logistical services Enhance facility, security and logistics management by: Implementing the
security classification system
Rolling out a Safety, Health Environment, Risk and Quality (SHERQ) programme
Implementing PPP service level agreement
Assessing office accommodation of provincial and district offices

The South Africa I know, the home I understand
184
Table 2: Annual Performance Plan targets: 2015/16
Audited/actual performance Estimated performance Medium-term targets
No. Performance indicator 2011/12 2012/13 2013/14 2014/15 2015/16 2016/17 2017/18 Strategic planning, reporting and monitoring Subprogramme: Strategy (Programme 1: Administration) 59.1 Number and timeliness of strategic planning and reporting documents and reports 6 6 6 8 11 11 11 59.2 Number of technical documents/reports on improving strategic management 1 1 1 Programme and project management Subprogramme: Programme Office (Programme 1: Administration) 60.1 Number and timeliness of monthly integrated management information reports 12 12 12 12 12 12 12 60.2 Number of clusters empowered in operational planning and reporting 7 7 7 8 8 8 8 60.3 Number of staff members trained in project management 277 71 46 20 20 20 20 60.4 Number of projects empowered in accordance with Stats SA's project
management framework 1 4 8 1 1 1 1
60.5 Number of technical documents/reports on improving programme and project
management 1 1 1
Internal audit services Subprogramme: Internal Audit (Programme 1: Administration) 61.1 Number of internal audits conducted and approved by the Audit Committee
(As per approved international audit coverage plan) 20 19 6 22 22 22 22
61.2 Number of technical documents/reports on improving internal audit services 3 2 2 Governance, risk and compliance Subprogramme: Corporate Governance (Programme 1: Administration) 62.1 Number of policies reviewed and approved 6 4 4 4 4 4 4 62.2 Number of reports on Corporate Governance to Exco, Risk Management Steering
Committee(RMSC) and Audit Committee (AC) 10 10 10 11 4 4 4
62.3 Percentage of fraud and corruption cases investigated 90% 90% 90% 80% 80% 80% 62.4 Percentage of loss and damage cases investigated 75% 75% 75% 62.5 Percentage of legal and civil litigation matters attended to 69 cases 100% 80% 80% 80% 80% 80% 62.6 Number of technical documents/reports on improving corporate governance 4 3 3
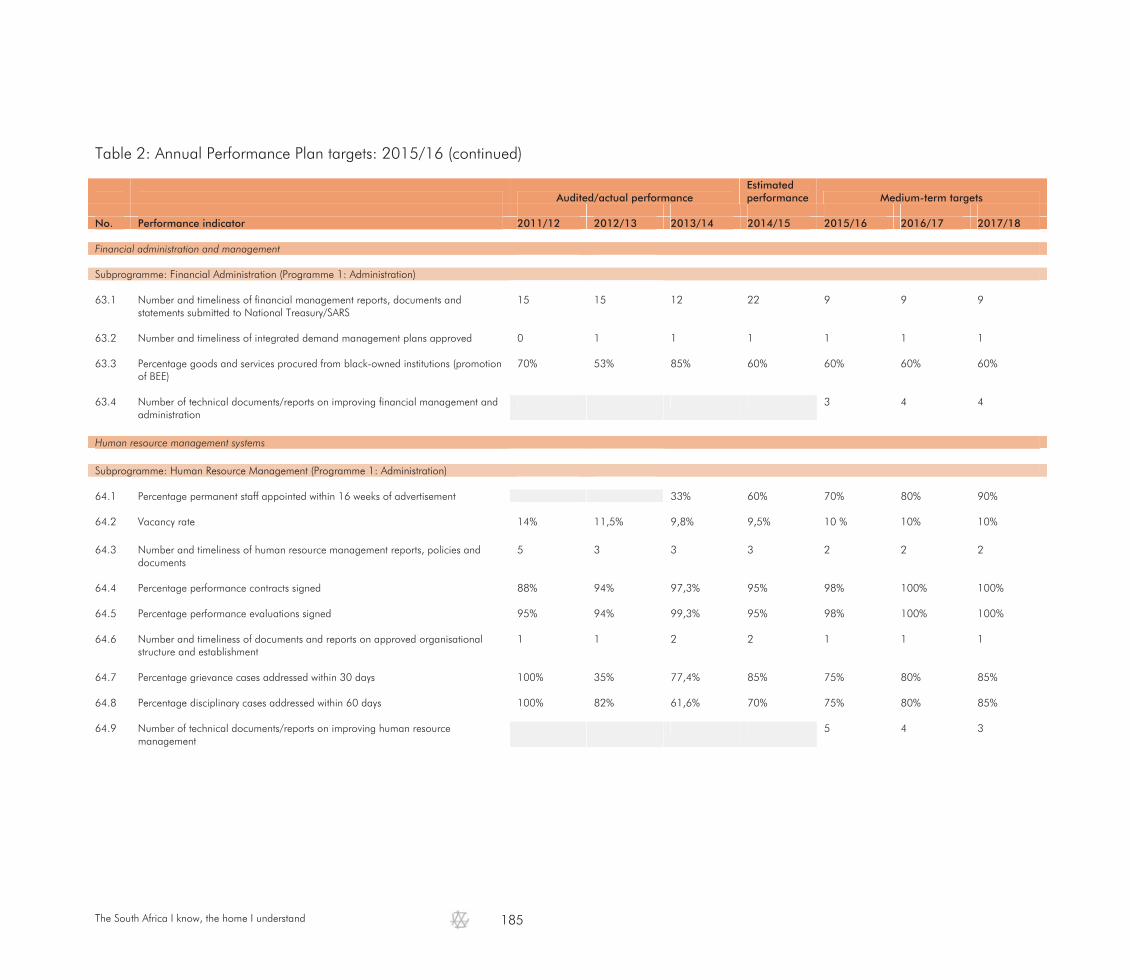
The South Africa I know, the home I understand
185
Table 2: Annual Performance Plan targets: 2015/16 (continued)
Audited/actual performance Estimated performance Medium-term targets
No. Performance indicator 2011/12 2012/13 2013/14 2014/15 2015/16 2016/17 2017/18 Financial administration and management Subprogramme: Financial Administration (Programme 1: Administration) 63.1 Number and timeliness of financial management reports, documents and
statements submitted to National Treasury/SARS 15 15 12 22 9 9 9
63.2 Number and timeliness of integrated demand management plans approved 0 1 1 1 1 1 1 63.3 Percentage goods and services procured from black-owned institutions (promotion
of BEE) 70% 53% 85% 60% 60% 60% 60%
63.4 Number of technical documents/reports on improving financial management and
administration 3 4 4
Human resource management systems Subprogramme: Human Resource Management (Programme 1: Administration) 64.1 Percentage permanent staff appointed within 16 weeks of advertisement 33% 60% 70% 80% 90% 64.2 Vacancy rate 14% 11,5% 9,8% 9,5% 10 % 10% 10% 64.3 Number and timeliness of human resource management reports, policies and
documents 5 3 3 3 2 2 2
64.4 Percentage performance contracts signed 88% 94% 97,3% 95% 98% 100% 100% 64.5 Percentage performance evaluations signed 95% 94% 99,3% 95% 98% 100% 100% 64.6 Number and timeliness of documents and reports on approved organisational
structure and establishment 1 1 2 2 1 1 1
64.7 Percentage grievance cases addressed within 30 days 100% 35% 77,4% 85% 75% 80% 85% 64.8 Percentage disciplinary cases addressed within 60 days 100% 82% 61,6% 70% 75% 80% 85% 64.9 Number of technical documents/reports on improving human resource
management 5 4 3
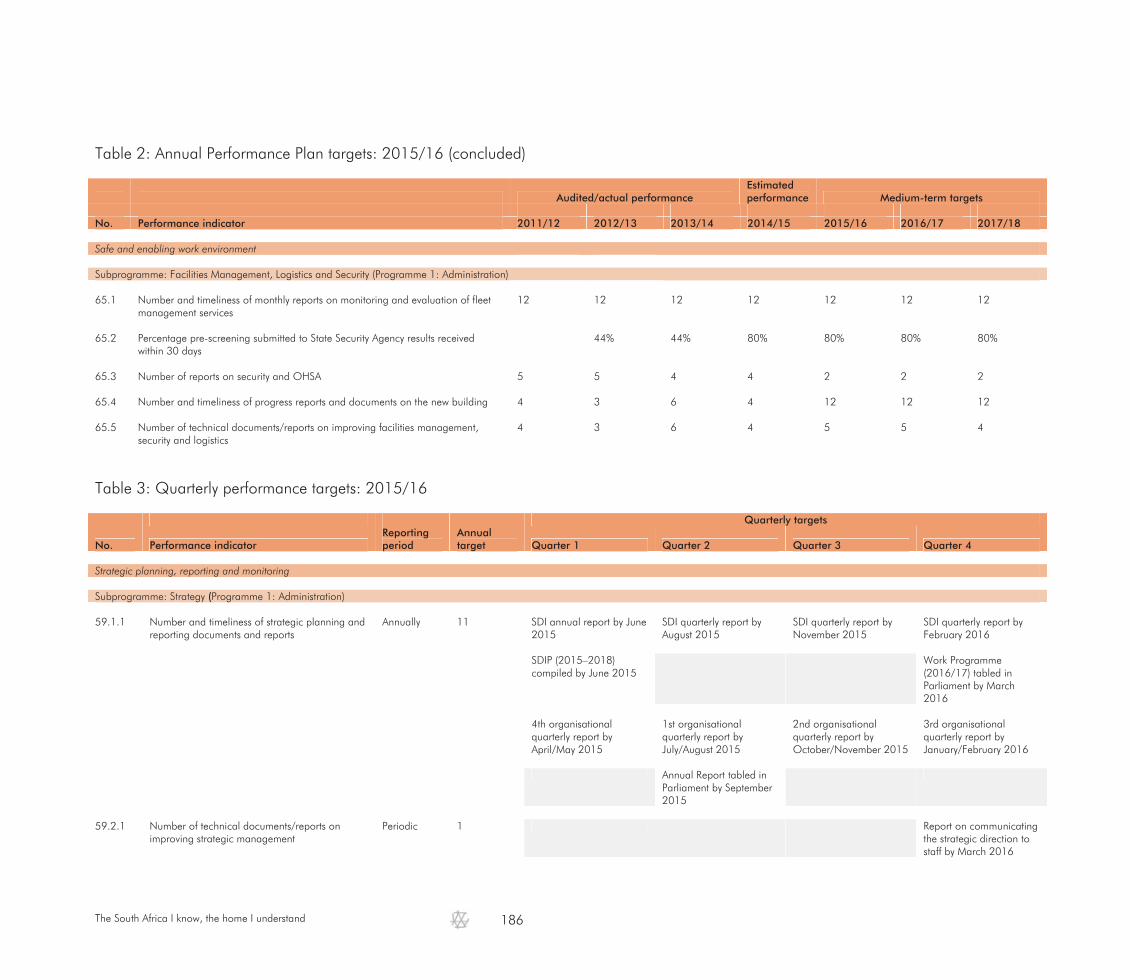
The South Africa I know, the home I understand
186
Table 2: Annual Performance Plan targets: 2015/16 (concluded)
Audited/actual performance Estimated performance Medium-term targets
No. Performance indicator 2011/12 2012/13 2013/14 2014/15 2015/16 2016/17 2017/18 Safe and enabling work environment Subprogramme: Facilities Management, Logistics and Security (Programme 1: Administration) 65.1 Number and timeliness of monthly reports on monitoring and evaluation of fleet
management services 12 12 12 12 12 12 12
65.2 Percentage pre-screening submitted to State Security Agency results received
within 30 days 44% 44% 80% 80% 80% 80%
65.3 Number of reports on security and OHSA 5 5 4 4 2 2 2 65.4 Number and timeliness of progress reports and documents on the new building 4 3 6 4 12 12 12 65.5 Number of technical documents/reports on improving facilities management,
security and logistics 4 3 6 4 5 5 4
Table 3: Quarterly performance targets: 2015/16
Quarterly targets
No. Performance indicator Reporting period
Annual target Quarter 1 Quarter 2 Quarter 3 Quarter 4
Strategic planning, reporting and monitoring Subprogramme: Strategy (Programme 1: Administration) 59.1.1 Number and timeliness of strategic planning and
reporting documents and reports Annually
11 SDI annual report by June 2015
SDI quarterly report by August 2015
SDI quarterly report by November 2015
SDI quarterly report by February 2016
SDIP (2015–2018)
compiled by June 2015 Work Programme
(2016/17) tabled in Parliament by March 2016
4th organisational
quarterly report by April/May 2015
1st organisational quarterly report by July/August 2015
2nd organisational quarterly report by October/November 2015
3rd organisational quarterly report by January/February 2016
Annual Report tabled in
Parliament by September 2015
59.2.1 Number of technical documents/reports on
improving strategic management Periodic 1 Report on communicating
the strategic direction to staff by March 2016
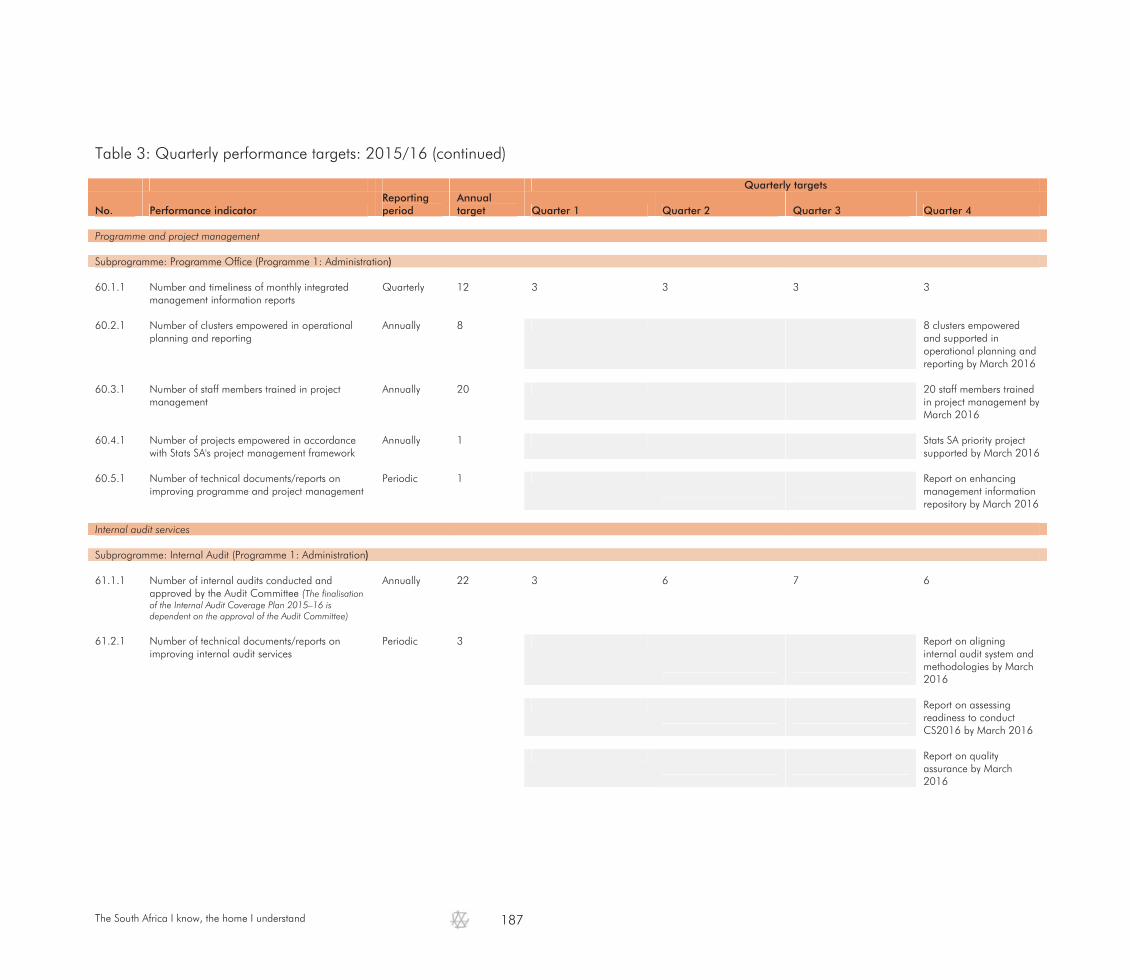
The South Africa I know, the home I understand
187
Table 3: Quarterly performance targets: 2015/16 (continued)
Quarterly targets
No. Performance indicator Reporting period
Annual target Quarter 1 Quarter 2 Quarter 3 Quarter 4
Programme and project management Subprogramme: Programme Office (Programme 1: Administration) 60.1.1 Number and timeliness of monthly integrated
management information reports Quarterly 12 3 3 3 3
60.2.1 Number of clusters empowered in operational
planning and reporting Annually 8 8 clusters empowered
and supported in operational planning and reporting by March 2016
60.3.1 Number of staff members trained in project
management Annually 20
20 staff members trained in project management by March 2016
60.4.1 Number of projects empowered in accordance
with Stats SA's project management framework Annually 1 Stats SA priority project
supported by March 2016 60.5.1 Number of technical documents/reports on
improving programme and project management Periodic 1
Report on enhancing management information repository by March 2016
Internal audit services Subprogramme: Internal Audit (Programme 1: Administration) 61.1.1 Number of internal audits conducted and
approved by the Audit Committee (The finalisation of the Internal Audit Coverage Plan 2015–16 is dependent on the approval of the Audit Committee)
Annually 22 3 6 7 6
61.2.1 Number of technical documents/reports on
improving internal audit services Periodic 3
Report on aligning internal audit system and methodologies by March 2016
Report on assessing readiness to conduct CS2016 by March 2016
Report on quality assurance by March 2016

The South Africa I know, the home I understand
188
Table 3: Quarterly performance targets: 2015/16 (continued)
Quarterly targets
No. Performance indicator Reporting period
Annual target Quarter 1 Quarter 2 Quarter 3 Quarter 4
Governance, risk and compliance Subprogramme: Corporate Governance (Programme 1: Administration) 62.1.1 Number and timeliness of policies reviewed and
approved Quarterly 4 1 1 1 1
62.2.1 Number and timeliness of reports on Corporate
Governance to Exco, Risk Management Steering Committee(RMSC) and Audit Committee (AC)
Quarterly 4 1 1 1 1
62.3.1 Percentage of fraud and corruption cases
investigated Annually 80% 80%
62.4.1 Percentage of loss and damage cases
investigated Annually 75% 75%
62.5.1 Percentage of legal and civil litigation matters
attended to Annually 80% 80%
62.6.1 Number of technical documents/reports on
improving corporate governance Periodic 4
Compliance plan by March 2016
Governance programme by March 2016
Strategic risk register by March 2016
Fraud prevention plan by March 2016
Financial administration and management Subprogramme: Financial Administration (Programme 1: Administration) 63.1.1 Number and timeliness of financial management
reports and documents submitted to National Treasury/SARS
Annually 3 Medium Term Expenditure Framework (MTEF) estimates by July 2015
Adjusted Estimates of National Expenditure (AENE) by October 2015
Estimates of National Expenditure (ENE) by December 2015
63.1.2 Number and timeliness of financial accounting
tax reconciliation statements Biannually 2 Submission of biannual
tax reconciliation to SARS by May 2015
Submission of biannual tax reconciliation to SARS by October 2015

The South Africa I know, the home I understand
189
Table 3: Quarterly performance targets: 2015/16 (continued)
Quarterly targets
No. Performance indicator Reporting period
Annual target Quarter 1 Quarter 2 Quarter 3 Quarter 4
Financial administration and management Subprogramme: Financial Administration (Programme 1: Administration) 63.1.3 Number and timeliness of financial statements Quarterly 3
1 set of interim financial statements to the National Treasury by July 2015
1 set of interim financial statements to the National Treasury by October 2015
1 set of interim financial statements to the National Treasury by January 2016
63.1.4 Number and timeliness of annual financial
statements Annually 1 1 set of annual financial
statements to the National Treasury and Auditor-General by May 2015
63.2.1 Number and timeliness of integrated demand
management plans approved Annually 1 Integrated demand
management plan by March 2016
63.3.1 Percentage goods and services procured from
black-owned institutions (promoting BEE) Quarterly 60% 60% 60% 60% 60%
63.4.1 Number of technical documents/reports on
improving financial management and administration
Periodic 3
Asset disposal strategy for the move to the new building by March 2016
Report on financial administration support to CS2016 by March 2016
Specifications to modernise financial business processes by March 2016
Human resource management systems Subprogramme: Human Resource Management (Programme 1: Administration) 64.1.1 Percentage permanent staff appointed within 16
weeks of advertisement Annually
70% 70%
64.2.1 Vacancy rate (permanent)
Annually
10% 10%
64.3.1 Number and timeliness of human resource
management reports, policies and documents Annually
2
HRM Strategic Plan by August 2015
Employment Equity report by September 2015
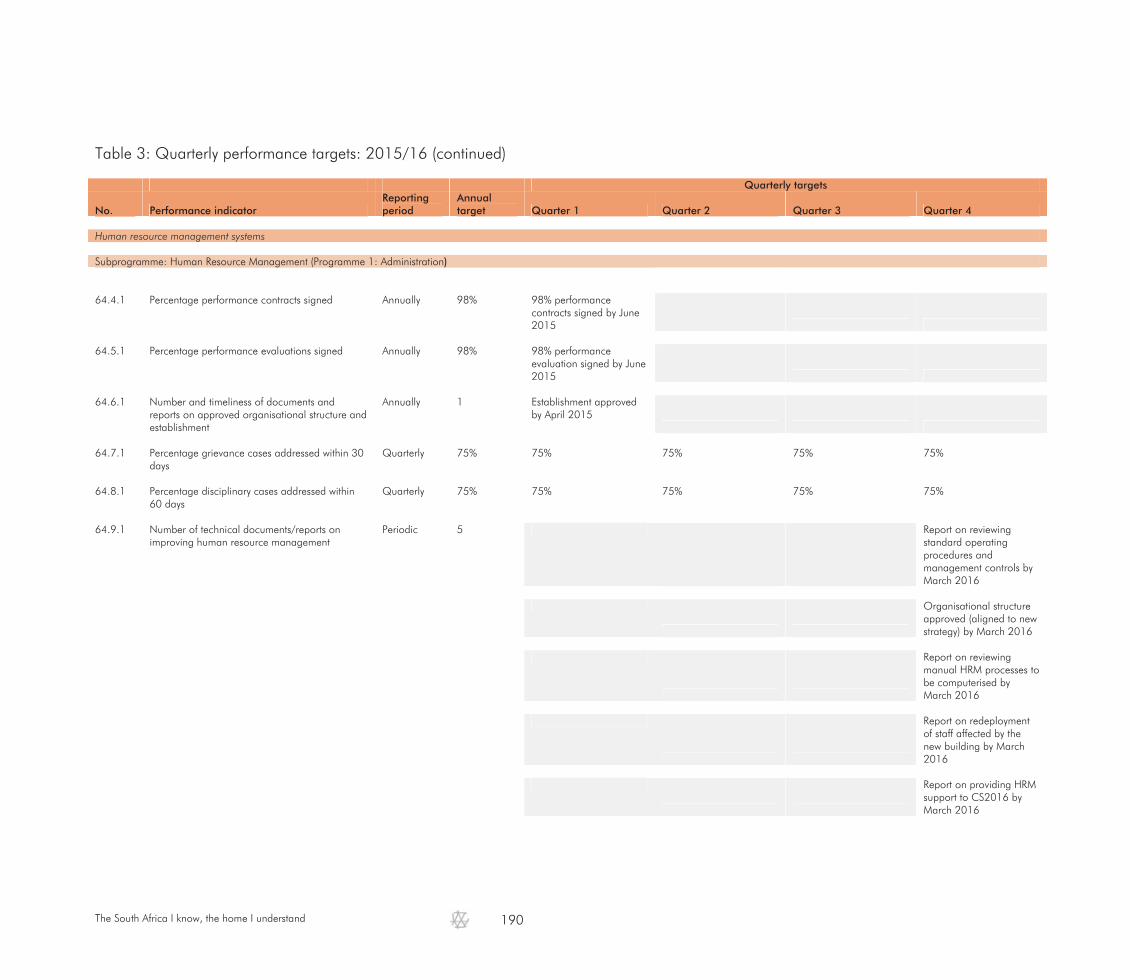
The South Africa I know, the home I understand
190
Table 3: Quarterly performance targets: 2015/16 (continued)
Quarterly targets
No. Performance indicator Reporting period
Annual target Quarter 1 Quarter 2 Quarter 3 Quarter 4
Human resource management systems Subprogramme: Human Resource Management (Programme 1: Administration) 64.4.1 Percentage performance contracts signed
Annually
98%
98% performance contracts signed by June 2015
64.5.1 Percentage performance evaluations signed
Annually
98%
98% performance evaluation signed by June 2015
64.6.1 Number and timeliness of documents and
reports on approved organisational structure and establishment
Annually
1 Establishment approved by April 2015
64.7.1 Percentage grievance cases addressed within 30
days Quarterly
75%
75% 75% 75% 75%
64.8.1 Percentage disciplinary cases addressed within
60 days Quarterly 75% 75% 75% 75% 75%
64.9.1 Number of technical documents/reports on
improving human resource management Periodic 5
Report on reviewing standard operating procedures and management controls by March 2016
Organisational structure approved (aligned to new strategy) by March 2016
Report on reviewing manual HRM processes to be computerised by March 2016
Report on redeployment of staff affected by the new building by March 2016
Report on providing HRM support to CS2016 by March 2016
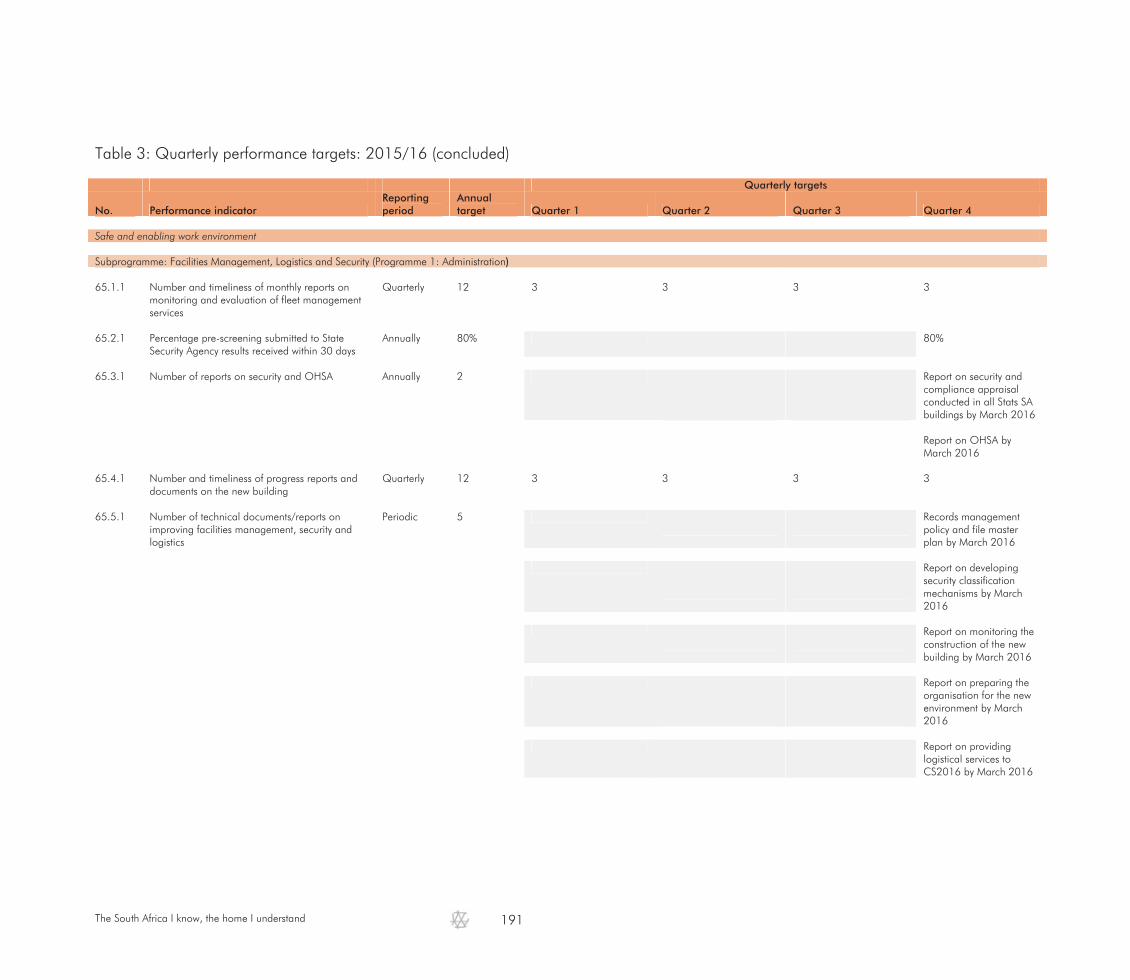
The South Africa I know, the home I understand
191
Table 3: Quarterly performance targets: 2015/16 (concluded)
Quarterly targets
No. Performance indicator Reporting period
Annual target Quarter 1 Quarter 2 Quarter 3 Quarter 4
Safe and enabling work environment Subprogramme: Facilities Management, Logistics and Security (Programme 1: Administration) 65.1.1 Number and timeliness of monthly reports on
monitoring and evaluation of fleet management services
Quarterly 12 3 3 3 3
65.2.1 Percentage pre-screening submitted to State
Security Agency results received within 30 days Annually 80%
80%
65.3.1 Number of reports on security and OHSA Annually 2
Report on security and compliance appraisal conducted in all Stats SA buildings by March 2016
Report on OHSA by March 2016
65.4.1 Number and timeliness of progress reports and
documents on the new building Quarterly 12 3 3 3 3
65.5.1 Number of technical documents/reports on
improving facilities management, security and logistics
Periodic 5
Records management policy and file master plan by March 2016
Report on developing security classification mechanisms by March 2016
Report on monitoring the construction of the new building by March 2016
Report on preparing the organisation for the new environment by March 2016
Report on providing logistical services to CS2016 by March 2016
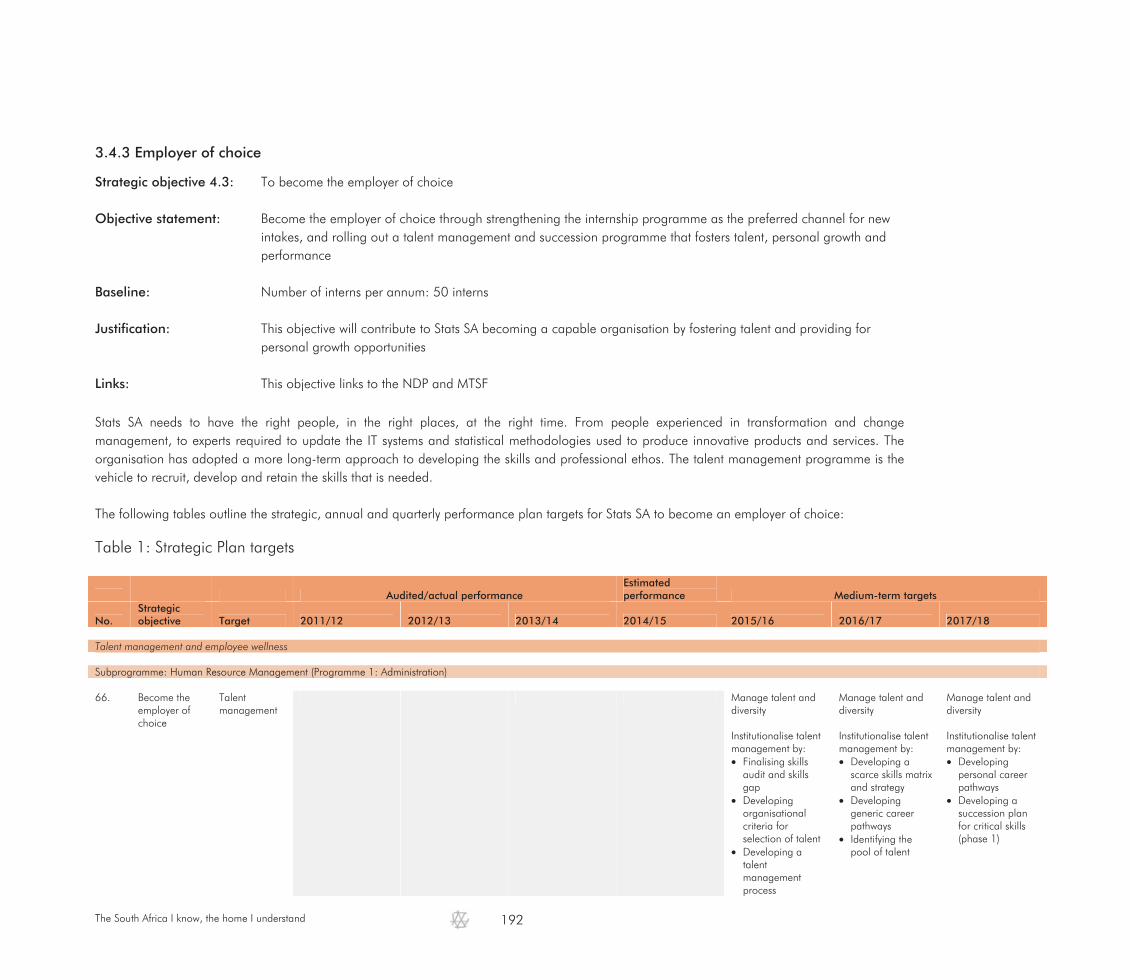
The South Africa I know, the home I understand
192
3.4.3 Employer of choice Strategic objective 4.3: To become the employer of choice Objective statement: Become the employer of choice through strengthening the internship programme as the preferred channel for new
intakes, and rolling out a talent management and succession programme that fosters talent, personal growth and performance
Baseline: Number of interns per annum: 50 interns Justification: This objective will contribute to Stats SA becoming a capable organisation by fostering talent and providing for
personal growth opportunities Links: This objective links to the NDP and MTSF Stats SA needs to have the right people, in the right places, at the right time. From people experienced in transformation and change management, to experts required to update the IT systems and statistical methodologies used to produce innovative products and services. The organisation has adopted a more long-term approach to developing the skills and professional ethos. The talent management programme is the vehicle to recruit, develop and retain the skills that is needed. The following tables outline the strategic, annual and quarterly performance plan targets for Stats SA to become an employer of choice:
Table 1: Strategic Plan targets
Audited/actual performance
Estimated performance Medium-term targets
No. Strategic objective Target 2011/12 2012/13 2013/14 2014/15 2015/16 2016/17 2017/18
Talent management and employee wellness Subprogramme: Human Resource Management (Programme 1: Administration) 66. Become the
employer of choice
Talent management
Manage talent and diversity Institutionalise talent management by: Finalising skills
audit and skills gap
Developing organisational criteria for selection of talent
Developing a talent management process
Manage talent and diversity Institutionalise talent management by: Developing a
scarce skills matrix and strategy
Developing generic career pathways
Identifying the pool of talent
Manage talent and diversity Institutionalise talent management by: Developing
personal career pathways
Developing a succession plan for critical skills (phase 1)

The South Africa I know, the home I understand
193
Table 2: Annual Performance Plan targets: 2015/16
Audited/actual performance Estimated performance Medium-term targets
No. Performance indicator 2011/12 2012/13 2013/14 2014/15 2015/16 2016/17 2017/18 Talent management and employee wellness Subprogramme: Human Resource Management (Programme 1: Administration) 66.1 Number and timeliness of reports to institutionalise talent management 3 3 2
Table 3: Quarterly performance targets: 2015/16
Quarterly targets
No. Performance indicator Reporting period
Annual target Quarter 1 Quarter 2 Quarter 3 Quarter 4
Talent management and employee wellness Subprogramme: Human Resource Management (Programme 1: Administration) 66.1.1 Number and timeliness of reports to
institutionalise talent management Periodic 3 Report on skills audit and
skills gap by March 2016 Report on organisational
criteria for selection of talent by March 2016
Report on a talent
management process by March 2016

The South Africa I know, the home I understand
194
3.4.4 Invest in ICT to align to organisational growth Strategic objective 4.4: Invest in ICT to align to organisational growth Objective statement: Invest in Information and Communication Technology (ICT) to align to organisational growth through stabilising the
ICT infrastructure, researching and testing new technology, and modernising business processes Baseline: Percentage ICT services delivered according to service delivery standards: 90% Justification: This objective will contribute to Stats SA becoming a capable organisation by using technology as a strategic
enabler to improve efficiency of statistical operations Links: This objective links to the NDP and MTSF
The ICT strategy aims to ensure that ICT becomes a strategic enabler in the production and management of statistical information. It addresses weaknesses in the current environment, but also provides for a stable, secure and reliable environment that keeps up with fast-changing technological developments. The business modernisation strategy outlines our plans to modernise business systems, as well as the underlying enterprise-wide infrastructure required to execute such a strategy. The move to the new building will be used as an opportunity to revisit current ICT infrastructure (introduction of Wi-Fi, Hot seats, use of own devices, etc.) to align to new demands and organisational growth. The following tables outline the strategic, annual and quarterly performance plan targets for investing in ICT:
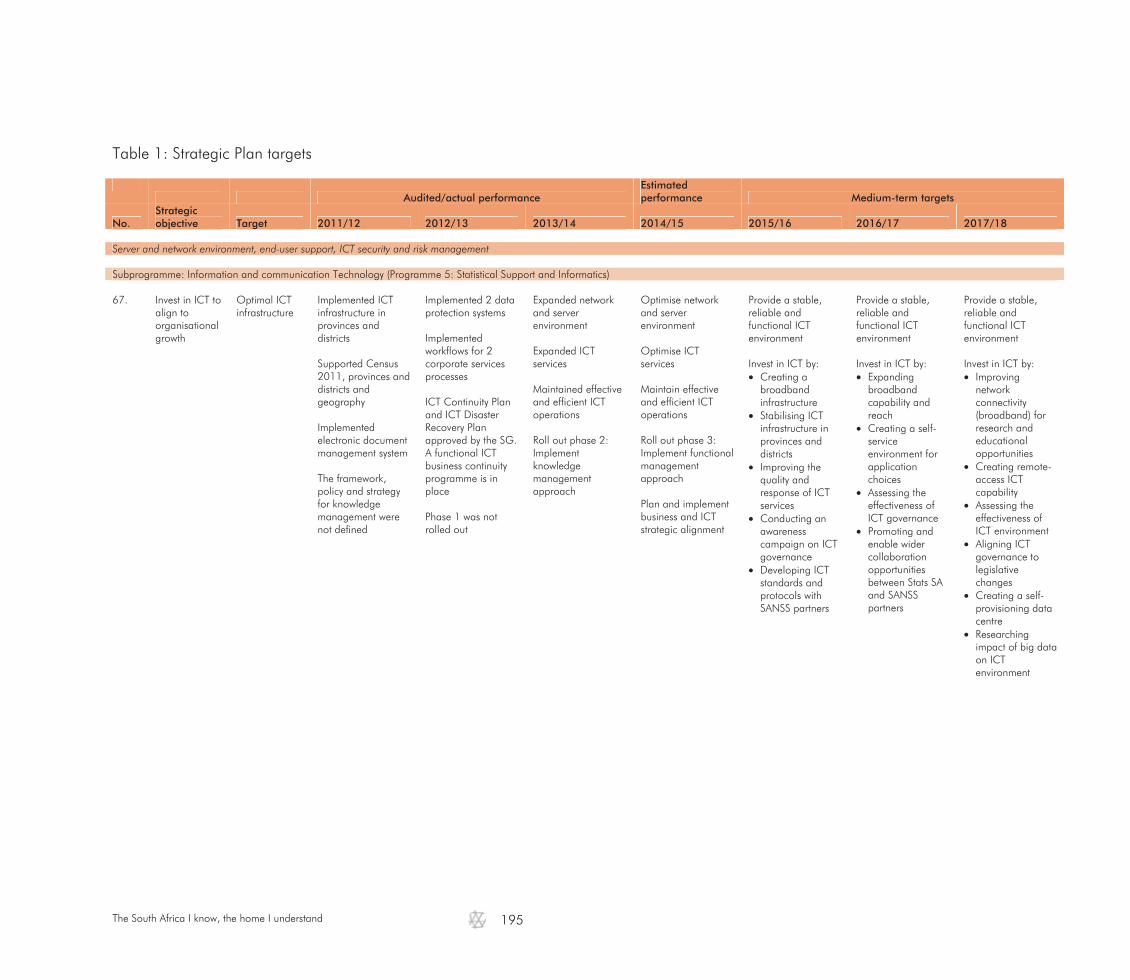
The South Africa I know, the home I understand
195
Table 1: Strategic Plan targets
Audited/actual performance
Estimated performance Medium-term targets
No. Strategic objective Target 2011/12 2012/13 2013/14 2014/15 2015/16 2016/17 2017/18
Server and network environment, end-user support, ICT security and risk management Subprogramme: Information and communication Technology (Programme 5: Statistical Support and Informatics) 67. Invest in ICT to
align to organisational growth
Optimal ICT infrastructure
Implemented ICT infrastructure in provinces and districts Supported Census 2011, provinces and districts and geography Implemented electronic document management system The framework, policy and strategy for knowledge management were not defined
Implemented 2 data protection systems Implemented workflows for 2 corporate services processes ICT Continuity Plan and ICT Disaster Recovery Plan approved by the SG. A functional ICT business continuity programme is in place Phase 1 was not rolled out
Expanded network and server environment Expanded ICT services Maintained effective and efficient ICT operations Roll out phase 2: Implement knowledge management approach
Optimise network and server environment Optimise ICT services Maintain effective and efficient ICT operations Roll out phase 3: Implement functional management approach Plan and implement business and ICT strategic alignment
Provide a stable, reliable and functional ICT environment Invest in ICT by: Creating a
broadband infrastructure
Stabilising ICT infrastructure in provinces and districts
Improving the quality and response of ICT services
Conducting an awareness campaign on ICT governance
Developing ICT standards and protocols with SANSS partners
Provide a stable, reliable and functional ICT environment Invest in ICT by: Expanding
broadband capability and reach
Creating a self-service environment for application choices
Assessing the effectiveness of ICT governance
Promoting and enable wider collaboration opportunities between Stats SA and SANSS partners
Provide a stable, reliable and functional ICT environment Invest in ICT by: Improving
network connectivity (broadband) for research and educational opportunities
Creating remote-access ICT capability
Assessing the effectiveness of ICT environment
Aligning ICT governance to legislative changes
Creating a self-provisioning data centre
Researching impact of big data on ICT environment
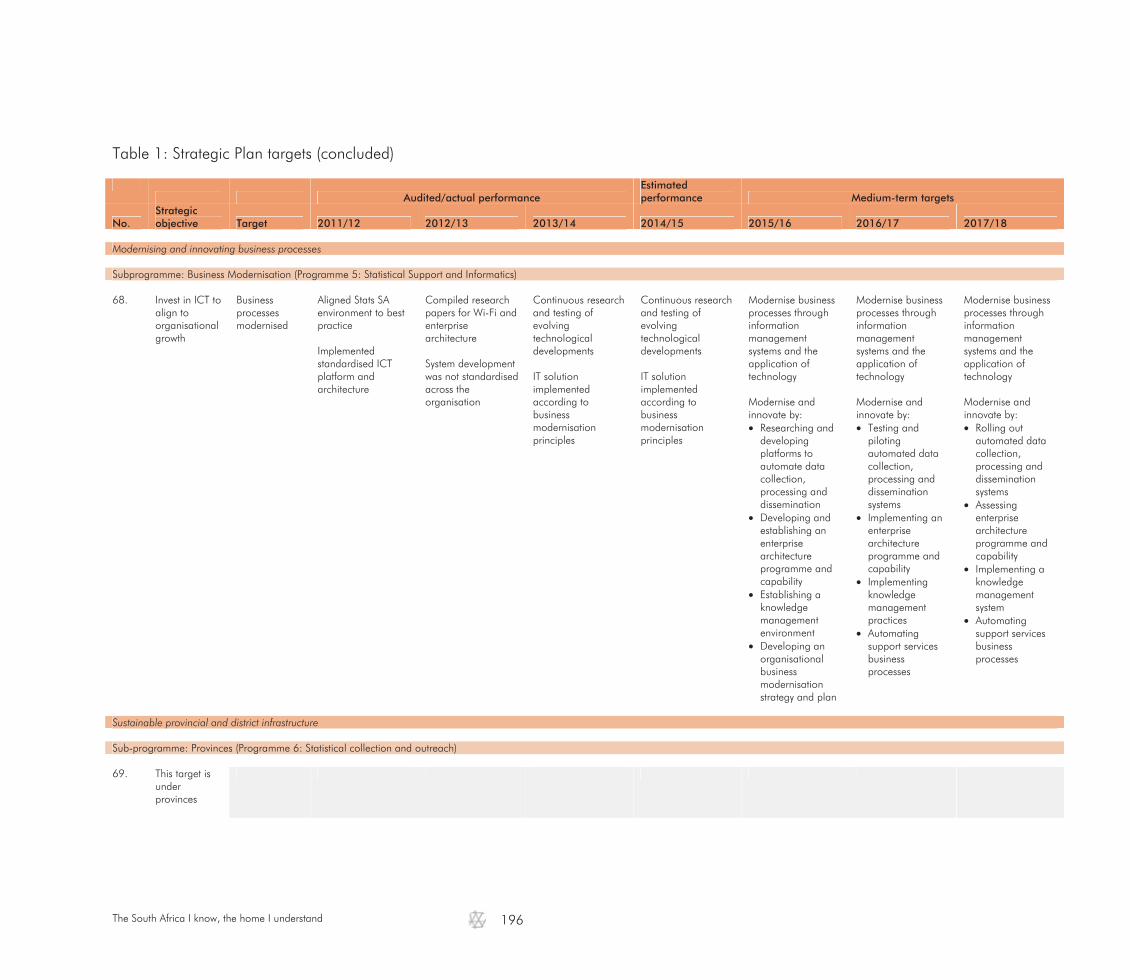
The South Africa I know, the home I understand
196
Table 1: Strategic Plan targets (concluded)
Audited/actual performance
Estimated performance Medium-term targets
No. Strategic objective Target 2011/12 2012/13 2013/14 2014/15 2015/16 2016/17 2017/18
Modernising and innovating business processes Subprogramme: Business Modernisation (Programme 5: Statistical Support and Informatics) 68. Invest in ICT to
align to organisational growth
Business processes modernised
Aligned Stats SA environment to best practice Implemented standardised ICT platform and architecture
Compiled research papers for Wi-Fi and enterprise architecture System development was not standardised across the organisation
Continuous research and testing of evolving technological developments IT solution implemented according to business modernisation principles
Continuous research and testing of evolving technological developments IT solution implemented according to business modernisation principles
Modernise business processes through information management systems and the application of technology Modernise and innovate by: Researching and
developing platforms to automate data collection, processing and dissemination
Developing and establishing an enterprise architecture programme and capability
Establishing a knowledge management environment
Developing an organisational business modernisation strategy and plan
Modernise business processes through information management systems and the application of technology Modernise and innovate by: Testing and
piloting automated data collection, processing and dissemination systems
Implementing an enterprise architecture programme and capability
Implementing knowledge management practices
Automating support services business processes
Modernise business processes through information management systems and the application of technology Modernise and innovate by: Rolling out
automated data collection, processing and dissemination systems
Assessing enterprise architecture programme and capability
Implementing a knowledge management system
Automating support services business processes
Sustainable provincial and district infrastructure Sub-programme: Provinces (Programme 6: Statistical collection and outreach) 69. This target is
under provinces
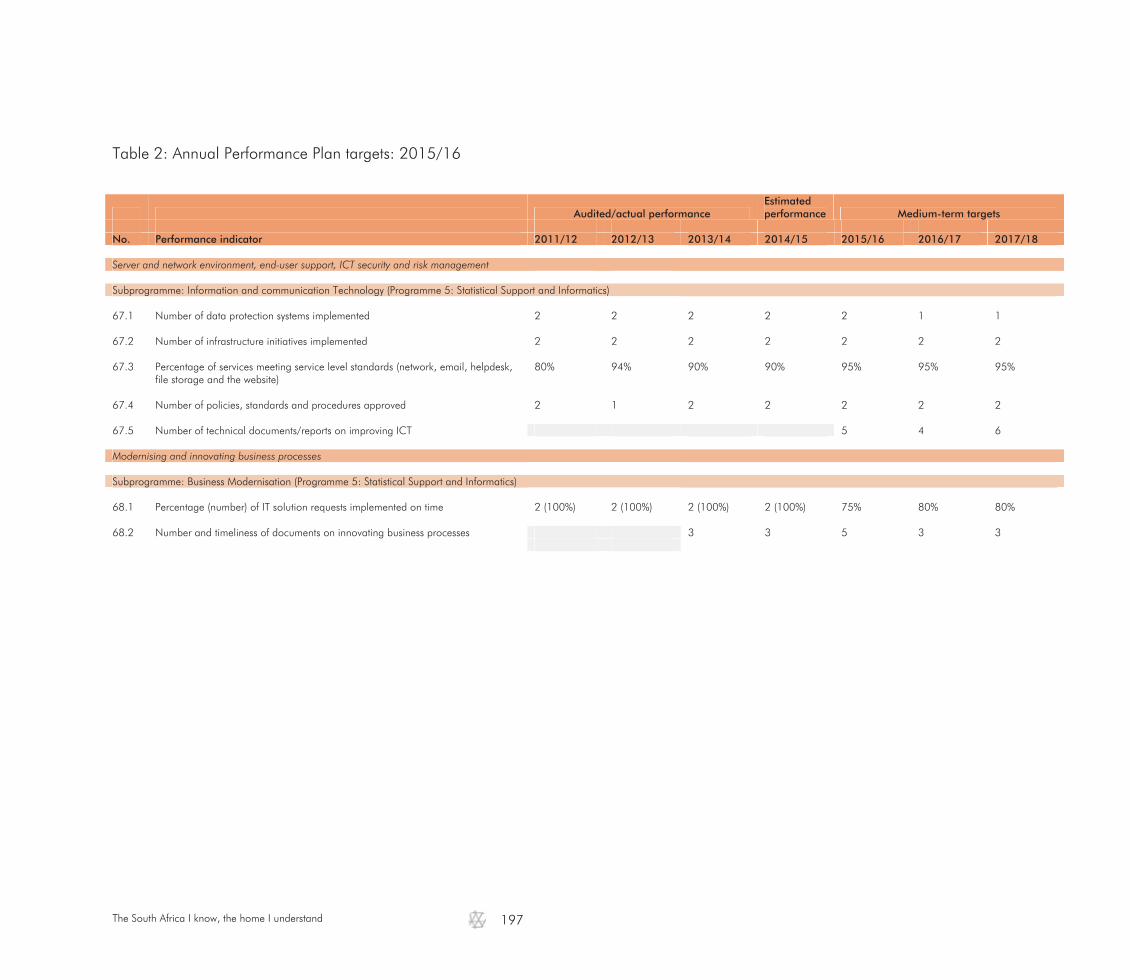
The South Africa I know, the home I understand
197
Table 2: Annual Performance Plan targets: 2015/16
Audited/actual performance Estimated performance Medium-term targets
No. Performance indicator 2011/12 2012/13 2013/14 2014/15 2015/16 2016/17 2017/18 Server and network environment, end-user support, ICT security and risk management Subprogramme: Information and communication Technology (Programme 5: Statistical Support and Informatics) 67.1 Number of data protection systems implemented 2 2 2 2 2 1 1 67.2 Number of infrastructure initiatives implemented 2 2 2 2 2 2 2 67.3 Percentage of services meeting service level standards (network, email, helpdesk,
file storage and the website) 80% 94% 90% 90% 95% 95% 95%
67.4 Number of policies, standards and procedures approved 2 1 2 2 2 2 2 67.5 Number of technical documents/reports on improving ICT 5 4 6 Modernising and innovating business processes Subprogramme: Business Modernisation (Programme 5: Statistical Support and Informatics) 68.1 Percentage (number) of IT solution requests implemented on time 2 (100%) 2 (100%) 2 (100%) 2 (100%) 75% 80% 80% 68.2 Number and timeliness of documents on innovating business processes 3 3 5 3 3

The South Africa I know, the home I understand
198
Table 3: Quarterly performance targets: 2015/16
Quarterly targets
No. Performance indicator Reporting period
Annual target Quarter 1 Quarter 2 Quarter 3 Quarter 4
Server and network environment, end-user support, ICT security and risk management Subprogramme: Information and communication Technology (Programme 5: Statistical Support and Informatics) 67.1.1 Number and timeliness of reports on data
protection systems implemented Annually 2
Report on vulnerability assessment conducted by March 2016
Report on security monitoring and reporting system implemented by March 2016
67.2.1 Number of infrastructure initiatives implemented
Annually 2 Report on System Centre
Configuration in provinces by September 2015
Report on consolidation of servers by March 2016
67.3.1 Percentage of services meeting service level
standards (network, email, helpdesk, file storage and the website)
Quarterly 95% 95% 95% 95% 95%
67.4.1 Number of policies, standards and procedures
approved Annually 2 Procedure on Windows
Server 2012 installation and setup by September 2015
ICT Infrastructure Refresh Strategy by March 2016
67.5.1 Number of technical documents/reports on
improving ICT Periodic 5
Broadband infrastructure by March 2016
Report on stabilising ICT infrastructure in provinces and districts by March 2016
Report on improving the quality and response of ICT services by March 2016
Report on the awareness campaign of ICT governance by March 2016
Report on developing ICT standards and protocols with SANSS partners by March 2016
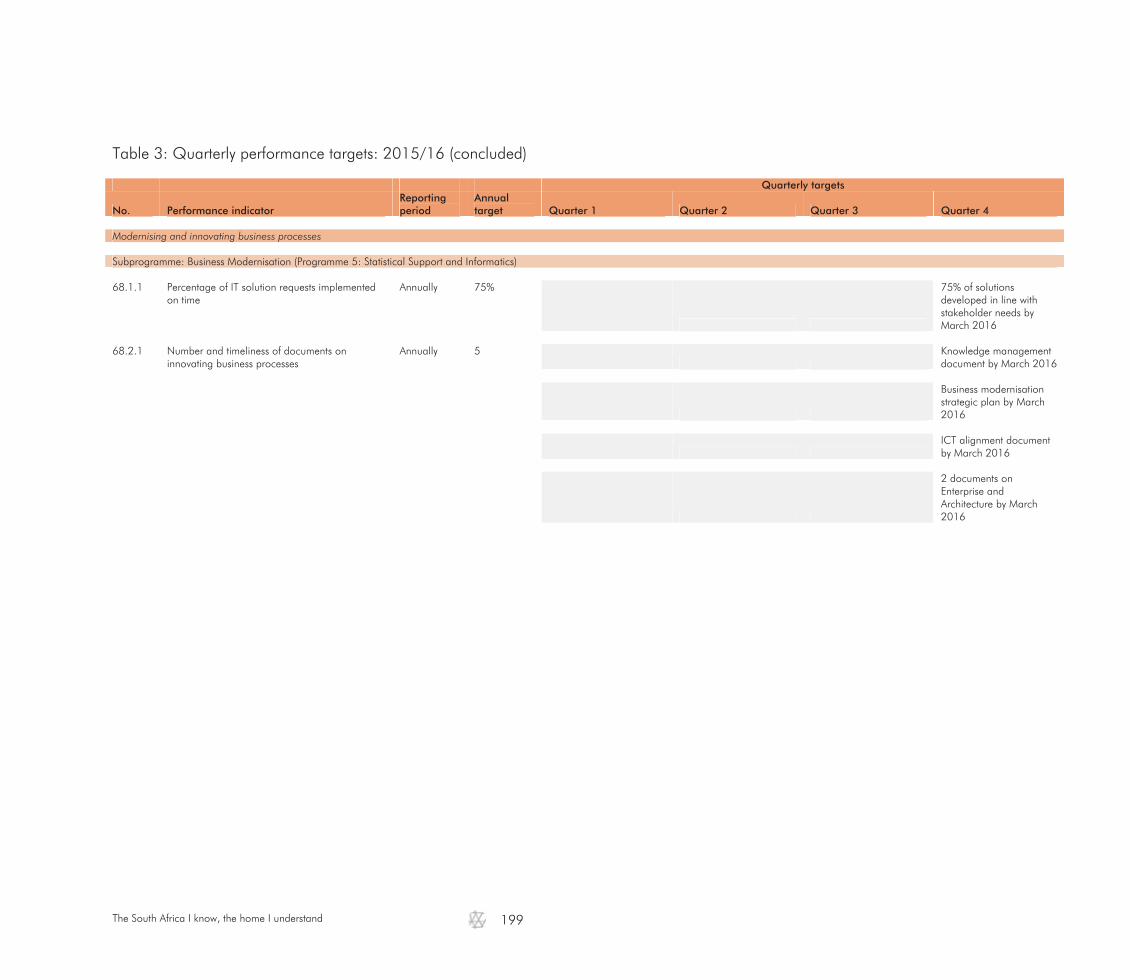
The South Africa I know, the home I understand
199
Table 3: Quarterly performance targets: 2015/16 (concluded)
Quarterly targets
No. Performance indicator Reporting period
Annual target Quarter 1 Quarter 2 Quarter 3 Quarter 4
Modernising and innovating business processes Subprogramme: Business Modernisation (Programme 5: Statistical Support and Informatics) 68.1.1 Percentage of IT solution requests implemented
on time Annually 75%
75% of solutions developed in line with stakeholder needs by March 2016
68.2.1 Number and timeliness of documents on
innovating business processes Annually 5
Knowledge management document by March 2016
Business modernisation strategic plan by March 2016
ICT alignment document by March 2016
2 documents on Enterprise and Architecture by March 2016


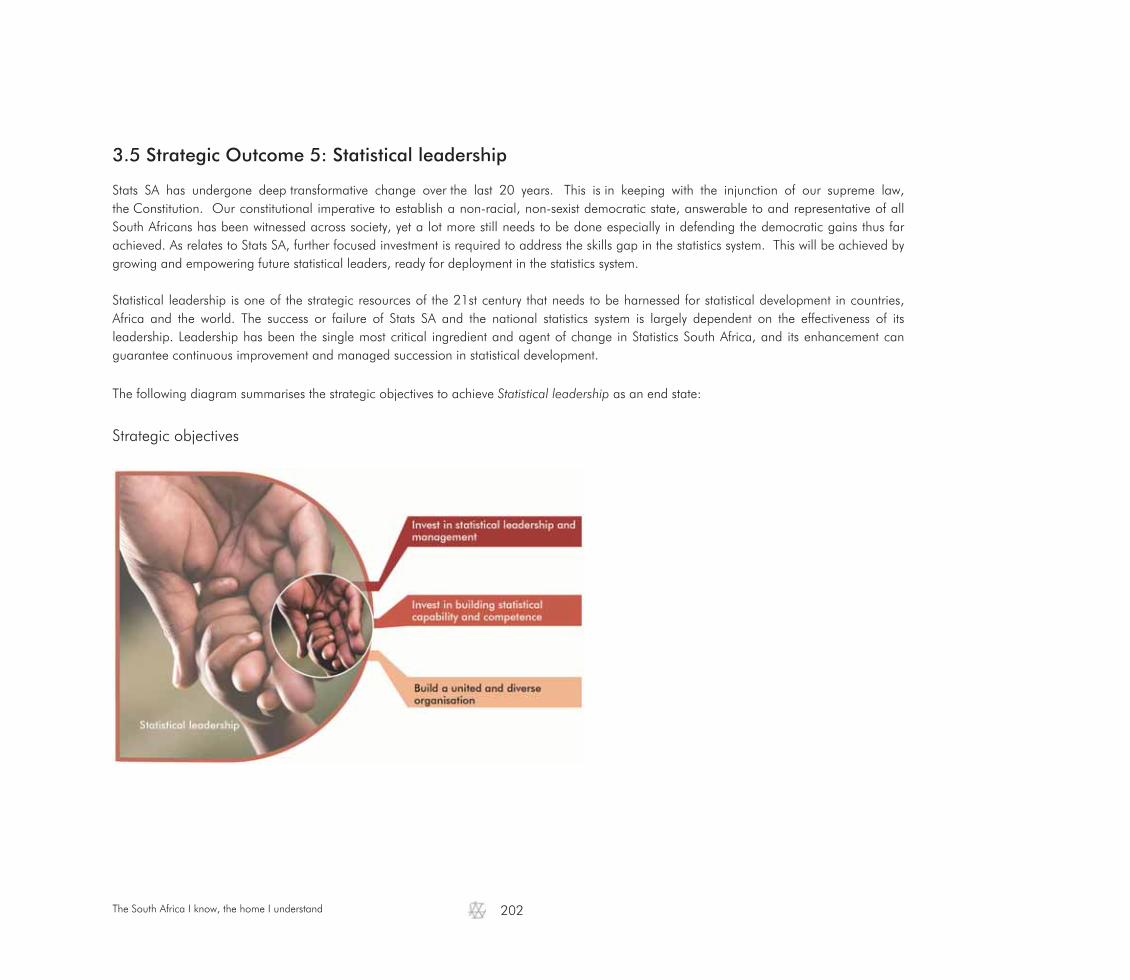
The South Africa I know, the home I understand
202
3.5 Strategic Outcome 5: Statistical leadership Stats SA has undergone deep transformative change over the last 20 years. This is in keeping with the injunction of our supreme law, the Constitution. Our constitutional imperative to establish a non-racial, non-sexist democratic state, answerable to and representative of all South Africans has been witnessed across society, yet a lot more still needs to be done especially in defending the democratic gains thus far achieved. As relates to Stats SA, further focused investment is required to address the skills gap in the statistics system. This will be achieved by growing and empowering future statistical leaders, ready for deployment in the statistics system. Statistical leadership is one of the strategic resources of the 21st century that needs to be harnessed for statistical development in countries, Africa and the world. The success or failure of Stats SA and the national statistics system is largely dependent on the effectiveness of its leadership. Leadership has been the single most critical ingredient and agent of change in Statistics South Africa, and its enhancement can guarantee continuous improvement and managed succession in statistical development. The following diagram summarises the strategic objectives to achieve Statistical leadership as an end state:
Strategic objectives

The South Africa I know, the home I understand
203
3.5.1 Statistical leadership and management
Strategic objective 5.1: To invest in statistical leadership and management Objective statement: Invest in statistical leadership and management as an end state to lead the statistical reform, strategic change
and the transparency, accountability and transformation of the statistical system Baseline: Number of senior managers trained annually: 10
Justification: This objective will contribute to Stats SA becoming a capable organisation to ensure responsiveness of the
statistical system to user demand Links: This objective links to the NDP and MTSF Statistical leadership is one of the strategic resources of the 21st century that needs to be harnessed for statistical development in countries, Africa and the world. The success or failure of Stats SA and the implementation of the national statistics system is largely dependent on the effectiveness of its leadership. Leadership has been identified as a critical change agent in statistical development. The following tables outline the strategic, annual and quarterly performance plan targets for building statistical leadership and management:
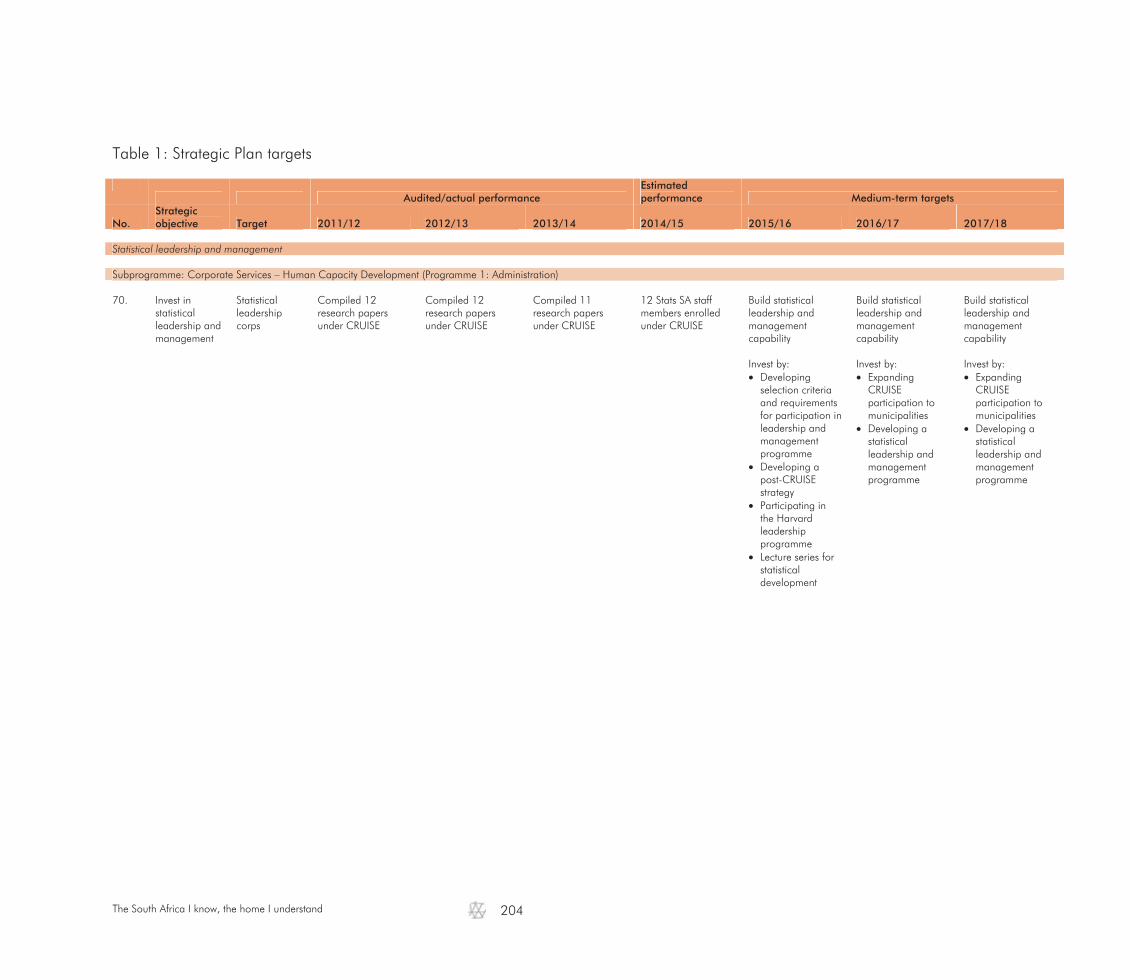
The South Africa I know, the home I understand
204
Table 1: Strategic Plan targets
Audited/actual performance
Estimated performance Medium-term targets
No. Strategic objective Target 2011/12 2012/13 2013/14 2014/15 2015/16 2016/17 2017/18
Statistical leadership and management Subprogramme: Corporate Services – Human Capacity Development (Programme 1: Administration) 70. Invest in
statistical leadership and management
Statistical leadership corps
Compiled 12 research papers under CRUISE
Compiled 12 research papers under CRUISE
Compiled 11 research papers under CRUISE
12 Stats SA staff members enrolled under CRUISE
Build statistical leadership and management capability Invest by: Developing
selection criteria and requirements for participation in leadership and management programme
Developing a post-CRUISE strategy
Participating in the Harvard leadership programme
Lecture series for statistical development
Build statistical leadership and management capability Invest by: Expanding
CRUISE participation to municipalities
Developing a statistical leadership and management programme
Build statistical leadership and management capability Invest by: Expanding
CRUISE participation to municipalities
Developing a statistical leadership and management programme

The South Africa I know, the home I understand
205
Table 2: Annual Performance Plan targets: 2015/16
Audited/actual performance Estimated performance Medium-term targets
No. Performance indicator 2011/12 2012/13 2013/14 2014/15 2015/16 2016/17 2017/18 Statistical leadership and management Subprogramme: Corporate Services – Human Capacity Development (Programme 1: Administration) 70.1 Number of research papers compiled by students enrolled at
CRUISE 12 12 11 10 12 12 12
70.2 Number of technical documents/reports on improving
statistical leadership and management 4 2 2
Table 3: Quarterly performance targets: 2015/16
Quarterly targets
No. Performance indicator Reporting period
Annual target Quarter 1 Quarter 2 Quarter 3 Quarter 4
Statistical leadership and management Subprogramme: Corporate Services – Human Capacity Development (Programme 1: Administration) 70.1.1 Number of research papers compiled by students
enrolled at CRUISE Annually 12
12 Research reports from CRUISE by March 2016
70.2.1 Number of technical documents/reports on
improving statistical leadership and management Periodic 4
Report on selection criteria for CRUISE by March 2016
Post-CRUISE strategy by March 2016
Report on participation in the Harvard leadership programme by March 2016
Report on lecture series for statistical development by March 2016

The South Africa I know, the home I understand
206
3.5.2 Statistical capability and competence Strategic objective 5.2: To invest in building statistical capability and competence Objective statement: Invest in building statistical capability and competence through the schools programme, tertiary programme,
inside Stats SA and within the national statistics system Baseline: Number of staff trained annually: 1 972 Justification: This objective will contribute to Stats SA becoming a capable organisation by ensuring that the skills gap in the
statistical system is addressed Links: This objective links to the NDP and MTSF Interventions in human resource development represent an essential contribution to promoting the statistics development agenda. A robust HRD strategy for statistical literacy and numeracy is as important today as it was at the onset of our democracy in 1994. The challenge South Africa continues to face is that of scarce skills as the number of matriculants who qualify to study Mathematics and Statistics in tertiary institutions continues to decline. A central national concern is to accelerate statistical literacy and numeracy so that there is a match between supply and demand for human resources. Although people have been trained, there remains a shortage of skills to respond to new demands. These new increasing demands are mainly for innovative products, and the organisation will therefore focus on the research and analysis area, exposing staff to knowledgeable people and taking advantage of technology to address the demands. Stats SA will invest in a number of people through institutions nationally and internationally to create a pool of future leaders. The drive to focus on 'use' will continue, and Stats SA will build the capability of both producers and users of official statistics to increase their understanding and skills, and improve access and use. The following tables outline the strategic, annual and quarterly performance plan targets for building statistical capability and competence:
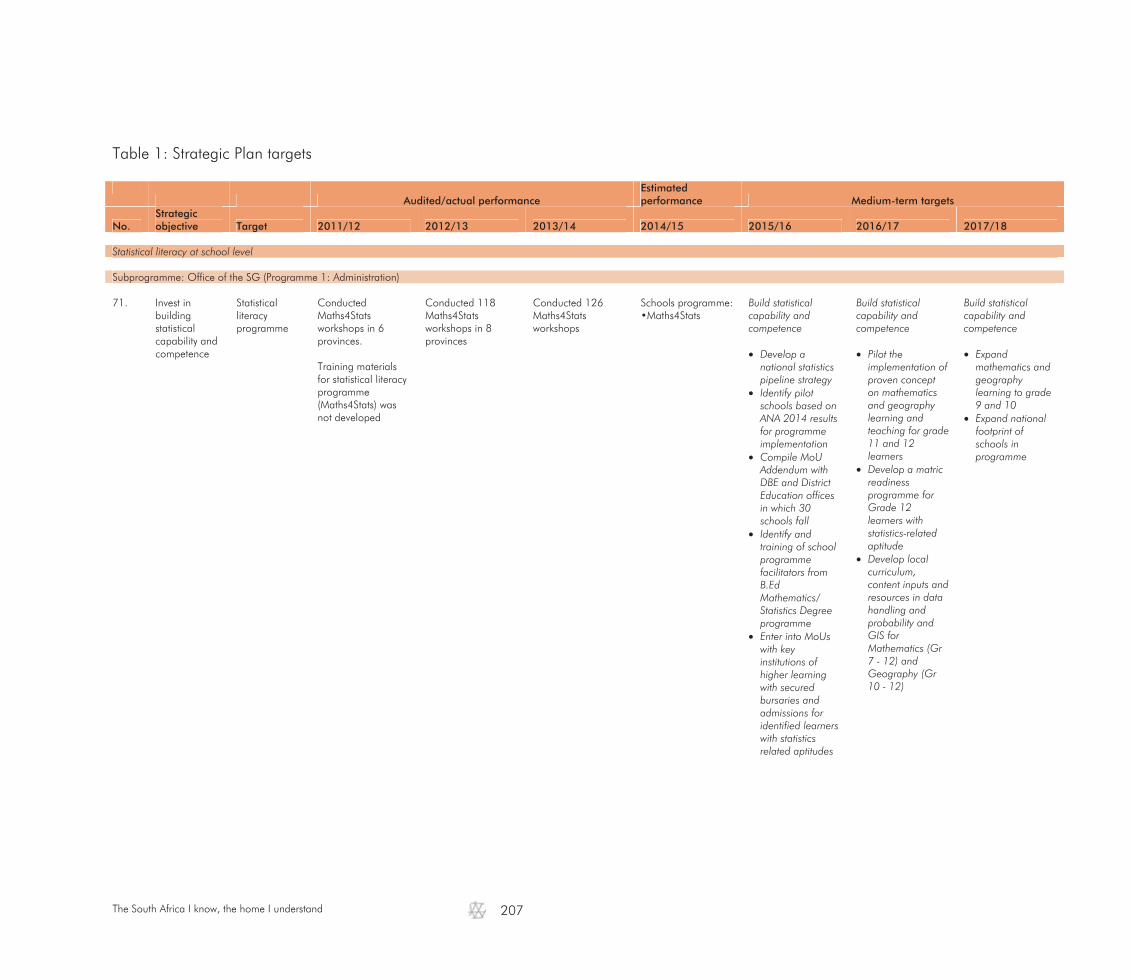
The South Africa I know, the home I understand
207
Table 1: Strategic Plan targets
Audited/actual performance
Estimated performance Medium-term targets
No. Strategic objective Target 2011/12 2012/13 2013/14 2014/15 2015/16 2016/17 2017/18
Statistical literacy at school level Subprogramme: Office of the SG (Programme 1: Administration) 71. Invest in
building statistical capability and competence
Statistical literacy programme
Conducted Maths4Stats workshops in 6 provinces. Training materials for statistical literacy programme (Maths4Stats) was not developed
Conducted 118 Maths4Stats workshops in 8 provinces
Conducted 126 Maths4Stats workshops
Schools programme: •Maths4Stats
Build statistical capability and competence Develop a
national statistics pipeline strategy
Identify pilot schools based on ANA 2014 results for programme implementation
Compile MoU Addendum with DBE and District Education offices in which 30 schools fall
Identify and training of school programme facilitators from B.Ed Mathematics/ Statistics Degree programme
Enter into MoUs with key institutions of higher learning with secured bursaries and admissions for identified learners with statistics related aptitudes
Build statistical capability and competence Pilot the
implementation of proven concept on mathematics and geography learning and teaching for grade 11 and 12 learners
Develop a matric readiness programme for Grade 12 learners with statistics-related aptitude
Develop local curriculum, content inputs and resources in data handling and probability and GIS for Mathematics (Gr 7 - 12) and Geography (Gr 10 - 12)
Build statistical capability and competence Expand
mathematics and geography learning to grade 9 and 10
Expand national footprint of schools in programme

The South Africa I know, the home I understand
208
Table 1: Strategic Plan targets (continued)
Audited/actual performance
Estimated performance Medium-term targets
No. Strategic objective Target 2011/12 2012/13 2013/14 2014/15 2015/16 2016/17 2017/18
Statistical capacity at tertiary level Subprogramme: Corporate Services – Human Capacity Development (Programme 1: Administration) 72. Invest in
building statistical capability and competence
Training reports
Enrol employees with Southern Africa Labour Development Research Unit (SALDRU)
Create learning opportunities at tertiary level Invest in capacity building by: Aligning MoUs
with organisational needs
Create learning opportunities at tertiary level Invest in capacity building by: Assessing course
content and curriculum of tertiary partners
Create learning opportunities at tertiary level Invest in capacity building by: Institutionalising
centres of excellence
Subprogramme: Office of the SG (Programme 1: Administration) 73. Invest in
building statistical capability and competence
Coordination of statistical tertiary programme
Coordinate a tertiary support programme
Develop a
university statistics student mentoring programme
Coordinate a tertiary support programme
Implement 1st
year university statistics students mentoring programme
Develop a NSS-wide work programme for students of statistics related studies
Coordinate a tertiary support programme
Institutionalise
statistics student work programme within the SANSS

The South Africa I know, the home I understand
209
Table 1: Strategic Plan targets (concluded)
Audited/actual performance
Estimated performance Medium-term targets
No. Strategic objective Target 2011/12 2012/13 2013/14 2014/15 2015/16 2016/17 2017/18
Building capacity inside Stats SA Subprogramme: Corporate Services – Human Capacity Development (Programme 1: Administration) 74. Invest in
building statistical capability and competence
Staff trained in Stats SA
Submitted workplace skills plan, approved training plan, 31 appointed interns, 116 attended induction, 163 attended leadership training, 121 attended statistical training, 1 428 attended other courses 32 attended SADC Survey Methodology course 461 bursaries approved and 225 registered at institutions Awarded 13 local study bursaries No bursaries awarded due to budget constraints Proposal for the establishment of an independent training institute was not completed Study material for Official Statistics Certificate was approved and 31 students enrolled in the course
Inside Stats SA • Appointed 38
interns • 55 staff completed
e-learning • Awarded 71
bursaries 1 790 staff attended other courses
• 2 modules developed for post-graduate diploma were accredited
• Improved training materials for survey programmes
Enrolled 42 students in the course Official Statistics for
• 2 modules for the post-graduate diploma were completed
Inside Stats SA • Appointed 50
interns • 1 972 staff trained • 445 bursaries
awarded • 12 study bursaries
awarded to students
• 35 students enrolled in the Official Statistics Course
• 15 students enrolled for tertiary education
Inside Stats SA • 75 interns
appointed Statistics Training Institute established
Coordinate capacity building in Stats SA Improve by: Developing an
HRD evaluation framework
Developing an HCD strategy to align to organisational strategy
Researching accreditation of Diploma in Official Statistics
Piloting e-learning induction programme
Coordinate capacity building in Stats SA Improve by: Developing and
rolling out a re-skilling programme
Providing training support to CS 2016
Aligning training material with unit standards for accreditation
Assessing e-learning programme
Coordinate capacity building in Stats SA Improve by: Implementing a
re-skilling programme (for new technology)
Obtaining accreditation in Official Statistics
Piloting new e-learning system
Re-aligning all training initiatives
Building capacity in the SANSS 75. This target is
under provinces
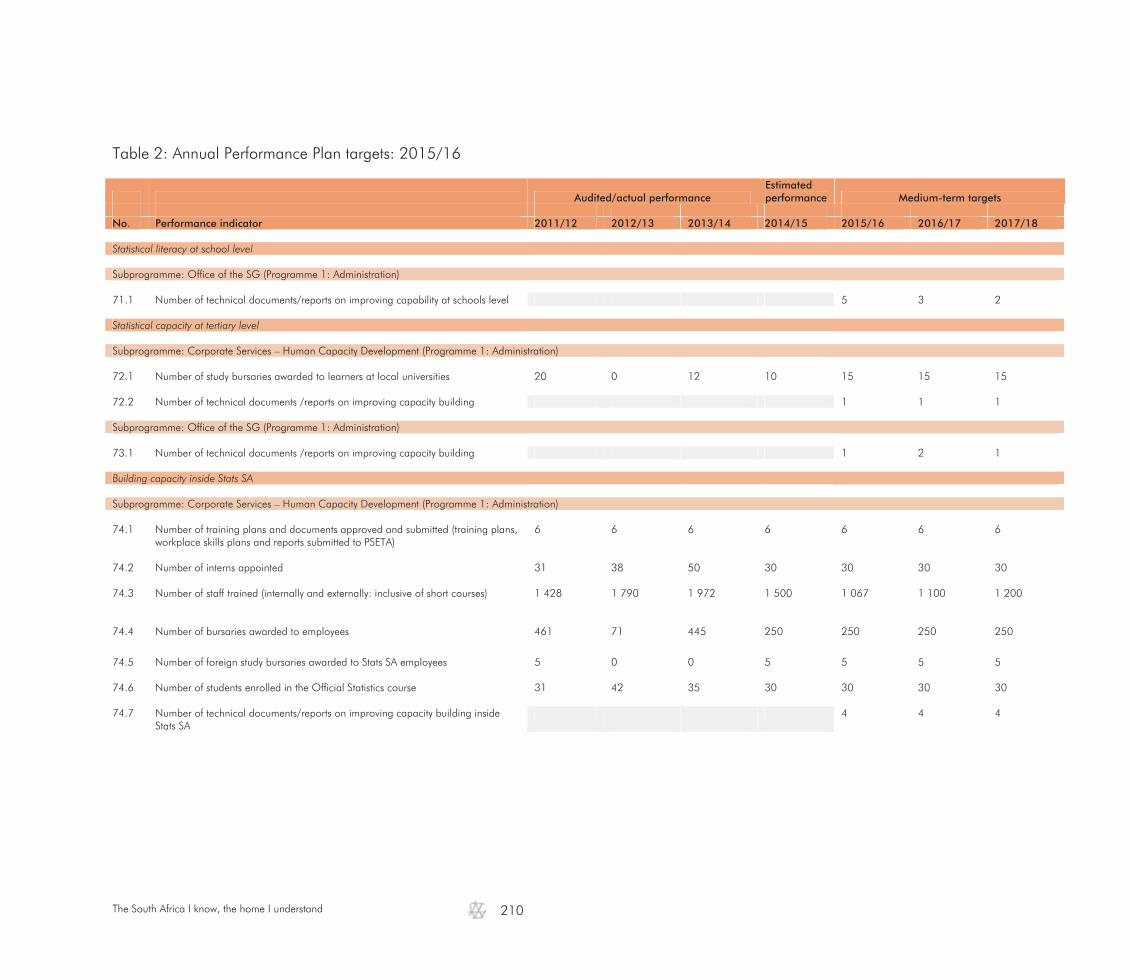
The South Africa I know, the home I understand
210
Table 2: Annual Performance Plan targets: 2015/16
Audited/actual performance Estimated performance Medium-term targets
No. Performance indicator 2011/12 2012/13 2013/14 2014/15 2015/16 2016/17 2017/18 Statistical literacy at school level Subprogramme: Office of the SG (Programme 1: Administration) 71.1 Number of technical documents/reports on improving capability at schools level 5 3 2 Statistical capacity at tertiary level Subprogramme: Corporate Services – Human Capacity Development (Programme 1: Administration) 72.1 Number of study bursaries awarded to learners at local universities 20 0 12 10 15 15 15 72.2 Number of technical documents /reports on improving capacity building 1 1 1 Subprogramme: Office of the SG (Programme 1: Administration) 73.1 Number of technical documents /reports on improving capacity building 1 2 1 Building capacity inside Stats SA Subprogramme: Corporate Services – Human Capacity Development (Programme 1: Administration) 74.1 Number of training plans and documents approved and submitted (training plans,
workplace skills plans and reports submitted to PSETA) 6 6 6 6 6 6 6
74.2 Number of interns appointed 31 38 50 30 30 30 30 74.3 Number of staff trained (internally and externally: inclusive of short courses) 1 428 1 790 1 972
1 500
1 067 1 100 1 200
74.4 Number of bursaries awarded to employees 461 71 445 250 250 250 250
74.5 Number of foreign study bursaries awarded to Stats SA employees 5 0 0 5 5 5 5 74.6 Number of students enrolled in the Official Statistics course 31 42 35 30 30 30 30 74.7 Number of technical documents/reports on improving capacity building inside
Stats SA 4 4 4

The South Africa I know, the home I understand
211
Table 3: Quarterly performance targets: 2015/16
Quarterly targets
No. Performance indicator Reporting period
Annual target Quarter 1 Quarter 2 Quarter 3 Quarter 4
Statistical literacy at school level Subprogramme: Office of the SG (Programme 1: Administration) 71.1.1 Number of technical documents/reports on
improving statistical literacy at schools level Periodic 5 National statistics pipeline
strategy by March 2016 Report on pilot schools
identified based on ANA 2014 results for programme implementation by March 2016
MoU Addendum
compiled with DBE and District Education offices by March 2016
Report on school
programme facilitators by March 2016
Report on MoUs with key
institutions of higher learning by March 2016
Statistical capacity at tertiary level Subprogramme: Corporate Services – Human Capacity Development (Programme 1: Administration) 72.1.1 Number of study bursaries awarded to learners
at local universities Annually 15 15 bursaries awarded to
learners by March 2016 72.2.1 Number of technical documents/reports on
improving capacity at tertiary level Periodic 1 MoU aligned to
organisational needs by March 2016
Subprogramme: Office of the SG (Programme 1: Administration) 73.1.1 Number of technical documents/reports on
improving capacity at tertiary level Periodic 1 Report on student
mentoring programme by March 2016
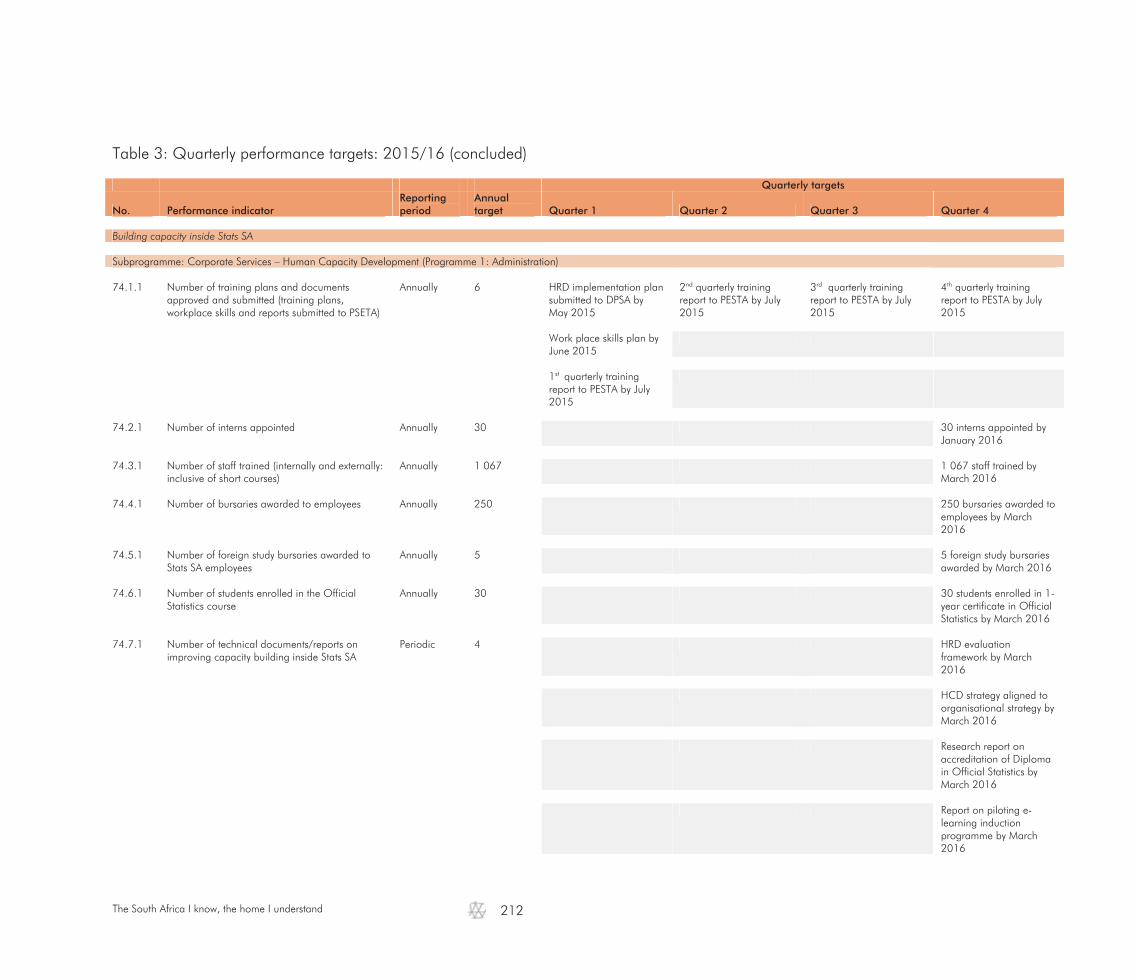
The South Africa I know, the home I understand
212
Table 3: Quarterly performance targets: 2015/16 (concluded)
Quarterly targets
No. Performance indicator Reporting period
Annual target Quarter 1 Quarter 2 Quarter 3 Quarter 4
Building capacity inside Stats SA Subprogramme: Corporate Services – Human Capacity Development (Programme 1: Administration) 74.1.1 Number of training plans and documents
approved and submitted (training plans, workplace skills and reports submitted to PSETA)
Annually 6 HRD implementation plan submitted to DPSA by May 2015
2nd quarterly training report to PESTA by July 2015
3rd quarterly training report to PESTA by July 2015
4th quarterly training report to PESTA by July 2015
Work place skills plan by
June 2015
1st quarterly training report to PESTA by July 2015
74.2.1 Number of interns appointed Annually 30 30 interns appointed by
January 2016 74.3.1 Number of staff trained (internally and externally:
inclusive of short courses) Annually 1 067 1 067 staff trained by
March 2016 74.4.1 Number of bursaries awarded to employees Annually 250 250 bursaries awarded to
employees by March 2016
74.5.1 Number of foreign study bursaries awarded to
Stats SA employees Annually 5 5 foreign study bursaries
awarded by March 2016 74.6.1 Number of students enrolled in the Official
Statistics course Annually 30 30 students enrolled in 1-
year certificate in Official Statistics by March 2016
74.7.1 Number of technical documents/reports on
improving capacity building inside Stats SA Periodic 4 HRD evaluation
framework by March 2016
HCD strategy aligned to
organisational strategy by March 2016
Research report on
accreditation of Diploma in Official Statistics by March 2016
Report on piloting e-
learning induction programme by March 2016
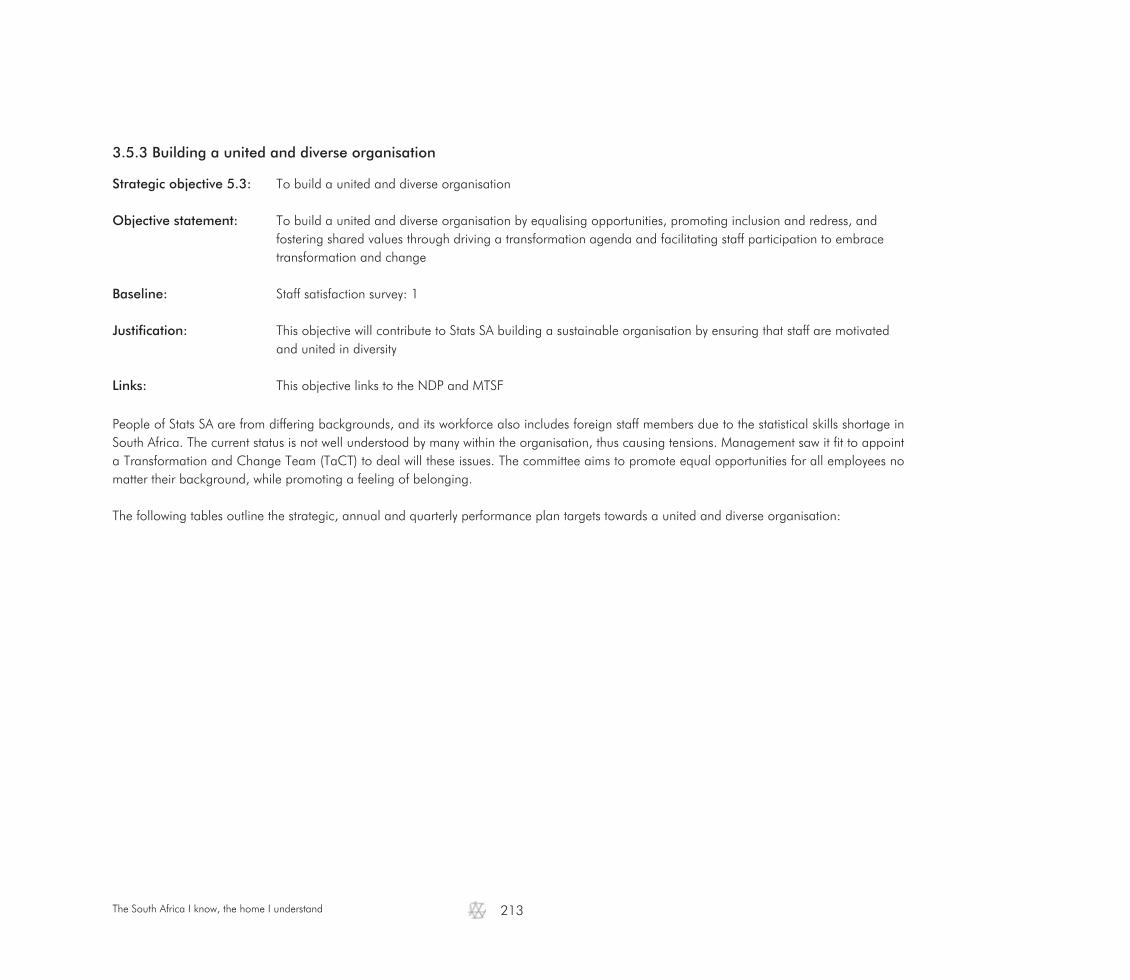
The South Africa I know, the home I understand
213
3.5.3 Building a united and diverse organisation
Strategic objective 5.3: To build a united and diverse organisation Objective statement: To build a united and diverse organisation by equalising opportunities, promoting inclusion and redress, and
fostering shared values through driving a transformation agenda and facilitating staff participation to embrace transformation and change
Baseline: Staff satisfaction survey: 1 Justification: This objective will contribute to Stats SA building a sustainable organisation by ensuring that staff are motivated
and united in diversity Links: This objective links to the NDP and MTSF People of Stats SA are from differing backgrounds, and its workforce also includes foreign staff members due to the statistical skills shortage in South Africa. The current status is not well understood by many within the organisation, thus causing tensions. Management saw it fit to appoint a Transformation and Change Team (TaCT) to deal will these issues. The committee aims to promote equal opportunities for all employees no matter their background, while promoting a feeling of belonging. The following tables outline the strategic, annual and quarterly performance plan targets towards a united and diverse organisation:
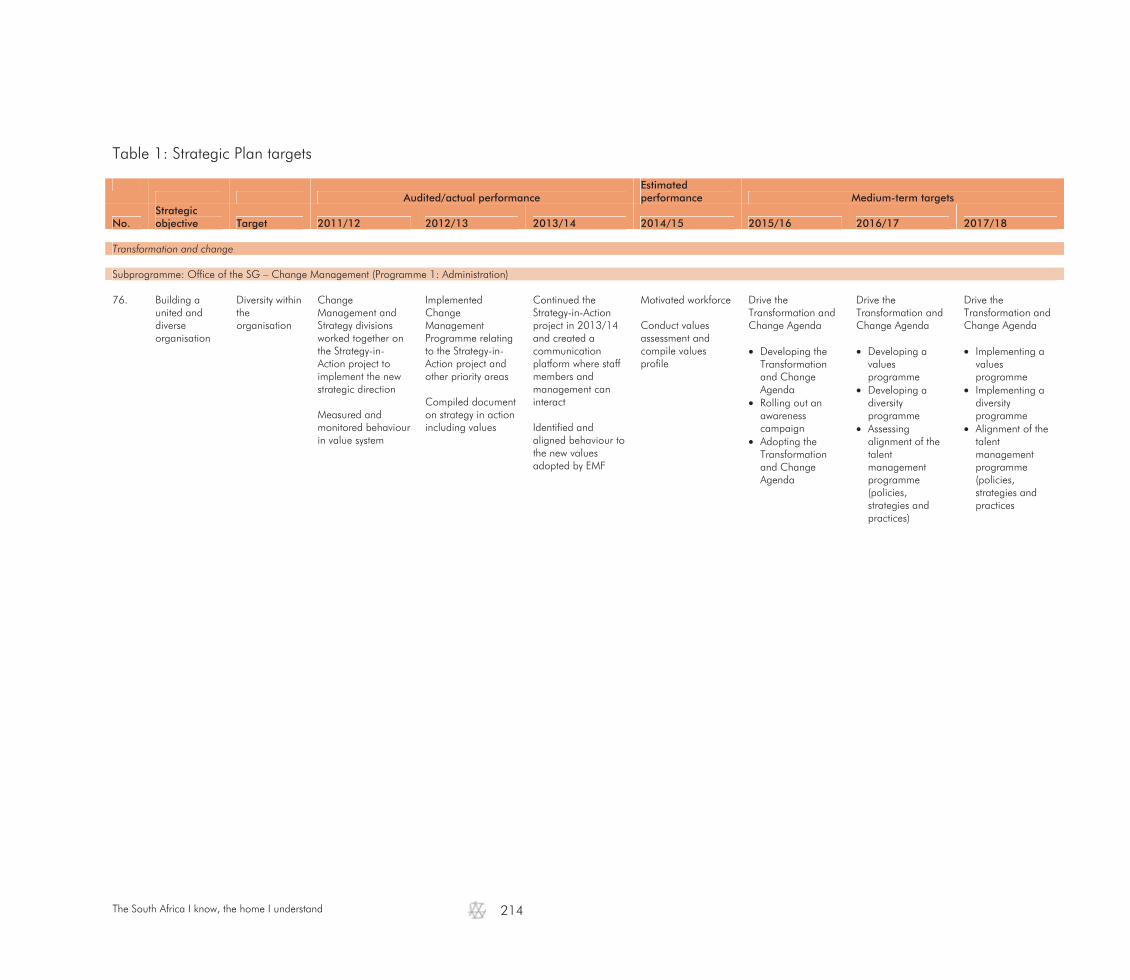
The South Africa I know, the home I understand
214
Table 1: Strategic Plan targets
Audited/actual performance
Estimated performance Medium-term targets
No. Strategic objective Target 2011/12 2012/13 2013/14 2014/15 2015/16 2016/17 2017/18
Transformation and change Subprogramme: Office of the SG – Change Management (Programme 1: Administration) 76. Building a
united and diverse organisation
Diversity within the organisation
Change Management and Strategy divisions worked together on the Strategy-in-Action project to implement the new strategic direction Measured and monitored behaviour in value system
Implemented Change Management Programme relating to the Strategy-in-Action project and other priority areas Compiled document on strategy in action including values
Continued the Strategy-in-Action project in 2013/14 and created a communication platform where staff members and management can interact Identified and aligned behaviour to the new values adopted by EMF
Motivated workforce Conduct values assessment and compile values profile
Drive the Transformation and Change Agenda Developing the
Transformation and Change Agenda
Rolling out an awareness campaign
Adopting the Transformation and Change Agenda
Drive the Transformation and Change Agenda Developing a
values programme
Developing a diversity programme
Assessing alignment of the talent management programme (policies, strategies and practices)
Drive the Transformation and Change Agenda Implementing a
values programme
Implementing a diversity programme
Alignment of the talent management programme (policies, strategies and practices

The South Africa I know, the home I understand
215
Table 2: Annual Performance Plan targets: 2015/16
Audited/actual performance Estimated performance Medium-term targets
No. Performance indicator 2011/12 2012/13 2013/14 2014/15 2015/16 2016/17 2017/18 Transformation and change Subprogramme: Office of the SG – Change Management (Programme 1: Administration) 76.1 Number of technical documents/ reports on transformation and change 2 1 1 1 3 3 3
Table 3: Quarterly performance targets: 2015/16
Quarterly targets
No. Performance indicator Reporting period
Annual target Quarter 1 Quarter 2 Quarter 3 Quarter 4
Transformation and change Subprogramme: Office of the SG – Change Management (Programme 1: Administration) 76.1.1 Number of technical documents/ reports on
transformation and change Periodic 3 Proposal on the
Transformation and Change Agenda by September 2015
Transformation and Change Agenda adopted by March 2016
Awareness campaign
rolled out by March 2016

The South Africa I know, the home I understand
217
3.6 Provincial and district offices: Sustainable and responsive statistical infrastructure Strategic objective 4.5: To invest in a sustainable and responsive statistical infrastructure Objective statement: Sustain and strengthen the statistical infrastructure in the provinces through investing in statistical regions, being
responsive to provincial statistical needs, and driving an integrated collection and dissemination agenda at grassroots level
Baseline: Number of operational provincial and district offices: 63 Justification: This objective will contribute to Stats SA becoming a capable organisation by ensuring effective and efficient
provincial and district statistical infrastructure and operations Links: This objective links to the NDP and MTSF Policy context: Provinces will receive R469 billion in the 2015/16 financial year, increasing to R527 billion in 2017/18. Efficiency improvements will be prioritised in the core areas of service delivery which includes basic education, health, roads, and social development. National Treasury will work with provincial departments to improve human resource management and supply chain processes. Special attention must be paid to containing personnel expenditure which now accounts for 61 per cent of total provincial spending. Support will be provided to municipalities to improve revenue collection and management of infrastructure financed from both own revenue and grants. The local government equitable share continues to finance the provision of basic services to poor households, but municipalities must work harder to broaden access (MTBPS: 2014). The policy context above highlights the importance of Stats SA's presence at provincial and municipal level to serve the needs of provincial stakeholders. Stats SA's national footprint is represented through its nine provincial offices and 54 district offices across the country. The current core responsibility of provincial and district offices is mainly that of data collection and dissemination of statistical information. The provincial strategy sets out the following strategic shifts to strengthen evidence based decision making in provinces:
Provincial statistics agenda: mainstreaming provincial information needs into collection agenda Statistical collections: addressing quality of data collected and establishing efficient and effective survey operations supported by
technology Statistical frames: maintaining and updating the provincial spatial information frame (DU, EA and place names) through collaborative
mapping with municipalities and other provincial stakeholders Statistical dissemination: Increasing usage of statistics at provincial and municipal level; Rolling out a stakeholder-focused
communication, marketing, advocacy and publicity strategy and plan Statistical coordination: Strengthening provincial statistics system through providing statistical support and advice; strengthening the
quality and use of administrative data; and participating in provincial statistical projects Statistical capacity: developing a framework for internal capacity building focusing on developing staff skills for new strategic
demands, and external capacity building to cohesively build statistical literacy and numeracy

The South Africa I know, the home I understand
218
Statistical administration: Increase productivity and capability of provincial and district offices; and reviewing and rationalising provincial structure and function.
The following tables outline the strategic, annual and quarterly performance plan targets for provincial and district offices:
Table 1: Strategic Plan targets
Audited/actual performance
Estimated performance Medium-term targets
No. Strategic objective Target 2011/12 2012/13 2013/14 2014/15 2015/16 2016/17 2017/18
Strategic Outcome 2: Trusted statistics – Innovate the statistics value chain for better efficiency Plan, design, build, collect, process and disseminate 40. Innovate the
statistics value chain for better efficiency
Response rate of 85% for household surveys
Implemented integrated fieldwork strategy and conceptualised continuous data collection Implemented a periodic household survey programme and created efficiency savings Census 2011: Completed preparation for field collections, which included establishment of satellite offices in all provinces Decentralised corporate support services (phase 3) Conducted 5 household surveys and NTS pilot with an average response rate of 95% Conducted 35 stakeholder workshops in provinces
Implemented the IFWS in KZN, Northern Cape, and Western Cape The economic survey programme was not implemented. CPI is collected at provincial and district levels Census 2011: Closed 31 out of 58 satellite offices as at 31 March 2013 Decentralised corporate services functions in 6 provinces Conducted 7 household surveys with an average response rate of 89% Conducted Census launches in all provinces, 4 MDG workshops in Gauteng, Northern Cape, North West and Western Cape 21 stakeholder workshops/ consultations
Implemented the Continuous Data Collection methodology Conducted 2 Census 2011 dissemination place name workshops in Eastern Cape Conducted SuperCross training in Western Cape, Free State Mpumalanga, and Northern Cape Decentralisation of corporate support services has partially been implemented Conducted 5 household surveys with an average response rate of 95% Conducted 34 workshops (MDGs, ISIbalo, African Stats Day, census dissemination)
Integrated fieldwork force as part of a national footprint Decentralised corporate services to support field operations Conducted 5 household surveys with an average response rate of 85% Conducted 9 stakeholder workshops in provinces
Conduct integrated fieldwork Conduct integrated communication, marketing and publicity Improve by: Conducting
CS2016 with new methodologies
Reviewing the integrated fieldwork strategy
Researching the state of quality in the provinces to reduce the error rate
Developing an integrated provincial communication and marketing strategy and plan
Conduct integrated fieldwork Conduct integrated communication, marketing and publicity Improve by: Conducting and
disseminating CS2016
Developing and implementing a quality management framework for provinces
Implementing the integrated provincial communication and marketing strategy and plan
Conduct integrated fieldwork Conduct integrated communication, marketing and publicity Improve by: Assessing the state
of quality Implementing the
digital data collection programme
Intensifying dissemination and use of statistics
Preparing for CPS
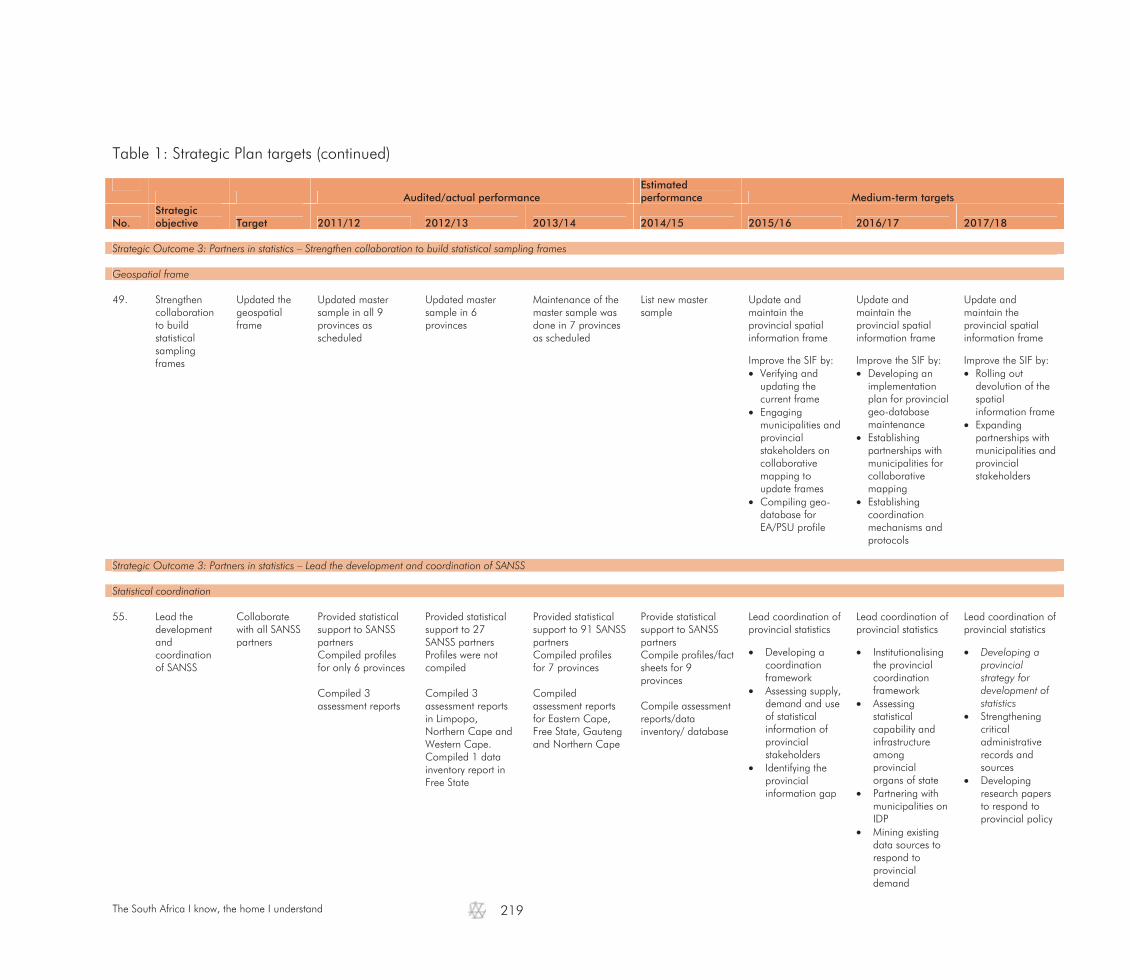
The South Africa I know, the home I understand
219
Table 1: Strategic Plan targets (continued)
Audited/actual performance
Estimated performance Medium-term targets
No. Strategic objective Target 2011/12 2012/13 2013/14 2014/15 2015/16 2016/17 2017/18
Strategic Outcome 3: Partners in statistics – Strengthen collaboration to build statistical sampling frames Geospatial frame 49. Strengthen
collaboration to build statistical sampling frames
Updated the geospatial frame
Updated master sample in all 9 provinces as scheduled
Updated master sample in 6 provinces
Maintenance of the master sample was done in 7 provinces as scheduled
List new master sample
Update and maintain the provincial spatial information frame
Improve the SIF by: Verifying and
updating the current frame
Engaging municipalities and provincial stakeholders on collaborative mapping to update frames
Compiling geo- database for EA/PSU profile
Update and maintain the provincial spatial information frame
Improve the SIF by: Developing an
implementation plan for provincial geo-database maintenance
Establishing partnerships with municipalities for collaborative mapping
Establishing coordination mechanisms and protocols
Update and maintain the provincial spatial information frame
Improve the SIF by: Rolling out
devolution of the spatial information frame
Expanding partnerships with municipalities and provincial stakeholders
Strategic Outcome 3: Partners in statistics – Lead the development and coordination of SANSS Statistical coordination 55. Lead the
development and coordination of SANSS
Collaborate with all SANSS partners
Provided statistical support to SANSS partners Compiled profiles for only 6 provinces Compiled 3 assessment reports
Provided statistical support to 27 SANSS partners Profiles were not compiled Compiled 3 assessment reports in Limpopo, Northern Cape and Western Cape. Compiled 1 data inventory report in Free State
Provided statistical support to 91 SANSS partners Compiled profiles for 7 provinces Compiled assessment reports for Eastern Cape, Free State, Gauteng and Northern Cape
Provide statistical support to SANSS partners Compile profiles/fact sheets for 9 provinces Compile assessment reports/data inventory/ database
Lead coordination of provincial statistics
Developing a coordination framework
Assessing supply, demand and use of statistical information of provincial stakeholders
Identifying the provincial information gap
Lead coordination of provincial statistics
Institutionalising the provincial coordination framework
Assessing statistical capability and infrastructure among provincial organs of state
Partnering with municipalities on IDP
Mining existing data sources to respond to provincial demand
Lead coordination of provincial statistics
Developing a provincial strategy for development of statistics
Strengthening critical administrative records and sources
Developing research papers to respond to provincial policy
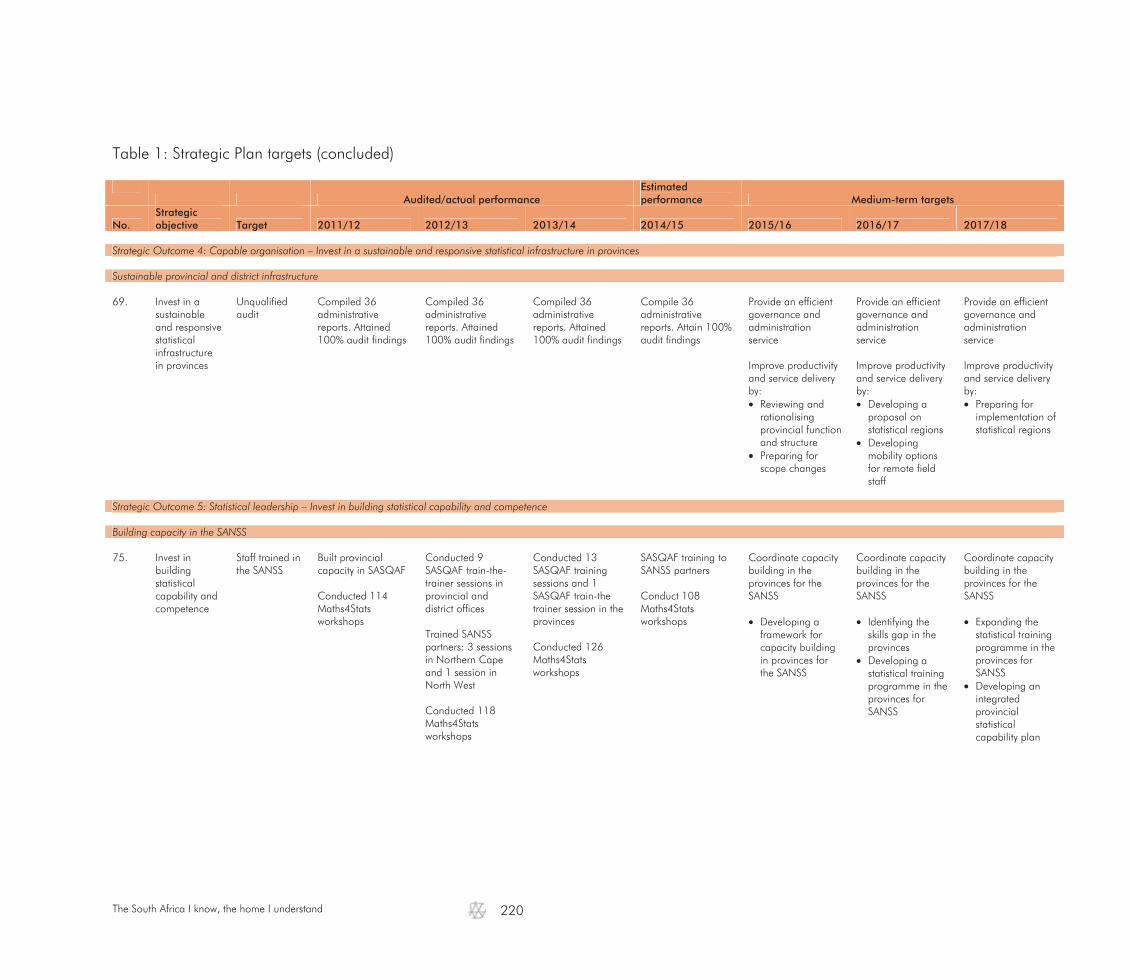
The South Africa I know, the home I understand
220
Table 1: Strategic Plan targets (concluded)
Audited/actual performance
Estimated performance Medium-term targets
No. Strategic objective Target 2011/12 2012/13 2013/14 2014/15 2015/16 2016/17 2017/18
Strategic Outcome 4: Capable organisation – Invest in a sustainable and responsive statistical infrastructure in provinces Sustainable provincial and district infrastructure 69. Invest in a
sustainable and responsive statistical infrastructure in provinces
Unqualified audit
Compiled 36 administrative reports. Attained 100% audit findings
Compiled 36 administrative reports. Attained 100% audit findings
Compiled 36 administrative reports. Attained 100% audit findings
Compile 36 administrative reports. Attain 100% audit findings
Provide an efficient governance and administration service Improve productivity and service delivery by: Reviewing and
rationalising provincial function and structure
Preparing for scope changes
Provide an efficient governance and administration service Improve productivity and service delivery by: Developing a
proposal on statistical regions
Developing mobility options for remote field staff
Provide an efficient governance and administration service Improve productivity and service delivery by: Preparing for
implementation of statistical regions
Strategic Outcome 5: Statistical leadership – Invest in building statistical capability and competence Building capacity in the SANSS 75. Invest in
building statistical capability and competence
Staff trained in the SANSS
Built provincial capacity in SASQAF Conducted 114 Maths4Stats workshops
Conducted 9 SASQAF train-the-trainer sessions in provincial and district offices Trained SANSS partners: 3 sessions in Northern Cape and 1 session in North West Conducted 118 Maths4Stats workshops
Conducted 13 SASQAF training sessions and 1 SASQAF train-the trainer session in the provinces Conducted 126 Maths4Stats workshops
SASQAF training to SANSS partners Conduct 108 Maths4Stats workshops
Coordinate capacity building in the provinces for the SANSS
Developing a
framework for capacity building in provinces for the SANSS
Coordinate capacity building in the provinces for the SANSS
Identifying the
skills gap in the provinces
Developing a statistical training programme in the provinces for SANSS
Coordinate capacity building in the provinces for the SANSS
Expanding the
statistical training programme in the provinces for SANSS
Developing an integrated provincial statistical capability plan

The South Africa I know, the home I understand
221
Table 2: Annual Performance Plan targets: 2015/16
Audited/actual performance Estimated performance Medium-term targets
No. Performance indicator 2011/12 2012/13 2013/14 2014/15 2015/16 2016/17 2017/18 Trusted statistics – Plan, design, build, collect, process and disseminate 40.1 Response rate for household surveys (QLFS, GHS, VOCs, DTS & CS2016) 85% 90% 95% 85% 85% 85% 85% 40.2 Number of stakeholder workshops/consultations 35 21 34 42 25 25 25 40.3 Number of fact sheets 32 40 40 40 40.4 Number and timeliness of technical documents/reports to improve the statistics
value chain 20 27 27
Partners in statistics – Geospatial frame 49.1 Number of municipalities/provincial stakeholders engaged in collaborative
mapping 20 20 20
49.2 Number and timeliness of technical documents/ reports to improve the spatial
information frame 18 10 9
Partners in statistics – Statistical coordination 55.1 Number of SANSS partners supported in statistical production 28 30 37 25 25 25 55.2 Number of assessments/data inventory reports compiled 3 4 9 11 8 10 10 55.3 Number of technical documents/reports to improve statistical coordination 19 36 19 Capable organisation – Sustainable provincial and district infrastructure 69.1 Number and timeliness of governance and administrative records 36 36 36 36 36 36 36 69.2 Percentage audit queries responded to within defined timelines 100% 100% 100% 100% 100% 100% 100% 69.3 Number of technical reports to improve productivity and service delivery 10 6 13 Statistical leadership – Building capacity in the SANSS 75.1 Number of SASQAF training sessions and statistical capacity building conducted 9 13 15 55 28 28 28 75.2 Number and timeliness of documents/reports on statistical capacity building 1 10 10
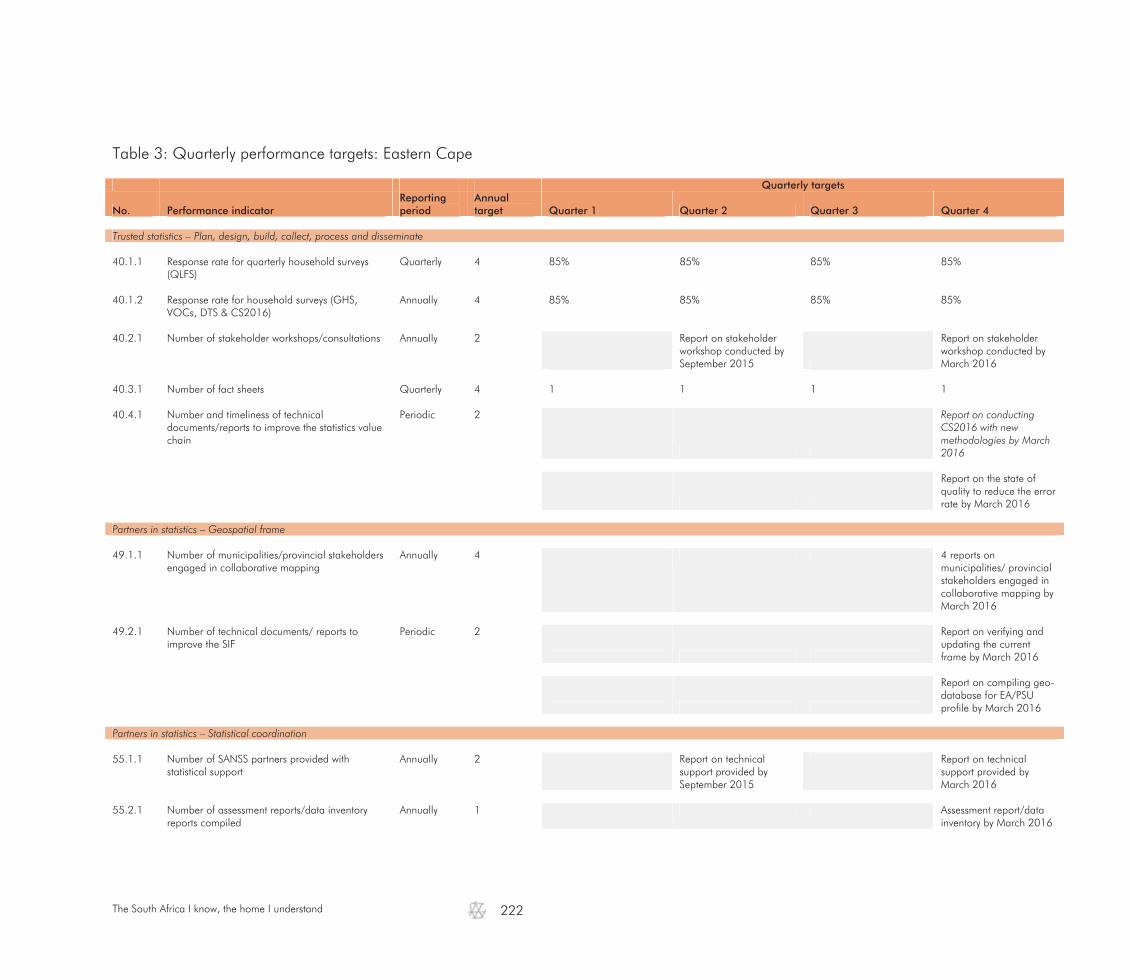
The South Africa I know, the home I understand
222
Table 3: Quarterly performance targets: Eastern Cape
Quarterly targets
No. Performance indicator Reporting period
Annual target Quarter 1 Quarter 2 Quarter 3 Quarter 4
Trusted statistics – Plan, design, build, collect, process and disseminate 40.1.1 Response rate for quarterly household surveys
(QLFS) Quarterly 4 85% 85% 85% 85%
40.1.2 Response rate for household surveys (GHS,
VOCs, DTS & CS2016) Annually 4 85% 85% 85% 85%
40.2.1 Number of stakeholder workshops/consultations Annually 2
Report on stakeholder workshop conducted by September 2015
Report on stakeholder workshop conducted by March 2016
40.3.1 Number of fact sheets Quarterly 4 1 1 1 1 40.4.1 Number and timeliness of technical
documents/reports to improve the statistics value chain
Periodic 2
Report on conducting CS2016 with new methodologies by March 2016
Report on the state of quality to reduce the error rate by March 2016
Partners in statistics – Geospatial frame 49.1.1 Number of municipalities/provincial stakeholders
engaged in collaborative mapping Annually 4 4 reports on
municipalities/ provincial stakeholders engaged in collaborative mapping by March 2016
49.2.1 Number of technical documents/ reports to
improve the SIF Periodic 2
Report on verifying and updating the current frame by March 2016
Report on compiling geo- database for EA/PSU profile by March 2016
Partners in statistics – Statistical coordination 55.1.1 Number of SANSS partners provided with
statistical support Annually 2 Report on technical
support provided by September 2015
Report on technical support provided by March 2016
55.2.1 Number of assessment reports/data inventory
reports compiled Annually 1 Assessment report/data
inventory by March 2016
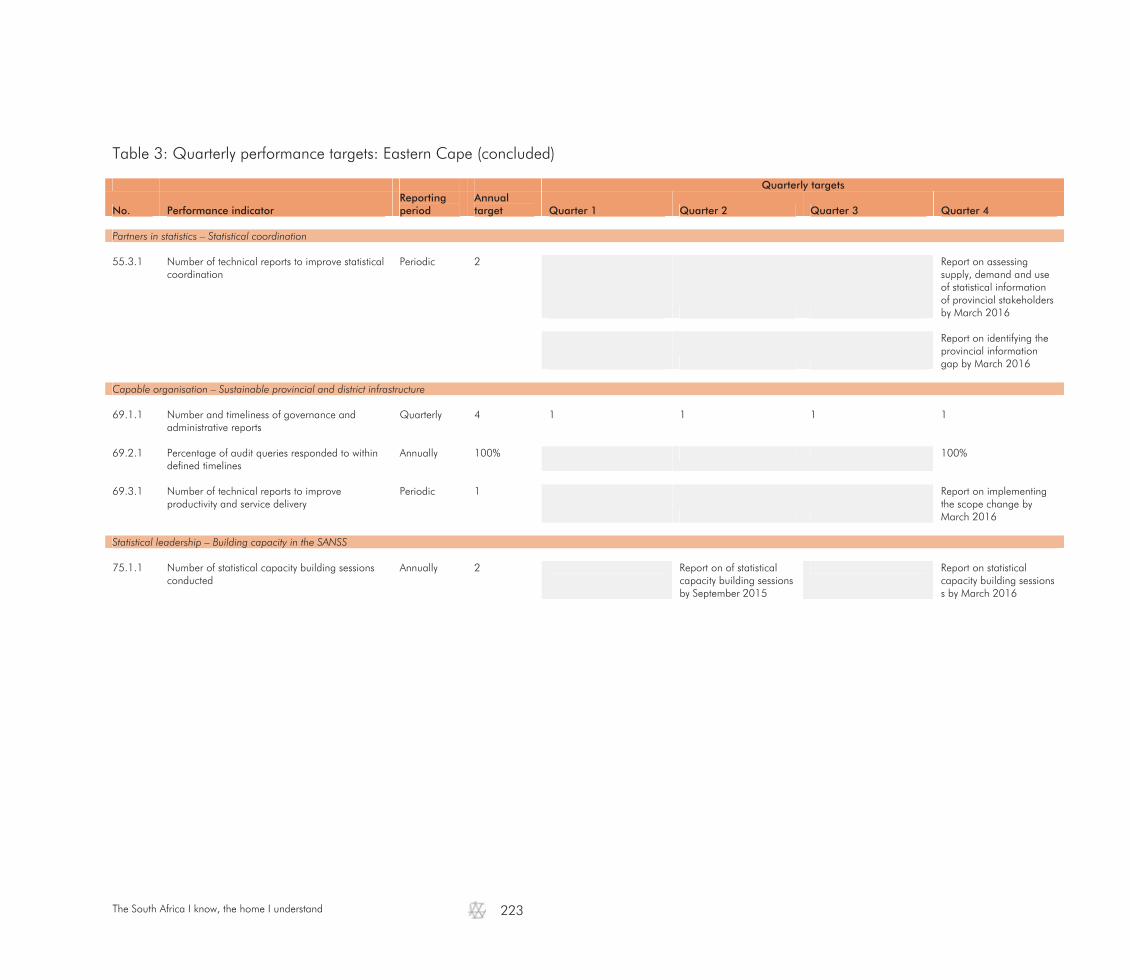
The South Africa I know, the home I understand
223
Table 3: Quarterly performance targets: Eastern Cape (concluded)
Quarterly targets
No. Performance indicator Reporting period
Annual target Quarter 1 Quarter 2 Quarter 3 Quarter 4
Partners in statistics – Statistical coordination 55.3.1 Number of technical reports to improve statistical
coordination Periodic 2
Report on assessing supply, demand and use of statistical information of provincial stakeholders by March 2016
Report on identifying the provincial information gap by March 2016
Capable organisation – Sustainable provincial and district infrastructure 69.1.1 Number and timeliness of governance and
administrative reports Quarterly 4 1 1 1 1
69.2.1 Percentage of audit queries responded to within
defined timelines Annually 100% 100%
69.3.1 Number of technical reports to improve
productivity and service delivery Periodic 1
Report on implementing the scope change by March 2016
Statistical leadership – Building capacity in the SANSS 75.1.1 Number of statistical capacity building sessions
conducted Annually 2 Report on of statistical
capacity building sessions by September 2015
Report on statistical capacity building sessions s by March 2016

The South Africa I know, the home I understand
224
Table 3: Quarterly performance targets: Free State
Quarterly targets
No. Performance indicator Reporting period
Annual target Quarter 1 Quarter 2 Quarter 3 Quarter 4
Trusted statistics – Plan, design, build, collect, process and disseminate 40.1.1 Response rate for quarterly household surveys
(QLFS) Quarterly 4 85% 85% 85% 85%
40.1.2 Response rate for household surveys (GHS,
VOCs, DTS & CS2016) Annually 4 85% 85% 85% 85%
40.2.1 Number of stakeholder workshops/consultations Annually 3 Stakeholder workshop by
June 2015 Stakeholder workshop by September 2015
Stakeholder workshop by March 2016
40.3.1 Number of fact sheets Quarterly 8 2 2 2 2 40.4.1 Number and timeliness of technical
documents/reports to improve the statistics value chain
Periodic 2
Report on conducting CS2016 with new methodologies by March 2016
Report on researching the state of quality to reduce the error rate by March 2016
Partners in statistics – Geospatial frame 49.2.1 Number of technical documents/reports to
improve the SIF Periodic 2
Report on verifying and updating the current frame in Free State by March 2016
Report on compiling geo- database for EA/PSU profile by March 2016

The South Africa I know, the home I understand
225
Table 3: Quarterly performance targets: Free State (concluded)
Quarterly targets
No. Performance indicator Reporting period
Annual target Quarter 1 Quarter 2 Quarter 3 Quarter 4
Partners in statistics – Statistical coordination 55.1.1 Number of SANSS partners provided with
statistical support Annually 4 1 1 1 1
55.2.1 Number of assessment reports/data inventory
reports compiled Annually 1 Assessment report/data
inventory by March 2016 55.3.1 Number of technical reports to improve statistical
coordination Periodic 2
Report on assessing supply, demand and use of statistical information of provincial stakeholders by March 2016
Report on identifying the provincial information gap by March 2016
Capable organisation – Sustainable provincial and district infrastructure 69.1.1 Number and timeliness of governance and
administrative reports Quarterly 4 1 1 1 1
69.2.1 Percentage of audit queries responded to within
defined timelines Annually 100% 100%
69.3.1 Number of technical reports to improve
productivity and service delivery Periodic 1
Report on implementing the scope change by March 2016
Statistical leadership – Building capacity in the SANSS 75.1.1 Number of statistical capacity building sessions
conducted Annually 9 2 2 2 3
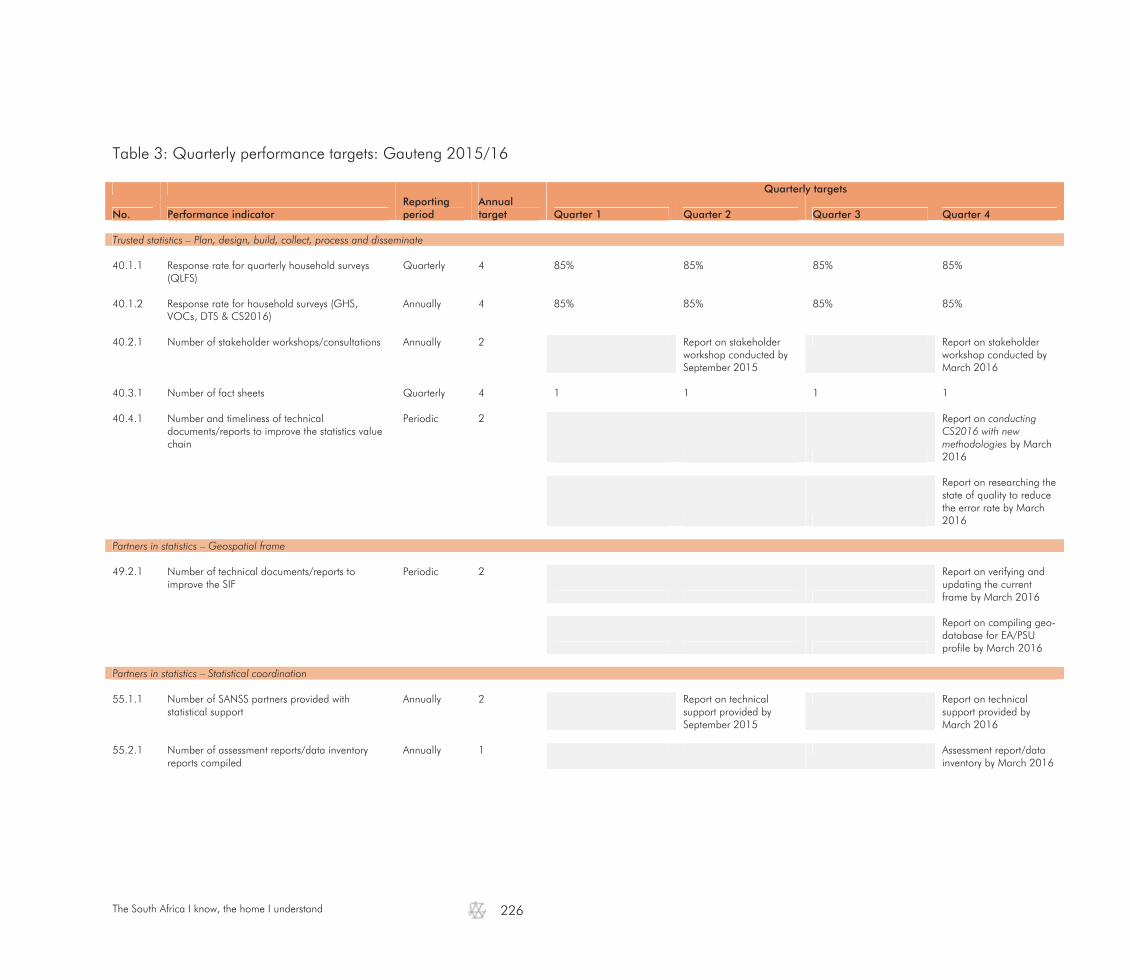
The South Africa I know, the home I understand
226
Table 3: Quarterly performance targets: Gauteng 2015/16
Quarterly targets
No. Performance indicator Reporting period
Annual target Quarter 1 Quarter 2 Quarter 3 Quarter 4
Trusted statistics – Plan, design, build, collect, process and disseminate 40.1.1 Response rate for quarterly household surveys
(QLFS) Quarterly 4 85% 85% 85% 85%
40.1.2 Response rate for household surveys (GHS,
VOCs, DTS & CS2016) Annually 4 85% 85% 85% 85%
40.2.1 Number of stakeholder workshops/consultations Annually 2 Report on stakeholder
workshop conducted by September 2015
Report on stakeholder workshop conducted by March 2016
40.3.1 Number of fact sheets Quarterly 4 1 1 1 1 40.4.1 Number and timeliness of technical
documents/reports to improve the statistics value chain
Periodic 2
Report on conducting CS2016 with new methodologies by March 2016
Report on researching the state of quality to reduce the error rate by March 2016
Partners in statistics – Geospatial frame 49.2.1 Number of technical documents/reports to
improve the SIF Periodic 2
Report on verifying and updating the current frame by March 2016
Report on compiling geo- database for EA/PSU profile by March 2016
Partners in statistics – Statistical coordination 55.1.1 Number of SANSS partners provided with
statistical support Annually 2 Report on technical
support provided by September 2015
Report on technical support provided by March 2016
55.2.1 Number of assessment reports/data inventory
reports compiled Annually 1 Assessment report/data
inventory by March 2016

The South Africa I know, the home I understand
227
Table 3: Quarterly performance targets: Gauteng 2015/16 (concluded)
Quarterly targets
No. Performance indicator Reporting period
Annual target Quarter 1 Quarter 2 Quarter 3 Quarter 4
Partners in statistics – Statistical coordination 55.3.1 Number of technical reports to improve statistical
coordination Periodic 2
Report on assessing supply, demand and use of statistical information of provincial stakeholders by March 2016
Report on identifying the provincial information gap by March 2016
Capable organisation – Sustainable provincial and district infrastructure 69.1.1 Number and timeliness of governance and
administrative reports Quarterly 4 1 1 1 1
69.2.1 Percentage of audit queries responded to within
defined timelines Annually 100% 100%
69.3.1 Number of technical reports to improve
productivity and service delivery Periodic 1
Report on implementing the scope change by March 2016
Statistical leadership – Building capacity in the SANSS 75.1.1 Number of statistical capacity building sessions
conducted Annually 2 Report on statistical
capacity building sessions by September 2015
Report on statistical capacity building sessions by March 2016
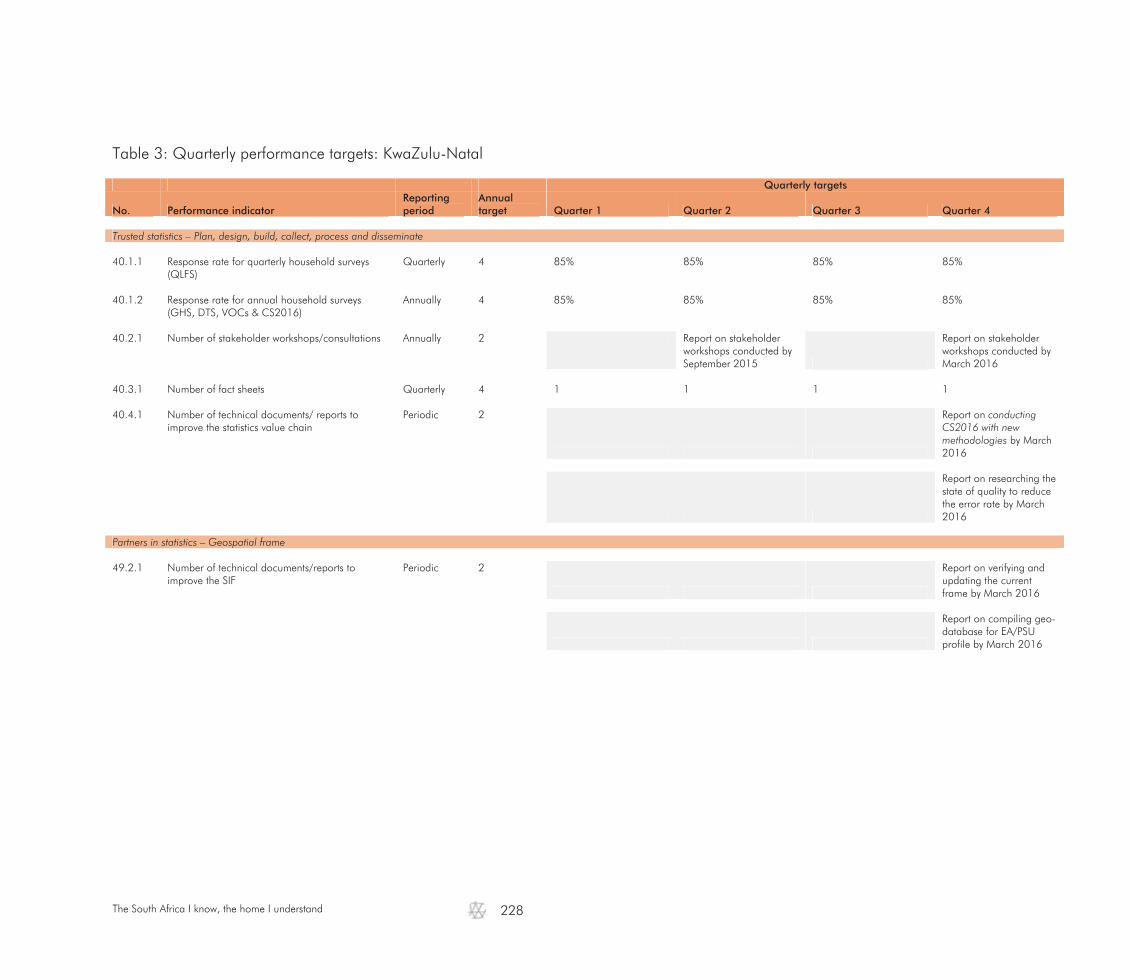
The South Africa I know, the home I understand
228
Table 3: Quarterly performance targets: KwaZulu-Natal
Quarterly targets
No. Performance indicator Reporting period
Annual target Quarter 1 Quarter 2 Quarter 3 Quarter 4
Trusted statistics – Plan, design, build, collect, process and disseminate 40.1.1 Response rate for quarterly household surveys
(QLFS) Quarterly 4 85% 85% 85% 85%
40.1.2 Response rate for annual household surveys
(GHS, DTS, VOCs & CS2016) Annually 4 85% 85% 85% 85%
40.2.1 Number of stakeholder workshops/consultations Annually 2 Report on stakeholder
workshops conducted by September 2015
Report on stakeholder workshops conducted by March 2016
40.3.1 Number of fact sheets Quarterly 4 1 1 1 1 40.4.1 Number of technical documents/ reports to
improve the statistics value chain Periodic 2
Report on conducting CS2016 with new methodologies by March 2016
Report on researching the state of quality to reduce the error rate by March 2016
Partners in statistics – Geospatial frame 49.2.1 Number of technical documents/reports to
improve the SIF Periodic 2
Report on verifying and updating the current frame by March 2016
Report on compiling geo- database for EA/PSU profile by March 2016
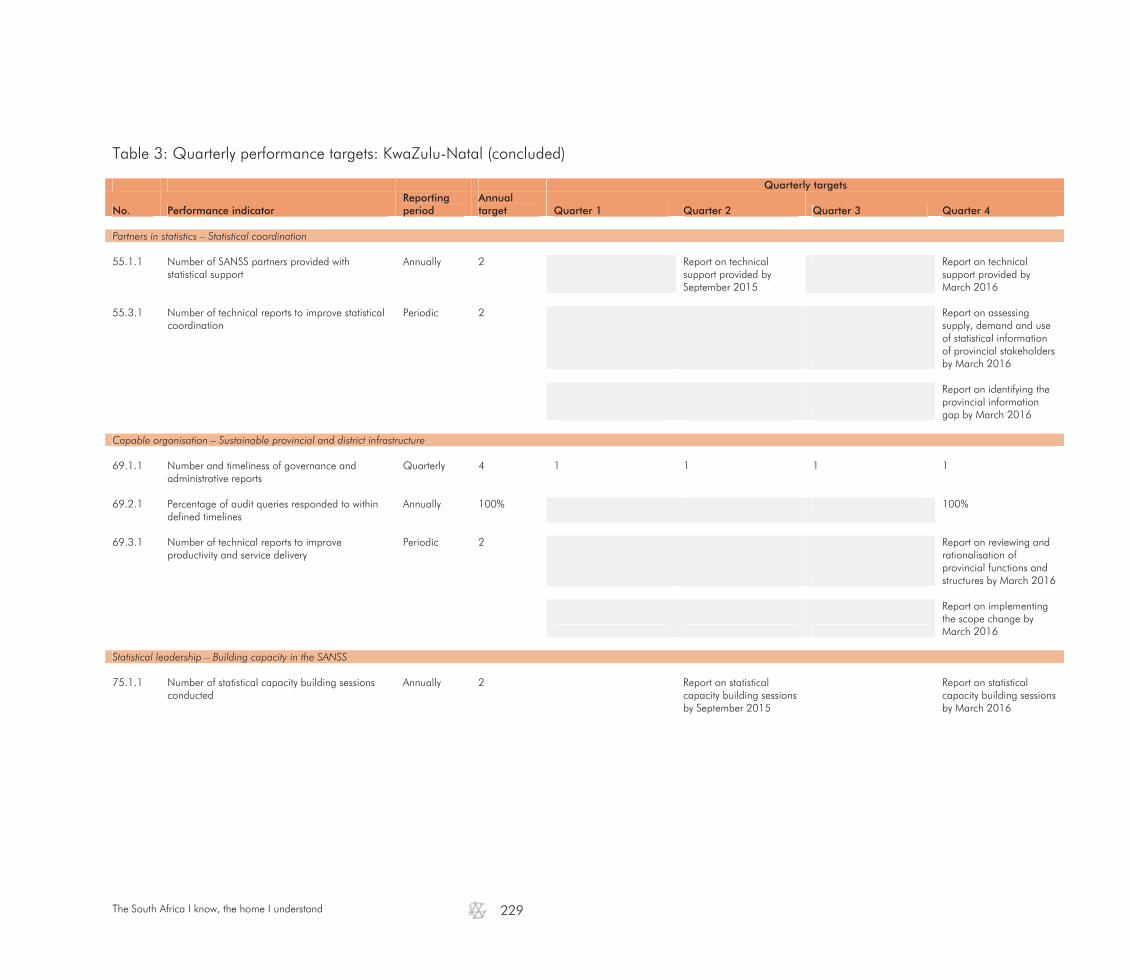
The South Africa I know, the home I understand
229
Table 3: Quarterly performance targets: KwaZulu-Natal (concluded)
Quarterly targets
No. Performance indicator Reporting period
Annual target Quarter 1 Quarter 2 Quarter 3 Quarter 4
Partners in statistics – Statistical coordination 55.1.1 Number of SANSS partners provided with
statistical support Annually 2 Report on technical
support provided by September 2015
Report on technical support provided by March 2016
55.3.1 Number of technical reports to improve statistical
coordination Periodic 2
Report on assessing supply, demand and use of statistical information of provincial stakeholders by March 2016
Report on identifying the provincial information gap by March 2016
Capable organisation – Sustainable provincial and district infrastructure 69.1.1 Number and timeliness of governance and
administrative reports Quarterly 4 1 1 1 1
69.2.1 Percentage of audit queries responded to within
defined timelines Annually 100% 100%
69.3.1 Number of technical reports to improve
productivity and service delivery Periodic 2
Report on reviewing and rationalisation of provincial functions and structures by March 2016
Report on implementing the scope change by March 2016
Statistical leadership – Building capacity in the SANSS 75.1.1 Number of statistical capacity building sessions
conducted Annually 2 Report on statistical
capacity building sessions by September 2015
Report on statistical capacity building sessions by March 2016
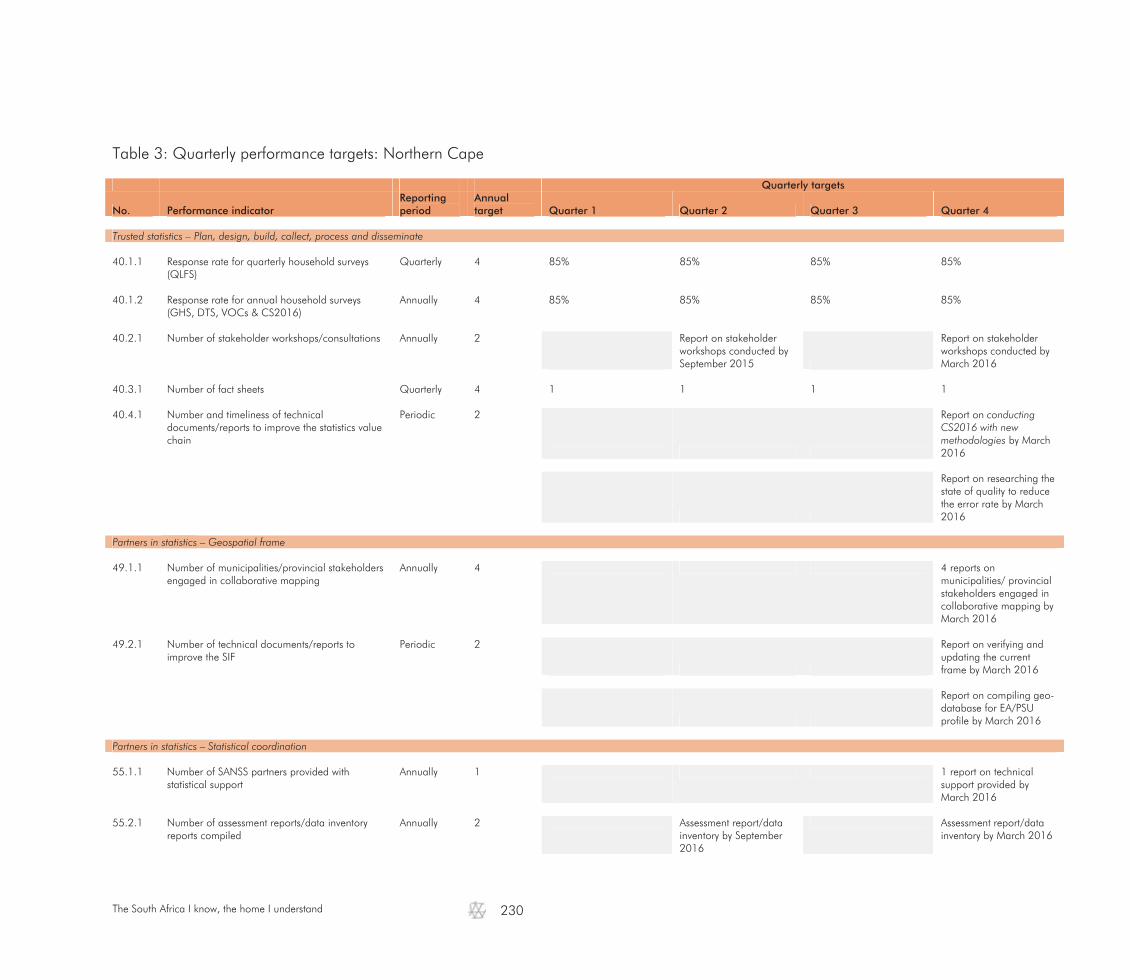
The South Africa I know, the home I understand
230
Table 3: Quarterly performance targets: Northern Cape
Quarterly targets
No. Performance indicator Reporting period
Annual target Quarter 1 Quarter 2 Quarter 3 Quarter 4
Trusted statistics – Plan, design, build, collect, process and disseminate 40.1.1 Response rate for quarterly household surveys
(QLFS) Quarterly 4 85% 85% 85% 85%
40.1.2 Response rate for annual household surveys
(GHS, DTS, VOCs & CS2016) Annually 4 85% 85% 85% 85%
40.2.1 Number of stakeholder workshops/consultations Annually 2
Report on stakeholder workshops conducted by September 2015
Report on stakeholder workshops conducted by March 2016
40.3.1 Number of fact sheets Quarterly 4 1 1 1 1 40.4.1 Number and timeliness of technical
documents/reports to improve the statistics value chain
Periodic 2
Report on conducting CS2016 with new methodologies by March 2016
Report on researching the state of quality to reduce the error rate by March 2016
Partners in statistics – Geospatial frame 49.1.1 Number of municipalities/provincial stakeholders
engaged in collaborative mapping Annually 4 4 reports on
municipalities/ provincial stakeholders engaged in collaborative mapping by March 2016
49.2.1 Number of technical documents/reports to
improve the SIF Periodic 2
Report on verifying and updating the current frame by March 2016
Report on compiling geo- database for EA/PSU profile by March 2016
Partners in statistics – Statistical coordination 55.1.1 Number of SANSS partners provided with
statistical support Annually 1 1 report on technical
support provided by March 2016
55.2.1 Number of assessment reports/data inventory
reports compiled Annually 2 Assessment report/data
inventory by September 2016
Assessment report/data inventory by March 2016
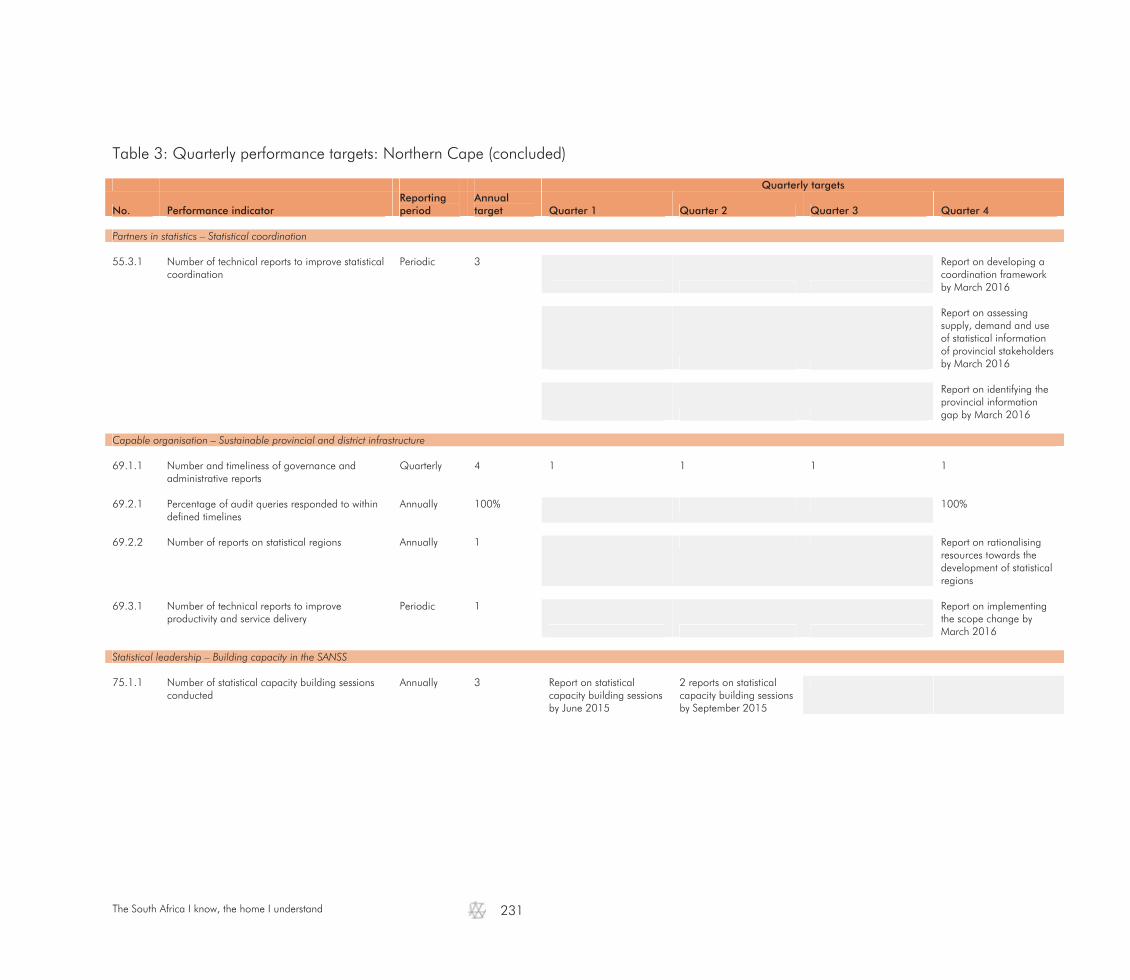
The South Africa I know, the home I understand
231
Table 3: Quarterly performance targets: Northern Cape (concluded)
Quarterly targets
No. Performance indicator Reporting period
Annual target Quarter 1 Quarter 2 Quarter 3 Quarter 4
Partners in statistics – Statistical coordination 55.3.1 Number of technical reports to improve statistical
coordination Periodic 3
Report on developing a coordination framework by March 2016
Report on assessing supply, demand and use of statistical information of provincial stakeholders by March 2016
Report on identifying the provincial information gap by March 2016
Capable organisation – Sustainable provincial and district infrastructure 69.1.1 Number and timeliness of governance and
administrative reports Quarterly 4 1 1 1 1
69.2.1 Percentage of audit queries responded to within
defined timelines Annually 100% 100%
69.2.2 Number of reports on statistical regions Annually 1 Report on rationalising
resources towards the development of statistical regions
69.3.1 Number of technical reports to improve
productivity and service delivery Periodic 1
Report on implementing the scope change by March 2016
Statistical leadership – Building capacity in the SANSS 75.1.1 Number of statistical capacity building sessions
conducted Annually 3 Report on statistical
capacity building sessions by June 2015
2 reports on statistical capacity building sessions by September 2015
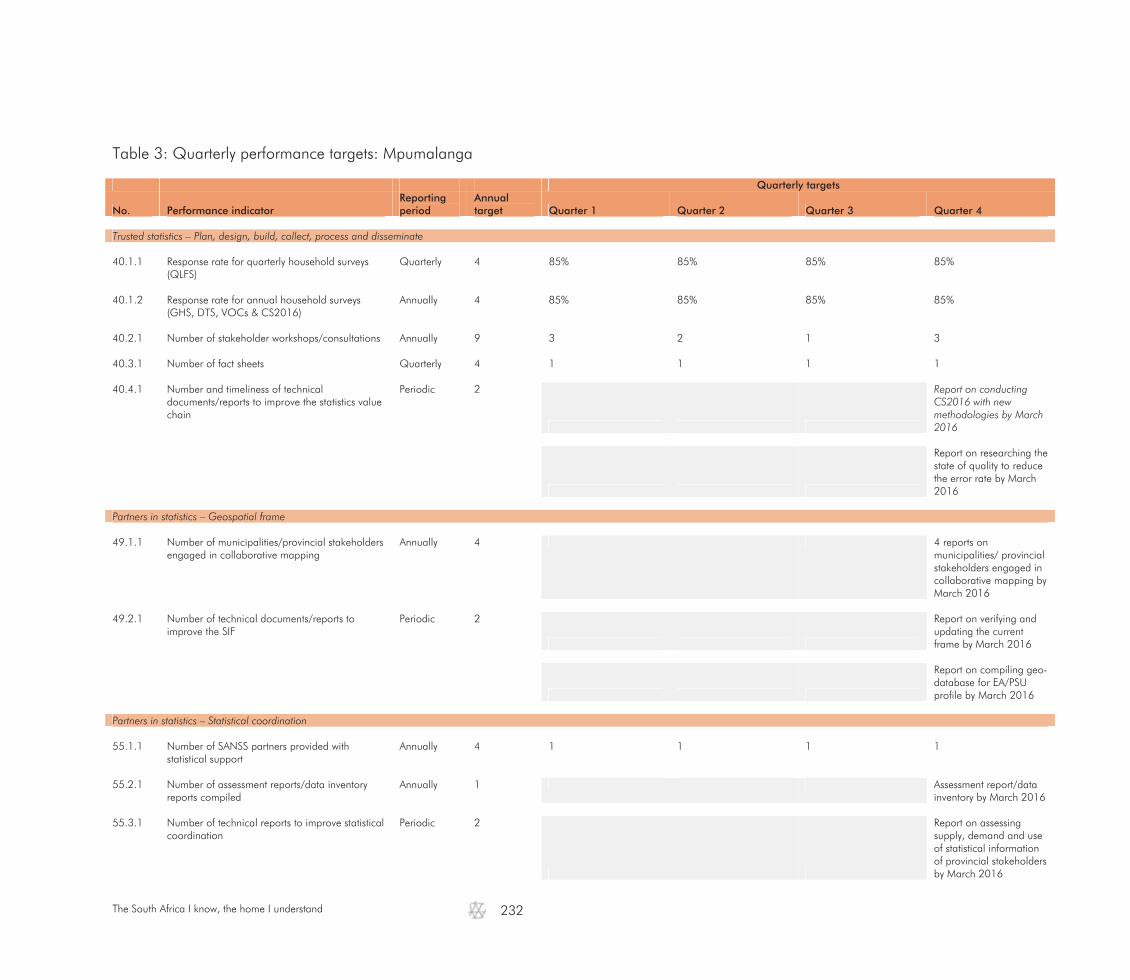
The South Africa I know, the home I understand
232
Table 3: Quarterly performance targets: Mpumalanga
Quarterly targets
No. Performance indicator Reporting period
Annual target Quarter 1 Quarter 2 Quarter 3 Quarter 4
Trusted statistics – Plan, design, build, collect, process and disseminate 40.1.1 Response rate for quarterly household surveys
(QLFS) Quarterly 4 85% 85% 85% 85%
40.1.2 Response rate for annual household surveys
(GHS, DTS, VOCs & CS2016) Annually 4 85% 85% 85% 85%
40.2.1 Number of stakeholder workshops/consultations Annually 9 3 2 1 3 40.3.1 Number of fact sheets Quarterly 4 1 1 1 1 40.4.1 Number and timeliness of technical
documents/reports to improve the statistics value chain
Periodic 2
Report on conducting CS2016 with new methodologies by March 2016
Report on researching the state of quality to reduce the error rate by March 2016
Partners in statistics – Geospatial frame 49.1.1 Number of municipalities/provincial stakeholders
engaged in collaborative mapping Annually 4 4 reports on
municipalities/ provincial stakeholders engaged in collaborative mapping by March 2016
49.2.1 Number of technical documents/reports to
improve the SIF Periodic 2
Report on verifying and updating the current frame by March 2016
Report on compiling geo- database for EA/PSU profile by March 2016
Partners in statistics – Statistical coordination 55.1.1 Number of SANSS partners provided with
statistical support Annually 4 1 1 1 1
55.2.1 Number of assessment reports/data inventory
reports compiled Annually 1 Assessment report/data
inventory by March 2016 55.3.1 Number of technical reports to improve statistical
coordination Periodic 2
Report on assessing supply, demand and use of statistical information of provincial stakeholders by March 2016

The South Africa I know, the home I understand
233
Table 3: Quarterly performance targets: Mpumalanga (concluded)
Quarterly targets
No. Performance indicator Reporting period
Annual target Quarter 1 Quarter 2 Quarter 3 Quarter 4
Partners in statistics – Statistical coordination 55.3.1 Number of technical reports to improve statistical
coordination (continued) Periodic 2
Report on identifying the provincial information gap by March 2016
Capable organisation – Sustainable provincial and district infrastructure 69.1 Number and timeliness of governance and
administrative reports Quarterly 4 1 1 1 1
69.2 Percentage of audit queries responded to within
defined timelines Annually 100% 100%
69.3 Number of technical reports to improve
productivity and service delivery Periodic 1
Report on implementing the scope change by March 2016
Statistical leadership – Building capacity in the SANSS 75.1.1 Number of statistical capacity building sessions
conducted Annually 2 Report on statistical
capacity building sessions by September 2015
Report on statistical capacity building sessions by March 2016
75.2.1 Number of technical reports to build capacity in
the SANSS Periodic 1
Framework for capacity building in the SANSS by March 2016
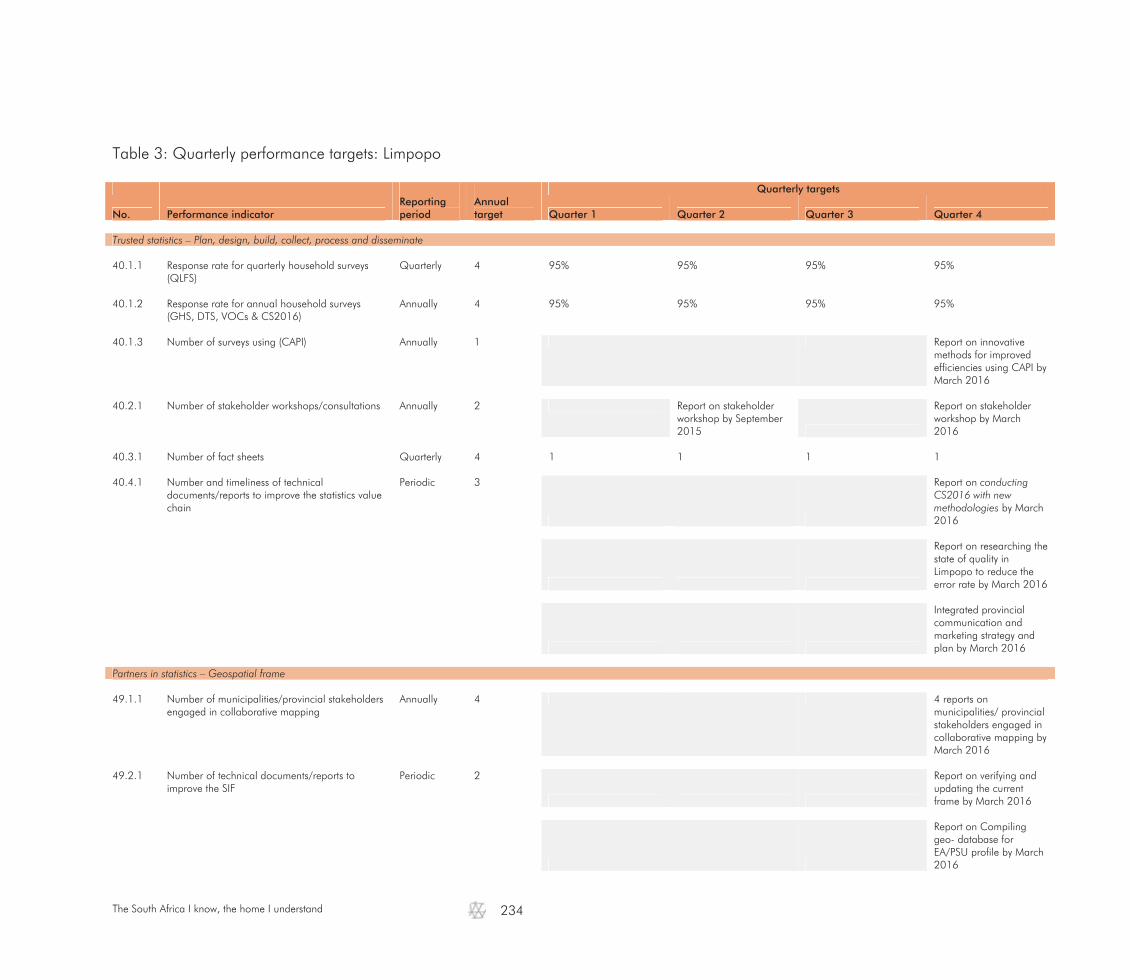
The South Africa I know, the home I understand
234
Table 3: Quarterly performance targets: Limpopo
Quarterly targets
No. Performance indicator Reporting period
Annual target Quarter 1 Quarter 2 Quarter 3 Quarter 4
Trusted statistics – Plan, design, build, collect, process and disseminate 40.1.1 Response rate for quarterly household surveys
(QLFS) Quarterly 4 95% 95% 95% 95%
40.1.2 Response rate for annual household surveys
(GHS, DTS, VOCs & CS2016) Annually 4 95% 95% 95% 95%
40.1.3 Number of surveys using (CAPI) Annually 1 Report on innovative
methods for improved efficiencies using CAPI by March 2016
40.2.1 Number of stakeholder workshops/consultations Annually 2 Report on stakeholder
workshop by September 2015
Report on stakeholder workshop by March 2016
40.3.1 Number of fact sheets Quarterly 4 1 1 1 1 40.4.1 Number and timeliness of technical
documents/reports to improve the statistics value chain
Periodic 3
Report on conducting CS2016 with new methodologies by March 2016
Report on researching the state of quality in Limpopo to reduce the error rate by March 2016
Integrated provincial communication and marketing strategy and plan by March 2016
Partners in statistics – Geospatial frame 49.1.1 Number of municipalities/provincial stakeholders
engaged in collaborative mapping Annually 4 4 reports on
municipalities/ provincial stakeholders engaged in collaborative mapping by March 2016
49.2.1 Number of technical documents/reports to
improve the SIF Periodic 2
Report on verifying and updating the current frame by March 2016
Report on Compiling geo- database for EA/PSU profile by March 2016
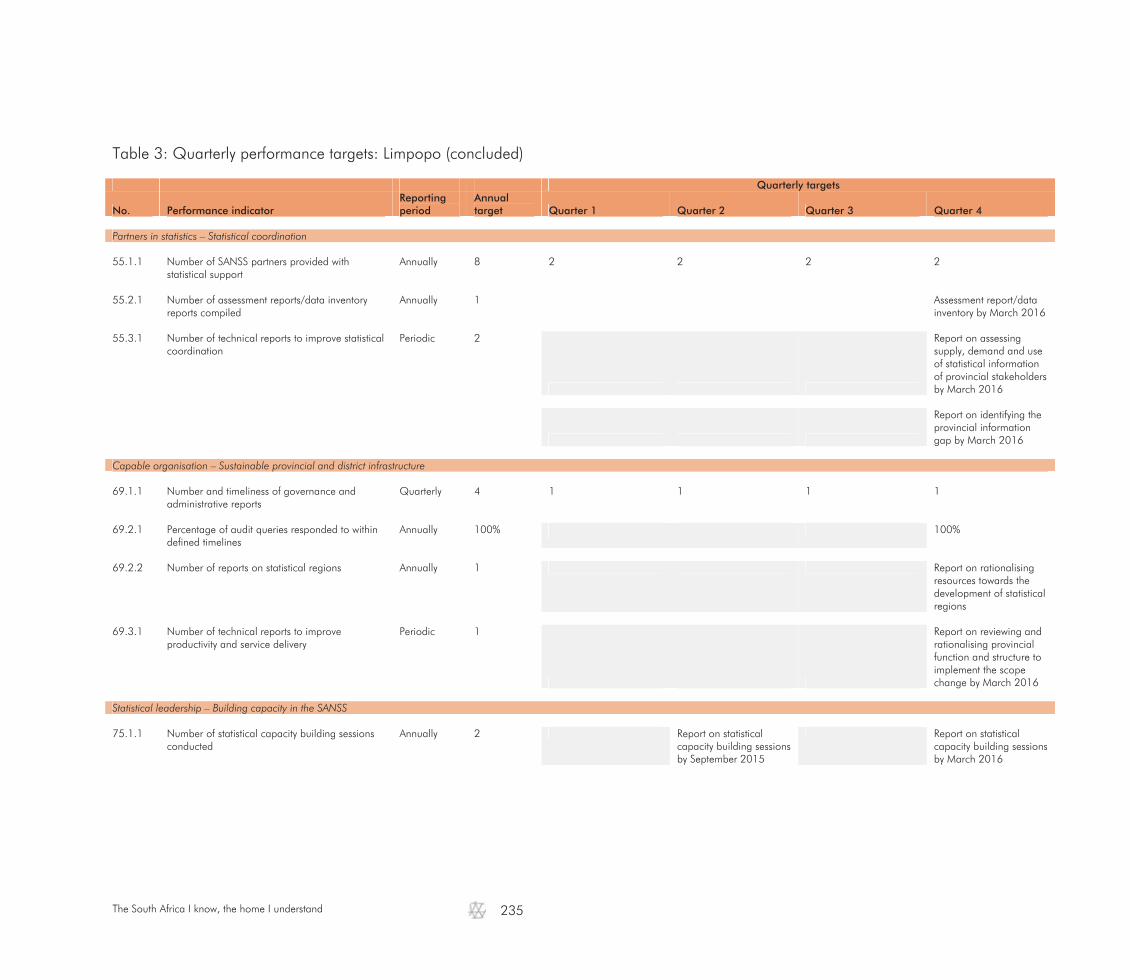
The South Africa I know, the home I understand
235
Table 3: Quarterly performance targets: Limpopo (concluded)
Quarterly targets
No. Performance indicator Reporting period
Annual target Quarter 1 Quarter 2 Quarter 3 Quarter 4
Partners in statistics – Statistical coordination 55.1.1 Number of SANSS partners provided with
statistical support Annually 8 2 2 2 2
55.2.1 Number of assessment reports/data inventory
reports compiled Annually 1 Assessment report/data
inventory by March 2016 55.3.1 Number of technical reports to improve statistical
coordination Periodic 2
Report on assessing supply, demand and use of statistical information of provincial stakeholders by March 2016
Report on identifying the provincial information gap by March 2016
Capable organisation – Sustainable provincial and district infrastructure 69.1.1 Number and timeliness of governance and
administrative reports Quarterly 4 1 1 1 1
69.2.1 Percentage of audit queries responded to within
defined timelines Annually 100% 100%
69.2.2 Number of reports on statistical regions Annually 1 Report on rationalising
resources towards the development of statistical regions
69.3.1 Number of technical reports to improve
productivity and service delivery Periodic 1
Report on reviewing and rationalising provincial function and structure to implement the scope change by March 2016
Statistical leadership – Building capacity in the SANSS 75.1.1 Number of statistical capacity building sessions
conducted Annually 2 Report on statistical
capacity building sessions by September 2015
Report on statistical capacity building sessions by March 2016
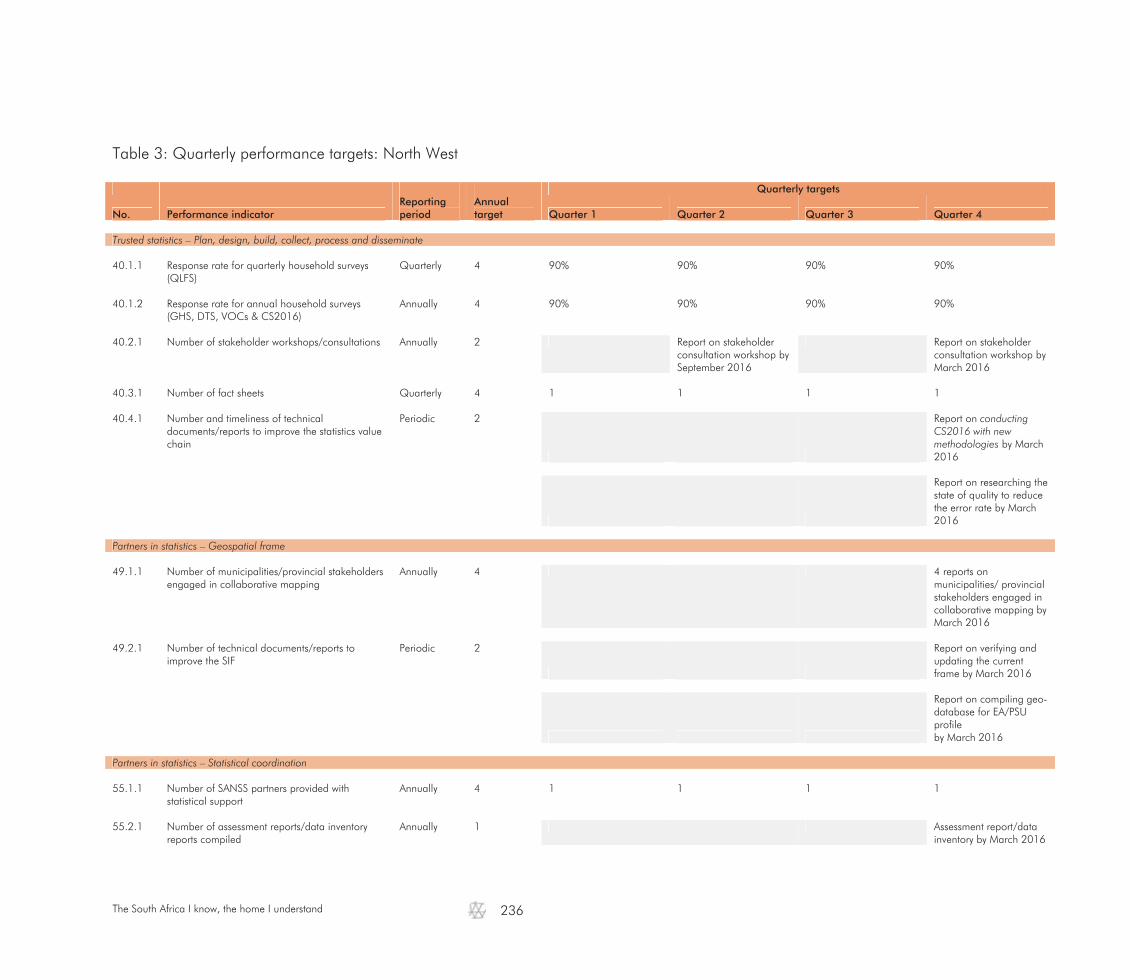
The South Africa I know, the home I understand
236
Table 3: Quarterly performance targets: North West
Quarterly targets
No. Performance indicator Reporting period
Annual target Quarter 1 Quarter 2 Quarter 3 Quarter 4
Trusted statistics – Plan, design, build, collect, process and disseminate 40.1.1 Response rate for quarterly household surveys
(QLFS) Quarterly 4 90% 90% 90% 90%
40.1.2 Response rate for annual household surveys
(GHS, DTS, VOCs & CS2016) Annually 4 90% 90% 90% 90%
40.2.1 Number of stakeholder workshops/consultations Annually 2 Report on stakeholder
consultation workshop by September 2016
Report on stakeholder consultation workshop by March 2016
40.3.1 Number of fact sheets Quarterly 4 1 1 1 1 40.4.1 Number and timeliness of technical
documents/reports to improve the statistics value chain
Periodic 2
Report on conducting CS2016 with new methodologies by March 2016
Report on researching the state of quality to reduce the error rate by March 2016
Partners in statistics – Geospatial frame 49.1.1 Number of municipalities/provincial stakeholders
engaged in collaborative mapping Annually 4 4 reports on
municipalities/ provincial stakeholders engaged in collaborative mapping by March 2016
49.2.1 Number of technical documents/reports to
improve the SIF Periodic 2
Report on verifying and updating the current frame by March 2016
Report on compiling geo- database for EA/PSU profile by March 2016
Partners in statistics – Statistical coordination 55.1.1 Number of SANSS partners provided with
statistical support Annually 4 1 1 1 1
55.2.1 Number of assessment reports/data inventory
reports compiled Annually 1 Assessment report/data
inventory by March 2016

The South Africa I know, the home I understand
237
Table 3: Quarterly performance targets: North West (concluded)
Quarterly targets
No. Performance indicator Reporting period
Annual target Quarter 1 Quarter 2 Quarter 3 Quarter 4
Partners in statistics – Statistical coordination 55.3.1 Number of technical reports to improve statistical
coordination Periodic 2
Report on assessing supply, demand and use of statistical information of provincial stakeholders by March 2016
Report on identifying the provincial information gap by March 2016
Capable organisation – Sustainable provincial and district infrastructure 69.1.1 Number and timeliness of governance and
administrative reports Quarterly 4 1 1 1 1
69.2.1 Percentage of audit queries responded to within
defined timelines Annually 100% 100%
69.2.2 Number of reports on statistical regions Annually 1 Report on rationalising
resources towards the development of statistical regions
69.3.1 Number of technical reports to improve
productivity and service delivery Periodic 1
Report on implementing the scope change by March 2016
Statistical leadership – Building capacity in the SANSS 75.1.1 Number of statistical capacity building sessions
conducted Quarterly 4 1 1 1 1
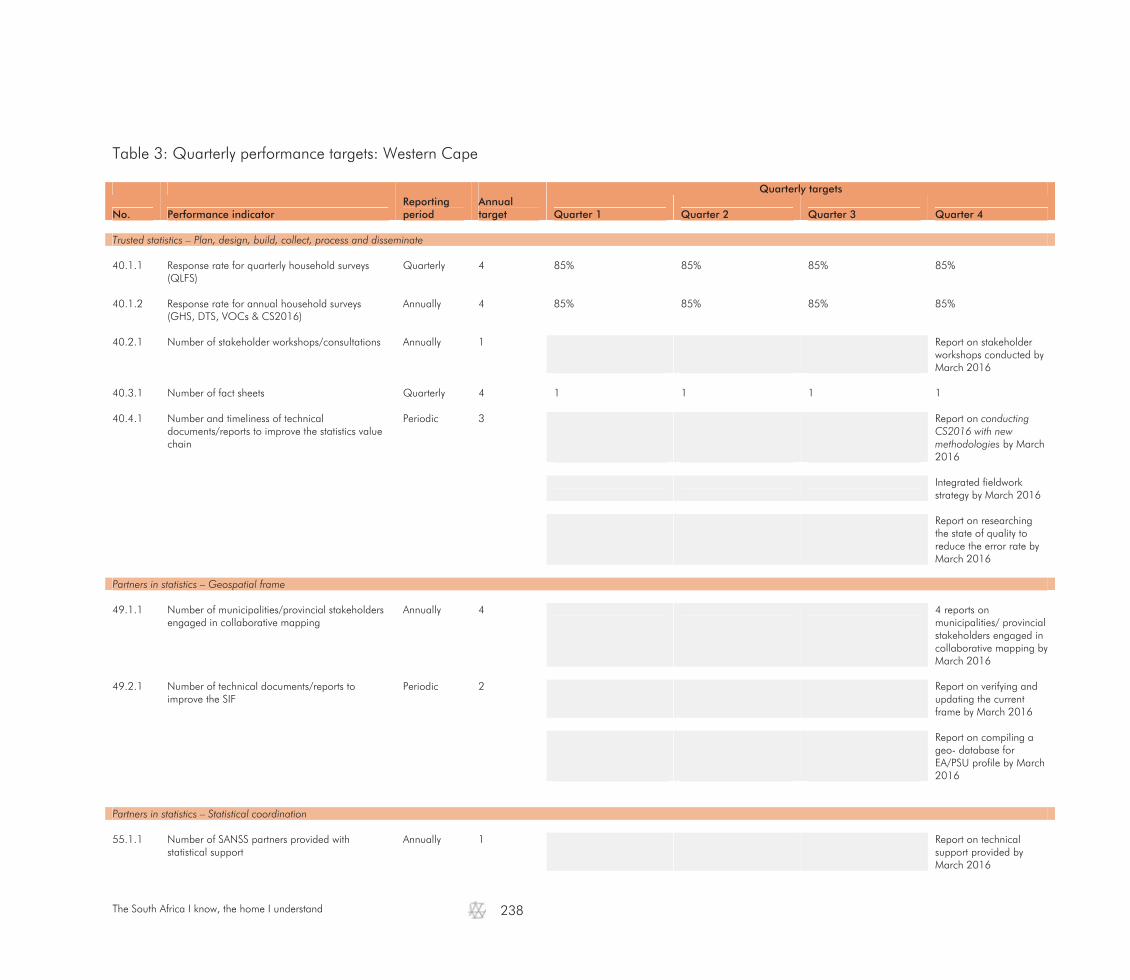
The South Africa I know, the home I understand
238
Table 3: Quarterly performance targets: Western Cape
Quarterly targets
No. Performance indicator Reporting period
Annual target Quarter 1 Quarter 2 Quarter 3 Quarter 4
Trusted statistics – Plan, design, build, collect, process and disseminate 40.1.1 Response rate for quarterly household surveys
(QLFS) Quarterly 4 85% 85% 85% 85%
40.1.2 Response rate for annual household surveys
(GHS, DTS, VOCs & CS2016) Annually 4 85% 85% 85% 85%
40.2.1 Number of stakeholder workshops/consultations Annually 1
Report on stakeholder workshops conducted by March 2016
40.3.1 Number of fact sheets Quarterly 4 1 1 1 1 40.4.1 Number and timeliness of technical
documents/reports to improve the statistics value chain
Periodic 3
Report on conducting CS2016 with new methodologies by March 2016
Integrated fieldwork strategy by March 2016
Report on researching the state of quality to reduce the error rate by March 2016
Partners in statistics – Geospatial frame 49.1.1 Number of municipalities/provincial stakeholders
engaged in collaborative mapping Annually 4 4 reports on
municipalities/ provincial stakeholders engaged in collaborative mapping by March 2016
49.2.1 Number of technical documents/reports to
improve the SIF Periodic 2
Report on verifying and updating the current frame by March 2016
Report on compiling a geo- database for EA/PSU profile by March 2016
Partners in statistics – Statistical coordination 55.1.1 Number of SANSS partners provided with
statistical support Annually 1 Report on technical
support provided by March 2016
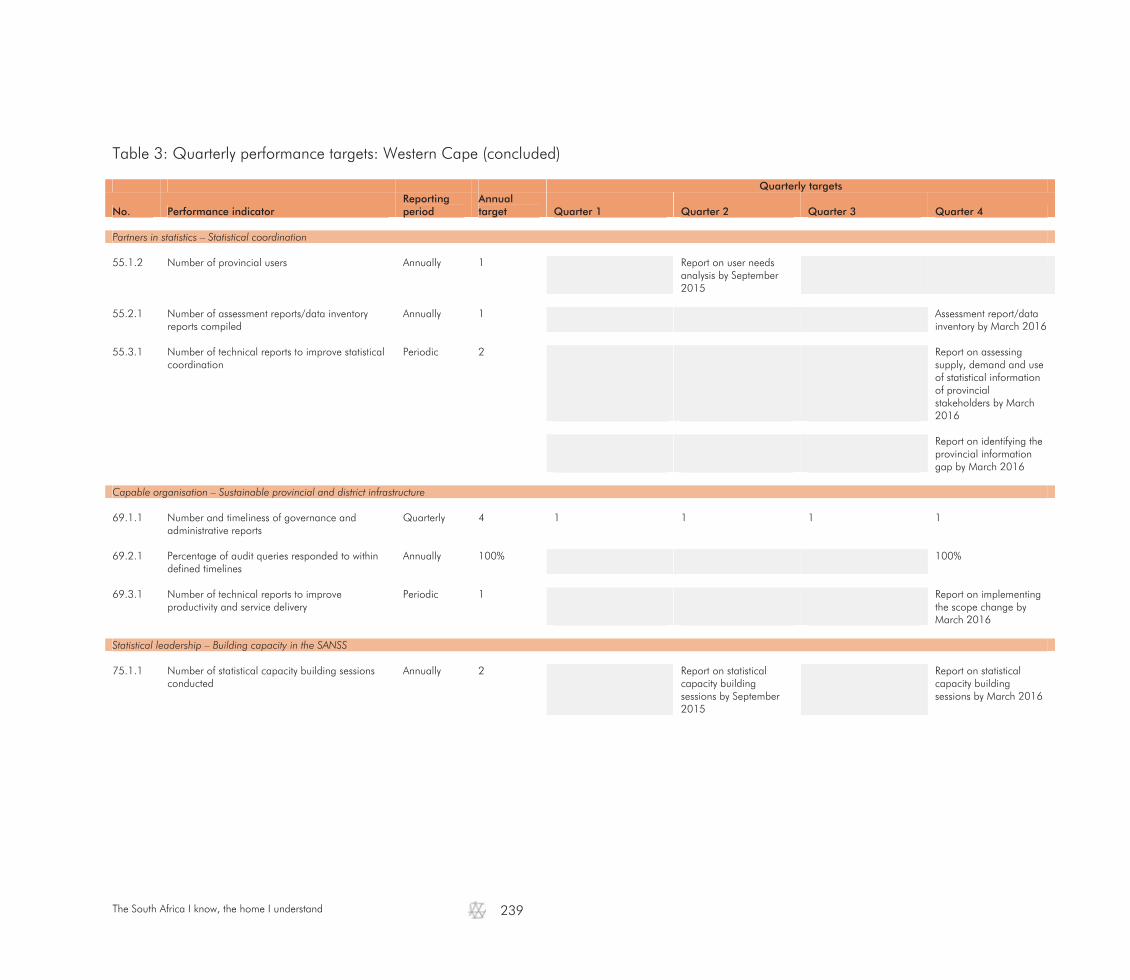
The South Africa I know, the home I understand
239
Table 3: Quarterly performance targets: Western Cape (concluded)
Quarterly targets
No. Performance indicator Reporting period
Annual target Quarter 1 Quarter 2 Quarter 3 Quarter 4
Partners in statistics – Statistical coordination 55.1.2 Number of provincial users Annually 1 Report on user needs
analysis by September 2015
55.2.1 Number of assessment reports/data inventory
reports compiled Annually 1 Assessment report/data
inventory by March 2016 55.3.1 Number of technical reports to improve statistical
coordination Periodic 2
Report on assessing supply, demand and use of statistical information of provincial stakeholders by March 2016
Report on identifying the provincial information gap by March 2016
Capable organisation – Sustainable provincial and district infrastructure 69.1.1 Number and timeliness of governance and
administrative reports Quarterly 4 1 1 1 1
69.2.1 Percentage of audit queries responded to within
defined timelines Annually 100% 100%
69.3.1 Number of technical reports to improve
productivity and service delivery Periodic 1
Report on implementing the scope change by March 2016
Statistical leadership – Building capacity in the SANSS 75.1.1 Number of statistical capacity building sessions
conducted Annually 2 Report on statistical
capacity building sessions by September 2015
Report on statistical capacity building sessions by March 2016
Stakeholders and the environmentChapter 4
The South Africa I know, the home I understand
242
4. Stakeholders and the environment
The preceding chapters focused on the importance of national statistics in South Africa, the long-term strategic objectives and priorities of the organisation, the plan to implement these strategies and the role of the provinces. This chapter focuses on stakeholders and their needs, the service delivery improvement plan, and the resource management plan to implement the strategy.
4.1 Statistics Council
Section 8 of the Statistics Act (Act No. 6 of 1999) provides for the establishment of a Statistics Council consisting of between 18 and 25 members, appointed by the Minister after consultation with the Cabinet. Members include one representative from each province, and nominated members from organs of state, producers of statistics, organised business and labour, specialist and research interests, economic and financial interests and the public The role of the Statistics Council can be summarised as follows:
a) Advise the Minister, the Statistician-General and other organs of state on statistical matters with regard to:
• The collection, processing, analysis, documentation, storage and dissemination of statistics, including the undertaking of a population census, and
• The elimination of unnecessary overlapping or duplication with regard to the collection or publication of statistics by organs of state;
b) Promote and safeguard official statistics and the coordination of statistical activities; c) Furnish the Minister and the Statistician-General with an annual report, which must be tabled in Parliament; and d) Issue public statements on any matter relating to its functions in terms of the Act, but only after consultation with the organ of state, business
or organisation involved.
4.2 Stakeholders and their needs
Stats SA interacts with a range of stakeholders from whom information is collected, and to whom information is supplied. Our key stakeholders include: • Government: National, provincial and local governments use statistical information to inform policy development and to measure the
impact of government programmes on economic and social development. Government is both a major user and a major supplier of data. There is a growing need for accurate statistical information at local government level. Except for the population census information, most of the statistical information produced by Stats SA is on a national and provincial level. The challenge for Stats SA is to develop alternative strategies with its NSS partners to meet this growing demand for small area statistics.

The South Africa I know, the home I understand
243
• The public: The public is mainly interested in basic information on the economy and society such as economic growth, employment,
inflation, and population dynamics. This information is largely communicated through the media. Stats SA's strategy strives to inspire confidence in the quality of these key measurements. The public also supplies data through household survey collections and the census. The challenge for Stats SA is to promote its information outputs to the general public in a manner that inspires them to participate willingly in household and other main surveys.
• The media: The media plays an important role in the publication of statistical information, both nationally and locally. Stats SA has
embarked on a communication and development strategy to empower key role players in the media arena. This ensures that the right information is published at the right time and that it is properly described and imparted in the appropriate form to the public.
• Business: The business community shares similar interests in quantitative information, and in principle, all economic variables are potential
subjects for comparison. Important indicators include employment and unemployment, the size of the market, and the rate at which prices are changing. Businesses are also important sources of statistical information. Reducing the burden of surveys on the business community continues to be an important factor in the design of statistical programmes. Convincing businesses of the importance of their information in arriving at economic and financial indicators remains a challenge.
• The academic sector: The academic sector uses statistical information for research, analysis and teaching purposes. While other users
require statistics to inform decision-making, the academic community is interested in how the data are generated and what the data show over time. The academic sector can play a strategic role in evaluating the quality of statistics produced, and promoting interest in statistics among students. The academic sector can also in future partner with local government to produce quality statistical information.
• Parliamentarians: Political representatives are responsible for entrenching and voicing the interests of their voters in Parliament and the
National Assembly. They are also interested in what statistics say about specific policies that were introduced by the democratic government of the day. Researchers in Parliament conduct research to obtain information on behalf of the political parties. Parliament's library collects and files political and national information that can be used by parliamentarians and visiting international delegates.
• Non-governmental organisations (NGOs): NGOs monitor the government's progress in many areas such as sustainable development and
service delivery. NGOs also work for the upliftment of communities and implement development projects. They can use census and other Stats SA data to monitor government's progress and to aid decision-making for their own projects.
• Constitutional institutions and major public entities: Constitutional institutions (such as the Commission on Gender Equality, the Financial
and Fiscal Commission, and the Public Protector) ensure that the major elements of the Constitution (Act No. 108 of 1996) are followed throughout the country. Major public entities (such as Eskom, Telkom, museums, etc.) work with government to provide infrastructure, service delivery and information on a national level.
• Foreign and international bodies: Official statistical information is an essential basis for mutual knowledge, comparison and trade among
countries. It is for this reason that Stats SA meets the international information requirements of bodies such as the IMF and ILO. Stats SA also has regular contact with other international statistical agencies to share professional expertise and experiences. This promotes the adoption of common concepts, standards, classifications and practices that support the international comparison of statistics. Stats SA plays a leading role in Africa in the development of statistics.

The South Africa I know, the home I understand
244
4.3 Service delivery improvement plan (SDIP)
Since 1994, government has targeted the acceleration of service delivery to communities. The major policy instrument in this regard has been the White Paper on the Transformation of the Public Service, 1995 (the Batho Pele principles). This policy sets out eight transformation priorities, among which transforming service delivery is regarded as key. The document provides a policy framework and practical implementation strategy for the improvement of service delivery. Stats SA's SDIP focuses on improving access to statistics and improving stakeholder management by:
• Defining response times with regard to requests for information;
• Formalising consultation arrangements with stakeholders;
• Communicating key statistical information through an emailed newsletter;
• Increasing transparency of statistical releases through the implementation of approved quality criteria as described in the South African Statistical Quality Assurance Framework (SASQAF);
• Increasing Stats SA's presence at university exhibitions and open days; and
• Conducting stakeholder workshops at provincial level for improved communication with stakeholders. To this end, a complaints mechanism was developed and a compendium of services document was published that describes the service delivery standards in terms of response times. Queries and complaints can be lodged on Stats SA's website and are responded to within the specified time frames. A concerted effort has been made by Stats SA to ensure that publications are published with comprehensive metadata to promote transparency, understanding and usage of data. Communication with stakeholders is encouraged through consultation and statistical literacy workshops, as well as exhibitions and presentations throughout the country.
4.3.1 Providing statistical information
Stats SA aims to assist and encourage informed decision-making, research and discussion within the state and the community by providing high-quality, objective, reliable and responsive statistical products and services. Thus, Stats SA provides a wide range of statistical information on economic and social matters to government, business and the community in general. The statistics are released in hard-copy paper and electronic publications, reports and other digital products such as PX Web. Stats SA's commitment to improved service delivery is described below:
a) User Information Services
User Information Services is the first point of direct contact with our customers who prefer face-to-face interface, telephonic/fax communication and/or email. This centre is the gateway to personal access to statistical information, especially if the information required is not easily retrieved from the website. Staff members are trained to handle telephone, email, fax and written enquiries. Customers can also approach User Information Services in the provinces to request prompt responses on published data. Stats SA can be contacted at 012 310 8600 for telephonic enquiries, 012 310 8500 for fax enquiries or [email protected] for email enquiries.
The South Africa I know, the home I understand
245
b) Subscription service
Stats SA's standard products can be acquired through subscription to specific established publications. Customers may indicate whether the publication should be emailed or posted to them free of charge.
c) Stats SA website
Stats SA publications and datasets can be viewed, accessed and downloaded free of charge from the Stats SA website at www.statsonline.gov.za. Statistical information is placed on the website at the exact time of release to ensure that everyone has equal access to information at the same time. A newsletter is emailed each week to inform stakeholders of the current activities and releases for the following week.
d) Personal visits
Customers can personally visit the Stats SA Head Office or any provincial Stats SA office to obtain access to statistical products and services. Head Office also provides a library facility to users. This facility is mainly used for research purposes.
e) Consultation
Stats SA's credibility rests on its ability to produce quality statistics that can stand up to public scrutiny. Through a better understanding of Stats SA's stakeholders, our interactions with suppliers and users of information are becoming more effective, ultimately leading to the portrayal of the organisation as a credible, responsive and reliable source of statistics. The outputs of surveys will be communicated in a way that is well understood by users and that meets their information needs. In addition Stats SA conducts annual stakeholder workshops, combining training and information-sharing about economic and social statistical data products. Stats SA also participates in exhibitions in an effort to increase awareness of what the organisation offers.
f) Openness and transparency
Stats SA has a catalogue of its reports and releases which is available in hard copy, as well as on the website. In addition, the website advertises releases planned for the forthcoming week, as well as all releases planned for the quarter. The weekly schedule indicates the specific time that the statistics will be released. The introduction of SASQAF is aimed at improving the quality of explanatory notes on reports and releases, thus improving the openness and transparency of releases.
The South Africa I know, the home I understand
246
4.3.2 Consultation arrangements: The Statistics Council, Advisory Committees, and the National Statistics System
The Statistics Council represents a range of stakeholders and users, and meets four times a year to provide advice to the Minister and the Statistician-General on statistical matters, including the needs of users. Council members are required to represent the needs of their constituencies and should therefore consult with them to ensure sound advice to the Minister and the Statistician-General. Stats SA has established a number of advisory committees comprising key stakeholders that meet periodically to advise on statistical series. Stats SA also conducts periodic workshops in order to seek advice, comments and suggestions from broader stakeholder groups. The National Statistics System cluster, in partnership with organs of state, aims at ensuring coherence in statistical information produced by different producers of statistics, and promotes the use of statistics in evidence-based decision-making.
4.4 Resource management plan
The Stats SA Head Office is located in Pretoria. There are nine provincial offices and sixty-three district offices in the process of being resourced and fully utilised. Provincial and district offices play a key role in user liaison and data collection at provincial and municipal levels. Stats SA has developed a number of strategies in support of the new strategic direction. Below is a summary of the ICT and human resource management strategies over the medium term.
4.4.1 Information Communication and Technology Strategy
Stats SA has over time become a knowledge-based driven organisation. Its core business is about data and information within a highly technological environment. The IT environment should be dynamic and must play a key role in improving the effectiveness and efficiency of the organisation. The strategy aims to ensure that ICT becomes a strategic enabler in the production and management of statistical information. It does not only address weaknesses in the current environment, but also provides for a stable, secure and reliable environment that keeps up with the fast changing technological developments. Since our business systems are generally not modern, integrated and consistent or flexible, the business modernisation strategy explicitly addresses our plans to modernise business systems, as well as the underlying enterprise wide infrastructure required.

The South Africa I know, the home I understand
247
ICT goals for 2015–2016: Goal 1 Delivery of reliable and highly available, secure, cost-effective ICT solutions and services to support business
operations The server and network infrastructure provides the backbone of all ICT services and systems. It is critical that this
infrastructure is stable, reliable, highly available and functional. Our key goals are to ensure ITS stability, reliability, and functionality
User-focused services delivered by ICT enables Statistics South Africa to fulfil its mission and to assist it to evolve into a more functional, effective and efficient organisation
ICT measures and exposes to scrutiny its service delivery costs, and seeks to benchmark these to those of similar organisations so that it may improve while complying with policies and striving towards achieving best practice
Goal 2 Optimise and automate ICT processes to improve efficiency To mature our ICT processes in order to achieve effective and timely service delivery, ensure standardisation of ICT
operations and improve efficiency within ICT Mobile fieldworkers need to access information from anywhere at any time
Goal 3 Alignment of business strategy with ICT initiatives By constantly engaging internal customers in order to understand their business needs/requirements to enable ICT to
provision these needs by accordingly planning its human capacity, budget allocation and prioritising of ICT operations Partnering with businesses as the technological service provider of choice Innovate by exploiting new technologies to deliver new business solutions Adopt broadband as a means of facilitating access of information in many different forms Provide electronic communications to facilitate cooperation and participation Promote focused world-class research, to create a strong and robust innovation chain, and to develop advanced human
resource capacity Goal 4 Implement efficient ICT governance
Provide the necessary structures to effectively manage the use of ICT Develop appropriate policies, processes, procedures and standards
Goal 5 Personnel management development, recruitment and retention of skilled ICT personnel Ability to deliver end-to-end ICT solutions and services necessitates technically competent ICT personnel For ICT to realise value from its human capital investment, constant enhancement of knowledge and skills is required
Goal 6 Financial management The effective and efficient management of ICT's financial resources to facilitate the achievement of business objectives Avoid costly hardware upgrades through effective capacity planning and performance tuning
4.4.2 Human Resource Management Strategy
Delivering high-quality statistical information is dependent on a highly qualified, motivated workforce and skilled staff complement. Stats SA has developed a Human Resource Plan that is geared towards attracting and retaining the best people. The overall aim of the strategy is to become an employer of choice by maintaining a highly qualified and motivated workforce and to provide an environment to support them.
The South Africa I know, the home I understand
248
HRM goals for 2015–2016:
Goal 1: Recruit and retain scarce skills Goal 2: Align organisational structure to strategy Goal 3: Provide support to ad hoc projects Goal 4: Roll out a transformation and change management programme Goal 5: Build labour relations management capacity Goal 6: Build human capacity in the organisation Goal 7: Strengthen employee wellness and assistance programmes Goal 8: Maintain remuneration equity Goal 9: Institutionalise talent management
4.5 Long-term infrastructure plans
4.5.1 Background
Stats SA registered its building project as a Public Private Partnership (PPP) with National Treasury in August 2010 and this was followed by feasibility study which was conducted by the organisation and approved by National Treasury in February 2011. The procurement phase was then initiated which led to the advertisement of the bid in June 2011 and resultantly the appointment of the three preferred bidders in 2012. The three preferred bidders were then issued with Requests for Proposals (RFP) documents which led to the official appointment of Dipalopalo Consortium as the preferred bidder to build the new Stats SA home. Thereafter an intensive negotiation process was undertaken which led to the signing of the PPP agreement on 1 April 2014 and the financial close on 16 April 2014. The construction phase commenced on 20 May 2014 and the scheduled date of occupation is 1 June 2016.
4.5.2 Progress
Construction of the new building for the Stats SA Head Office is progressing well and on schedule. Bulk earthworks, excavation and pilling have been completed. Construction of slabs and columns for basement 2 and 1 has also been completed and construction works of the ground floor of the building have commenced. The Passenger Rail Agency of South Africa (PRASA) power line that was positioned across Stats SA site have been removed from the site and relocated to an adjacent site. The department is in a process of finalising detailed space planning exercise with the consortium. A total of 22 detailed design packages have been reviewed and concluded and the department is in continuous consultation with the consortium to finalise details on finishes, Information Communication Technology (ICT), security and operational items. This process aims to assess, finalise and sign off on detailed design plans and layouts which inform the construction work in line with the specifications. Total hours worked on site have been declared injury free hours and as at January 2015. An environment assessment conducted by an independent environment control officer certified the construction works 96% compliant.
4.5.3 Financial implications
The feasibility study indicated that the project is affordable and demonstrated value for money and risk transfer within the project. The capital contribution of R617 million has been made available over a two-year construction period (2014/15 and 2015/16).


Annexures
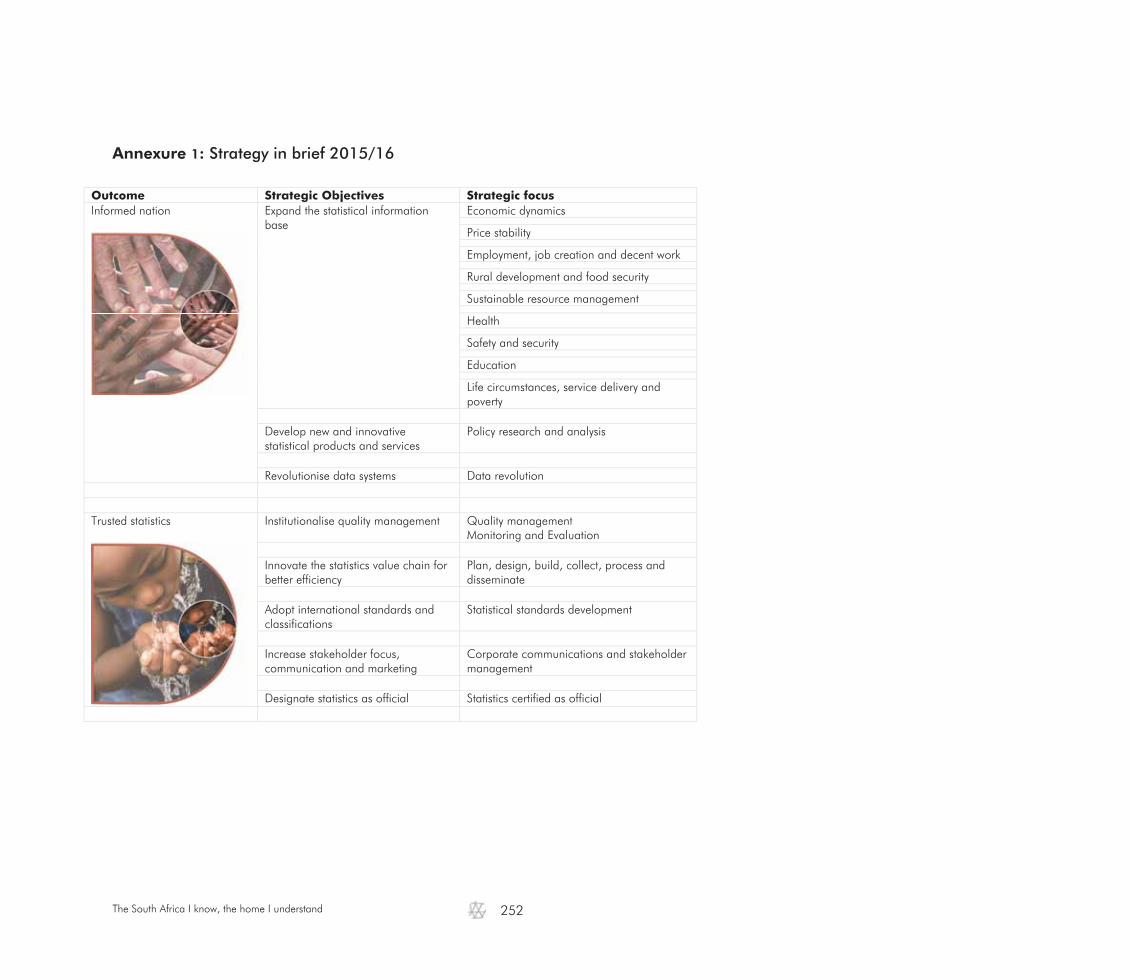
The South Africa I know, the home I understand
252
Annexure 1: Strategy in brief 2015/16
Outcome Strategic Objectives Strategic focusInformed nation
Expand the statistical information base
Economic dynamics
Price stability
Employment, job creation and decent work
Rural development and food security
Sustainable resource management
Health
Safety and security
Education
Life circumstances, service delivery and poverty
Develop new and innovative statistical products and services
Policy research and analysis
Revolutionise data systems Data revolution
Trusted statistics
Institutionalise quality management Quality management Monitoring and Evaluation
Innovate the statistics value chain for better efficiency
Plan, design, build, collect, process and disseminate
Adopt international standards and classifications
Statistical standards development
Increase stakeholder focus, communication and marketing
Corporate communications and stakeholder management
Designate statistics as official Statistics certified as official

The South Africa I know, the home I understand
253
Outcome Strategic Objectives Strategic focusPartners in statistics
Strengthen collaboration and build statistical sampling frames
Geospatial frame and services
Business register Lead the development and coordination of the national statistical system in SA
Economic and social statistics subsystems
Information management in the SANSS
Statistical reporting
Statistical support and advice Strengthen international collaboration and partnership and lead statistical development in Africa
International collaboration and partnerships
Statistical development in Africa
A capable organisation
Drive legislative reform Drive legislative reform of the statistical production and coordination environment
Enhance corporate governance and administration
Strategic planning, reporting and monitoring
Programme and project management
Internal Audit
Corporate Governance
Financial administration and management
Human resource management
Facilities management, logistics and security Become the employer of choice Talent management and employee wellness Invest in ICT to align to organisational growth
Server and network environment, end user support, ICT security and risk management
Modernise and innovate business processes Invest in a sustainable and responsive statistical infrastructure
Sustainable provincial and district infrastructure

The South Africa I know, the home I understand
254
Outcome Strategic Objectives Strategic focusStatistical leadership
Invest in statistical leadership and management
Statistical leadership and management
Invest in building statistical capability and competence
Statistical literacy at schools level Statistical capability at tertiary level Building capacity inside Stats SA Building capacity in the SANSS
Build a united and diverse organisation
Transformation and change

The South Africa I know, the home I understand
255
Annexure 2: African Charter on Statistics
The Charter outlines what should be achieved and in this regard, the African Statistics System (ASS) organisations, African statisticians and all those operating in the field of statistics at the national, regional and continental levels shall respect the principles enshrined in the Resolution on the fundamental principles of official statistics adopted by the United Nations Commission for Statistics in April 1994. They shall also apply the best practices principles hereunder defined:
Principle 1: Professional independence
Scientific independence: Statistics authorities must be able to carry out their activities according to the principle of scientific independence, particularly vis-à-vis the political authorities or any interest group; this means that the methods, concepts and nomenclatures used in statistical operation shall be selected only by the Statistics authorities without any interference whatsoever and in accordance with the rules of ethics and good practice.
Impartiality: Statistics authorities shall produce, analyse, disseminate, and comment on African statistics in line with the principle of scientific independence, and in an objective, professional and transparent manner.
Responsibility: Statistics authorities and African statisticians shall employ unambiguous and relevant methods in the collection, processing, analyses and presentation of statistical data. Statistical authorities shall also have the right and duty to make observations on erroneous interpretations and improper use of the statistical information that they disseminate.
Transparency: To facilitate proper interpretation of data, Statistics authorities shall provide information on their sources, methods and procedures that have been used in line with scientific standards. The domestic law governing operation of the statistical systems must be made available to the public.
Principle 2: Quality
Relevance: African statistics shall meet the needs of users.
Sustainability: African statistics shall be conserved in as detailed as possible a form to ensure their use by future generations, while preserving the principles of confidentiality and protection of respondents.
Data sources: Data used for statistical purposes may be collected from diverse sources such as censuses, statistics surveys and/or administrative records. The statistics organisations shall choose their sources in consideration of the quality of data offered by such sources and their topicality, particularly the costs incurred by the respondents and sponsors. The use by statistics authorities of administrative records for statistical purposes shall be guaranteed by domestic law, provided that confidentiality is preserved.
Accuracy and reliability: African statistics shall be an accurate and reliable reflection of the reality.
Continuity: Statistics authorities shall ensure continuity and comparability of statistical information over time.

The South Africa I know, the home I understand
256
Coherence and comparability: African statistics shall be internally coherent over time and allow for comparison between regions and countries. To this end, these statistics shall make combined use of related data derived from different sources. They shall employ internationally recognised and accepted concepts, classifications, terminologies and methods.
Timeliness: African statistics shall be disseminated in good time and, as far as possible, according to pre-determined calendar.
Topicality: African statistics shall reflect current and topical events and trends.
Specificities: Statistiscal data production and analytical methods shall take into account African peculiarities.
Awareness-building: State Parties shall sensitise the public, particularly statistical data providers, on the importance of statistics.
Principle 3: Mandate for data collection and resources
Mandate: Statistics authorities shall be endowed with a clear legal mandate empowering them to collect data for production of African statistics. At the request of statistics authorities, public administrations, business establishments, households and the general public may be compelled by domestic law to allow access to the data in their possession or provide data for the purpose of compilation of African statistics.
Resource adequacy: As far as possible, the resources available to Statistics authorities shall be adequate and stable to enable them to meet statistics needs at national, regional and continental levels. Governments of State Parties shall have the primary responsibility to provide such resources.
Cost-effectiveness: Statistics authorities shall use the resources so provided effectively and efficiently. This presupposes, in particular, that operations shall as far as possible, be programmed in an optimal manner. Every effort shall be made to achieve improved production and use of the statistics derived from administrative records, to reduce the costs incurred by respondents and, as far as possible, avoid expensive direct statistical surveys.
Principle 4: Dissemination
Accessibility: African statistics shall not be made inaccessible in any way whatsoever. This concomitant right of access for all users without restriction shall be guaranteed by domestic law. Micro-data may be made available to users on condition that the pertinent laws and procedures are respected and confidentiality is maintained.
Dialogue with users: Mechanisms for consultation with all African statistics users without discrimination shall be put in place with a view to ensuring that the statistical information offered are commensurate with their needs.
Clarity and understanding: Statistics shall be presented in a clear and comprehensible form. They shall be disseminated in a practical and appropriate manner, be available and accessible to all and accompanied by the requisite metadata and analytical commentaries.
The South Africa I know, the home I understand
257
Simultaneity: African Statistics shall be disseminated in a manner that ensures that all users are able to use them simultaneously. Where certain authorities receive advance information under embargo, to allow them time to respond to possible questions, public announcement shall be made indicating the nature of such information, the identity of the recipients and the set timeframe before its public dissemination.
Correction: Statistics authorities shall correct publications containing significant errors using standard statistical practices or, for very serious cases, suspend dissemination of such statistics. In that event, the users shall be informed in clear terms of the reasons for such corrections or suspension.
Principle 5: Protection of individual data, information sources and respondents
Confidentiality: National Statistics authorities, African statisticians and all those operating in the field of statistics in Africa shall absolutely guarantee the protection of the private life and business secrets of data providers (households, companies, public institutions and other respondents), the confidentiality of the information so provided and the use of such information for strictly statistical purposes.
Giving assurances to data providers: Persons or entities interviewed during statistical surveys shall be informed of the objective of such interviews and of the measures put in place to protect the data provided.
Objective: Data concerning individuals or entities collected for statistical purposes shall in no circumstance be used for judicial proceedings or punitive measures or for the purpose of taking administrative decisions against such individuals or entities.
Rationality: Statistics authorities shall not embark upon statistical surveys except where pertinent information is unavailable from administrative records or the quality of such information is inadequate in relation to the quality requirements of statistical information.
Principle 6: Coordination and cooperation
Coordination: Coordination and collaboration amongst Statistics authorities in a given country are essential in ensuring unicity, quality and harmonious statistical information. Similarly, coordination and dialogue amongst all Members of the African Statistical System are vital for harmonisation, production and use of African statistics.
Cooperation: Bilateral and multilateral statistics cooperation shall be encouraged with a view to upgrading African statistics production systems.
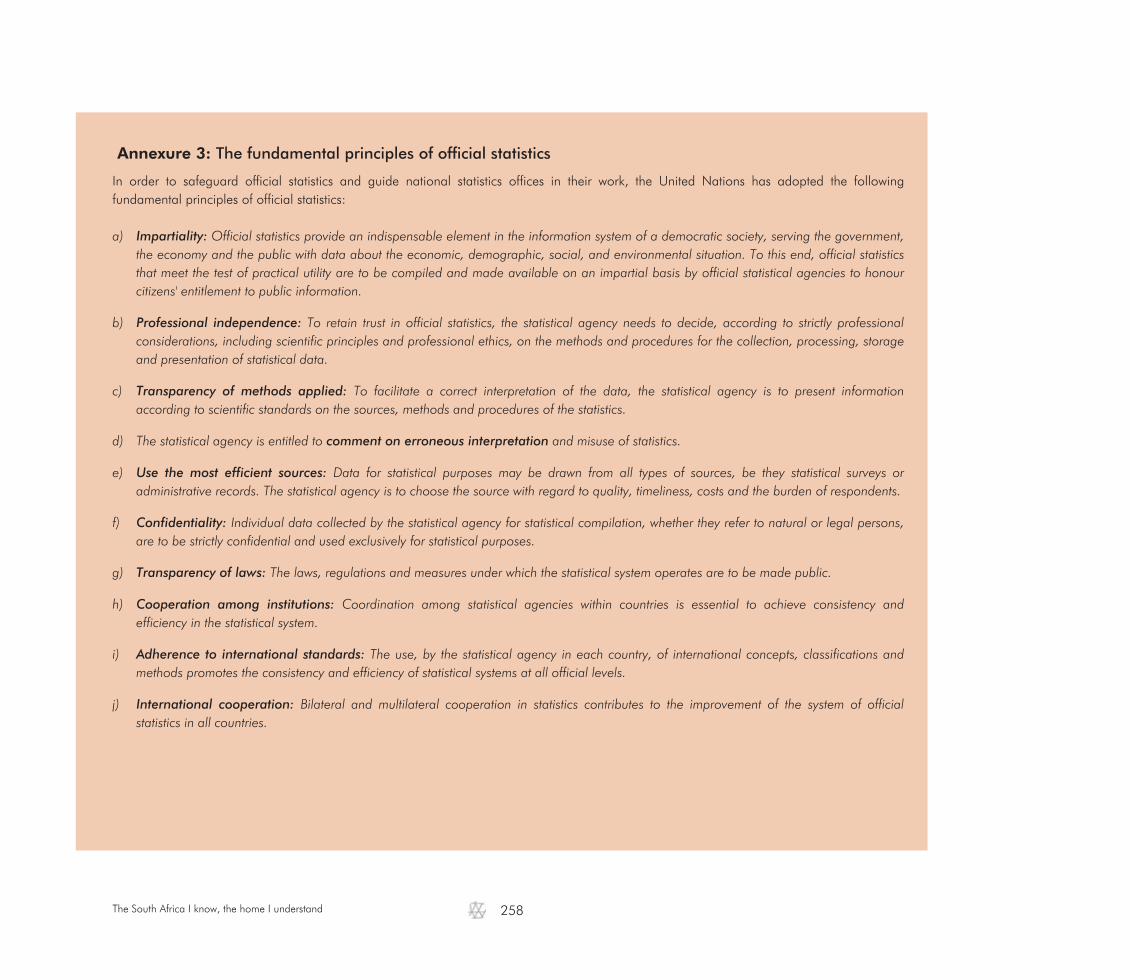
The South Africa I know, the home I understand
258
Annexure 3: The fundamental principles of official statistics
In order to safeguard official statistics and guide national statistics offices in their work, the United Nations has adopted the following fundamental principles of official statistics: a) Impartiality: Official statistics provide an indispensable element in the information system of a democratic society, serving the government,
the economy and the public with data about the economic, demographic, social, and environmental situation. To this end, official statistics that meet the test of practical utility are to be compiled and made available on an impartial basis by official statistical agencies to honour citizens' entitlement to public information.
b) Professional independence: To retain trust in official statistics, the statistical agency needs to decide, according to strictly professional considerations, including scientific principles and professional ethics, on the methods and procedures for the collection, processing, storage and presentation of statistical data.
c) Transparency of methods applied: To facilitate a correct interpretation of the data, the statistical agency is to present information according to scientific standards on the sources, methods and procedures of the statistics.
d) The statistical agency is entitled to comment on erroneous interpretation and misuse of statistics.
e) Use the most efficient sources: Data for statistical purposes may be drawn from all types of sources, be they statistical surveys or administrative records. The statistical agency is to choose the source with regard to quality, timeliness, costs and the burden of respondents.
f) Confidentiality: Individual data collected by the statistical agency for statistical compilation, whether they refer to natural or legal persons, are to be strictly confidential and used exclusively for statistical purposes.
g) Transparency of laws: The laws, regulations and measures under which the statistical system operates are to be made public.
h) Cooperation among institutions: Coordination among statistical agencies within countries is essential to achieve consistency and efficiency in the statistical system.
i) Adherence to international standards: The use, by the statistical agency in each country, of international concepts, classifications and methods promotes the consistency and efficiency of statistical systems at all official levels.
j) International cooperation: Bilateral and multilateral cooperation in statistics contributes to the improvement of the system of official statistics in all countries.
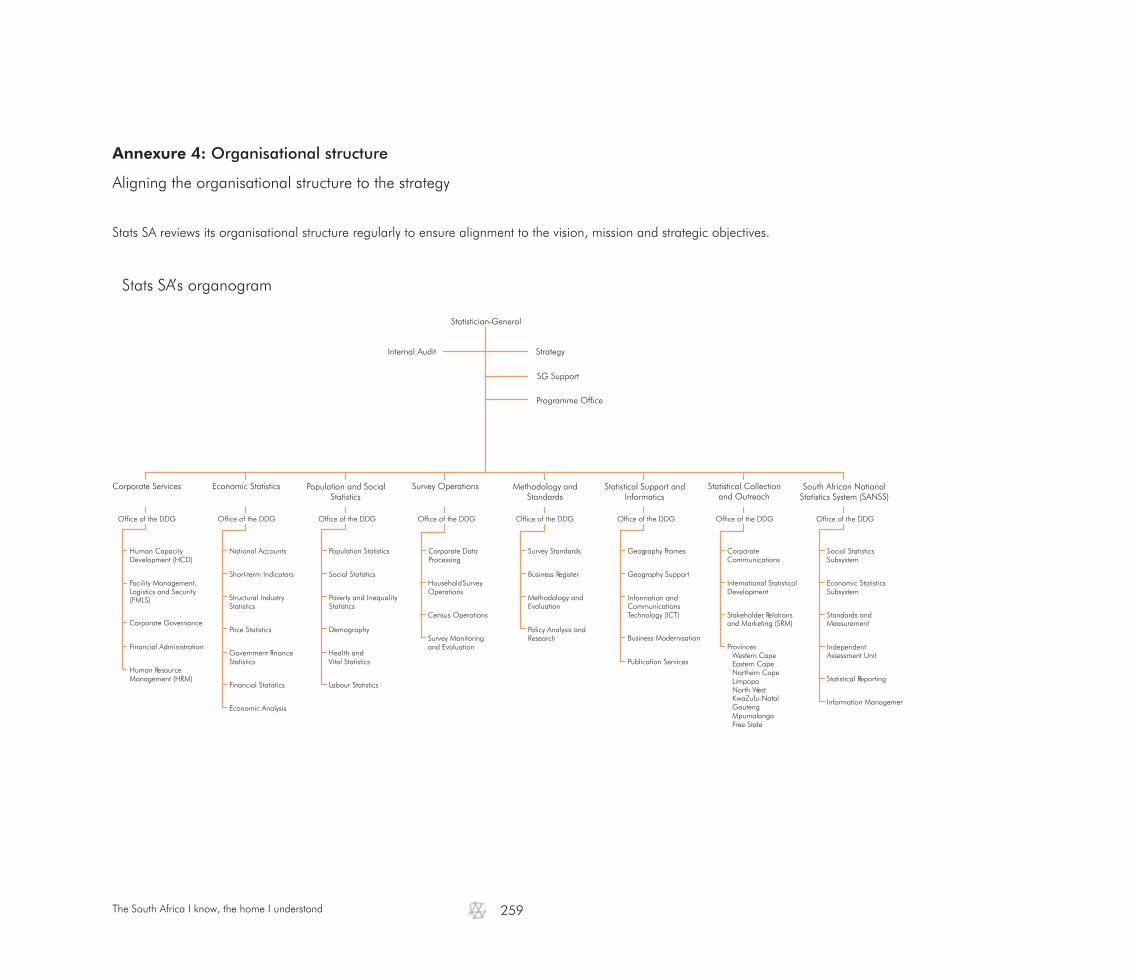
The South Africa I know, the home I understand
259
Annexure 4: Organisational structure
Aligning the organisational structure to the strategy
Stats SA reviews its organisational structure regularly to ensure alignment to the vision, mission and strategic objectives.
Stats SA’s organogram
National Accounts Corporate DataProcessing
Survey Standards Geography Frames CorporateCommunications
Human CapacityDevelopment (HCD)
Short-term Indicators Social StatisticsHouseholdOperations
SurveyBusiness Register Geography Support
Stakeholder Relationsand Marketing (SRM)
Facility Management,Logistics and Security(FMLS) Poverty and Inequality
StatisticsCensus Operations
Methodology andEvaluation
Information andCommunicationsTechnology (ICT)
Corporate GovernancePrice Statistics Demography
Business ModernisationFinancial Administration
Publication ServicesHuman ResourceManagement (HRM)
Financial Statistics
Health andVital Statistics
Labour Statistics
Economic Statistics Population and SocialStatistics
Survey Operations Methodology andStandards
Statistical Support andInformatics
Statistical Collectionand Outreach
Corporate Services
Office of the DDG Office of the DDG Office of the DDG Office of the DDG Office of the DDG Office of the DDG
Government FinanceStatistics
Economic Analysis
Population Statistics
Structural IndustryStatistics
Statistician-General
Strategy
Programme Office
Internal Audit
SG Support
Survey Monitoringand Evaluation
Policy Analysis andResearch
International StatisticalDevelopment
Economic StatisticsSubsystem
Standards andMeasurement
IndependentAssessment Unit
Statistical Reporting
Information Managemen
South African NationalStatistics System (SANSS)
Office of the DDG
Social StatisticsSubsystem
Office of the DDG
ProvincesWestern CapeEastern CapeNorthern CapeLimpopoNorth WestKwaZulu-NatalGautengMpumalangaFree State

The South Africa I know, the home I understand
260
The South Africa I know, the home I understand
261
Annexure 5: Planning, monitoring and reporting
As a national government department, Stats SA has to comply with the Statistics Act (Act No. 6 of 1999), the Public Finance Management Act (Act No. 1 of 1999), and Treasury Regulations for government departments, issued in terms of the PFMA (May 2002) with respect to planning and monitoring.
Planning
Stats SA conducts three annual planning sessions: strategic planning, business planning, and integrative operational planning. The outputs of these planning sessions are as follows: a) Strategic planning: A strategic plan and annual work programme that are approved by the Minister in the Presidency and tabled in
Parliament. b) Business planning: Divisional strategic plans that outline annual outputs and targets to be achieved for the financial year. c) Integrative operational planning: Detailed project and operational plans that outline activities and tasks to be conducted monthly.
Monitoring and reporting
In order for Stats SA to achieve its mandate Stats SA ensures compliance with the relevant legislation, the organisation has put measures in place to monitor and report on its progress and overall performance. a) Annual reporting: An annual report on the overall performance of the organisation in terms of the annual targets outlined in the strategic
plan and/or work programme is compiled and tabled in Parliament. b) Quarterly reporting: Quarterly reports outlining progress made against targets as stated in the work programme are compiled and
submitted to the Minister and Treasury. These reports are supported by evidential documentation. c) Monthly reporting: Monthly reports are compiled as an early warning system and are submitted to the internal executive committee of the
organisation.

The South Africa I know, the home I understand
262
Annexure 6: Strategy map
Stats SA has developed its strategy within the context of the balanced scorecard framework. Below is a graphical presentation of Stats SA's strategy map.
The South Africa I know, the home I understand
263
Annexure 7: Summary of publications
Monthly
Consumer price index (CPI) Contract price adjustment provisions work group Electricity generated and available for distribution Export and import price indices Food and beverages Land transport survey Manufacturing: Production and sales Mbalo Brief Mining: Production and sales Motor trade sales Producer price index (PPI) Retail trade sales Selected building statistics of the private sector as reported by local government institutions Statistics of civil cases for debt Statistics of liquidations and insolvencies Tourism and migration Tourist accommodation Wholesale trade sales
Quarterly
Bulletin of Statistics Gross domestic product (GDP) Manufacturing: Utilisation of production capacity by large enterprises Quarterly employment statistics (QES) Quarterly financial statistics (QFS) Quarterly financial statistics of municipalities Quarterly labour force survey (QLFS)
Annually
Agricultural survey Annual financial statistics (AFS) Building statistics Capital expenditure by the public sector Documented immigrants in South Africa Domestic tourism survey (DTS) Environmental economic accounts, fishery accounts for South Africa Financial census of municipalities Financial statistics of consolidated general government

The South Africa I know, the home I understand
264
Financial statistics of extra-budgetary accounts and funds Financial statistics of higher education institutions Financial statistics of national government Financial statistics of provincial government General household survey (GHS) GHS series V: Energy GHS series volume IV: Food security and agriculture Labour Market Dynamics in South Africa Marriages and divorces Mid-year population estimates Mineral accounts for South Africa Mortality and causes of death in South Africa Non-financial census of municipalities Recorded live births SA Statistics
Periodic (5–10 yearly)
A survey of time use Census 2011 Agricultural households Census 2011 products: Statistical release Compendium of Industrial Statistics Construction industry Construction industry Consumer price index (CPI) weights (All urban) Consumer price index (CPI) weights (Total country) Electricity, gas and water supply Energy accounts for South Africa Income and expenditure of households Men, women and children: Findings of the living conditions survey Post and telecommunications industry Poverty profile of South Africa: Application of the poverty lines on the LCS South Africa's young children: their parents and home environment Subjective poverty in South Africa: Findings of the living conditions survey Transport and storage industry Women and Men in South Africa: Ten years on
The South Africa I know, the home I understand
265
Annexure 8: List of abbreviations and acronyms
AENE Adjustment Estimates of National Expenditure AfDB African Development Bank AFS Annual Financial Statistics AGROST African Group on Statistics Training AGSHA Africa Group on Statistical Harmonisation AME Average monthly earnings ASS African Statistics System ASSD Africa Symposium on Statistical Development AU African Union AUC African Union Commission BAS Basic Accounting System BCM Business Continuity Management BEE Black Economic Empowerment BRICS Brazil, Russia, India, China and South Africa BRR Business Registration Reform BSF Business Sampling Frame CDC Continuous data collection CFO Chief Financial Officer COD Causes of death CPI Consumer price index CPIX Consumer price index (excluding interest rates on mortgage bonds) CPS Continuous Population Survey CRM Client Relationship Management CRVS Civil Registration and Vital Statistics CS Community Survey DBE Department of Basic Education DC Data collection DDG Deputy Director-General DEAT Department of Environmental Affairs and Tourism DHA Department of Home Affairs DHIS District Health Information System DHS Domestic Household Survey DMID Data Management and Information Delivery DMT Data Management and Technology DOC Department of Correctional Services DOH Department of Health DoJCD Department of Justice and Constitutional Development

The South Africa I know, the home I understand
266
DPC Data Processing Centre DPSA Department of Public Service and Administration DPW Department of Public Works DST Department of Science and Technology dti Department of Trade and Industry DTS Domestic Tourism Survey EA Enumeration Area EAP Employee Assistance Programme EAS Economic Activity Survey ECD Early Childhood Development EE Employment Equity EEAs Environmental Economic Accounts EIA Environmental Impact Assessment ENE Estimates of National Expenditure EPWP Expanded Public Works Programme EXCO Executive Committee FMLS Facilities Management, Logistics and Security FOSAD Forum of South African Directors-General GDP Gross domestic product GDPR Gross domestic product (regional) GEAR Growth, employment and redistribution GFS Government Financial Statistics GHS General Household Survey GIS Geographic Information System QLFS Quarterly Labour Force Survey HCD Human Capacity Development HOD Head of Department HR Human Resources HRM Human Resources Management ICBP ISIbalo Capacity Building Programme ICT Information Communication Technology ICP International Comparison Project IDPs Integrated Development Plans IES Income and Expenditure Survey IFWS Integrated Fieldwork Strategy ILO International Labour Organisation IMF International Monetary Fund ISI International Statistical Institute

The South Africa I know, the home I understand
267
ISIC International Standard Industrial Classification of all Economic Activities ISLP International Statistical Literacy Programme ISRDP Integrated Sustainable Rural Development Programme ISS Institute of Security Studies IT Information technology IYM In-Year-Monthly LCS Living Conditions Survey LOGIS Logistical Information System LSS Large Sample Survey M&E Monitoring and Evaluation MDGs Millennium Development Goals MIS Management Information System MoU Memorandum of Understanding MTBPS Medium Term Budget Policy Statement MSSI Management system for statistical information MTEF Medium Term Expenditure Framework MTSF Medium Term Strategic Framework NCC National Coordination Committee NDP National Development Plan NEPAD New Partnership for Africa’s Development NGO Non-governmental organisation NHTS National Household Travel Survey NPA National Prosecuting Authority NSDS National Statistical Development Strategy NSS National Statistics System NSSD National Strategy for Sustainable Development NTS National Transport Survey OECD Organisation for Economic Co-operation and Development OHSA Occupational Health and Safety Act OLA Operating Level Agreement OPSC Office of the Public Service Commission OSS Open Source Software PES Post Enumeration Survey PFMA Public Finance Management Act PMF Project Management Framework PPI Producer price index PPP Public Private Partnership PSR Public Service Regulations

The South Africa I know, the home I understand
268
PSUs Primary Sampling Units QA Quality assurance QES Quarterly Employment Statistics QFS Quarterly Financial Statistics QLFS Quarterly Labour Force Survey R&D Research and development RDP Reconstruction and Development Programme RECs Regional Economic Communities RFQ Request for quotation RMF Risk Management Framework RPHC Round of Population and Housing Censuses RTMS Real Time Management System SA South Africa/n SAC Satellite Application Centre SADC Southern African Development Community SALGA South African Local Government Association SAM Social Accounting Matrix SANSS South African National Statistics System SAPS South African Police Service SAQA South African Qualifications Authority SARS South African Revenue Service SAS Statistical Analysis System SASA South African Statistics Association SASCO Standard Classification of Occupations SASTI South African Statistics Training Institute SASQAF South African Statistical Quality Assessment Framework SAYP Survey of Activities of Young People SBR Statistical Business Register SCM Supply Chain Management SDDS Special Data Dissemination Standards SDGs Sustainable Development Goals SDIP Service Delivery Improvement Plan SEEA System of Environmental and Economic Accounting SESE Survey of Employers and the Self-employed SG Statistician-General SHaSA Strategy for the Harmonisation of Statistics in Africa SIC Standard Industrial Classification SIS Structural Industry Statistics
The South Africa I know, the home I understand
269
SITA State Information Technology Agency SLA Service level agreement SMS Stakeholder Management System SNA System of National Accounts SRM Stakeholder Relationship Management Stats SA Statistics South Africa START Statistics for Transparency, Accountability, Results and Transformation SWTS School to Work Transition Survey TSA Tourism Satellite Account TUS Time Use Survey UAT User Acceptance Testing UNECA United Nations Economic Commission for Africa UNECE United Nations Economic Commission for Europe UNSC United Nations Statistics Commission UNSD United Nations Statistics Division USS User Satisfaction Survey VAS Volunteer Activities Survey VAT Value added tax VCT Voluntary counselling and testing VLAN Virtual local area network VOCS Victims of Crime Survey VPN Virtual private network WHO World Health Organization YASC Young African Statisticians Conference

The South Africa I know, the home I understand
270
Statistics Act


ISBN: 978-0-621-43497-2
RP117/2015